selected social characteristics (dp02) - seattle
TRANSCRIPT

Selected Social Characteristics (DP02)2006-2010 American Community Survey 5-Year Estimates (Not decennial census counts. See notes after table.)
Council District # 1
Subject EstimateEstimate
Margin of Error ¹ PercentPercent
Margin of Error ¹ Reliability ²
High
High
High
High
High
High
Moderate
Moderate
Moderate
Moderate
Moderate
High
High
High
High
High
High
High
High
High
High
High
High
High
High
High
High
High
Moderate
High
High
High
High
High
Moderate
Low
Low
NC
Low
Low
+/- 460
+/- 245
13.3%
+/- 525
+/- 624
+/- 457
+/- 603
+/- 386
+/- 253
+/- 151
+/- 387
+/- 313
+/- 704
+/- 655
+/- 331
+/- 485
+/- 362
+/- 0.04
+/- 0.05
+/- 1,630
+/- 525
+/- 605
+/- 749
+/- 403
+/- 603
+/- 929
+/- 1,022
+/- 893
+/- 184
+/- 976
+/- 794
+/- 638
+/- 146
+/-123
+/- 406
+/- 288
+/- 196
+/- 184
+/- 453
+/- 286
51.9%
23.2%
39.9%
16.9%
3.3%
1.4%
8.7%
4.9%
48.1%
35.0%
8.4%
25.4%
18.2%
100.0%
45.4%
4.6%
9.8%
4.3%
18.1%
22.0%
100.0%
38.1%
1.6%
100.0%
33.0%
44.2%
7.7%
1.7%
X
X
X
100.0%
+/- 669
X
47.5%
+/- 158 1.8%
+/- 442 11.0%
High
High
38,344
19,916
8,893
15,307
6,473
1,264
542
3,345
1,878
18,428
13,438
3,235
9,727
6,964
2.20
2.90
84,436
38,344
3,884
8,311
3,648
15,322
18,575
35,275
13,446
4,989
1,209
549
37,381
12,349
16,538
310
0
2,871
24
634
51
73
41
16,747
651
3,882
X
X
X
100.0%
25.6%
X
X
X
X
X
X
X
X
X
X
X
X
Total Households:
Family Households (families)
With Own Children under 18 years
Married Couple Family
With Own Children under 18 years
Male householder, no wife present
With Own Children under 18 years
Female householder, no husband present
With Own Children under 18 years
Nonfamily Households
Householder Living Alone
65 years and over
Households with one or more people under 18 years
Households with one or more people 65 years and over
Average Household Size:
Average Family Size:
Population in Households:
Number of women 15 to 50 years old who had a birth in the past 12 months:
Unmarried women (widowed, divorced, and never married)
Per 1,000 unmarried women
Per 1,000 women 15 to 50 years old
Per 1,000 women 15 to 19 years old
Per 1,000 women 20 to 34 years old
Per 1,000 women 35 to 50 years old
Males 15 and over:
Never married
Now married, except separated
Separated
Widowed
Divorced
Females 15 and over:
Never married
Now married, except separated
Separated
Widowed
Divorced
Householder
Spouse
Child
Other Relatives
Nonrelatives
Unmarried Partner
MARITAL STATUS
HOUSEHOLDS BY TYPE
RELATIONSHIP
FERTILITY
+/-1.5
+/-1.1
+/-1.5
+/-1
+/-0.7
+/-0.4
+/-1
+/-0.8
+/-1.7
+/-1.6
+/-0.9
+/-1.2
+/-0.9
W
+/-0.6
+/-1
+/-0.7
+/-0.9
+/-0.5
+/-2.3
+/-1.3
+/-0.5
+/-0.4
+/-1.2
+/-1.9
+/-1.3
+/-0.5
+/-1.1
+/-1.2
+/-10.9
7/10/2014
Page 1 of 5DP02 Selected Social Characteristics, 2006-2010 American Community Survey
1Geographic Area:
Council District # 1
Subject EstimateEstimate
Margin of Error ¹ PercentPercent
Margin of Error ¹ Reliability ²
Moderate
Moderate
Low
Low
Low
Moderate
Moderate
Moderate
+/- 241
+/- 125
+/- 37
+/- 49
+/- 62
+/- 90
+/- 91
+/- 90
100.0%
28.6%
4.0%
4.7%
6.0%
14.0%
63.7%
51.9%
1,030
295
41
48
62
144
188
153
Moderate+/- 125 100.0%295
High
High
Moderate
High
High
High
100.0%
8.7%
4.5%
34.6%
21.7%
30.4%
16,667
1,450
758
5,773
3,625
5,061
+/- 893
+/- 250
+/- 183
+/- 470
+/- 498
+/- 538
X
X
X
High
High
High
Moderate
High
High
High
High
High
High
High
High
100.0%
3.4%
4.6%
21.5%
8.2%
30.5%
15.6%
8.7%
X
16.2%
X100.0%
64,630
2,209
2,970
13,897
5,275
19,709
10,090
92%
46.1%
6,074
10,480
69,639
+/- 1,257
+/- 445
+/- 470
+/- 815
+/- 793
+/- 501
+/- 908
+/- 688
+/- 1.1
+/- 1.6
+/- 1,348
+/- 531
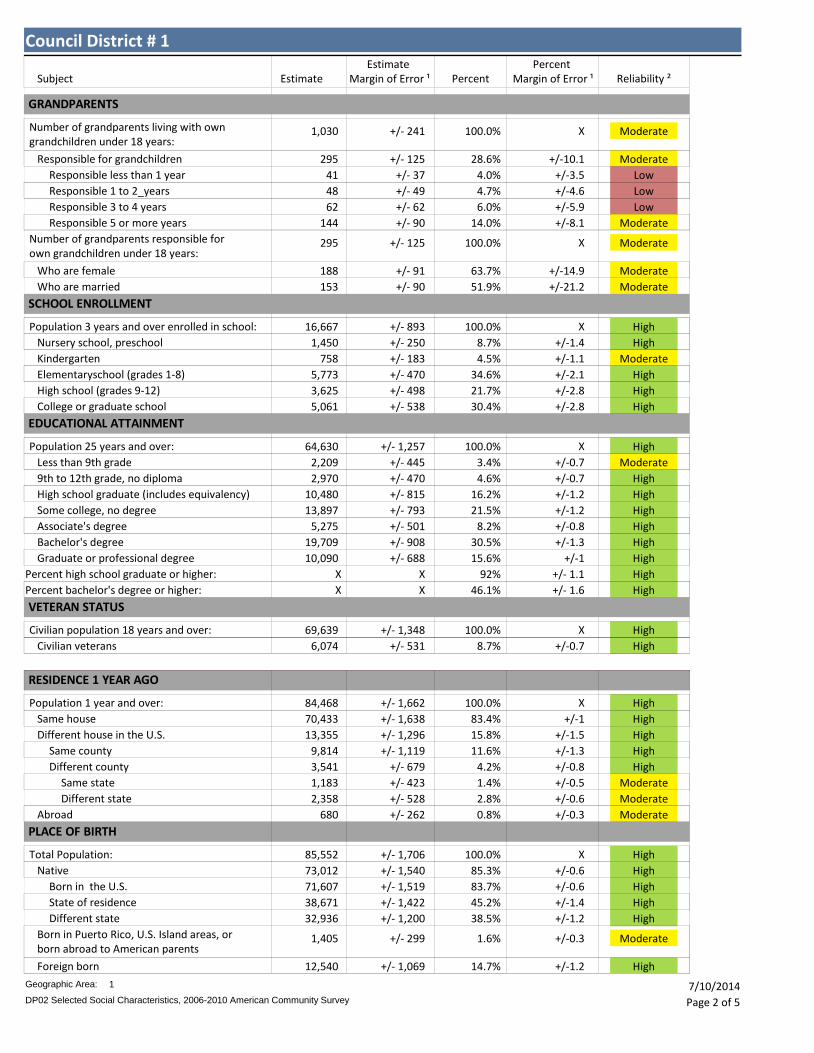
Civilian population 18 years and over:
Civilian veterans
Population 25 years and over:
Less than 9th grade
9th to 12th grade, no diploma
High school graduate (includes equivalency)
Some college, no degree
Associate's degree
Bachelor's degree
Graduate or professional degree
Percent high school graduate or higher:
Percent bachelor's degree or higher:
Population 3 years and over enrolled in school:
Nursery school, preschool
Kindergarten
Elementaryschool (grades 1-8)
High school (grades 9-12)
College or graduate school
Number of grandparents living with own grandchildren under 18 years:
Responsible for grandchildren
Responsible less than 1 year
Responsible 1 to 2_years
Responsible 3 to 4 years
Responsible 5 or more years
Who are female
Who are married
Number of grandparents responsible for own grandchildren under 18 years:
GRANDPARENTS
SCHOOL ENROLLMENT
EDUCATIONAL ATTAINMENT
VETERAN STATUS
X
X
X
X
+/-10.1
+/-3.5
+/-4.6
+/-5.9
+/-8.1
+/-14.9
+/-21.2
+/-1.4
+/-1.1
+/-2.1
+/-2.8
+/-2.8
+/-0.7
+/-0.7
+/-1.2
+/-1.2
+/-0.8
+/-1.3
+/-1
+/-0.7
High
High
High
High
High
Moderate
Moderate
Moderate
High
High
High
High
Moderate
High
+/- 1,662
+/- 1,638
+/- 1,296
+/- 1,119
+/- 679
+/- 423
+/- 528
+/- 262
+/- 1,540
+/- 1,519
+/- 1,422
+/- 1,200
+/- 299
+/- 1,069
83.4%
15.8%
11.6%
4.2%
1.4%
2.8%
0.8%
85.3%
83.7%
45.2%
38.5%
1.6%
14.7%
X100.0%
RESIDENCE 1 YEAR AGO
PLACE OF BIRTH
84,468
70,433
13,355
9,814
3,541
1,183
2,358
680
73,012
71,607
38,671
32,936
1,405
12,540
High+/- 1,706 100.0%85,552 X
Population 1 year and over:
Same house
Different house in the U.S.
Same county
Different county
Same state
Different state
Abroad
Native
Born in the U.S.
State of residence
Different state
Born in Puerto Rico, U.S. Island areas, or born abroad to American parents
Foreign born
Total Population:
+/-1
+/-1.5
+/-1.3
+/-0.8
+/-0.5
+/-0.6
+/-0.3
+/-0.6
+/-0.6
+/-1.4
+/-1.2
+/-0.3
+/-1.2
7/10/2014
Page 2 of 5DP02 Selected Social Characteristics, 2006-2010 American Community Survey
1Geographic Area:

Council District # 1
Subject EstimateEstimate
Margin of Error ¹ PercentPercent
Margin of Error ¹ Reliability ²
Moderate
Moderate
High
High
High
High
Moderate
High
High
High
High
High
High
High
High
Moderate
Moderate
Moderate
High
High
High
High
Moderate
Moderate
Moderate
Moderate
High
High
High
Moderate
Moderate
High
High
Low
Moderate
Moderate
Moderate
+/- 876
+/- 944
8.9%
+/- 1,069
+/- 1,069
+/- 622
+/- 839
+/- 1,112
+/- 265
+/- 1,069
+/- 689
+/- 299
+/- 132
+/- 741
+/- 1,069
+/- 496
+/- 715
+/- 186
+/- 1,591
+/- 653
+/- 682
+/- 1,321
+/- 590
+/- 1,484
+/- 292
+/- 417
+/- 390
+/- 298
+/- 1,706
+/- 840
+/- 53
+/- 386
+/- 254
+/- 324
+/- 839
14.7%
48.0%
100.0%
81.6%
100.0%
32.3%
100.0%
18.4%
67.7%
100.0%
40.2%
25.9%
5.4%
100.0%
19.7%
80.3%
0.6%
100.0%
5.8%
0.1%
1.0%
1.3%
1.8%
12.6%
+/- 406
X
17.7%
+/- 409 8.8%
+/- 116 2.0%
U.S. CITIZENSHIP STATUS
YEAR OF ENTRY
High
High
12,540
12,540
6,520
6,020
13,945
1,146
12,540
4,051
1,405
259
8,489
12,540
7,110
5,591
5,045
3,249
683
80,103
3,105
6,084
15,746
3,096
64,357
828
2,660
975
517
85,552
4,949
76
816
1,081
2,216
1,101
246
1,527
10,794
WORLD REGION OF BIRTH OF FOREIGN BORN
LANGUAGE SPOKEN AT HOME
High
Moderate
Moderate
High
3.6%
0.9%
16.9%
0.6%
0.6%
12.5%
3,095
794
14,434
531
542
10,699
+/- 423
+/- 267
+/- 924
+/- 208
+/- 191
+/- 821
X
7.0%
3.9%
X
X
X
High
High
Moderate
High
Moderate
Moderate
3.8%
0.4%
5.6%
0.3%
1.6%
2.2%
3,238
341
4,796
241
1,362
1,853
+/- 421
+/- 146
+/- 591
+/- 311
+/- 124
+/- 330
ANCESTRY
Foreign born
Foreign-born population:
Naturalized U.S. citizen
Not a U.S. citizen
Population born outside the U.S.:
Native:
Entered 2000 or later
Entered before 2000
Foreign born population:
Entered 2000 or later
Entered before 2000
Foreign-born, excluding born at sea:
Europe
Asia
Africa
Oceania
Latin America
Northern America
Population 5 years and over:
English only
Language other than English
Speak English less than "very well"
Spanish
Other Indo-European lanugages
Asian and Pacific Islander languages
Other languages
Speak English less than "very well"
Speak English less than "very well"
Speak English less than "very well"
Speak English less than "very well"
Total Population:
American
Arab
Czech
Danish
Dutch
English
French (except Basque)
French Canadian
German
Greek
Hungarian
Irish
Italian
Lithuanian
Norwegian
Polish
Portuguese
Russian
100.0%
52.0%
3.9%
1.0%
7.6%
3.3%
1.2%
X
+/-1.2
+/-8.5
+/-7.4
+/-4.8
+/-2.9
+/-2
+/-3.2
+/-0.9
+/-1.4
+/-5.3
+/-0.9
+/-1.6
+/-1.1
+/-0.8
+/-1
+/-0.1
+/-0.5
+/-0.3
+/-0.4
+/-0.9
+/-0.3
+/-1
+/-0.2
+/-0.2
+/-0.9
+/-0.2
+/-0.7
+/-0.4
+/-0.1
+/-0.4
+/-2.2
+/-5.3
+/-1.3
+/-1.2
+/-0.7
+/-0.4
+/-0.8
+/-0.5
+/-0.5
+/-0.4
+/-0.5
+/-0.5
X
7/10/2014
Page 3 of 5DP02 Selected Social Characteristics, 2006-2010 American Community Survey
1Geographic Area:

Council District # 1
Subject EstimateEstimate
Margin of Error ¹ PercentPercent
Margin of Error ¹ Reliability ²
High
Moderate
High
High
Moderate
Moderate
Moderate
1.6%
2.7%
3.4%
0.6%
3.5%
1,362
2,311
2,883
540
2,963
+/- 330
+/- 383
+/- 419
+/- 408
+/- 194
88
1,409
Moderate
Moderate
Low
0.3%
1.1%
0.2%
262
944
160
+/- 122
+/- 230
+/- 133
Russian
Scotch Irish
Scottish
Slovak
Subsaharan African
Swedish
Swiss
Ukrainian
Welsh
West Indian (except Hispanic origin groups)
0.1%
1.6%
+/- 56
+/- 497
+/-0.1
+/-0.6
+/-0.4
+/-0.4
+/-0.5
+/-0.2
+/-0.5
+/-0.1
+/-0.3
+/-0.2
7/10/2014
Page 4 of 5DP02 Selected Social Characteristics, 2006-2010 American Community Survey
1Geographic Area:

U.S. Census Bureau, 2006-2010 American Community Survey (ACS), 5-Year estimates
City of Seattle, Department of Planning and Development (DPD)On the Web at: http://www.seattle.gov/dpd/Research/Population_Demographics/Overview/
Supporting documentation on code lists, subject definitions, data accuracy, and statistical testing can be found on the American Community Survey website in the Data and Documentation section.
Sample size and data quality measures (including coverage rates, allocation rates, and response rates) can be found on the American Community Survey website in the Methodology section.
Although the American Community Survey (ACS) produces population, demographic and housing unit estimates, for 2010, the 2010 Census provides the official counts of the population and housing units for the nation, states, counties, cities and towns. For 2006 to 2009, the Population Estimates Program provides intercensal estimates of the population for the nation, states, and counties.
Data are based on a sample and are subject to sampling variability. The degree of uncertainty for an estimate arising from sampling variability is represented through the use of a margin of error. The value shown here is the 90 percent margin of error. The margin of error can be interpreted roughly as providing a 90 percent probability that the interval defined by the estimate minus the margin of error and the estimate plus the margin of error (the lower and upper confidence bounds) contains the true value. In addition to sampling variability, the ACS estimates are subject to nonsampling error (for a discussion of nonsampling variability, see Accuracy of the Data). The effect of nonsampling error is not represented in these tables.
While the 2006-2010 American Community Survey (ACS) data generally reflect the December 2009 Office of Management and Budget (OMB) definitions of metropolitan and micropolitan statistical areas; in certain instances the names, codes, and boundaries of the principal cities shown in ACS tables may differ from the OMB definitions due to differences in the effective dates of the geographic entities.
Estimates of urban and rural population, housing units, and characteristics reflect boundaries of urban areas defined based on Census 2000 data. Boundaries for urban areas have not been updated since Census 2000. As a result, data for urban and rural areas from the ACS do not necessarily reflect the results of ongoing urbanization.
Explanation of Symbols:1. An '**' entry in the margin of error column indicates that either no sample observations or too few sample observations were available to compute a standard error and thus the margin of error. A statistical test is not appropriate.2. An '-' entry in the estimate column indicates that either no sample observations or too few sample observations were available to compute an estimate, or a ratio of medians cannot be calculated because one or both of the median estimates falls in the lowest interval or upper interval of an open-ended distribution.3. An '-' following a median estimate means the median falls in the lowest interval of an open-ended distribution.4. An '+' following a median estimate means the median falls in the upper interval of an open-ended distribution.5. An '***' entry in the margin of error column indicates that the median falls in the lowest interval or upper interval of an open-ended distribution. A statistical test is not appropriate.6. An '*****' entry in the margin of error column indicates that the estimate is controlled. A statistical test for sampling variability is not appropriate.7. An 'N' entry in the estimate and margin of error columns indicates that data for this geographic area cannot be displayed because the number of sample cases is too small.8. An '(X)' means that the estimate is not applicable or not available."
This is one of four reports that have been adapted from the ACS "Data Profile" (DP) Series. The four DP tables published by the Census Bureau are: DP02 Selected Social Characteristics; DP03 Selected Economic Characteristics; DP04 Selected Housing Characteristics; DP05 Demographic and Housing Estimates.
DPD has adapted these DP tables for reporting ACS estimates for locally-defined geographies. The locally defined areas covered in these reports are made up of multiple census tracts (except for a few Community Reporting Areas that are made up of only one Census Tract each), therefore estimates shown for these geographies are based on aggregating estimates for multiple census tracts. For ease of calculation, medians are the average of the medians.
¹The ACS is a sample survey and as such, estimates carry sampling error. Margins of error (MOEs) provide a measure of sampling error
The MOEs displayed for the aggregated estimates in these reports could only be approximated using the formulas provided by the Census Bureau. These formulas do not account for “covariance” (or inter-relationship) between the aggregated estimates, and can understate or—more commonly—overstate the margins of error. In some cases, actual MOEs may be much different than approximated. MOEs of +/- 0.1 and below are displayed as +/- 0.1 based on Census Bureau convention.
² The reliability indicator of High, Moderate, or Low is meant to provide a general sense of an estimate's reliability. Data users will need to use discretion in identifying the level of reliability appropriate for their purposes.
“High” reliability: MOE is less than or equal to 20% of the estimate. Indicates that sampling error is small relative to the size of the estimate. Flagged green."Moderate” reliability: MOE is between 20% and 66.7% of the estimate. Flagged yellow to indicate that the estimate should be used with caution."Low” reliability: MOE is over 66.7% of the estimate. Flagged red to warn that sampling error is large relative to the estimate and that the estimate is very unreliable."NC": Estimate is 0. Reliability cannot be calculated.
Percent Margin of Error "W" value indicates the standard formula for estimating the percent MOE could not be applied (due to negative value under square root).
For more about MOEs, see Census Bureau notes below. For formulas, see “American Community Survey Multiyear Accuracy of the Data (3-year 2008-2010 and 5-year 2006-2010),” http://www.census.gov/acs/www/Downloads/data_documentation/Accuracy/MultiyearACSAccuracyofData2010.pdf.)
Census Bureau notes for DP02:
Notes:
Source:
Produced by:

Selected Social Characteristics (DP02)2006-2010 American Community Survey 5-Year Estimates (Not decennial census counts. See notes after table.)
Council District # 2
Subject EstimateEstimate
Margin of Error ¹ PercentPercent
Margin of Error ¹ Reliability ²
High
High
High
High
High
High
Moderate
Moderate
Moderate
High
Moderate
High
High
High
High
High
High
High
High
High
High
High
High
High
High
High
High
High
Moderate
High
High
High
High
High
Moderate
Low
Low
Low
Low
Low
+/- 488
+/- 299
12.5%
+/- 497
+/- 657
+/- 527
+/- 626
+/- 441
+/- 351
+/- 215
+/- 509
+/- 390
+/- 609
+/- 571
+/- 323
+/- 549
+/- 454
+/- 0.06
+/- 0.07
+/- 2,091
+/- 497
+/- 1,062
+/- 653
+/- 299
+/- 629
+/- 1,287
+/- 1,204
+/- 994
+/- 208
+/- 1,139
+/- 795
+/- 701
+/- 175
+/- 1,773
+/- 486
+/- 402
+/- 238
+/- 299
+/- 583
+/- 585
62.4%
27.8%
40.4%
18.2%
6.7%
2.1%
15.3%
7.5%
37.6%
28.9%
10.1%
31.3%
26.6%
100.0%
37.8%
11.7%
6.4%
2.3%
15.4%
28.7%
100.0%
40.1%
1.9%
100.0%
29.9%
44.1%
11.0%
2.5%
X
X
X
100.0%
+/- 718
X
44.6%
+/- 227 2.7%
+/- 461 10.6%
High
High
30,797
19,215
8,576
12,448
5,609
2,059
656
4,708
2,311
11,582
8,905
3,098
9,649
8,191
2.65
3.37
81,494
30,797
9,545
5,235
1,856
12,541
23,376
34,038
13,642
4,249
1,378
651
33,864
10,137
14,935
396
22
3,710
37
833
69
127
30
15,192
928
3,625
X
X
X
100.0%
28.7%
X
X
X
X
X
X
X
X
X
X
X
X
Total Households:
Family Households (families)
With Own Children under 18 years
Married Couple Family
With Own Children under 18 years
Male householder, no wife present
With Own Children under 18 years
Female householder, no husband present
With Own Children under 18 years
Nonfamily Households
Householder Living Alone
65 years and over
Households with one or more people under 18 years
Households with one or more people 65 years and over
Average Household Size:
Average Family Size:
Population in Households:
Number of women 15 to 50 years old who had a birth in the past 12 months:
Unmarried women (widowed, divorced, and never married)
Per 1,000 unmarried women
Per 1,000 women 15 to 50 years old
Per 1,000 women 15 to 19 years old
Per 1,000 women 20 to 34 years old
Per 1,000 women 35 to 50 years old
Males 15 and over:
Never married
Now married, except separated
Separated
Widowed
Divorced
Females 15 and over:
Never married
Now married, except separated
Separated
Widowed
Divorced
Householder
Spouse
Child
Other Relatives
Nonrelatives
Unmarried Partner
MARITAL STATUS
HOUSEHOLDS BY TYPE
RELATIONSHIP
FERTILITY
+/-1.9
+/-1.7
+/-1.9
+/-1.4
+/-1.1
+/-0.7
+/-1.6
+/-1.3
+/-1.9
+/-1.8
+/-1
+/-1.7
+/-1.4
W
+/-0.7
+/-1.4
+/-1.3
+/-0.8
+/-0.4
+/-2.6
+/-1.4
+/-0.6
+/-0.7
+/-1.3
+/-2.1
+/-1.4
+/-0.7
+/-1.4
+/-1.4
+/-11.1
7/10/2014
Page 1 of 5DP02 Selected Social Characteristics, 2006-2010 American Community Survey
2Geographic Area:

Council District # 2
Subject EstimateEstimate
Margin of Error ¹ PercentPercent
Margin of Error ¹ Reliability ²
High
Moderate
Low
Low
Low
Moderate
Moderate
Moderate
+/- 420
+/- 240
+/- 136
+/- 102
+/- 39
+/- 188
+/- 161
+/- 216
100.0%
31.2%
8.8%
6.4%
1.7%
14.3%
70.0%
66.8%
2,310
720
203
147
39
331
504
481
Moderate+/- 240 100.0%720
High
Moderate
Moderate
High
High
High
100.0%
6.3%
5.6%
38.9%
23.3%
25.9%
19,791
1,252
1,114
7,695
4,604
5,126
+/- 1,212
+/- 252
+/- 257
+/- 789
+/- 552
+/- 544
X
X
X
High
High
High
High
High
High
High
High
High
High
High
High
100.0%
13.2%
8.1%
18.9%
6.4%
21.5%
10.8%
7.5%
X
21.1%
X100.0%
57,613
7,627
4,681
10,901
3,691
12,371
6,201
78.6%
32.2%
4,849
12,141
64,723
+/- 1,491
+/- 769
+/- 595
+/- 898
+/- 758
+/- 456
+/- 846
+/- 562
+/- 1.6
+/- 1.6
+/- 1,672
+/- 460
Civilian population 18 years and over:
Civilian veterans
Population 25 years and over:
Less than 9th grade
9th to 12th grade, no diploma
High school graduate (includes equivalency)
Some college, no degree
Associate's degree
Bachelor's degree
Graduate or professional degree
Percent high school graduate or higher:
Percent bachelor's degree or higher:
Population 3 years and over enrolled in school:
Nursery school, preschool
Kindergarten
Elementaryschool (grades 1-8)
High school (grades 9-12)
College or graduate school
Number of grandparents living with own grandchildren under 18 years:
Responsible for grandchildren
Responsible less than 1 year
Responsible 1 to 2_years
Responsible 3 to 4 years
Responsible 5 or more years
Who are female
Who are married
Number of grandparents responsible for own grandchildren under 18 years:
GRANDPARENTS
SCHOOL ENROLLMENT
EDUCATIONAL ATTAINMENT
VETERAN STATUS
X
X
X
X
+/-8.7
+/-5.7
+/-4.3
+/-1.7
+/-7.7
W
+/-20.1
+/-1.2
+/-1.3
+/-3.2
+/-2.4
+/-2.2
+/-1.3
+/-1
+/-1.5
+/-1.2
+/-0.8
+/-1.4
+/-0.9
+/-0.7
High
High
High
High
Moderate
Moderate
Moderate
Moderate
High
High
High
High
Moderate
High
+/- 2,210
+/- 2,196
+/- 1,367
+/- 1,311
+/- 436
+/- 230
+/- 369
+/- 551
+/- 1,812
+/- 1,756
+/- 1,454
+/- 1,166
+/- 413
+/- 1,781
83.8%
14.3%
11.8%
2.6%
0.7%
1.8%
1.9%
62.6%
60.4%
34.9%
25.5%
2.2%
37.4%
X100.0%
RESIDENCE 1 YEAR AGO
PLACE OF BIRTH
82,210
68,890
11,776
9,665
2,111
615
1,496
1,544
52,194
50,364
29,134
21,230
1,830
31,175
High+/- 2,243 100.0%83,369 X
Population 1 year and over:
Same house
Different house in the U.S.
Same county
Different county
Same state
Different state
Abroad
Native
Born in the U.S.
State of residence
Different state
Born in Puerto Rico, U.S. Island areas, or born abroad to American parents
Foreign born
Total Population:
+/-1.4
+/-1.6
+/-1.6
+/-0.5
+/-0.3
+/-0.4
+/-0.7
+/-1.4
+/-1.3
+/-1.5
+/-1.2
+/-0.5
+/-1.9
7/10/2014
Page 2 of 5DP02 Selected Social Characteristics, 2006-2010 American Community Survey
2Geographic Area:

Council District # 2
Subject EstimateEstimate
Margin of Error ¹ PercentPercent
Margin of Error ¹ Reliability ²
Moderate
Moderate
Moderate
High
High
Moderate
Moderate
Moderate
High
High
Moderate
High
High
High
High
Moderate
Moderate
Moderate
High
High
High
High
High
Moderate
Moderate
Moderate
High
High
High
High
High
High
Moderate
Low
Moderate
Moderate
Moderate
+/- 1,701
+/- 1,038
31.0%
+/- 1,781
+/- 1,781
+/- 1,221
+/- 1,417
+/- 1,797
+/- 321
+/- 1,781
+/- 1,305
+/- 413
+/- 262
+/- 1,250
+/- 1,781
+/- 1,404
+/- 830
+/- 100
+/- 2,108
+/- 804
+/- 1,659
+/- 2,115
+/- 359
+/- 1,678
+/- 248
+/- 1,340
+/- 1,045
+/- 787
+/- 2,243
+/- 505
+/- 152
+/- 82
+/- 95
+/- 155
+/- 502
37.4%
40.7%
100.0%
72.2%
100.0%
31.2%
100.0%
27.8%
68.8%
100.0%
68.1%
10.4%
0.8%
100.0%
48.6%
51.4%
5.4%
100.0%
2.1%
0.2%
0.2%
0.2%
0.6%
4.6%
+/- 256
X
2.5%
+/- 948 16.3%
+/- 282 1.8%
U.S. CITIZENSHIP STATUS
YEAR OF ENTRY
High
High
31,175
31,175
18,500
12,675
33,005
1,322
31,175
9,729
1,830
508
21,446
31,175
24,096
4,568
21,236
3,240
252
77,699
2,613
25,765
37,780
1,352
39,919
564
16,749
6,095
4,170
83,369
1,763
193
139
177
792
5,094
561
466
3,875
WORLD REGION OF BIRTH OF FOREIGN BORN
LANGUAGE SPOKEN AT HOME
High
Moderate
Moderate
High
1.0%
0.2%
6.0%
0.2%
0.3%
5.4%
869
185
5,026
202
238
4,483
+/- 188
+/- 92
+/- 565
+/- 122
+/- 116
+/- 512
X
5.9%
3.4%
X
X
X
Moderate
Moderate
Moderate
Moderate
Low
Moderate
2.2%
0.2%
1.5%
0.1%
0.8%
0.8%
1,868
201
1,214
46
669
703
+/- 449
+/- 127
+/- 302
+/- 237
+/- 45
+/- 226
ANCESTRY
Foreign born
Foreign-born population:
Naturalized U.S. citizen
Not a U.S. citizen
Population born outside the U.S.:
Native:
Entered 2000 or later
Entered before 2000
Foreign born population:
Entered 2000 or later
Entered before 2000
Foreign-born, excluding born at sea:
Europe
Asia
Africa
Oceania
Latin America
Northern America
Population 5 years and over:
English only
Language other than English
Speak English less than "very well"
Spanish
Other Indo-European lanugages
Asian and Pacific Islander languages
Other languages
Speak English less than "very well"
Speak English less than "very well"
Speak English less than "very well"
Speak English less than "very well"
Total Population:
American
Arab
Czech
Danish
Dutch
English
French (except Basque)
French Canadian
German
Greek
Hungarian
Irish
Italian
Lithuanian
Norwegian
Polish
Portuguese
Russian
100.0%
59.3%
1.7%
0.7%
33.2%
21.6%
7.8%
X
+/-1.9
+/-12.9
+/-6.5
+/-3.8
+/-0.8
+/-2.3
+/-2.9
+/-0.9
+/-0.3
+/-2.6
+/-1.6
+/-2.4
+/-2
+/-1
+/-0.6
+/-0.2
+/-0.1
+/-0.1
+/-0.2
+/-0.6
+/-0.1
+/-0.7
+/-0.1
+/-0.1
+/-0.6
+/-0.2
+/-0.4
+/-0.3
+/-0.1
+/-0.3
+/-2
+/-3.9
+/-0.8
+/-1.3
+/-0.5
+/-0.3
+/-1.9
+/-1.6
+/-1.3
+/-1
+/-0.2
+/-0.5
X
7/10/2014
Page 3 of 5DP02 Selected Social Characteristics, 2006-2010 American Community Survey
2Geographic Area:

Council District # 2
Subject EstimateEstimate
Margin of Error ¹ PercentPercent
Margin of Error ¹ Reliability ²
Moderate
Moderate
Moderate
Moderate
Low
High
Moderate
0.8%
0.8%
1.1%
0.2%
1.4%
669
703
915
150
1,187
+/- 226
+/- 207
+/- 211
+/- 248
+/- 93
34
6,211
Moderate
Moderate
Moderate
0.2%
0.7%
0.6%
154
575
472
+/- 101
+/- 203
+/- 265
Russian
Scotch Irish
Scottish
Slovak
Subsaharan African
Swedish
Swiss
Ukrainian
Welsh
West Indian (except Hispanic origin groups)
0.0%
7.5%
+/- 46
+/- 1,220
+/-0.1
+/-1.4
+/-0.3
+/-0.2
+/-0.3
+/-0.1
+/-0.3
+/-0.1
+/-0.2
+/-0.3
7/10/2014
Page 4 of 5DP02 Selected Social Characteristics, 2006-2010 American Community Survey
2Geographic Area:

U.S. Census Bureau, 2006-2010 American Community Survey (ACS), 5-Year estimates
City of Seattle, Department of Planning and Development (DPD)On the Web at: http://www.seattle.gov/dpd/Research/Population_Demographics/Overview/
Supporting documentation on code lists, subject definitions, data accuracy, and statistical testing can be found on the American Community Survey website in the Data and Documentation section.
Sample size and data quality measures (including coverage rates, allocation rates, and response rates) can be found on the American Community Survey website in the Methodology section.
Although the American Community Survey (ACS) produces population, demographic and housing unit estimates, for 2010, the 2010 Census provides the official counts of the population and housing units for the nation, states, counties, cities and towns. For 2006 to 2009, the Population Estimates Program provides intercensal estimates of the population for the nation, states, and counties.
Data are based on a sample and are subject to sampling variability. The degree of uncertainty for an estimate arising from sampling variability is represented through the use of a margin of error. The value shown here is the 90 percent margin of error. The margin of error can be interpreted roughly as providing a 90 percent probability that the interval defined by the estimate minus the margin of error and the estimate plus the margin of error (the lower and upper confidence bounds) contains the true value. In addition to sampling variability, the ACS estimates are subject to nonsampling error (for a discussion of nonsampling variability, see Accuracy of the Data). The effect of nonsampling error is not represented in these tables.
While the 2006-2010 American Community Survey (ACS) data generally reflect the December 2009 Office of Management and Budget (OMB) definitions of metropolitan and micropolitan statistical areas; in certain instances the names, codes, and boundaries of the principal cities shown in ACS tables may differ from the OMB definitions due to differences in the effective dates of the geographic entities.
Estimates of urban and rural population, housing units, and characteristics reflect boundaries of urban areas defined based on Census 2000 data. Boundaries for urban areas have not been updated since Census 2000. As a result, data for urban and rural areas from the ACS do not necessarily reflect the results of ongoing urbanization.
Explanation of Symbols:1. An '**' entry in the margin of error column indicates that either no sample observations or too few sample observations were available to compute a standard error and thus the margin of error. A statistical test is not appropriate.2. An '-' entry in the estimate column indicates that either no sample observations or too few sample observations were available to compute an estimate, or a ratio of medians cannot be calculated because one or both of the median estimates falls in the lowest interval or upper interval of an open-ended distribution.3. An '-' following a median estimate means the median falls in the lowest interval of an open-ended distribution.4. An '+' following a median estimate means the median falls in the upper interval of an open-ended distribution.5. An '***' entry in the margin of error column indicates that the median falls in the lowest interval or upper interval of an open-ended distribution. A statistical test is not appropriate.6. An '*****' entry in the margin of error column indicates that the estimate is controlled. A statistical test for sampling variability is not appropriate.7. An 'N' entry in the estimate and margin of error columns indicates that data for this geographic area cannot be displayed because the number of sample cases is too small.8. An '(X)' means that the estimate is not applicable or not available."
This is one of four reports that have been adapted from the ACS "Data Profile" (DP) Series. The four DP tables published by the Census Bureau are: DP02 Selected Social Characteristics; DP03 Selected Economic Characteristics; DP04 Selected Housing Characteristics; DP05 Demographic and Housing Estimates.
DPD has adapted these DP tables for reporting ACS estimates for locally-defined geographies. The locally defined areas covered in these reports are made up of multiple census tracts (except for a few Community Reporting Areas that are made up of only one Census Tract each), therefore estimates shown for these geographies are based on aggregating estimates for multiple census tracts. For ease of calculation, medians are the average of the medians.
¹The ACS is a sample survey and as such, estimates carry sampling error. Margins of error (MOEs) provide a measure of sampling error
The MOEs displayed for the aggregated estimates in these reports could only be approximated using the formulas provided by the Census Bureau. These formulas do not account for “covariance” (or inter-relationship) between the aggregated estimates, and can understate or—more commonly—overstate the margins of error. In some cases, actual MOEs may be much different than approximated. MOEs of +/- 0.1 and below are displayed as +/- 0.1 based on Census Bureau convention.
² The reliability indicator of High, Moderate, or Low is meant to provide a general sense of an estimate's reliability. Data users will need to use discretion in identifying the level of reliability appropriate for their purposes.
“High” reliability: MOE is less than or equal to 20% of the estimate. Indicates that sampling error is small relative to the size of the estimate. Flagged green."Moderate” reliability: MOE is between 20% and 66.7% of the estimate. Flagged yellow to indicate that the estimate should be used with caution."Low” reliability: MOE is over 66.7% of the estimate. Flagged red to warn that sampling error is large relative to the estimate and that the estimate is very unreliable."NC": Estimate is 0. Reliability cannot be calculated.
Percent Margin of Error "W" value indicates the standard formula for estimating the percent MOE could not be applied (due to negative value under square root).
For more about MOEs, see Census Bureau notes below. For formulas, see “American Community Survey Multiyear Accuracy of the Data (3-year 2008-2010 and 5-year 2006-2010),” http://www.census.gov/acs/www/Downloads/data_documentation/Accuracy/MultiyearACSAccuracyofData2010.pdf.)
Census Bureau notes for DP02:
Notes:
Source:
Produced by:

Selected Social Characteristics (DP02)2006-2010 American Community Survey 5-Year Estimates (Not decennial census counts. See notes after table.)
Council District # 3
Subject EstimateEstimate
Margin of Error ¹ PercentPercent
Margin of Error ¹ Reliability ²
High
High
High
High
High
High
Moderate
Moderate
High
Moderate
Moderate
High
High
High
High
High
High
High
High
High
High
High
High
Moderate
High
High
High
High
Moderate
High
High
High
High
High
Moderate
Low
Low
NC
Low
Low
+/- 484
+/- 210
12.7%
+/- 582
+/- 577
+/- 380
+/- 559
+/- 362
+/- 212
+/- 132
+/- 334
+/- 288
+/- 747
+/- 756
+/- 328
+/- 395
+/- 348
+/- 0.03
+/- 0.05
+/- 1,504
+/- 582
+/- 503
+/- 832
+/- 460
+/- 567
+/- 717
+/- 1,161
+/- 1,073
+/- 186
+/- 1,583
+/- 1,527
+/- 576
+/- 83
+/-123
+/- 313
+/- 221
+/- 203
+/- 178
+/- 301
+/- 363
34.4%
14.4%
26.2%
9.9%
2.0%
0.8%
6.2%
3.7%
65.6%
48.7%
7.9%
15.2%
14.3%
100.0%
54.0%
3.2%
13.2%
5.6%
14.1%
15.5%
100.0%
54.5%
1.7%
100.0%
49.1%
30.8%
5.6%
1.8%
X
X
X
100.0%
+/- 597
X
32.9%
+/- 157 1.5%
+/- 397 9.4%
High
High
42,274
14,556
6,071
11,080
4,171
856
348
2,620
1,552
27,718
20,588
3,327
6,437
6,065
1.85
2.77
78,330
42,274
2,512
10,313
4,408
11,060
12,171
36,201
19,743
4,817
1,053
608
37,899
18,624
11,670
172
0
2,123
9
665
40
36
59
11,894
537
3,419
X
X
X
100.0%
16.3%
X
X
X
X
X
X
X
X
X
X
X
X
Total Households:
Family Households (families)
With Own Children under 18 years
Married Couple Family
With Own Children under 18 years
Male householder, no wife present
With Own Children under 18 years
Female householder, no husband present
With Own Children under 18 years
Nonfamily Households
Householder Living Alone
65 years and over
Households with one or more people under 18 years
Households with one or more people 65 years and over
Average Household Size:
Average Family Size:
Population in Households:
Number of women 15 to 50 years old who had a birth in the past 12 months:
Unmarried women (widowed, divorced, and never married)
Per 1,000 unmarried women
Per 1,000 women 15 to 50 years old
Per 1,000 women 15 to 19 years old
Per 1,000 women 20 to 34 years old
Per 1,000 women 35 to 50 years old
Males 15 and over:
Never married
Now married, except separated
Separated
Widowed
Divorced
Females 15 and over:
Never married
Now married, except separated
Separated
Widowed
Divorced
Householder
Spouse
Child
Other Relatives
Nonrelatives
Unmarried Partner
MARITAL STATUS
HOUSEHOLDS BY TYPE
RELATIONSHIP
FERTILITY
+/-1.3
+/-0.9
+/-1.3
+/-0.8
+/-0.5
+/-0.3
+/-0.8
+/-0.7
+/-1.5
+/-1.7
+/-0.8
+/-0.9
+/-0.8
W
+/-0.7
+/-0.9
+/-0.6
+/-1
+/-0.6
+/-2.4
+/-1.3
+/-0.5
+/-0.4
+/-1.1
+/-3.5
+/-0.8
+/-0.5
+/-0.8
+/-1.2
+/-7.2
7/10/2014
Page 1 of 5DP02 Selected Social Characteristics, 2006-2010 American Community Survey
3Geographic Area:

Council District # 3
Subject EstimateEstimate
Margin of Error ¹ PercentPercent
Margin of Error ¹ Reliability ²
Moderate
Low
NC
Low
Low
Low
Low
Low
+/- 183
+/- 122
+/-123
+/- 105
+/- 33
+/- 52
+/- 94
+/- 117
100.0%
39.2%
0.0%
22.6%
5.1%
11.4%
71.4%
87.5%
429
168
0
97
22
49
120
147
Low+/- 122 100.0%168
High
Moderate
Moderate
High
High
High
100.0%
5.7%
4.1%
22.5%
12.4%
55.2%
18,998
1,083
787
4,273
2,361
10,494
+/- 1,842
+/- 219
+/- 214
+/- 475
+/- 422
+/- 1,685
X
X
X
High
High
High
High
High
High
High
High
High
High
High
High
100.0%
3.0%
4.4%
16.4%
6.8%
33.3%
25.9%
5.5%
X
10.2%
X100.0%
61,896
1,873
2,720
10,165
4,228
20,607
16,007
92.6%
59.2%
3,976
6,296
72,391
+/- 1,256
+/- 308
+/- 434
+/- 624
+/- 734
+/- 502
+/- 943
+/- 827
+/- 0.9
+/- 1.6
+/- 2,123
+/- 411
Civilian population 18 years and over:
Civilian veterans
Population 25 years and over:
Less than 9th grade
9th to 12th grade, no diploma
High school graduate (includes equivalency)
Some college, no degree
Associate's degree
Bachelor's degree
Graduate or professional degree
Percent high school graduate or higher:
Percent bachelor's degree or higher:
Population 3 years and over enrolled in school:
Nursery school, preschool
Kindergarten
Elementaryschool (grades 1-8)
High school (grades 9-12)
College or graduate school
Number of grandparents living with own grandchildren under 18 years:
Responsible for grandchildren
Responsible less than 1 year
Responsible 1 to 2_years
Responsible 3 to 4 years
Responsible 5 or more years
Who are female
Who are married
Number of grandparents responsible for own grandchildren under 18 years:
GRANDPARENTS
SCHOOL ENROLLMENT
EDUCATIONAL ATTAINMENT
VETERAN STATUS
X
X
X
X
+/-23
+/-0.6
+/-22.5
+/-7.4
+/-11.1
+/-21
+/-28.5
+/-1
+/-1.1
+/-1.2
+/-1.9
+/-7.1
+/-0.5
+/-0.7
+/-1
+/-1.1
+/-0.8
+/-1.4
+/-1.2
+/-0.5
High
High
High
High
High
Moderate
High
Moderate
High
High
High
High
High
High
+/- 2,269
+/- 1,646
+/- 1,265
+/- 1,183
+/- 1,059
+/- 442
+/- 810
+/- 354
+/- 2,019
+/- 2,038
+/- 1,334
+/- 1,473
+/- 341
+/- 1,027
71.9%
26.6%
17.7%
8.9%
2.4%
6.5%
1.4%
85.1%
82.8%
32.8%
50.0%
2.3%
14.9%
X100.0%
RESIDENCE 1 YEAR AGO
PLACE OF BIRTH
82,432
59,298
21,940
14,606
7,334
2,004
5,330
1,194
70,889
68,943
27,296
41,647
1,946
12,386
High+/- 2,284 100.0%83,275 X
Population 1 year and over:
Same house
Different house in the U.S.
Same county
Different county
Same state
Different state
Abroad
Native
Born in the U.S.
State of residence
Different state
Born in Puerto Rico, U.S. Island areas, or born abroad to American parents
Foreign born
Total Population:
+/-0.3
+/-1.3
+/-1.3
+/-1.3
+/-0.5
+/-1
+/-0.4
+/-0.7
+/-0.9
+/-1.3
+/-1.1
+/-0.4
+/-1.2
7/10/2014
Page 2 of 5DP02 Selected Social Characteristics, 2006-2010 American Community Survey
3Geographic Area:

Council District # 3
Subject EstimateEstimate
Margin of Error ¹ PercentPercent
Margin of Error ¹ Reliability ²
Moderate
Moderate
High
High
High
High
Moderate
High
High
High
High
High
High
High
High
High
Moderate
High
High
High
High
High
Moderate
Low
Moderate
Moderate
High
High
High
Moderate
Moderate
High
Moderate
Moderate
Moderate
Moderate
Moderate
+/- 806
+/- 705
7.4%
+/- 1,027
+/- 1,027
+/- 550
+/- 878
+/- 1,070
+/- 322
+/- 1,027
+/- 790
+/- 341
+/- 91
+/- 649
+/- 1,027
+/- 583
+/- 552
+/- 246
+/- 2,236
+/- 474
+/- 595
+/- 1,130
+/- 483
+/- 2,014
+/- 243
+/- 477
+/- 418
+/- 253
+/- 2,284
+/- 345
+/- 170
+/- 170
+/- 223
+/- 337
+/- 745
14.9%
55.7%
100.0%
91.5%
100.0%
38.8%
100.0%
8.5%
61.2%
100.0%
41.4%
19.8%
6.4%
100.0%
17.6%
82.4%
1.1%
100.0%
1.8%
0.4%
0.6%
1.1%
2.0%
10.6%
+/- 402
X
18.4%
+/- 379 13.2%
+/- 76 0.8%
U.S. CITIZENSHIP STATUS
YEAR OF ENTRY
High
High
12,386
12,386
5,492
6,894
14,332
1,780
12,386
4,807
1,946
166
7,579
12,386
5,857
4,226
5,133
2,448
794
79,616
1,652
4,837
13,974
3,085
65,642
632
2,659
1,826
914
83,275
1,522
369
538
944
2,277
1,629
105
1,642
8,818
WORLD REGION OF BIRTH OF FOREIGN BORN
LANGUAGE SPOKEN AT HOME
High
Moderate
Moderate
High
3.3%
0.6%
16.2%
0.9%
0.6%
12.1%
2,744
532
13,525
769
502
10,081
+/- 411
+/- 208
+/- 1,020
+/- 229
+/- 205
+/- 804
X
5.3%
2.1%
X
X
X
High
High
Moderate
High
Moderate
Moderate
4.7%
0.4%
3.9%
0.3%
1.9%
3.0%
3,880
338
3,220
289
1,574
2,518
+/- 598
+/- 140
+/- 429
+/- 400
+/- 140
+/- 338
ANCESTRY
Foreign born
Foreign-born population:
Naturalized U.S. citizen
Not a U.S. citizen
Population born outside the U.S.:
Native:
Entered 2000 or later
Entered before 2000
Foreign born population:
Entered 2000 or later
Entered before 2000
Foreign-born, excluding born at sea:
Europe
Asia
Africa
Oceania
Latin America
Northern America
Population 5 years and over:
English only
Language other than English
Speak English less than "very well"
Spanish
Other Indo-European lanugages
Asian and Pacific Islander languages
Other languages
Speak English less than "very well"
Speak English less than "very well"
Speak English less than "very well"
Speak English less than "very well"
Total Population:
American
Arab
Czech
Danish
Dutch
English
French (except Basque)
French Canadian
German
Greek
Hungarian
Irish
Italian
Lithuanian
Norwegian
Polish
Portuguese
Russian
100.0%
44.3%
3.9%
0.8%
6.1%
3.3%
2.3%
X
+/-1.2
+/-4.4
+/-4.1
+/-5.5
+/-2.9
+/-3.2
+/-2.9
+/-0.6
+/-1.9
+/-4.1
+/-1
+/-1.3
+/-1
+/-0.6
+/-0.4
+/-0.2
+/-0.2
+/-0.3
+/-0.4
+/-0.8
+/-0.2
+/-1.1
+/-0.3
+/-0.2
+/-0.9
+/-0.2
+/-0.5
+/-0.5
+/-0.2
+/-0.4
+/-2.5
+/-5.4
+/-1.3
+/-0.9
+/-0.6
+/-0.3
+/-0.7
+/-0.6
+/-0.5
+/-0.3
+/-0.5
+/-0.7
X
7/10/2014
Page 3 of 5DP02 Selected Social Characteristics, 2006-2010 American Community Survey
3Geographic Area:

Council District # 3
Subject EstimateEstimate
Margin of Error ¹ PercentPercent
Margin of Error ¹ Reliability ²
High
Moderate
High
High
Moderate
Moderate
Moderate
1.9%
2.6%
4.5%
0.7%
3.0%
1,574
2,175
3,709
610
2,506
+/- 338
+/- 425
+/- 531
+/- 368
+/- 215
187
2,593
Moderate
Moderate
Low
0.6%
1.2%
0.2%
523
989
129
+/- 174
+/- 265
+/- 102
Russian
Scotch Irish
Scottish
Slovak
Subsaharan African
Swedish
Swiss
Ukrainian
Welsh
West Indian (except Hispanic origin groups)
0.2%
3.1%
+/- 114
+/- 542
+/-0.1
+/-0.6
+/-0.4
+/-0.5
+/-0.6
+/-0.3
+/-0.4
+/-0.2
+/-0.3
+/-0.1
7/10/2014
Page 4 of 5DP02 Selected Social Characteristics, 2006-2010 American Community Survey
3Geographic Area:

U.S. Census Bureau, 2006-2010 American Community Survey (ACS), 5-Year estimates
City of Seattle, Department of Planning and Development (DPD)On the Web at: http://www.seattle.gov/dpd/Research/Population_Demographics/Overview/
Supporting documentation on code lists, subject definitions, data accuracy, and statistical testing can be found on the American Community Survey website in the Data and Documentation section.
Sample size and data quality measures (including coverage rates, allocation rates, and response rates) can be found on the American Community Survey website in the Methodology section.
Although the American Community Survey (ACS) produces population, demographic and housing unit estimates, for 2010, the 2010 Census provides the official counts of the population and housing units for the nation, states, counties, cities and towns. For 2006 to 2009, the Population Estimates Program provides intercensal estimates of the population for the nation, states, and counties.
Data are based on a sample and are subject to sampling variability. The degree of uncertainty for an estimate arising from sampling variability is represented through the use of a margin of error. The value shown here is the 90 percent margin of error. The margin of error can be interpreted roughly as providing a 90 percent probability that the interval defined by the estimate minus the margin of error and the estimate plus the margin of error (the lower and upper confidence bounds) contains the true value. In addition to sampling variability, the ACS estimates are subject to nonsampling error (for a discussion of nonsampling variability, see Accuracy of the Data). The effect of nonsampling error is not represented in these tables.
While the 2006-2010 American Community Survey (ACS) data generally reflect the December 2009 Office of Management and Budget (OMB) definitions of metropolitan and micropolitan statistical areas; in certain instances the names, codes, and boundaries of the principal cities shown in ACS tables may differ from the OMB definitions due to differences in the effective dates of the geographic entities.
Estimates of urban and rural population, housing units, and characteristics reflect boundaries of urban areas defined based on Census 2000 data. Boundaries for urban areas have not been updated since Census 2000. As a result, data for urban and rural areas from the ACS do not necessarily reflect the results of ongoing urbanization.
Explanation of Symbols:1. An '**' entry in the margin of error column indicates that either no sample observations or too few sample observations were available to compute a standard error and thus the margin of error. A statistical test is not appropriate.2. An '-' entry in the estimate column indicates that either no sample observations or too few sample observations were available to compute an estimate, or a ratio of medians cannot be calculated because one or both of the median estimates falls in the lowest interval or upper interval of an open-ended distribution.3. An '-' following a median estimate means the median falls in the lowest interval of an open-ended distribution.4. An '+' following a median estimate means the median falls in the upper interval of an open-ended distribution.5. An '***' entry in the margin of error column indicates that the median falls in the lowest interval or upper interval of an open-ended distribution. A statistical test is not appropriate.6. An '*****' entry in the margin of error column indicates that the estimate is controlled. A statistical test for sampling variability is not appropriate.7. An 'N' entry in the estimate and margin of error columns indicates that data for this geographic area cannot be displayed because the number of sample cases is too small.8. An '(X)' means that the estimate is not applicable or not available."
This is one of four reports that have been adapted from the ACS "Data Profile" (DP) Series. The four DP tables published by the Census Bureau are: DP02 Selected Social Characteristics; DP03 Selected Economic Characteristics; DP04 Selected Housing Characteristics; DP05 Demographic and Housing Estimates.
DPD has adapted these DP tables for reporting ACS estimates for locally-defined geographies. The locally defined areas covered in these reports are made up of multiple census tracts (except for a few Community Reporting Areas that are made up of only one Census Tract each), therefore estimates shown for these geographies are based on aggregating estimates for multiple census tracts. For ease of calculation, medians are the average of the medians.
¹The ACS is a sample survey and as such, estimates carry sampling error. Margins of error (MOEs) provide a measure of sampling error
The MOEs displayed for the aggregated estimates in these reports could only be approximated using the formulas provided by the Census Bureau. These formulas do not account for “covariance” (or inter-relationship) between the aggregated estimates, and can understate or—more commonly—overstate the margins of error. In some cases, actual MOEs may be much different than approximated. MOEs of +/- 0.1 and below are displayed as +/- 0.1 based on Census Bureau convention.
² The reliability indicator of High, Moderate, or Low is meant to provide a general sense of an estimate's reliability. Data users will need to use discretion in identifying the level of reliability appropriate for their purposes.
“High” reliability: MOE is less than or equal to 20% of the estimate. Indicates that sampling error is small relative to the size of the estimate. Flagged green."Moderate” reliability: MOE is between 20% and 66.7% of the estimate. Flagged yellow to indicate that the estimate should be used with caution."Low” reliability: MOE is over 66.7% of the estimate. Flagged red to warn that sampling error is large relative to the estimate and that the estimate is very unreliable."NC": Estimate is 0. Reliability cannot be calculated.
Percent Margin of Error "W" value indicates the standard formula for estimating the percent MOE could not be applied (due to negative value under square root).
For more about MOEs, see Census Bureau notes below. For formulas, see “American Community Survey Multiyear Accuracy of the Data (3-year 2008-2010 and 5-year 2006-2010),” http://www.census.gov/acs/www/Downloads/data_documentation/Accuracy/MultiyearACSAccuracyofData2010.pdf.)
Census Bureau notes for DP02:
Notes:
Source:
Produced by:

Selected Social Characteristics (DP02)2006-2010 American Community Survey 5-Year Estimates (Not decennial census counts. See notes after table.)
Council District # 4
Subject EstimateEstimate
Margin of Error ¹ PercentPercent
Margin of Error ¹ Reliability ²
High
High
High
High
High
High
Moderate
Moderate
Moderate
Moderate
Moderate
High
Moderate
High
High
High
High
High
High
High
High
High
High
Moderate
High
High
High
High
Moderate
High
High
High
High
High
Low
Low
Low
Low
Low
Low
+/- 356
+/- 196
8.2%
+/- 522
+/- 496
+/- 319
+/- 471
+/- 300
+/- 180
+/- 88
+/- 250
+/- 177
+/- 670
+/- 663
+/- 292
+/- 320
+/- 267
+/- 0.04
+/- 0.05
+/- 1,938
+/- 522
+/- 272
+/- 1,698
+/- 356
+/- 478
+/- 545
+/- 1,577
+/- 1,889
+/- 73
+/- 1,398
+/- 1,379
+/- 489
+/- 82
+/- 1,621
+/- 240
+/- 283
+/- 124
+/- 178
+/- 290
+/- 566
39.3%
17.8%
32.9%
15.0%
2.0%
0.7%
4.4%
2.1%
60.7%
40.9%
7.6%
18.3%
14.3%
100.0%
47.6%
1.7%
18.9%
3.8%
15.7%
16.1%
100.0%
59.5%
0.4%
100.0%
54.0%
32.6%
4.4%
0.8%
X
X
X
100.0%
+/- 472
X
32.3%
+/- 110 0.9%
+/- 421 6.9%
High
High
35,996
14,133
6,415
11,844
5,400
705
252
1,584
763
21,863
14,709
2,726
6,576
5,133
2.10
2.79
75,694
35,996
1,320
14,341
2,895
11,864
12,173
38,365
22,811
3,116
913
157
38,130
20,591
12,431
69
12
1,692
3
300
32
26
58
12,402
334
2,661
X
X
X
100.0%
7.6%
X
X
X
X
X
X
X
X
X
X
X
X
Total Households:
Family Households (families)
With Own Children under 18 years
Married Couple Family
With Own Children under 18 years
Male householder, no wife present
With Own Children under 18 years
Female householder, no husband present
With Own Children under 18 years
Nonfamily Households
Householder Living Alone
65 years and over
Households with one or more people under 18 years
Households with one or more people 65 years and over
Average Household Size:
Average Family Size:
Population in Households:
Number of women 15 to 50 years old who had a birth in the past 12 months:
Unmarried women (widowed, divorced, and never married)
Per 1,000 unmarried women
Per 1,000 women 15 to 50 years old
Per 1,000 women 15 to 19 years old
Per 1,000 women 20 to 34 years old
Per 1,000 women 35 to 50 years old
Males 15 and over:
Never married
Now married, except separated
Separated
Widowed
Divorced
Females 15 and over:
Never married
Now married, except separated
Separated
Widowed
Divorced
Householder
Spouse
Child
Other Relatives
Nonrelatives
Unmarried Partner
MARITAL STATUS
HOUSEHOLDS BY TYPE
RELATIONSHIP
FERTILITY
+/-1.3
+/-0.8
+/-1.2
+/-0.8
+/-0.5
+/-0.2
+/-0.7
+/-0.5
+/-1.6
+/-1.7
+/-0.8
+/-0.8
+/-0.7
W
+/-0.5
+/-0.6
+/-0.4
+/-2.2
+/-0.5
+/-4.3
W
+/-0.2
+/-0.3
+/-1.1
+/-3
+/-0.5
+/-0.3
+/-0.6
+/-0.9
+/-8.8
7/10/2014
Page 1 of 5DP02 Selected Social Characteristics, 2006-2010 American Community Survey
4Geographic Area:

Council District # 4
Subject EstimateEstimate
Margin of Error ¹ PercentPercent
Margin of Error ¹ Reliability ²
Moderate
NC
NC
NC
NC
NC
NC
NC
+/- 53
+/-123
+/-123
+/-123
+/-123
+/-123
+/-123
+/-123
100.0%
0.0%
0.0%
0.0%
0.0%
0.0%
0.0%
0.0%
85
0
0
0
0
0
0
0
NC+/-123 0.0%0
High
High
Moderate
High
High
High
100.0%
3.9%
2.2%
12.4%
5.7%
75.9%
34,450
1,351
743
4,258
1,963
26,135
+/- 1,748
+/- 226
+/- 175
+/- 357
+/- 359
+/- 1,656
X
X
X
High
High
High
Moderate
Moderate
High
High
High
High
High
High
High
100.0%
0.8%
1.3%
12.8%
4.5%
39.6%
34.0%
5.0%
X
7.1%
X100.0%
50,159
401
650
6,407
2,241
19,856
17,063
97.9%
73.6%
3,749
3,541
74,945
+/- 1,774
+/- 194
+/- 227
+/- 645
+/- 791
+/- 370
+/- 900
+/- 787
+/- 1.1
+/- 2.3
+/- 2,564
+/- 516
Civilian population 18 years and over:
Civilian veterans
Population 25 years and over:
Less than 9th grade
9th to 12th grade, no diploma
High school graduate (includes equivalency)
Some college, no degree
Associate's degree
Bachelor's degree
Graduate or professional degree
Percent high school graduate or higher:
Percent bachelor's degree or higher:
Population 3 years and over enrolled in school:
Nursery school, preschool
Kindergarten
Elementaryschool (grades 1-8)
High school (grades 9-12)
College or graduate school
Number of grandparents living with own grandchildren under 18 years:
Responsible for grandchildren
Responsible less than 1 year
Responsible 1 to 2_years
Responsible 3 to 4 years
Responsible 5 or more years
Who are female
Who are married
Number of grandparents responsible for own grandchildren under 18 years:
GRANDPARENTS
SCHOOL ENROLLMENT
EDUCATIONAL ATTAINMENT
VETERAN STATUS
X
X
X
X
+/-0.6
+/-0.6
+/-0.6
+/-0.6
+/-0.6
+/-0.6
+/-0.6
+/-0.6
+/-0.5
+/-0.8
+/-1
+/-2.9
+/-0.4
+/-0.5
+/-1.3
+/-1.5
+/-0.7
+/-1.1
+/-1
+/-0.7
High
High
High
High
High
High
High
Moderate
High
High
High
High
High
High
+/- 2,618
+/- 1,760
+/- 1,960
+/- 1,450
+/- 1,081
+/- 655
+/- 718
+/- 414
+/- 2,380
+/- 2,333
+/- 1,708
+/- 1,408
+/- 332
+/- 966
67.6%
30.1%
20.1%
10.0%
4.9%
5.1%
2.3%
86.7%
84.5%
39.7%
44.8%
2.2%
13.3%
X100.0%
RESIDENCE 1 YEAR AGO
PLACE OF BIRTH
84,984
57,464
25,574
17,059
8,515
4,161
4,354
1,946
74,417
72,518
34,051
38,467
1,899
11,429
High+/- 2,620 100.0%85,846 X
Population 1 year and over:
Same house
Different house in the U.S.
Same county
Different county
Same state
Different state
Abroad
Native
Born in the U.S.
State of residence
Different state
Born in Puerto Rico, U.S. Island areas, or born abroad to American parents
Foreign born
Total Population:
W
+/-2.1
+/-1.6
+/-1.2
+/-0.8
+/-0.8
+/-0.5
+/-0.8
+/-0.9
+/-1.6
+/-0.9
+/-0.4
+/-1
7/10/2014
Page 2 of 5DP02 Selected Social Characteristics, 2006-2010 American Community Survey
4Geographic Area:

Council District # 4
Subject EstimateEstimate
Margin of Error ¹ PercentPercent
Margin of Error ¹ Reliability ²
Moderate
Moderate
High
High
High
High
Moderate
High
High
High
Moderate
High
High
High
High
High
Moderate
High
High
High
High
High
Moderate
Moderate
Moderate
Moderate
High
High
High
Moderate
Moderate
High
Moderate
Moderate
Moderate
Moderate
High
+/- 581
+/- 410
4.4%
+/- 966
+/- 966
+/- 649
+/- 683
+/- 1,031
+/- 299
+/- 966
+/- 601
+/- 332
+/- 144
+/- 743
+/- 966
+/- 753
+/- 250
+/- 226
+/- 2,601
+/- 114
+/- 904
+/- 1,118
+/- 454
+/- 2,472
+/- 154
+/- 515
+/- 179
+/- 78
+/- 2,620
+/- 320
+/- 284
+/- 151
+/- 204
+/- 352
+/- 838
13.3%
52.8%
100.0%
82.4%
100.0%
42.0%
100.0%
17.6%
58.0%
100.0%
58.2%
7.8%
8.1%
100.0%
16.3%
83.7%
0.1%
100.0%
1.7%
0.8%
0.6%
1.0%
2.3%
13.6%
+/- 343
X
19.3%
+/- 203 5.4%
+/- 69 1.2%
U.S. CITIZENSHIP STATUS
YEAR OF ENTRY
High
High
11,429
11,429
5,396
6,033
13,328
1,564
11,429
4,796
1,899
335
6,633
11,429
3,648
2,021
6,652
887
924
82,153
242
7,468
13,388
3,354
68,765
408
2,876
545
122
85,846
1,471
677
492
872
2,208
617
141
1,967
11,640
WORLD REGION OF BIRTH OF FOREIGN BORN
LANGUAGE SPOKEN AT HOME
High
Moderate
Moderate
High
3.5%
0.7%
18.6%
0.8%
0.8%
13.8%
3,020
599
15,952
692
645
11,817
+/- 436
+/- 181
+/- 939
+/- 270
+/- 200
+/- 884
X
2.5%
0.3%
X
X
X
High
High
Moderate
High
Moderate
Moderate
4.6%
0.5%
5.1%
0.3%
1.8%
2.9%
3,980
425
4,418
215
1,518
2,510
+/- 530
+/- 193
+/- 507
+/- 392
+/- 109
+/- 313
ANCESTRY
Foreign born
Foreign-born population:
Naturalized U.S. citizen
Not a U.S. citizen
Population born outside the U.S.:
Native:
Entered 2000 or later
Entered before 2000
Foreign born population:
Entered 2000 or later
Entered before 2000
Foreign-born, excluding born at sea:
Europe
Asia
Africa
Oceania
Latin America
Northern America
Population 5 years and over:
English only
Language other than English
Speak English less than "very well"
Spanish
Other Indo-European lanugages
Asian and Pacific Islander languages
Other languages
Speak English less than "very well"
Speak English less than "very well"
Speak English less than "very well"
Speak English less than "very well"
Total Population:
American
Arab
Czech
Danish
Dutch
English
French (except Basque)
French Canadian
German
Greek
Hungarian
Irish
Italian
Lithuanian
Norwegian
Polish
Portuguese
Russian
100.0%
47.2%
4.1%
0.5%
9.1%
3.5%
0.7%
X
+/-1
+/-6.9
+/-6.4
+/-3.9
+/-2.5
+/-4.4
+/-1.7
+/-0.6
+/-1.9
+/-2.1
+/-1.4
+/-1.3
+/-0.7
+/-0.1
+/-0.4
+/-0.3
+/-0.2
+/-0.2
+/-0.4
+/-0.9
+/-0.2
+/-0.9
+/-0.3
+/-0.2
+/-0.9
+/-0.2
+/-0.6
+/-0.4
+/-0.1
+/-0.4
+/-4
+/-4
+/-4.3
+/-0.5
+/-0.5
+/-0.2
+/-1.1
+/-0.6
+/-0.2
+/-0.1
+/-0.5
+/-0.6
X
7/10/2014
Page 3 of 5DP02 Selected Social Characteristics, 2006-2010 American Community Survey
4Geographic Area:

Council District # 4
Subject EstimateEstimate
Margin of Error ¹ PercentPercent
Margin of Error ¹ Reliability ²
High
Moderate
High
High
Moderate
Moderate
Moderate
1.8%
3.0%
4.1%
0.7%
4.3%
1,518
2,601
3,503
604
3,683
+/- 313
+/- 425
+/- 448
+/- 465
+/- 184
128
542
Moderate
Moderate
Moderate
0.6%
1.5%
0.1%
490
1,299
98
+/- 242
+/- 273
+/- 60
Russian
Scotch Irish
Scottish
Slovak
Subsaharan African
Swedish
Swiss
Ukrainian
Welsh
West Indian (except Hispanic origin groups)
0.1%
0.6%
+/- 67
+/- 176
+/-0.1
+/-0.2
+/-0.4
+/-0.5
+/-0.5
+/-0.2
+/-0.5
+/-0.3
+/-0.3
+/-0.1
7/10/2014
Page 4 of 5DP02 Selected Social Characteristics, 2006-2010 American Community Survey
4Geographic Area:

U.S. Census Bureau, 2006-2010 American Community Survey (ACS), 5-Year estimates
City of Seattle, Department of Planning and Development (DPD)On the Web at: http://www.seattle.gov/dpd/Research/Population_Demographics/Overview/
Supporting documentation on code lists, subject definitions, data accuracy, and statistical testing can be found on the American Community Survey website in the Data and Documentation section.
Sample size and data quality measures (including coverage rates, allocation rates, and response rates) can be found on the American Community Survey website in the Methodology section.
Although the American Community Survey (ACS) produces population, demographic and housing unit estimates, for 2010, the 2010 Census provides the official counts of the population and housing units for the nation, states, counties, cities and towns. For 2006 to 2009, the Population Estimates Program provides intercensal estimates of the population for the nation, states, and counties.
Data are based on a sample and are subject to sampling variability. The degree of uncertainty for an estimate arising from sampling variability is represented through the use of a margin of error. The value shown here is the 90 percent margin of error. The margin of error can be interpreted roughly as providing a 90 percent probability that the interval defined by the estimate minus the margin of error and the estimate plus the margin of error (the lower and upper confidence bounds) contains the true value. In addition to sampling variability, the ACS estimates are subject to nonsampling error (for a discussion of nonsampling variability, see Accuracy of the Data). The effect of nonsampling error is not represented in these tables.
While the 2006-2010 American Community Survey (ACS) data generally reflect the December 2009 Office of Management and Budget (OMB) definitions of metropolitan and micropolitan statistical areas; in certain instances the names, codes, and boundaries of the principal cities shown in ACS tables may differ from the OMB definitions due to differences in the effective dates of the geographic entities.
Estimates of urban and rural population, housing units, and characteristics reflect boundaries of urban areas defined based on Census 2000 data. Boundaries for urban areas have not been updated since Census 2000. As a result, data for urban and rural areas from the ACS do not necessarily reflect the results of ongoing urbanization.
Explanation of Symbols:1. An '**' entry in the margin of error column indicates that either no sample observations or too few sample observations were available to compute a standard error and thus the margin of error. A statistical test is not appropriate.2. An '-' entry in the estimate column indicates that either no sample observations or too few sample observations were available to compute an estimate, or a ratio of medians cannot be calculated because one or both of the median estimates falls in the lowest interval or upper interval of an open-ended distribution.3. An '-' following a median estimate means the median falls in the lowest interval of an open-ended distribution.4. An '+' following a median estimate means the median falls in the upper interval of an open-ended distribution.5. An '***' entry in the margin of error column indicates that the median falls in the lowest interval or upper interval of an open-ended distribution. A statistical test is not appropriate.6. An '*****' entry in the margin of error column indicates that the estimate is controlled. A statistical test for sampling variability is not appropriate.7. An 'N' entry in the estimate and margin of error columns indicates that data for this geographic area cannot be displayed because the number of sample cases is too small.8. An '(X)' means that the estimate is not applicable or not available."
This is one of four reports that have been adapted from the ACS "Data Profile" (DP) Series. The four DP tables published by the Census Bureau are: DP02 Selected Social Characteristics; DP03 Selected Economic Characteristics; DP04 Selected Housing Characteristics; DP05 Demographic and Housing Estimates.
DPD has adapted these DP tables for reporting ACS estimates for locally-defined geographies. The locally defined areas covered in these reports are made up of multiple census tracts (except for a few Community Reporting Areas that are made up of only one Census Tract each), therefore estimates shown for these geographies are based on aggregating estimates for multiple census tracts. For ease of calculation, medians are the average of the medians.
¹The ACS is a sample survey and as such, estimates carry sampling error. Margins of error (MOEs) provide a measure of sampling error
The MOEs displayed for the aggregated estimates in these reports could only be approximated using the formulas provided by the Census Bureau. These formulas do not account for “covariance” (or inter-relationship) between the aggregated estimates, and can understate or—more commonly—overstate the margins of error. In some cases, actual MOEs may be much different than approximated. MOEs of +/- 0.1 and below are displayed as +/- 0.1 based on Census Bureau convention.
² The reliability indicator of High, Moderate, or Low is meant to provide a general sense of an estimate's reliability. Data users will need to use discretion in identifying the level of reliability appropriate for their purposes.
“High” reliability: MOE is less than or equal to 20% of the estimate. Indicates that sampling error is small relative to the size of the estimate. Flagged green."Moderate” reliability: MOE is between 20% and 66.7% of the estimate. Flagged yellow to indicate that the estimate should be used with caution."Low” reliability: MOE is over 66.7% of the estimate. Flagged red to warn that sampling error is large relative to the estimate and that the estimate is very unreliable."NC": Estimate is 0. Reliability cannot be calculated.
Percent Margin of Error "W" value indicates the standard formula for estimating the percent MOE could not be applied (due to negative value under square root).
For more about MOEs, see Census Bureau notes below. For formulas, see “American Community Survey Multiyear Accuracy of the Data (3-year 2008-2010 and 5-year 2006-2010),” http://www.census.gov/acs/www/Downloads/data_documentation/Accuracy/MultiyearACSAccuracyofData2010.pdf.)
Census Bureau notes for DP02:
Notes:
Source:
Produced by:

Selected Social Characteristics (DP02)2006-2010 American Community Survey 5-Year Estimates (Not decennial census counts. See notes after table.)
Council District # 5
Subject EstimateEstimate
Margin of Error ¹ PercentPercent
Margin of Error ¹ Reliability ²
High
High
High
High
High
High
Moderate
Moderate
High
High
Moderate
High
High
High
High
High
High
High
High
High
High
High
High
High
High
High
High
High
Moderate
High
High
High
High
High
Moderate
Low
Low
Low
Low
Low
+/- 501
+/- 240
13.4%
+/- 528
+/- 671
+/- 460
+/- 621
+/- 390
+/- 336
+/- 191
+/- 383
+/- 277
+/- 749
+/- 706
+/- 361
+/- 471
+/- 392
+/- 0.03
+/- 0.04
+/- 1,661
+/- 528
+/- 607
+/- 889
+/- 402
+/- 633
+/- 868
+/- 1,128
+/- 1,001
+/- 136
+/- 1,004
+/- 835
+/- 643
+/- 120
+/- 1,677
+/- 414
+/- 353
+/- 166
+/- 249
+/- 496
+/- 330
49.1%
19.8%
37.4%
14.8%
4.4%
1.4%
7.3%
3.6%
50.9%
38.4%
9.6%
21.7%
20.4%
100.0%
48.0%
5.0%
9.7%
3.9%
18.0%
19.2%
100.0%
40.9%
1.0%
100.0%
33.4%
42.6%
9.4%
1.2%
X
X
X
100.0%
+/- 665
X
45.2%
+/- 222 2.4%
+/- 430 10.6%
High
High
42,644
20,942
8,451
15,969
6,304
1,862
597
3,111
1,550
21,702
16,388
4,082
9,272
8,719
2.08
2.79
88,822
42,644
4,466
8,652
3,491
15,993
17,067
38,149
15,584
5,323
1,281
386
39,793
13,291
16,941
225
50
3,759
17
479
53
66
39
17,227
925
4,027
X
X
X
100.0%
17.6%
X
X
X
X
X
X
X
X
X
X
X
X
Total Households:
Family Households (families)
With Own Children under 18 years
Married Couple Family
With Own Children under 18 years
Male householder, no wife present
With Own Children under 18 years
Female householder, no husband present
With Own Children under 18 years
Nonfamily Households
Householder Living Alone
65 years and over
Households with one or more people under 18 years
Households with one or more people 65 years and over
Average Household Size:
Average Family Size:
Population in Households:
Number of women 15 to 50 years old who had a birth in the past 12 months:
Unmarried women (widowed, divorced, and never married)
Per 1,000 unmarried women
Per 1,000 women 15 to 50 years old
Per 1,000 women 15 to 19 years old
Per 1,000 women 20 to 34 years old
Per 1,000 women 35 to 50 years old
Males 15 and over:
Never married
Now married, except separated
Separated
Widowed
Divorced
Females 15 and over:
Never married
Now married, except separated
Separated
Widowed
Divorced
Householder
Spouse
Child
Other Relatives
Nonrelatives
Unmarried Partner
MARITAL STATUS
HOUSEHOLDS BY TYPE
RELATIONSHIP
FERTILITY
+/-1.5
+/-1.1
+/-1.4
+/-0.9
+/-0.8
+/-0.4
+/-0.9
+/-0.6
+/-1.6
+/-1.6
+/-0.8
+/-1.1
+/-0.9
W
+/-0.6
+/-0.9
+/-0.7
+/-1
+/-0.4
+/-2.3
+/-1.1
+/-0.4
+/-0.6
+/-1.1
+/-1.9
+/-1.2
+/-0.4
+/-1
+/-1.2
+/-8.8
7/10/2014
Page 1 of 5DP02 Selected Social Characteristics, 2006-2010 American Community Survey
5Geographic Area:

Council District # 5
Subject EstimateEstimate
Margin of Error ¹ PercentPercent
Margin of Error ¹ Reliability ²
Moderate
Moderate
Low
Low
Low
Low
Moderate
Low
+/- 276
+/- 146
+/- 110
+/- 45
+/- 25
+/- 81
+/- 108
+/- 114
100.0%
31.0%
13.0%
5.7%
1.8%
10.6%
77.2%
45.3%
1,060
329
138
60
19
112
254
149
Moderate+/- 146 100.0%329
High
Moderate
Moderate
High
High
High
100.0%
6.0%
4.3%
29.8%
16.7%
43.2%
19,568
1,169
842
5,827
3,270
8,460
+/- 1,025
+/- 237
+/- 189
+/- 545
+/- 431
+/- 696
X
X
X
High
High
High
Moderate
High
High
High
High
High
High
High
High
100.0%
2.7%
4.5%
20.2%
7.6%
30.5%
19.7%
7.8%
X
14.8%
X100.0%
67,543
1,845
3,066
13,628
5,119
20,610
13,291
92.7%
50.2%
5,852
9,984
75,456
+/- 1,333
+/- 479
+/- 479
+/- 887
+/- 829
+/- 515
+/- 967
+/- 741
+/- 0.8
+/- 1.6
+/- 1,430
+/- 473
Civilian population 18 years and over:
Civilian veterans
Population 25 years and over:
Less than 9th grade
9th to 12th grade, no diploma
High school graduate (includes equivalency)
Some college, no degree
Associate's degree
Bachelor's degree
Graduate or professional degree
Percent high school graduate or higher:
Percent bachelor's degree or higher:
Population 3 years and over enrolled in school:
Nursery school, preschool
Kindergarten
Elementaryschool (grades 1-8)
High school (grades 9-12)
College or graduate school
Number of grandparents living with own grandchildren under 18 years:
Responsible for grandchildren
Responsible less than 1 year
Responsible 1 to 2_years
Responsible 3 to 4 years
Responsible 5 or more years
Who are female
Who are married
Number of grandparents responsible for own grandchildren under 18 years:
GRANDPARENTS
SCHOOL ENROLLMENT
EDUCATIONAL ATTAINMENT
VETERAN STATUS
X
X
X
X
+/-11.2
+/-9.8
+/-4
+/-2.3
+/-7.1
W
+/-28.2
+/-1.2
+/-0.9
+/-2.3
+/-2
+/-2.7
+/-0.7
+/-0.7
+/-1.3
+/-1.2
+/-0.7
+/-1.3
+/-1
+/-0.6
High
High
High
High
High
Moderate
High
Moderate
High
High
High
High
High
High
+/- 1,709
+/- 1,715
+/- 1,212
+/- 1,079
+/- 586
+/- 420
+/- 431
+/- 340
+/- 1,604
+/- 1,606
+/- 1,326
+/- 1,282
+/- 309
+/- 1,194
81.0%
17.8%
12.5%
5.3%
2.3%
3.0%
1.2%
81.4%
79.5%
40.0%
39.5%
1.8%
18.6%
X100.0%
RESIDENCE 1 YEAR AGO
PLACE OF BIRTH
88,539
71,753
15,717
11,045
4,672
2,042
2,630
1,069
72,999
71,347
35,914
35,433
1,652
16,710
High+/- 1,733 100.0%89,709 X
Population 1 year and over:
Same house
Different house in the U.S.
Same county
Different county
Same state
Different state
Abroad
Native
Born in the U.S.
State of residence
Different state
Born in Puerto Rico, U.S. Island areas, or born abroad to American parents
Foreign born
Total Population:
+/-1.1
+/-1.3
+/-1.2
+/-0.7
+/-0.5
+/-0.5
+/-0.4
+/-0.9
+/-0.9
+/-1.3
+/-1.2
+/-0.3
+/-1.3
7/10/2014
Page 2 of 5DP02 Selected Social Characteristics, 2006-2010 American Community Survey
5Geographic Area:
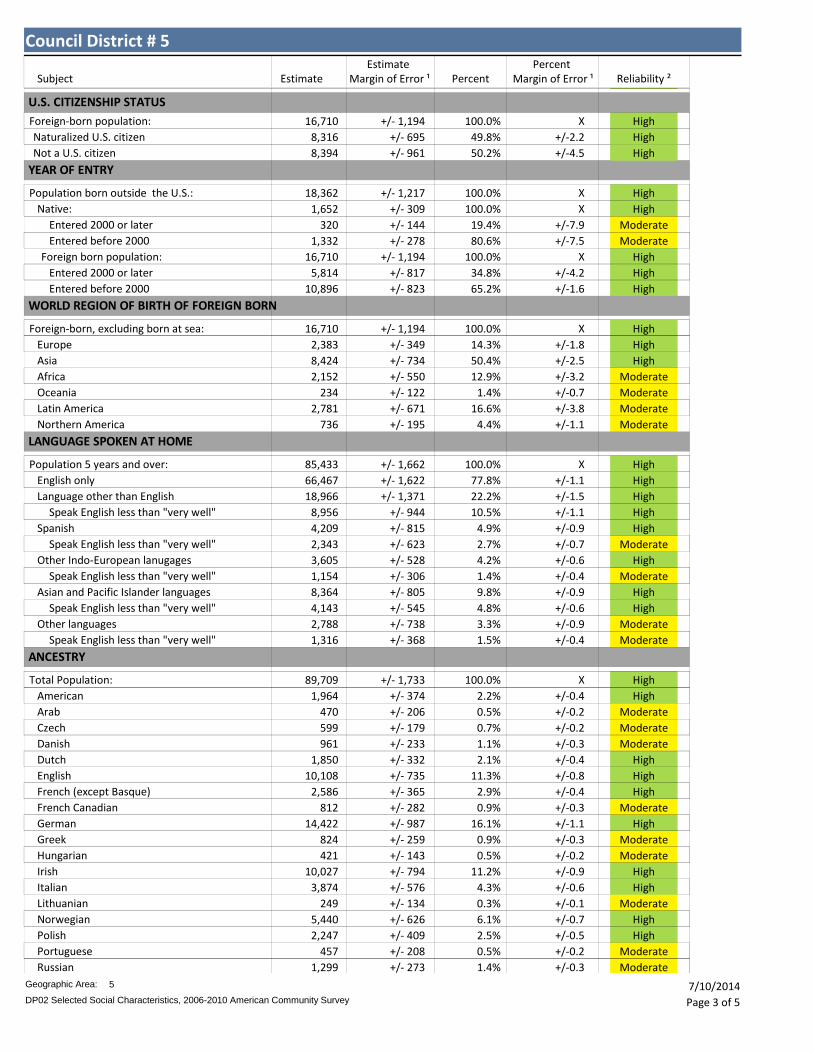
Council District # 5
Subject EstimateEstimate
Margin of Error ¹ PercentPercent
Margin of Error ¹ Reliability ²
Moderate
Moderate
High
High
High
High
Moderate
High
High
High
High
High
High
High
High
High
Moderate
Moderate
High
High
High
High
Moderate
Moderate
Moderate
Moderate
High
High
High
Moderate
Moderate
High
High
Moderate
Moderate
Moderate
High
+/- 944
+/- 815
10.5%
+/- 1,194
+/- 1,194
+/- 695
+/- 961
+/- 1,217
+/- 278
+/- 1,194
+/- 817
+/- 309
+/- 144
+/- 823
+/- 1,194
+/- 734
+/- 671
+/- 195
+/- 1,662
+/- 623
+/- 805
+/- 1,371
+/- 528
+/- 1,622
+/- 306
+/- 545
+/- 738
+/- 368
+/- 1,733
+/- 374
+/- 206
+/- 179
+/- 233
+/- 332
+/- 735
18.6%
50.2%
100.0%
80.6%
100.0%
34.8%
100.0%
19.4%
65.2%
100.0%
50.4%
16.6%
4.4%
100.0%
22.2%
77.8%
1.5%
100.0%
2.2%
0.5%
0.7%
1.1%
2.1%
11.3%
+/- 349
X
14.3%
+/- 550 12.9%
+/- 122 1.4%
U.S. CITIZENSHIP STATUS
YEAR OF ENTRY
High
High
16,710
16,710
8,316
8,394
18,362
1,332
16,710
5,814
1,652
320
10,896
16,710
8,956
4,209
8,424
2,781
736
85,433
2,343
8,364
18,966
3,605
66,467
1,154
4,143
2,788
1,316
89,709
1,964
470
599
961
2,383
2,152
234
1,850
10,108
WORLD REGION OF BIRTH OF FOREIGN BORN
LANGUAGE SPOKEN AT HOME
High
Moderate
Moderate
High
2.9%
0.9%
16.1%
0.9%
0.5%
11.2%
2,586
812
14,422
824
421
10,027
+/- 365
+/- 282
+/- 987
+/- 259
+/- 143
+/- 794
X
4.9%
2.7%
X
X
X
High
High
Moderate
High
Moderate
Moderate
4.3%
0.3%
6.1%
0.5%
1.4%
2.5%
3,874
249
5,440
457
1,299
2,247
+/- 576
+/- 134
+/- 626
+/- 409
+/- 208
+/- 273
ANCESTRY
Foreign born
Foreign-born population:
Naturalized U.S. citizen
Not a U.S. citizen
Population born outside the U.S.:
Native:
Entered 2000 or later
Entered before 2000
Foreign born population:
Entered 2000 or later
Entered before 2000
Foreign-born, excluding born at sea:
Europe
Asia
Africa
Oceania
Latin America
Northern America
Population 5 years and over:
English only
Language other than English
Speak English less than "very well"
Spanish
Other Indo-European lanugages
Asian and Pacific Islander languages
Other languages
Speak English less than "very well"
Speak English less than "very well"
Speak English less than "very well"
Speak English less than "very well"
Total Population:
American
Arab
Czech
Danish
Dutch
English
French (except Basque)
French Canadian
German
Greek
Hungarian
Irish
Italian
Lithuanian
Norwegian
Polish
Portuguese
Russian
100.0%
49.8%
4.2%
1.4%
9.8%
4.8%
3.3%
X
+/-1.3
+/-7.9
+/-7.5
+/-4.2
+/-1.8
+/-2.5
+/-3.2
+/-0.7
+/-1.1
+/-3.8
+/-1.1
+/-1.5
+/-1.1
+/-0.7
+/-0.4
+/-0.2
+/-0.2
+/-0.3
+/-0.4
+/-0.8
+/-0.3
+/-1.1
+/-0.3
+/-0.2
+/-0.9
+/-0.1
+/-0.7
+/-0.5
+/-0.2
+/-0.3
+/-2.2
+/-4.5
+/-1.6
+/-0.9
+/-0.6
+/-0.4
+/-0.9
+/-0.6
+/-0.9
+/-0.4
+/-0.4
+/-0.6
X
7/10/2014
Page 3 of 5DP02 Selected Social Characteristics, 2006-2010 American Community Survey
5Geographic Area:
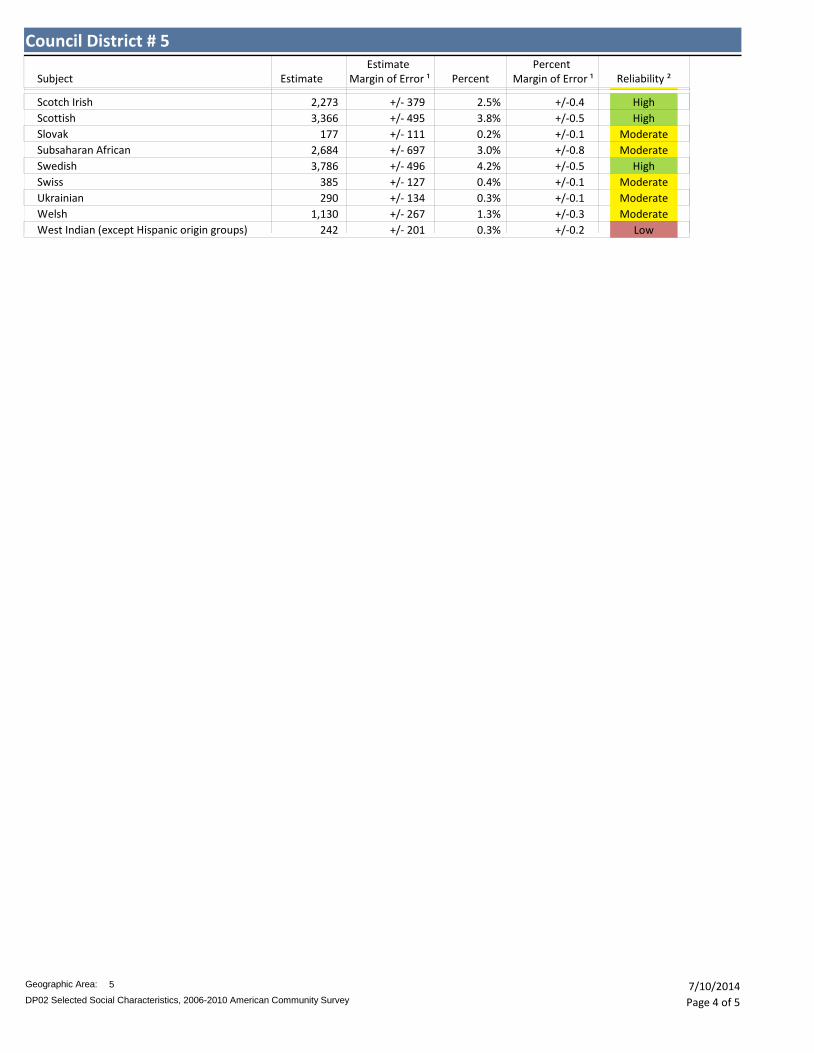
Council District # 5
Subject EstimateEstimate
Margin of Error ¹ PercentPercent
Margin of Error ¹ Reliability ²
High
Moderate
High
High
Moderate
Moderate
Moderate
1.4%
2.5%
3.8%
0.4%
4.2%
1,299
2,273
3,366
385
3,786
+/- 273
+/- 379
+/- 495
+/- 496
+/- 127
177
2,684
Moderate
Moderate
Low
0.3%
1.3%
0.3%
290
1,130
242
+/- 134
+/- 267
+/- 201
Russian
Scotch Irish
Scottish
Slovak
Subsaharan African
Swedish
Swiss
Ukrainian
Welsh
West Indian (except Hispanic origin groups)
0.2%
3.0%
+/- 111
+/- 697
+/-0.1
+/-0.8
+/-0.3
+/-0.4
+/-0.5
+/-0.1
+/-0.5
+/-0.1
+/-0.3
+/-0.2
7/10/2014
Page 4 of 5DP02 Selected Social Characteristics, 2006-2010 American Community Survey
5Geographic Area:

U.S. Census Bureau, 2006-2010 American Community Survey (ACS), 5-Year estimates
City of Seattle, Department of Planning and Development (DPD)On the Web at: http://www.seattle.gov/dpd/Research/Population_Demographics/Overview/
Supporting documentation on code lists, subject definitions, data accuracy, and statistical testing can be found on the American Community Survey website in the Data and Documentation section.
Sample size and data quality measures (including coverage rates, allocation rates, and response rates) can be found on the American Community Survey website in the Methodology section.
Although the American Community Survey (ACS) produces population, demographic and housing unit estimates, for 2010, the 2010 Census provides the official counts of the population and housing units for the nation, states, counties, cities and towns. For 2006 to 2009, the Population Estimates Program provides intercensal estimates of the population for the nation, states, and counties.
Data are based on a sample and are subject to sampling variability. The degree of uncertainty for an estimate arising from sampling variability is represented through the use of a margin of error. The value shown here is the 90 percent margin of error. The margin of error can be interpreted roughly as providing a 90 percent probability that the interval defined by the estimate minus the margin of error and the estimate plus the margin of error (the lower and upper confidence bounds) contains the true value. In addition to sampling variability, the ACS estimates are subject to nonsampling error (for a discussion of nonsampling variability, see Accuracy of the Data). The effect of nonsampling error is not represented in these tables.
While the 2006-2010 American Community Survey (ACS) data generally reflect the December 2009 Office of Management and Budget (OMB) definitions of metropolitan and micropolitan statistical areas; in certain instances the names, codes, and boundaries of the principal cities shown in ACS tables may differ from the OMB definitions due to differences in the effective dates of the geographic entities.
Estimates of urban and rural population, housing units, and characteristics reflect boundaries of urban areas defined based on Census 2000 data. Boundaries for urban areas have not been updated since Census 2000. As a result, data for urban and rural areas from the ACS do not necessarily reflect the results of ongoing urbanization.
Explanation of Symbols:1. An '**' entry in the margin of error column indicates that either no sample observations or too few sample observations were available to compute a standard error and thus the margin of error. A statistical test is not appropriate.2. An '-' entry in the estimate column indicates that either no sample observations or too few sample observations were available to compute an estimate, or a ratio of medians cannot be calculated because one or both of the median estimates falls in the lowest interval or upper interval of an open-ended distribution.3. An '-' following a median estimate means the median falls in the lowest interval of an open-ended distribution.4. An '+' following a median estimate means the median falls in the upper interval of an open-ended distribution.5. An '***' entry in the margin of error column indicates that the median falls in the lowest interval or upper interval of an open-ended distribution. A statistical test is not appropriate.6. An '*****' entry in the margin of error column indicates that the estimate is controlled. A statistical test for sampling variability is not appropriate.7. An 'N' entry in the estimate and margin of error columns indicates that data for this geographic area cannot be displayed because the number of sample cases is too small.8. An '(X)' means that the estimate is not applicable or not available."
This is one of four reports that have been adapted from the ACS "Data Profile" (DP) Series. The four DP tables published by the Census Bureau are: DP02 Selected Social Characteristics; DP03 Selected Economic Characteristics; DP04 Selected Housing Characteristics; DP05 Demographic and Housing Estimates.
DPD has adapted these DP tables for reporting ACS estimates for locally-defined geographies. The locally defined areas covered in these reports are made up of multiple census tracts (except for a few Community Reporting Areas that are made up of only one Census Tract each), therefore estimates shown for these geographies are based on aggregating estimates for multiple census tracts. For ease of calculation, medians are the average of the medians.
¹The ACS is a sample survey and as such, estimates carry sampling error. Margins of error (MOEs) provide a measure of sampling error
The MOEs displayed for the aggregated estimates in these reports could only be approximated using the formulas provided by the Census Bureau. These formulas do not account for “covariance” (or inter-relationship) between the aggregated estimates, and can understate or—more commonly—overstate the margins of error. In some cases, actual MOEs may be much different than approximated. MOEs of +/- 0.1 and below are displayed as +/- 0.1 based on Census Bureau convention.
² The reliability indicator of High, Moderate, or Low is meant to provide a general sense of an estimate's reliability. Data users will need to use discretion in identifying the level of reliability appropriate for their purposes.
“High” reliability: MOE is less than or equal to 20% of the estimate. Indicates that sampling error is small relative to the size of the estimate. Flagged green."Moderate” reliability: MOE is between 20% and 66.7% of the estimate. Flagged yellow to indicate that the estimate should be used with caution."Low” reliability: MOE is over 66.7% of the estimate. Flagged red to warn that sampling error is large relative to the estimate and that the estimate is very unreliable."NC": Estimate is 0. Reliability cannot be calculated.
Percent Margin of Error "W" value indicates the standard formula for estimating the percent MOE could not be applied (due to negative value under square root).
For more about MOEs, see Census Bureau notes below. For formulas, see “American Community Survey Multiyear Accuracy of the Data (3-year 2008-2010 and 5-year 2006-2010),” http://www.census.gov/acs/www/Downloads/data_documentation/Accuracy/MultiyearACSAccuracyofData2010.pdf.)
Census Bureau notes for DP02:
Notes:
Source:
Produced by:

Selected Social Characteristics (DP02)2006-2010 American Community Survey 5-Year Estimates (Not decennial census counts. See notes after table.)
Council District # 6
Subject EstimateEstimate
Margin of Error ¹ PercentPercent
Margin of Error ¹ Reliability ²
High
High
High
High
High
High
Moderate
Moderate
Moderate
Moderate
Moderate
High
High
High
High
High
High
High
High
High
High
High
High
High
High
High
High
High
Moderate
High
High
High
High
High
Low
Low
Low
NC
Low
Low
+/- 435
+/- 231
12.6%
+/- 515
+/- 603
+/- 358
+/- 574
+/- 307
+/- 208
+/- 133
+/- 341
+/- 234
+/- 685
+/- 651
+/- 332
+/- 361
+/- 306
+/- 0.03
+/- 0.04
+/- 1,455
+/- 515
+/- 347
+/- 810
+/- 400
+/- 573
+/- 734
+/- 995
+/- 928
+/- 135
+/- 894
+/- 779
+/- 615
+/- 105
+/-123
+/- 323
+/- 244
+/- 146
+/- 156
+/- 384
+/- 213
45.8%
19.2%
37.5%
15.2%
2.1%
1.0%
6.2%
2.9%
54.2%
38.8%
8.0%
19.8%
14.6%
100.0%
49.3%
2.2%
12.2%
4.6%
18.5%
17.8%
100.0%
43.1%
0.9%
100.0%
36.5%
43.8%
6.1%
0.9%
X
X
X
100.0%
+/- 598
X
44.8%
+/- 165 1.6%
+/- 409 9.6%
High
High
41,023
18,796
7,871
15,394
6,249
857
412
2,545
1,210
22,227
15,910
3,262
8,125
5,979
2.03
2.70
83,191
41,023
1,859
10,143
3,808
15,396
14,770
36,143
15,563
4,668
1,015
335
36,904
13,472
16,153
148
0
2,268
11
343
40
56
29
16,193
567
3,485
X
X
X
100.0%
14.6%
X
X
X
X
X
X
X
X
X
X
X
X
Total Households:
Family Households (families)
With Own Children under 18 years
Married Couple Family
With Own Children under 18 years
Male householder, no wife present
With Own Children under 18 years
Female householder, no husband present
With Own Children under 18 years
Nonfamily Households
Householder Living Alone
65 years and over
Households with one or more people under 18 years
Households with one or more people 65 years and over
Average Household Size:
Average Family Size:
Population in Households:
Number of women 15 to 50 years old who had a birth in the past 12 months:
Unmarried women (widowed, divorced, and never married)
Per 1,000 unmarried women
Per 1,000 women 15 to 50 years old
Per 1,000 women 15 to 19 years old
Per 1,000 women 20 to 34 years old
Per 1,000 women 35 to 50 years old
Males 15 and over:
Never married
Now married, except separated
Separated
Widowed
Divorced
Females 15 and over:
Never married
Now married, except separated
Separated
Widowed
Divorced
Householder
Spouse
Child
Other Relatives
Nonrelatives
Unmarried Partner
MARITAL STATUS
HOUSEHOLDS BY TYPE
RELATIONSHIP
FERTILITY
+/-1.4
+/-0.8
+/-1.3
+/-0.7
+/-0.5
+/-0.3
+/-0.8
+/-0.6
+/-1.5
+/-1.5
+/-0.8
+/-0.8
+/-0.7
W
+/-0.6
+/-0.8
+/-0.4
+/-1
+/-0.5
+/-2.3
+/-1.1
+/-0.4
+/-0.5
+/-1.1
+/-1.9
+/-1.3
+/-0.4
+/-0.9
+/-1.1
+/-9.8
7/10/2014
Page 1 of 5DP02 Selected Social Characteristics, 2006-2010 American Community Survey
6Geographic Area:

Council District # 6
Subject EstimateEstimate
Margin of Error ¹ PercentPercent
Margin of Error ¹ Reliability ²
Moderate
Moderate
Low
Low
NC
Low
Moderate
Low
+/- 166
+/- 100
+/- 50
+/- 72
+/-123
+/- 48
+/- 84
+/- 94
100.0%
32.5%
8.8%
13.8%
0.0%
10.0%
79.8%
76.1%
501
163
44
69
0
50
130
124
Moderate+/- 100 100.0%163
High
High
Moderate
High
High
High
100.0%
9.5%
4.9%
28.3%
14.2%
43.1%
16,427
1,563
805
4,656
2,327
7,076
+/- 826
+/- 247
+/- 175
+/- 442
+/- 302
+/- 660
X
X
X
High
High
High
Moderate
Moderate
High
High
High
High
High
High
High
100.0%
1.1%
2.0%
16.2%
7.4%
39.4%
23.7%
6.4%
X
10.2%
X100.0%
65,701
711
1,317
10,662
4,889
25,869
15,556
96.9%
63.1%
4,538
6,697
71,120
+/- 1,243
+/- 241
+/- 279
+/- 630
+/- 803
+/- 496
+/- 1,012
+/- 782
+/- 0.6
+/- 1.5
+/- 1,303
+/- 404
Civilian population 18 years and over:
Civilian veterans
Population 25 years and over:
Less than 9th grade
9th to 12th grade, no diploma
High school graduate (includes equivalency)
Some college, no degree
Associate's degree
Bachelor's degree
Graduate or professional degree
Percent high school graduate or higher:
Percent bachelor's degree or higher:
Population 3 years and over enrolled in school:
Nursery school, preschool
Kindergarten
Elementaryschool (grades 1-8)
High school (grades 9-12)
College or graduate school
Number of grandparents living with own grandchildren under 18 years:
Responsible for grandchildren
Responsible less than 1 year
Responsible 1 to 2_years
Responsible 3 to 4 years
Responsible 5 or more years
Who are female
Who are married
Number of grandparents responsible for own grandchildren under 18 years:
GRANDPARENTS
SCHOOL ENROLLMENT
EDUCATIONAL ATTAINMENT
VETERAN STATUS
X
X
X
X
+/-16.8
+/-9.5
+/-13.6
+/-0.6
+/-9
+/-16.2
+/-33.9
+/-1.4
+/-1
+/-2.3
+/-1.7
+/-3.4
+/-0.4
+/-0.4
+/-0.9
+/-1.2
+/-0.7
+/-1.3
+/-1.1
+/-0.6
High
High
High
High
High
Moderate
High
Moderate
High
High
High
High
High
High
+/- 1,509
+/- 1,422
+/- 1,139
+/- 986
+/- 601
+/- 327
+/- 496
+/- 248
+/- 1,508
+/- 1,508
+/- 1,228
+/- 1,233
+/- 274
+/- 727
79.8%
19.2%
13.8%
5.4%
1.7%
3.7%
1.0%
90.8%
89.0%
41.9%
47.1%
1.8%
9.2%
X100.0%
RESIDENCE 1 YEAR AGO
PLACE OF BIRTH
82,940
66,176
15,898
11,423
4,475
1,420
3,055
866
76,180
74,653
35,160
39,493
1,527
7,729
High+/- 1,555 100.0%83,909 X
Population 1 year and over:
Same house
Different house in the U.S.
Same county
Different county
Same state
Different state
Abroad
Native
Born in the U.S.
State of residence
Different state
Born in Puerto Rico, U.S. Island areas, or born abroad to American parents
Foreign born
Total Population:
+/-0.9
+/-1.3
+/-1.2
+/-0.7
+/-0.4
+/-0.6
+/-0.3
+/-0.6
+/-0.7
+/-1.2
+/-1.2
+/-0.3
+/-0.8
7/10/2014
Page 2 of 5DP02 Selected Social Characteristics, 2006-2010 American Community Survey
6Geographic Area:

Council District # 6
Subject EstimateEstimate
Margin of Error ¹ PercentPercent
Margin of Error ¹ Reliability ²
Moderate
Moderate
High
High
High
High
Moderate
High
High
High
High
High
High
High
High
High
Moderate
High
High
High
High
High
Moderate
Moderate
Moderate
Moderate
High
High
Moderate
Moderate
Low
High
High
Moderate
Moderate
High
High
+/- 506
+/- 514
3.6%
+/- 727
+/- 727
+/- 492
+/- 536
+/- 773
+/- 261
+/- 727
+/- 432
+/- 274
+/- 75
+/- 573
+/- 727
+/- 469
+/- 382
+/- 275
+/- 1,444
+/- 361
+/- 526
+/- 850
+/- 437
+/- 1,443
+/- 174
+/- 319
+/- 187
+/- 135
+/- 1,555
+/- 374
+/- 122
+/- 216
+/- 256
+/- 406
+/- 880
9.2%
44.3%
100.0%
91.1%
100.0%
29.9%
100.0%
8.9%
70.1%
100.0%
36.4%
15.9%
12.2%
100.0%
10.9%
89.1%
0.2%
100.0%
2.3%
0.3%
0.9%
1.6%
2.6%
15.3%
+/- 344
X
28.9%
+/- 170 4.5%
+/- 74 2.1%
U.S. CITIZENSHIP STATUS
YEAR OF ENTRY
High
High
7,729
7,729
4,308
3,421
9,256
1,391
7,729
2,313
1,527
136
5,416
7,729
2,884
2,576
2,811
1,228
944
79,481
947
2,810
8,683
2,969
70,798
561
1,205
328
171
83,909
1,927
293
732
1,326
2,235
350
161
2,152
12,828
WORLD REGION OF BIRTH OF FOREIGN BORN
LANGUAGE SPOKEN AT HOME
High
Moderate
Moderate
High
3.8%
1.2%
20.6%
1.0%
0.7%
15.6%
3,204
976
17,273
807
581
13,088
+/- 434
+/- 237
+/- 1,052
+/- 232
+/- 171
+/- 926
X
3.2%
1.2%
X
X
X
High
High
Moderate
High
Moderate
High
5.1%
0.3%
8.0%
0.4%
1.6%
3.0%
4,257
210
6,674
295
1,356
2,545
+/- 509
+/- 101
+/- 627
+/- 346
+/- 125
+/- 264
ANCESTRY
Foreign born
Foreign-born population:
Naturalized U.S. citizen
Not a U.S. citizen
Population born outside the U.S.:
Native:
Entered 2000 or later
Entered before 2000
Foreign born population:
Entered 2000 or later
Entered before 2000
Foreign-born, excluding born at sea:
Europe
Asia
Africa
Oceania
Latin America
Northern America
Population 5 years and over:
English only
Language other than English
Speak English less than "very well"
Spanish
Other Indo-European lanugages
Asian and Pacific Islander languages
Other languages
Speak English less than "very well"
Speak English less than "very well"
Speak English less than "very well"
Speak English less than "very well"
Total Population:
American
Arab
Czech
Danish
Dutch
English
French (except Basque)
French Canadian
German
Greek
Hungarian
Irish
Italian
Lithuanian
Norwegian
Polish
Portuguese
Russian
100.0%
55.7%
3.7%
0.7%
3.5%
1.5%
0.4%
X
+/-0.8
+/-4.6
+/-5
+/-4.8
+/-3.5
+/-5
+/-2.2
+/-0.9
+/-3.4
+/-4.7
+/-0.8
+/-1.1
+/-0.6
+/-0.5
+/-0.4
+/-0.1
+/-0.3
+/-0.3
+/-0.5
+/-1
+/-0.3
+/-1.2
+/-0.3
+/-0.2
+/-1.1
+/-0.1
+/-0.7
+/-0.4
+/-0.1
+/-0.3
+/-3.6
+/-5.5
+/-3.4
+/-0.6
+/-0.5
+/-0.2
+/-0.7
+/-0.4
+/-0.2
+/-0.2
+/-0.5
+/-0.6
X
7/10/2014
Page 3 of 5DP02 Selected Social Characteristics, 2006-2010 American Community Survey
6Geographic Area:

Council District # 6
Subject EstimateEstimate
Margin of Error ¹ PercentPercent
Margin of Error ¹ Reliability ²
High
High
High
High
Moderate
Moderate
Moderate
1.6%
3.2%
5.4%
0.8%
5.3%
1,356
2,695
4,567
701
4,412
+/- 264
+/- 415
+/- 599
+/- 571
+/- 219
298
537
Moderate
Moderate
Low
0.4%
1.6%
0.1%
377
1,305
64
+/- 152
+/- 264
+/- 46
Russian
Scotch Irish
Scottish
Slovak
Subsaharan African
Swedish
Swiss
Ukrainian
Welsh
West Indian (except Hispanic origin groups)
0.4%
0.6%
+/- 143
+/- 325
+/-0.2
+/-0.4
+/-0.3
+/-0.5
+/-0.7
+/-0.3
+/-0.7
+/-0.2
+/-0.3
+/-0.1
7/10/2014
Page 4 of 5DP02 Selected Social Characteristics, 2006-2010 American Community Survey
6Geographic Area:
U.S. Census Bureau, 2006-2010 American Community Survey (ACS), 5-Year estimates
City of Seattle, Department of Planning and Development (DPD)On the Web at: http://www.seattle.gov/dpd/Research/Population_Demographics/Overview/
Supporting documentation on code lists, subject definitions, data accuracy, and statistical testing can be found on the American Community Survey website in the Data and Documentation section.
Sample size and data quality measures (including coverage rates, allocation rates, and response rates) can be found on the American Community Survey website in the Methodology section.
Although the American Community Survey (ACS) produces population, demographic and housing unit estimates, for 2010, the 2010 Census provides the official counts of the population and housing units for the nation, states, counties, cities and towns. For 2006 to 2009, the Population Estimates Program provides intercensal estimates of the population for the nation, states, and counties.
Data are based on a sample and are subject to sampling variability. The degree of uncertainty for an estimate arising from sampling variability is represented through the use of a margin of error. The value shown here is the 90 percent margin of error. The margin of error can be interpreted roughly as providing a 90 percent probability that the interval defined by the estimate minus the margin of error and the estimate plus the margin of error (the lower and upper confidence bounds) contains the true value. In addition to sampling variability, the ACS estimates are subject to nonsampling error (for a discussion of nonsampling variability, see Accuracy of the Data). The effect of nonsampling error is not represented in these tables.
While the 2006-2010 American Community Survey (ACS) data generally reflect the December 2009 Office of Management and Budget (OMB) definitions of metropolitan and micropolitan statistical areas; in certain instances the names, codes, and boundaries of the principal cities shown in ACS tables may differ from the OMB definitions due to differences in the effective dates of the geographic entities.
Estimates of urban and rural population, housing units, and characteristics reflect boundaries of urban areas defined based on Census 2000 data. Boundaries for urban areas have not been updated since Census 2000. As a result, data for urban and rural areas from the ACS do not necessarily reflect the results of ongoing urbanization.
Explanation of Symbols:1. An '**' entry in the margin of error column indicates that either no sample observations or too few sample observations were available to compute a standard error and thus the margin of error. A statistical test is not appropriate.2. An '-' entry in the estimate column indicates that either no sample observations or too few sample observations were available to compute an estimate, or a ratio of medians cannot be calculated because one or both of the median estimates falls in the lowest interval or upper interval of an open-ended distribution.3. An '-' following a median estimate means the median falls in the lowest interval of an open-ended distribution.4. An '+' following a median estimate means the median falls in the upper interval of an open-ended distribution.5. An '***' entry in the margin of error column indicates that the median falls in the lowest interval or upper interval of an open-ended distribution. A statistical test is not appropriate.6. An '*****' entry in the margin of error column indicates that the estimate is controlled. A statistical test for sampling variability is not appropriate.7. An 'N' entry in the estimate and margin of error columns indicates that data for this geographic area cannot be displayed because the number of sample cases is too small.8. An '(X)' means that the estimate is not applicable or not available."
This is one of four reports that have been adapted from the ACS "Data Profile" (DP) Series. The four DP tables published by the Census Bureau are: DP02 Selected Social Characteristics; DP03 Selected Economic Characteristics; DP04 Selected Housing Characteristics; DP05 Demographic and Housing Estimates.
DPD has adapted these DP tables for reporting ACS estimates for locally-defined geographies. The locally defined areas covered in these reports are made up of multiple census tracts (except for a few Community Reporting Areas that are made up of only one Census Tract each), therefore estimates shown for these geographies are based on aggregating estimates for multiple census tracts. For ease of calculation, medians are the average of the medians.
¹The ACS is a sample survey and as such, estimates carry sampling error. Margins of error (MOEs) provide a measure of sampling error
The MOEs displayed for the aggregated estimates in these reports could only be approximated using the formulas provided by the Census Bureau. These formulas do not account for “covariance” (or inter-relationship) between the aggregated estimates, and can understate or—more commonly—overstate the margins of error. In some cases, actual MOEs may be much different than approximated. MOEs of +/- 0.1 and below are displayed as +/- 0.1 based on Census Bureau convention.
² The reliability indicator of High, Moderate, or Low is meant to provide a general sense of an estimate's reliability. Data users will need to use discretion in identifying the level of reliability appropriate for their purposes.
“High” reliability: MOE is less than or equal to 20% of the estimate. Indicates that sampling error is small relative to the size of the estimate. Flagged green."Moderate” reliability: MOE is between 20% and 66.7% of the estimate. Flagged yellow to indicate that the estimate should be used with caution."Low” reliability: MOE is over 66.7% of the estimate. Flagged red to warn that sampling error is large relative to the estimate and that the estimate is very unreliable."NC": Estimate is 0. Reliability cannot be calculated.
Percent Margin of Error "W" value indicates the standard formula for estimating the percent MOE could not be applied (due to negative value under square root).
For more about MOEs, see Census Bureau notes below. For formulas, see “American Community Survey Multiyear Accuracy of the Data (3-year 2008-2010 and 5-year 2006-2010),” http://www.census.gov/acs/www/Downloads/data_documentation/Accuracy/MultiyearACSAccuracyofData2010.pdf.)
Census Bureau notes for DP02:
Notes:
Source:
Produced by:

Selected Social Characteristics (DP02)2006-2010 American Community Survey 5-Year Estimates (Not decennial census counts. See notes after table.)
Council District # 7
Subject EstimateEstimate
Margin of Error ¹ PercentPercent
Margin of Error ¹ Reliability ²
High
High
High
High
High
High
Moderate
Moderate
Moderate
Moderate
Low
High
Moderate
High
High
High
High
High
High
High
High
High
High
Moderate
High
High
High
High
Moderate
High
High
High
High
High
Low
Low
Low
NC
Low
Low
+/- 507
+/- 222
13.6%
+/- 728
+/- 616
+/- 376
+/- 574
+/- 317
+/- 210
+/- 119
+/- 256
+/- 227
+/- 871
+/- 881
+/- 396
+/- 379
+/- 379
+/- 0.02
+/- 0.03
+/- 1,518
+/- 728
+/- 275
+/- 869
+/- 406
+/- 568
+/- 584
+/- 1,464
+/- 1,289
+/- 122
+/- 1,149
+/- 921
+/- 595
+/- 61
+/-123
+/- 293
+/- 230
+/- 186
+/- 190
+/- 369
+/- 380
29.3%
10.5%
24.8%
8.3%
1.2%
0.4%
3.3%
1.8%
70.7%
59.1%
9.0%
10.7%
14.8%
100.0%
61.9%
1.3%
9.3%
4.2%
15.3%
12.1%
100.0%
51.4%
1.0%
100.0%
43.6%
34.7%
6.5%
1.5%
X
X
X
100.0%
+/- 619
X
34.8%
+/- 156 1.4%
+/- 529 11.5%
High
High
49,282
14,433
5,157
12,228
4,103
581
173
1,624
881
34,849
29,147
4,420
5,264
7,300
1.62
2.59
79,627
49,282
1,066
7,422
3,383
12,213
9,644
38,951
20,008
5,107
882
383
37,486
16,343
13,017
75
0
2,451
4
568
34
40
33
13,554
537
4,469
X
X
X
100.0%
8.5%
X
X
X
X
X
X
X
X
X
X
X
X
Total Households:
Family Households (families)
With Own Children under 18 years
Married Couple Family
With Own Children under 18 years
Male householder, no wife present
With Own Children under 18 years
Female householder, no husband present
With Own Children under 18 years
Nonfamily Households
Householder Living Alone
65 years and over
Households with one or more people under 18 years
Households with one or more people 65 years and over
Average Household Size:
Average Family Size:
Population in Households:
Number of women 15 to 50 years old who had a birth in the past 12 months:
Unmarried women (widowed, divorced, and never married)
Per 1,000 unmarried women
Per 1,000 women 15 to 50 years old
Per 1,000 women 15 to 19 years old
Per 1,000 women 20 to 34 years old
Per 1,000 women 35 to 50 years old
Males 15 and over:
Never married
Now married, except separated
Separated
Widowed
Divorced
Females 15 and over:
Never married
Now married, except separated
Separated
Widowed
Divorced
Householder
Spouse
Child
Other Relatives
Nonrelatives
Unmarried Partner
MARITAL STATUS
HOUSEHOLDS BY TYPE
RELATIONSHIP
FERTILITY
+/-1.2
+/-0.7
+/-1.1
+/-0.6
+/-0.4
+/-0.2
+/-0.5
+/-0.5
+/-1.4
+/-1.6
+/-0.8
+/-0.8
+/-0.7
W
+/-0.7
+/-0.7
+/-0.3
+/-1.1
+/-0.5
+/-2.7
+/-0.9
+/-0.3
+/-0.4
+/-1.3
+/-2.1
+/-1.2
+/-0.5
+/-0.8
+/-1.3
+/-6.6
7/10/2014
Page 1 of 5DP02 Selected Social Characteristics, 2006-2010 American Community Survey
7Geographic Area:

Council District # 7
Subject EstimateEstimate
Margin of Error ¹ PercentPercent
Margin of Error ¹ Reliability ²
Moderate
Low
NC
Low
NC
Low
Low
Low
+/- 167
+/- 108
+/-123
+/- 24
+/-123
+/- 105
+/- 76
+/- 103
100.0%
44.0%
0.0%
5.0%
0.0%
38.9%
74.8%
78.6%
298
131
0
15
0
116
98
103
Low+/- 108 100.0%131
High
Moderate
Moderate
High
High
High
100.0%
6.4%
4.2%
18.6%
9.2%
61.5%
15,130
968
640
2,821
1,397
9,304
+/- 1,136
+/- 201
+/- 162
+/- 375
+/- 268
+/- 1,043
X
X
X
High
High
High
Moderate
Moderate
High
High
High
High
High
High
High
100.0%
1.7%
2.6%
16.5%
6.3%
37.9%
25.4%
7.9%
X
9.6%
X100.0%
66,407
1,111
1,721
10,979
4,184
25,173
16,885
95.7%
63.3%
5,909
6,354
75,131
+/- 1,608
+/- 255
+/- 382
+/- 708
+/- 801
+/- 509
+/- 1,049
+/- 901
+/- 0.7
+/- 1.6
+/- 1,899
+/- 536
Civilian population 18 years and over:
Civilian veterans
Population 25 years and over:
Less than 9th grade
9th to 12th grade, no diploma
High school graduate (includes equivalency)
Some college, no degree
Associate's degree
Bachelor's degree
Graduate or professional degree
Percent high school graduate or higher:
Percent bachelor's degree or higher:
Population 3 years and over enrolled in school:
Nursery school, preschool
Kindergarten
Elementaryschool (grades 1-8)
High school (grades 9-12)
College or graduate school
Number of grandparents living with own grandchildren under 18 years:
Responsible for grandchildren
Responsible less than 1 year
Responsible 1 to 2_years
Responsible 3 to 4 years
Responsible 5 or more years
Who are female
Who are married
Number of grandparents responsible for own grandchildren under 18 years:
GRANDPARENTS
SCHOOL ENROLLMENT
EDUCATIONAL ATTAINMENT
VETERAN STATUS
X
X
X
X
+/-26.6
+/-0.6
+/-7.5
+/-0.6
+/-27.7
W
+/-44.5
+/-1.2
+/-1
+/-2
+/-1.6
+/-5.1
+/-0.4
+/-0.6
+/-1
+/-1.1
+/-0.8
+/-1.3
+/-1.2
+/-0.7
High
High
High
High
High
Moderate
High
Moderate
High
High
High
High
High
High
+/- 1,980
+/- 1,537
+/- 1,623
+/- 1,128
+/- 1,080
+/- 607
+/- 861
+/- 215
+/- 1,832
+/- 1,815
+/- 1,427
+/- 1,449
+/- 337
+/- 962
71.7%
27.5%
16.2%
11.3%
3.1%
8.3%
0.7%
86.6%
84.3%
32.8%
51.5%
2.3%
13.4%
X100.0%
RESIDENCE 1 YEAR AGO
PLACE OF BIRTH
82,641
59,284
22,754
13,376
9,378
2,531
6,847
603
72,261
70,325
27,340
42,985
1,936
11,202
High+/- 2,002 100.0%83,463 X
Population 1 year and over:
Same house
Different house in the U.S.
Same county
Different county
Same state
Different state
Abroad
Native
Born in the U.S.
State of residence
Different state
Born in Puerto Rico, U.S. Island areas, or born abroad to American parents
Foreign born
Total Population:
+/-0.7
+/-1.8
+/-1.3
+/-1.3
+/-0.7
+/-1
+/-0.3
+/-0.7
+/-0.8
+/-1.5
+/-1.2
+/-0.4
+/-1.1
7/10/2014
Page 2 of 5DP02 Selected Social Characteristics, 2006-2010 American Community Survey
7Geographic Area:

Council District # 7
Subject EstimateEstimate
Margin of Error ¹ PercentPercent
Margin of Error ¹ Reliability ²
Moderate
Moderate
High
High
High
High
Moderate
High
High
High
High
High
High
High
High
High
Moderate
High
High
High
High
High
Moderate
Moderate
Moderate
Moderate
High
High
Moderate
Moderate
Moderate
High
High
Moderate
Moderate
Moderate
High
+/- 614
+/- 454
4.8%
+/- 962
+/- 962
+/- 575
+/- 752
+/- 1,019
+/- 307
+/- 962
+/- 735
+/- 337
+/- 157
+/- 606
+/- 962
+/- 753
+/- 308
+/- 296
+/- 1,958
+/- 246
+/- 696
+/- 1,041
+/- 578
+/- 1,887
+/- 231
+/- 497
+/- 250
+/- 131
+/- 2,002
+/- 329
+/- 215
+/- 175
+/- 319
+/- 399
+/- 774
13.4%
56.1%
100.0%
85.7%
100.0%
41.3%
100.0%
14.3%
58.7%
100.0%
48.9%
9.3%
12.3%
100.0%
14.9%
85.1%
0.4%
100.0%
2.2%
0.6%
0.6%
1.5%
2.6%
12.9%
+/- 352
X
20.5%
+/- 203 5.9%
+/- 162 3.1%
U.S. CITIZENSHIP STATUS
YEAR OF ENTRY
High
High
11,202
11,202
4,922
6,280
13,138
1,659
11,202
4,629
1,936
277
6,573
11,202
3,838
2,517
5,478
1,040
1,381
80,435
658
4,456
12,024
4,251
68,411
889
1,977
800
314
83,463
1,870
481
521
1,288
2,299
657
347
2,140
10,728
WORLD REGION OF BIRTH OF FOREIGN BORN
LANGUAGE SPOKEN AT HOME
High
Moderate
Moderate
High
4.0%
1.2%
19.9%
0.8%
0.7%
13.0%
3,342
996
16,638
637
594
10,815
+/- 479
+/- 291
+/- 1,044
+/- 212
+/- 187
+/- 808
X
3.1%
0.8%
X
X
X
High
High
Moderate
High
Moderate
High
5.8%
0.4%
5.6%
0.3%
2.2%
3.1%
4,852
362
4,687
280
1,837
2,619
+/- 555
+/- 156
+/- 531
+/- 395
+/- 106
+/- 339
ANCESTRY
Foreign born
Foreign-born population:
Naturalized U.S. citizen
Not a U.S. citizen
Population born outside the U.S.:
Native:
Entered 2000 or later
Entered before 2000
Foreign born population:
Entered 2000 or later
Entered before 2000
Foreign-born, excluding born at sea:
Europe
Asia
Africa
Oceania
Latin America
Northern America
Population 5 years and over:
English only
Language other than English
Speak English less than "very well"
Spanish
Other Indo-European lanugages
Asian and Pacific Islander languages
Other languages
Speak English less than "very well"
Speak English less than "very well"
Speak English less than "very well"
Speak English less than "very well"
Total Population:
American
Arab
Czech
Danish
Dutch
English
French (except Basque)
French Canadian
German
Greek
Hungarian
Irish
Italian
Lithuanian
Norwegian
Polish
Portuguese
Russian
100.0%
43.9%
5.3%
1.1%
5.5%
2.5%
1.0%
X
+/-1.1
+/-7.7
+/-5.4
+/-5.5
+/-2.6
+/-5.2
+/-1.7
+/-1.4
+/-2.4
+/-2.6
+/-1.1
+/-1.2
+/-0.8
+/-0.3
+/-0.4
+/-0.3
+/-0.2
+/-0.4
+/-0.5
+/-0.9
+/-0.3
+/-1.2
+/-0.3
+/-0.2
+/-0.9
+/-0.2
+/-0.6
+/-0.5
+/-0.1
+/-0.4
+/-3.5
+/-4.7
+/-2
+/-0.6
+/-0.7
+/-0.3
+/-0.9
+/-0.6
+/-0.3
+/-0.2
+/-0.6
+/-0.7
X
7/10/2014
Page 3 of 5DP02 Selected Social Characteristics, 2006-2010 American Community Survey
7Geographic Area:

Council District # 7
Subject EstimateEstimate
Margin of Error ¹ PercentPercent
Margin of Error ¹ Reliability ²
High
High
High
High
Moderate
Moderate
Moderate
2.2%
2.6%
4.0%
0.8%
4.1%
1,837
2,202
3,358
699
3,390
+/- 339
+/- 333
+/- 444
+/- 426
+/- 244
144
599
Moderate
Moderate
Low
0.4%
1.5%
0.1%
331
1,233
43
+/- 122
+/- 258
+/- 40
Russian
Scotch Irish
Scottish
Slovak
Subsaharan African
Swedish
Swiss
Ukrainian
Welsh
West Indian (except Hispanic origin groups)
0.2%
0.7%
+/- 94
+/- 201
+/-0.1
+/-0.2
+/-0.4
+/-0.4
+/-0.5
+/-0.3
+/-0.5
+/-0.1
+/-0.3
+/-0.1
7/10/2014
Page 4 of 5DP02 Selected Social Characteristics, 2006-2010 American Community Survey
7Geographic Area:

U.S. Census Bureau, 2006-2010 American Community Survey (ACS), 5-Year estimates
City of Seattle, Department of Planning and Development (DPD)On the Web at: http://www.seattle.gov/dpd/Research/Population_Demographics/Overview/
Supporting documentation on code lists, subject definitions, data accuracy, and statistical testing can be found on the American Community Survey website in the Data and Documentation section.
Sample size and data quality measures (including coverage rates, allocation rates, and response rates) can be found on the American Community Survey website in the Methodology section.
Although the American Community Survey (ACS) produces population, demographic and housing unit estimates, for 2010, the 2010 Census provides the official counts of the population and housing units for the nation, states, counties, cities and towns. For 2006 to 2009, the Population Estimates Program provides intercensal estimates of the population for the nation, states, and counties.
Data are based on a sample and are subject to sampling variability. The degree of uncertainty for an estimate arising from sampling variability is represented through the use of a margin of error. The value shown here is the 90 percent margin of error. The margin of error can be interpreted roughly as providing a 90 percent probability that the interval defined by the estimate minus the margin of error and the estimate plus the margin of error (the lower and upper confidence bounds) contains the true value. In addition to sampling variability, the ACS estimates are subject to nonsampling error (for a discussion of nonsampling variability, see Accuracy of the Data). The effect of nonsampling error is not represented in these tables.
While the 2006-2010 American Community Survey (ACS) data generally reflect the December 2009 Office of Management and Budget (OMB) definitions of metropolitan and micropolitan statistical areas; in certain instances the names, codes, and boundaries of the principal cities shown in ACS tables may differ from the OMB definitions due to differences in the effective dates of the geographic entities.
Estimates of urban and rural population, housing units, and characteristics reflect boundaries of urban areas defined based on Census 2000 data. Boundaries for urban areas have not been updated since Census 2000. As a result, data for urban and rural areas from the ACS do not necessarily reflect the results of ongoing urbanization.
Explanation of Symbols:1. An '**' entry in the margin of error column indicates that either no sample observations or too few sample observations were available to compute a standard error and thus the margin of error. A statistical test is not appropriate.2. An '-' entry in the estimate column indicates that either no sample observations or too few sample observations were available to compute an estimate, or a ratio of medians cannot be calculated because one or both of the median estimates falls in the lowest interval or upper interval of an open-ended distribution.3. An '-' following a median estimate means the median falls in the lowest interval of an open-ended distribution.4. An '+' following a median estimate means the median falls in the upper interval of an open-ended distribution.5. An '***' entry in the margin of error column indicates that the median falls in the lowest interval or upper interval of an open-ended distribution. A statistical test is not appropriate.6. An '*****' entry in the margin of error column indicates that the estimate is controlled. A statistical test for sampling variability is not appropriate.7. An 'N' entry in the estimate and margin of error columns indicates that data for this geographic area cannot be displayed because the number of sample cases is too small.8. An '(X)' means that the estimate is not applicable or not available."
This is one of four reports that have been adapted from the ACS "Data Profile" (DP) Series. The four DP tables published by the Census Bureau are: DP02 Selected Social Characteristics; DP03 Selected Economic Characteristics; DP04 Selected Housing Characteristics; DP05 Demographic and Housing Estimates.
DPD has adapted these DP tables for reporting ACS estimates for locally-defined geographies. The locally defined areas covered in these reports are made up of multiple census tracts (except for a few Community Reporting Areas that are made up of only one Census Tract each), therefore estimates shown for these geographies are based on aggregating estimates for multiple census tracts. For ease of calculation, medians are the average of the medians.
¹The ACS is a sample survey and as such, estimates carry sampling error. Margins of error (MOEs) provide a measure of sampling error
The MOEs displayed for the aggregated estimates in these reports could only be approximated using the formulas provided by the Census Bureau. These formulas do not account for “covariance” (or inter-relationship) between the aggregated estimates, and can understate or—more commonly—overstate the margins of error. In some cases, actual MOEs may be much different than approximated. MOEs of +/- 0.1 and below are displayed as +/- 0.1 based on Census Bureau convention.
² The reliability indicator of High, Moderate, or Low is meant to provide a general sense of an estimate's reliability. Data users will need to use discretion in identifying the level of reliability appropriate for their purposes.
“High” reliability: MOE is less than or equal to 20% of the estimate. Indicates that sampling error is small relative to the size of the estimate. Flagged green."Moderate” reliability: MOE is between 20% and 66.7% of the estimate. Flagged yellow to indicate that the estimate should be used with caution."Low” reliability: MOE is over 66.7% of the estimate. Flagged red to warn that sampling error is large relative to the estimate and that the estimate is very unreliable."NC": Estimate is 0. Reliability cannot be calculated.
Percent Margin of Error "W" value indicates the standard formula for estimating the percent MOE could not be applied (due to negative value under square root).
For more about MOEs, see Census Bureau notes below. For formulas, see “American Community Survey Multiyear Accuracy of the Data (3-year 2008-2010 and 5-year 2006-2010),” http://www.census.gov/acs/www/Downloads/data_documentation/Accuracy/MultiyearACSAccuracyofData2010.pdf.)
Census Bureau notes for DP02:
Notes:
Source:
Produced by: