selection by attainment and aptitude in english secondary schools
TRANSCRIPT

Selection by attainment and aptitude in Englishsecondary schools in 2006
John Coldron, Ben Willis, Claire Wolstenholme
Centre for Education and Inclusion Research
Sheffield Hallam University
Paper presented at the British Educational Research AssociationAnnual Conference, Heriot-Watt University, Edinburgh, 3-6 September
2008
Contact: [email protected]

2
AbstractSince 1997 the Labour government's policy has been to allow grammar schools tocontinue but for no more such schools to be introduced. The same applied toschools that selected part of their intake by attainment. At the same time thespecialist school programme has been greatly expanded and these schools havebeen allowed to select up to 10% of their intake on the basis of aptitude in aspecialist subject. There has been considerable debate about whether selectionby aptitude is significantly distinct from selection by attainment (Education andSkills Select Committee 2004; West and Hind 2003). In 2000 (Flatley et al 2001)and 2001 (West and Hind 2003) reasonable estimates were made of the numberof schools selecting by aptitude but none since the expansion of the numbers ofspecialist schools. Behind these debates is the concern that both kinds ofselection are unjust and lead to greater educational and social inequality. Thispaper reports on the results of a study of the admission arrangements for allsecondary schools in England in 2006 together with a nationally representativesurvey of parents who had applied for a secondary school place for September2006. It provides an update on the admission arrangements of all maintainedsecondary schools that select all or part of their intake by attainment/ability oraptitude. The paper reports on how many schools in England selected byattainment in 2006 and the proportions of children within each Local Authority soselected. It reveals that in the most highly selective authorities the proportionsrange from 19% to 39% and that some are affecting the intakes not only of thepopulation in their Local Authority but also substantially in that of neighbouringauthorities. The first comprehensive analysis is made of all schools that selectpart of their intake by attainment. Also, prior to this study we only had out of dateestimates of the proportion of schools that select by aptitude. This study presentsan up to date count of these schools, the methods they use for testing and theproportions of their intakes selected. The debate concerning the similaritybetween selection by aptitude and by attainment is critically reviewed and it isargued that they differ significantly in the social narrative they support but aresimilar in their contribution to social segregation.
IntroductionThe sorting of pupils into different schools that takes place at the point of transition(usually at the age of 11) between the primary and secondary stages is ofconsiderable interest to academics, policy makers, children and parents. Itcurrently results in socially segregated schooling and this has a significant impacton the overall attainment, efficiency, effectiveness and legitimacy of the systemand on social justice. This sorting is a result of many inter-related generativemechanisms, but the admission criteria adopted by schools are a significantelement. This paper concentrates on just two such criteria, attainment and aptitude,but we seek to keep in mind their place in the context of the wider social sorting ofEnglish secondary schools pupils.
There is strong evidence that highly differentiated systems have no significantbeneficial effect on the average attainment of pupils, are less educationallyeffective, relative to less selective systems, and that sorting pupils by attainmentnegatively affects equality of opportunity (OECD/UNESCO-UIS 2003; Schagen

3
and Schagen 2003; Atkinson and Gregg 2004). Selective education is a politicallysensitive topic in England with neither of the major parties willing to take on thestrong pro-selection lobby (McCaig 2000) despite an explicit acceptance of thefactual case against. Although, refusing to advocate the abolition of existinggrammar schools, Children's Secretary Ed Balls recently stated, 'let me make itclear I do not like selection' (DCSF 2008). Moreover, David Cameron provedcontroversial with Conservative traditionalists when refusing to back the principleof grammar schools declaring such a policy had been a 'chain around our necks'(BBC 2007).
Given the continuing struggles and debates around the preservation of selectiveeducation systems in England, it is of interest to know precisely how muchselection (attainment or aptitude) remains. After presenting a brief history ofselective education, this paper draws on a recent study mapping the admissionarrangements in all English secondary schools in 2006 to answer questions ofscale and extent.
Selection by attainment: BackgroundEducation policy in 19th-century England was structured in such a way as toperpetuate class differences, with broadly three separate kinds of school systems,'the elementary schools for the working class, secondary for the middle class andprivate public schools for the ruling class' (Ball 2008, p 61). This socialsegregation was effectively allowed to continue by the 1944 Education Act (Ball2003; McCaig 2000). The private fee paying sector was allowed to continue andcurrently approximately 7% of all children opt out of the publicly funded sector toattend fee paying schools. More progressively the 1944 Act introduced freesecondary schooling for all but it did so in the form of 'tripartism' whereby modern,technical and grammar schools would be 'equal but different'. Secondaryschooling was no longer to be restricted to those with the ability to pay or on thebasis of social status but was the right of all. However, it constructed children asbeing on a continuum of ability - those with higher ability (defined as in the upperquartile of a normal distribution curve) requiring an academic education in aGrammar school while the needs of the remaining three quarters with less abilitywere deemed better met by either a technical education in a Technical school or amore practical education in a Secondary Modern. Ability was determined by a testtaken at 11, the ‘eleven plus’.
In the event very few technical schools were established and it quickly became apredominantly bipartite system with grammar schools populated largely by themiddle class and secondary modern schools by lower socio-economic groups(Crook et al 1999, p.11). Equality of esteem was never established and theselection process favoured the more affluent children. The new secondaryschools brought in by the 1944 Act in effect catered for different sections of society,with different curricula and entrance requirements.
The selective system attracted criticism for the perceived role it played inexacerbating the existing class divide (Banks 1955) and from middle class and‘aspirational’ working class parents who feared that a lack of grammar schoolplaces would consign their children to secondary moderns, which were 'clearly

4
regarded as second best’ (Ball 2008, p.69). In the face of mounting evidence thatthe selective system was not functioning well in terms of equal opportunity,meeting the needs of parents or meeting the need for an increasingly educatedworkforce there was growing support for comprehensive schools which did notselect or separate their intake. By the late 1950’s a limited number of LocalEducation Authorities (LEAs), including London, Coventry and Bristol hadresponded by implementing ‘experimental’ comprehensives (Crook et al 1999).These tended to be purpose built 11-18 schools that typically served ‘areas of newhousing’ (Crook et al 1999, p.12). In 1965, the newly elected Labour governmentintroduced a non-statutory circular 10/65 (DES 1965), requesting but notcompelling all LEAs to submit plans to provide comprehensive places.
Although subsequently dismissed by the Conservative government’s circular 10/70(DES 1970) there remained a clear 'momentum' towards comprehensivisation(Crook et al 1999, p.14). Indeed, despite being opposed in principle to this trend,Margaret Thatcher's tenure as Education Secretary coincided with the creation ofmore comprehensives than any other before or after (Benn and Chitty 1997).During this period, although some were closed, the majority of grammar schoolsmerged with secondary moderns to form large neighbourhood comprehensiveschools. In 1971, 18.4% of secondary pupils between 11 and 16 attendedgrammar schools, by 1980 this figure had reduced to 3.7% (Social Trends 1981,p.48). The 1976 Education Act introduced by Labour hastened this trend byformally preventing selection by ability or aptitude.
'Education is to be provided only in schools where the arrangements for theadmission of pupils are not based wholly or partly on selection by referenceto ability or aptitude'. (Preamble to the act).
As a consequence of this impetus, from 1965 to 1981 the proportion of 11-16 yearolds in 'comprehensive' (free, non-selective) schools rose from about 8% to 83%under both Labour and Conservative governments (Ball 2008).
Despite the seemingly inexorable move towards comprehensivisation, there wasresistance. The Critical Quarterly Society produced a series of 'Black papers'between 1969 and the late seventies that offered a 'stout defence of selection',critiqued liberal educational views and questioned the effectiveness ofcomprehensive schooling (Ball 2008, p.71). Moreover, James Callaghan's 1976Ruskin College speech which precipitated the 'Great Debate' was widelyinterpreted as a 'major political attack on Britain's schools' and further underminedconfidence in an increasingly comprehensive based education system (O'Connor1987, p.2). Returning to government in 1979 the Conservatives reacted byintroducing the 1980 Education Act which removed the embargo on selection inthe 1976 Act and permitted grammar schools to select their intakes ensuring thatfor the ‘first time the 11-plus had... been enshrined formally in law' (Benn andChitty 1997, p.12).
Although, most LEAs resisted returning to selective systems, what constitutedcomprehensive schooling became increasingly blurred as central governmentpolicies sought to endorse ‘choice’ and ‘diversity’ (Crook et al 1999, p.16). Thistook on a variety of forms and led some to contend that choice had become a

5
‘substitute’ for selection and as a vehicle to open up the opportunity for a partialreturn to selection, something that a minority of schools took up (Benn and Chitty1997). Responding to a parliamentary question about the plans for selection theConservative government’s response was as follows;
‘Schools which select by ability or which specialise in particular subjects,have an important part to play in giving parents a choice of schooling fortheir children...we believe it is up to local authorities, controlled (voluntary)schools and...grant maintained schools to make proposals for selectiveeducation if they believe that it meets the demands of the parents in thearea (HC debate1995)
Although making some attempt to 'soften' the quasi-market of secondaryeducation, New Labour's approach can be seen largely as a continuation of pre-existing Conservative policies (West and Pennel 2002). Expanding 'choice' and'diversity' remained firmly on the policy agenda as a perceived means ofmodernising and driving up standards for comprehensive education (Edwards andTomlinson 2002). Despite appearing to be resolutely against selection while inopposition, when re-elected, New Labour were reluctant to get directly involvedwith ending selection. Instead they introduced a 'complex' parental ballotingsystem that gave individual communities the opportunity to remove grammarschools, effectively distancing the government (Tulloch 2006).
Such a non-interventionist approach is in-spite of evidence that suggests currentselection by attainment exacerbates the social segregation of schools without anyoverall educational benefit. Schagen and Schagen (2002; 2003 and 2003a) andAtkinson and Gregg (2004) found that while standards at school level (i.e. betweengrammar and secondary modern schools) were very different (in favour ofgrammars) the standard at LEA level showed little difference compared with non-selective LEAs. However grammar schools are strongly associated with socialsegregation. They are populated by the more affluent while secondary modernschools are populated by the less affluent. Just 5.8% of all pupils eligible for freeschool meals attend grammar schools compared to 26.4% of all other groups.Twelve percent of pupils in secondary modern schools are on free school mealsand only 2% in grammar schools. Further, grammar school selection is not solelyon the basis of ability. Atkinson and Gregg (2004) found that if you were of highability but poor you would stand less chance of gaining a place, with poorerchildren with the same underlying ability only half as likely to attend a grammarschool as other children. This is compounded by grammar schools receiving moreresources per child than secondary modern schools (Levacic and Marsh 2007).Selection by attainment also imposes a widespread sense of failure on those whoare not ‘selected’ contributing to disrespect and social stigma of social groups andindividuals (see Ireson and Hallam 2001 for an overview).
Selection by aptitude: BackgroundSelection by aptitude was introduced as a part of the specialist schoolsprogramme. This was launched in 1994 by the Conservative government in orderto encourage secondary schools to specialise in certain subject areas as a meansof increasing diversity and choice. New Labour continued the policy and it becamepart of their agenda of modernising comprehensive secondary education to create

6
an education system that would, as Edwards and Whitty (1997) summarised thepolicy, 'cater for individual strengths’ rather than offering a ‘bland sameness for all'.(Edwards and Whitty 1997). Schools can apply for specialist status in any of tensubjects: Arts, Humanities, Languages, Music, Sports, Technology and, sinceSeptember 2002, Business and Enterprise, Engineering, Mathematics andComputing and Science. Advocates of the specialist schools programme point toa widened diversity of education and expansion of parental choice.
This push for diversity assumes a parental demand for variety in schooling as abasis for choice and that specialist schools provide this1. However there was lessemphasis in New Labour policy on potential selection and legislation wasintroduced to cap the proportion of a schools intake selected by aptitude. Theoriginal conservative government plan in 1996 was to allow schools to select up to20% of their intake by aptitude, this figure rising to 30% for technology collegesand even as high as 50% for some grant maintained schools (Edwards and Whitty1997). The 1998 School Standards and Framework act, authorised secondaryschools to select a maximum of 10% of their intake on the basis of aptitude andonly for certain subjects2. Following criticism that even this 10% was being usedunfairly to select children with high general attainment and socially advantagedbackgrounds, any new selection by aptitude was further restricted to the followingsubjects, Physical Education or a Sport, the Performing and/or Visual Arts,Languages, Design and Technology, Information Technology and Music. Priorselection by aptitude in subjects other than these was allowed to continue.
The specialist schools and academies trust is responsible for the delivery of theprogramme. In 2006 66% of English secondary schools were designatedspecialists. By 2007 specialist school status had been granted to over 2690specialist schools in England, accounting for about 85% of all secondary schools(Teachernet 2007). Currently (June 2008) 92% of secondary schools arespecialist, and in 33 local authorities 100% of their schools are so designated(DCSF 2008a). This means over 2.5 million secondary school pupils in Englandare attending a specialist school3.
In order to gain specialist school status, schools must demonstrate 'at leastreasonable', and preferably high, levels of attainment by pupils in the subject areadesignated for specialism. In addition schools must raise £50,000 in private sectorsponsorship. There is a significant financial incentive for schools to becomespecialist; a designated school receives £100,000 (per application) for a project toenhance the facilities in the subject related to the schools specialism. In additionthey offer recurrent funding of £129 per pupil per year (DCSF 2008a). Schools inspecial measures or schools with low and declining exam results cannot becomespecialist. Significantly, schools that select by attainment can also select byaptitude.
1 Our research calls both assumptions into question. See Coldron et al for a full discussion of the notion of diversity and thesurvey results on parental knowledge of and response to diversity.2 This right not only applies to schools in the Specialist Schools Programme; any admission authority may decide to givepriority in this way although it appears to be the case that schools currently choosing to select by aptitude are predominantlydesignated specialist. We have not currently calculated how many non specialist schools select their intake on the basis ofaptitude however numbers are thought to be very low.3
Scotland, Wales and Northern Island control their own education systems and at present Northern Ireland have only 34
schools designated as specialists and there are no specialist schools in Scotland or Wales.

7
There are important differences between selection to specialist schools by aptitudeand selection to a grammar school. The distinction we wish to draw is not on whatis purported to be measured (it is difficult to find a definition of aptitude that issufficiently distinct from ability) nor on the systematic bias toward selectingchildren from higher socio-economic families (selection by aptitude will alsocontribute to social segregation), but rather on the meaning or symbolic effect(Coldron et al 2008). Grammar schools maintain and reinforce an explicit structuraland symbolic hierarchy of schooling that contributes significantly to unequaloutcomes and the inevitable denigration described earlier. The narrative in whichthey are embedded is that of ability – deemed to be an objectively verifiable,unchangeable and fateful attribute that evokes different life paths starting withbeing allocated to a grammar or secondary modern - and this narrative is imposedon all children within an area that is highly selective4. It is experienced collectivelyas a member of the selected few or the rejected many. Specialist schools’selection by aptitude on the other hand is part of a different narrative – that ofindividual achievement and extraordinary talent. Selection on the basis of aptitudeis likely therefore to be far less stigmatising for those failing to be selected.Nevertheless both selection by aptitude and attainment allows some alreadypopular schools to manage their intakes to include easier to educate children fromalready advantaged backgrounds.
The scale and extent of selection by attainmentThe Department for Children, Schools and Families (DCSF) commissionedSheffield Hallam University, in conjunction with NatCen to map and measure theeffectiveness of the admission arrangements of all maintained secondary schoolsin England in 2006 and to assess the experiences, views and expectations ofparents and carers who applied for a place. We gathered details of admissionarrangements for all maintained schools from the composite prospectuses sent toparents by each Local Authority (LA) in England and conducted a survey of anationally representative sample of parents and carers who had applied for a placein the first year of secondary school beginning in September 2006. We alsogathered data on outcomes by requesting from each LA what proportion of parentsgained which of their preferences on the national allocation day and whatproportion had expressed no preference. The results were analysed for each LAin relation to secondary data on population density, level of cross border traffic,appeals and segregation between schools.
Authorities with selective schoolsThere are 43 local authorities with schools that use selection by prior attainmentas part of their admissions criteria but they differ markedly in the intensity and inthe impact selection has on the majority. Some schools (grammar) select all andsome (partially selective schools) part of their intake by attainment as measured ina test. In order to adequately describe and assess the impact of selection in aparticular local authority, it is necessary to take account of all selective places inthe area. Table 1 gives the proportions of selective places available calculated
4 A definition of a highly selective area is not straightforward but in our study we took this to be one wherethe proportion of selective places is approximately 20% or more which in effect means that all schools in thearea are significantly affected such that the non-grammar schools have what could be called a secondarymodern intake.

8
from the planned admission number of each school in each of the 43 authoritieswith selective schools. The darker shaded areas have over 25% of selectiveplaces and would be ‘wholly selective’ on one of the definitions sometimes used.But this definition obscures three important facts, first that there are otherauthorities with high proportions of selective places just below this threshold (e.g.the six lightly shaded areas with about a fifth of their places being selective);second, that the proportion of selective places is well above 25% in seven of theeight most highly selective LAs; and third that the effect of smaller proportions ofselective places on the intakes of other schools may still be significant.

9
Table 1 Selective places available (PAN) in local authorities with selectiveschools**
TotalPlaces
SelectivePlaces
%SelectivePlaces
1 Trafford 3066 1200 392 Southend-on-Sea 2178 750 343 Buckinghamshire 5794 1980 344 Slough 1557 530 345 Kent 16781 4830 296 Bexley 3451 991 297 Sutton 2641 737 288 Medway 3714 954 269 Lincolnshire 8665 2065 2410 Poole 1705 360 2111 Wirral 4472 938 2112 Reading 1127 234 2113 Kingston upon Thames 1441 284 2014 Torbay 1275 240 1915 Bournemouth 1888 312 1716 Barnet 3513 569 1617 Plymouth 3217 414 1318 Calderdale 2763 310 1119 Gloucestershire 7251 810 1120 Wandsworth 1926 194 1021 Birmingham 13033 999 822 Warwickshire 6495 428 723 Telford and Wrekin 2230 146 724 Bromley 3919 242 625 Enfield 3473 180 526 Walsall 3864 192 527 Wiltshire 5558 248 528 North Yorkshire 8123 340 429 Stoke-on-Trent 2891 120 430 Croydon 3776 138 431 Wolverhampton 3008 108 432 Lancashire 14667 524 433 Hertfordshire 13802 434 334 Kirklees 5158 150 335 Essex 17212 484 336 Liverpool 6063 161 337 Cumbria 6726 120 238 Devon 8209 120 239 Redbridge 3246 27 140 Surrey 10891 85 141 Southwark 2416 18 142 Peterborough 2412 12 143 Dudley 4135 16 0**NB Includes places in wholly and partially selective schools
10
The effects of any particular admission arrangements (including this kind ofselection) are highly dependent on local context. It is useful therefore to distinguishthe different contexts of selective places. To do this properly for each of theauthorities would require analysis at a level of detail beyond the scope of thispaper. Nevertheless we can usefully distinguish four broad categories. First, thereare highly selective/high impact/explicitly selective areas. These are areas with aminimum of 20% selective places and selection is likely to impact not only on theirown schools but also on surrounding LA areas, effectively creating a grammar andsecondary modern system within a wider area. Second, there are nominallycomprehensive areas with some grammar schools recruiting effectively from thewhole area. These are local authorities with between 10% and 17% of selectiveplaces which are likely to significantly affect the balance of attainment of the intakeof all other schools but not so radically as to describe them as secondary modernintakes. Third there are areas, where the proportion of selective places is smallbut concentrated in particular towns or cities such that they recruit from a relativelyrestricted area creating grammar and secondary modern school enclaves in awider comprehensive context. Finally, there are the comprehensive areas withisolated but prestigious grammar schools that recruit from a wide area but leavethe intake of nearby comprehensive schools relatively unaffected.
Methods of entry to selective testsThe way children get to access the 11+ test forms a significant part of the processof admission to selective schools. The test provides a child with the opportunity todemonstrate their 'ability' and forms the basis upon which decisions are madeabout which children get to attend the usually over-subscribed selective schools.Any form of disparity in how children get to access the 11+ test would seem to bepotentially discriminatory. Flatley et al (2001) found there to be three methods inhighly selective areas. One was the universal opt out system where all childrenwere automatically tested in their primary schools or elsewhere, thereby creatingno obvious equity issues beyond those generally associated with selectivesystems. A second method was where parents were invited to opt in to the test. Inthis case they had to apply to the school for their child to be entered for the testwhich was held in a place other than the primary school and at a given time whichwas often a weekend. Finally, in 2001, some areas entered children on theprimary school’s recommendation (with parents able to include them by request).As is highlighted in Table 2 below, we found in 2006 that only the first two systemswere in operation amongst the fourteen most selective areas. It was prominenthow the vast majority of highly selective LAs were opt-in raising the potential forinequity in the areas with non-universal entry.

11
Table 2: Method of entry for 11+ within the 14 most selective areas
Local Authority Entry systemTrafford Universal, opt outBuckinghamshire Universal, opt outSlough Opt inSouthend-on-Sea Opt inBexley Opt inKent Universal, opt outSutton Opt inMedway Opt inLincolnshire VariablePoole Opt inReading Opt inWirral Opt inKingston upon Thames Opt inTorbay Opt in
Schools with wholly selective intakes
There are 164 grammar schools in total. The majority (108) are located in the 14most selective authorities. There are more grammar schools that are Foundationschools than any other type (Chart 1).
Chart 1
All grammar schools by type of school
85
35 32
12
00
10
20
30
40
50
60
70
80
90
Foundation Community Voluntary
Aided
Voluntary
Controlled
Academies
Proportionally, grammar schools accounted for 16% of Foundation schools, 7% ofVoluntary Aided schools, and 2.3% of Community/Voluntary Controlled schools. Inline with the increase in the secondary school population there has been a smallincrease in the numbers of children in selective schools. But the proportion hasslightly increased because selective schools have expanded more than otherschools. In 1980 3.7% of secondary school pupils aged 11 to 16 attendedgrammar schools (Social Trends, 1981, p.40) this proportion had increased to3.9% in 2007 (DCSF 2008b). The number of children attending grammar schools

12
between 1997 and 2007 rose from 94,300 to 111,960 (DCSF 2008b); an increaseof 17,660 or the intake of about 12 secondary schools. This represents anincrease in grammar school places of 18.7%, which is significantly more than the8.7% increase in secondary school places across all maintained secondaryschools in the same ten year period5. The new Secretary of State for Educationhas taken steps to prevent secondary schools with selective policies from applyingfor expansion under the ‘successful and popular’ schools initiative so that schoolswith selective arrangements are precluded from applying for monies from theStandards and Diversity Capital Fund to expand their schools (DCSF, 2008c). Thisis not written into primary or secondary legislation but is a matter of policy andtherefore easily reversible.
Partially selective schoolsThe full picture of selection is only gained when all selective places are taken intoaccount– not only those in grammar schools but those in schools that select partof their intake by general ability (as in the figures in Table 1) – and in this sectionwe look more closely at places in partially selective schools. In 2006 we found only37 such schools making only 1% of all secondary schools and they are spreadbetween 20 different local authorities. 19 are Foundation schools, 14 VoluntaryAided and 4 are Community schools. They are found in different types of localauthority with 3 in Outer London, 2 in Inner London, 8 in other Metropolitan areas,and 7 in non-metropolitan areas. The percentage of the school’s intake selectedby general ability ranges from 9% to 43% (mean = 21%). Table 3 details all theschools we found with partially selective intakes. This shows that while partialselection is found in a small minority of schools there are clusters in some areasthat select a substantial proportion and this is likely to have a significant impact onthe balance of intakes within their local context. However, more detailedknowledge of the specific cases would be needed to draw further conclusions.
In 2006, we found there to be 23,994 proposed selective places available for thosetransferring to the first year of secondary school. This amounted to 3.5% of theavailable secondary school places. Partially selective places accounted for 6.3%of the selective places available6.
5Figures quoted for maintained secondary schools; includes grammar schools, CTCs and from 2002 onwards academies.
6It is important to emphasise when considering these figures that they relate to planned admission numbers (obtained via
secondary school admission prospectuses) and are therefore not the same as the number of pupils actually admitted.

13
Table 3: Schools that select part of their intake on general ability/attainment
LocalAuthority
Type ofschool
Name of school %Selectedbyattainment
Bexley C Erith School 20Croydon F The Archbishop Lanfranc School 15Croydon F Shirley High School 15Croydon F Edenham High School 15Croydon VA Riddlesdown High School 15Dorset F Budmouth Technology College 30Dudley VA Old Swinford Hospital 27Essex F The King John School 15Hertfordshire F Queens' School 35Hertfordshire F Rickmansworth School 35Hertfordshire VA Dame Alice Owen's School 33Hertfordshire VA Parmiter's School 35Hertfordshire VA St Clement Danes School 10Hertfordshire VA Watford Grammar School for
Boys35
Hertfordshire VA Watford Grammar School forGirls
35
Kent F The Archbishop's School 15Kent F Homewood School 20Kingston VA The Holy Cross School 13Lincolnshire C King Edward VI Spilsby 25Liverpool VA St Margaret's CofE High School 15Liverpool VA St Hilda's CofE High School 15Peterborough VA The King's School 10Poole F Poole High School 10Reading F Reading Girls' School 24Redbridge F The Chadwell Heath F School 15Southend F Cecil Jones College 10Southend VA St Bernard's High School 43Southend VA St Thomas More High School for
Boys21
Southwark VA St Saviour's & St Olave's CofESchool
15
Surrey F Glyn Technology School 15Surrey F Rosebery School 10Surrey F The Winston Churchill School 9Torbay F Westlands School 25Wandsworth C Ernest Bevin 33Wandsworth F Burntwood School 25Wandsworth F Graveney School 25Warwickshire C Ashlawn School 12

14
Issues associated with selection by attainmentIn the 14 most selective authorities in Table 1 there were, on average, moreappeals, fewer parents gained their first preference and the intakes were moresocially segregated than in all other authorities. On average, in the 14 mostselective Local Authorities around 13% of admissions resulted in an appeal beinglodged (compared with less than 10% in other LAs). 88% of parents gained theirfirst preference school in non-selective authorities compared to just 78% in the 14highly selective authorities. On average the 2004 dissimilarity index (Allen andVignoles, 2006) was substantially larger for the fourteen most selective localauthorities 7 . These findings are in keeping with previous studies that havehighlighted how grammar schools have a significantly more advantaged intakethan other schools in their area (Levacic and Marsh 2007; DCSF 2008b).Furthermore, selective LAs acquired on average a higher proportion of highattaining pupils and lost comparatively more low-attaining pupils (DCSF 2008b).This means that the selective authorities are having an impact on an area muchwider than their own Local Authority.
Selection by aptitude
Extent of selection by aptitude and the types of schools that use itThe proportion of children selected by aptitude has been rising. Flatley et al (2001)found that 1.4% of all secondary schools in 1999 selected by aptitude. By 2001West and Hind (2003) calculated that this had risen to 3%. Since then the numberof schools on the specialist school programme has increased greatly and theproportion of specialist schools that select by aptitude has risen. Of the 2076specialist schools in 2006, we found 12 % of these were selecting their intake onthe basis of aptitude. This is 5 % of all schools.
Currently then, the vast majority of specialist schools choose not to select on thebasis of aptitude but the proportions vary by school type. Academies are the mostlikely to select by aptitude, however total numbers of academies in 2006 were verylow. Foundation schools are the next most likely. A foundation school is six timesmore likely to select by aptitude than schools run by the local authority (i.e.community and voluntary controlled schools). The smaller proportion of VoluntaryControlled and Community schools with specialist status may go some waytowards explaining this.
7 Dissimilarity index for selective authorities (mean = 0.36, median = 0.37) and non-selective authorities(mean & median = 0.27)
15
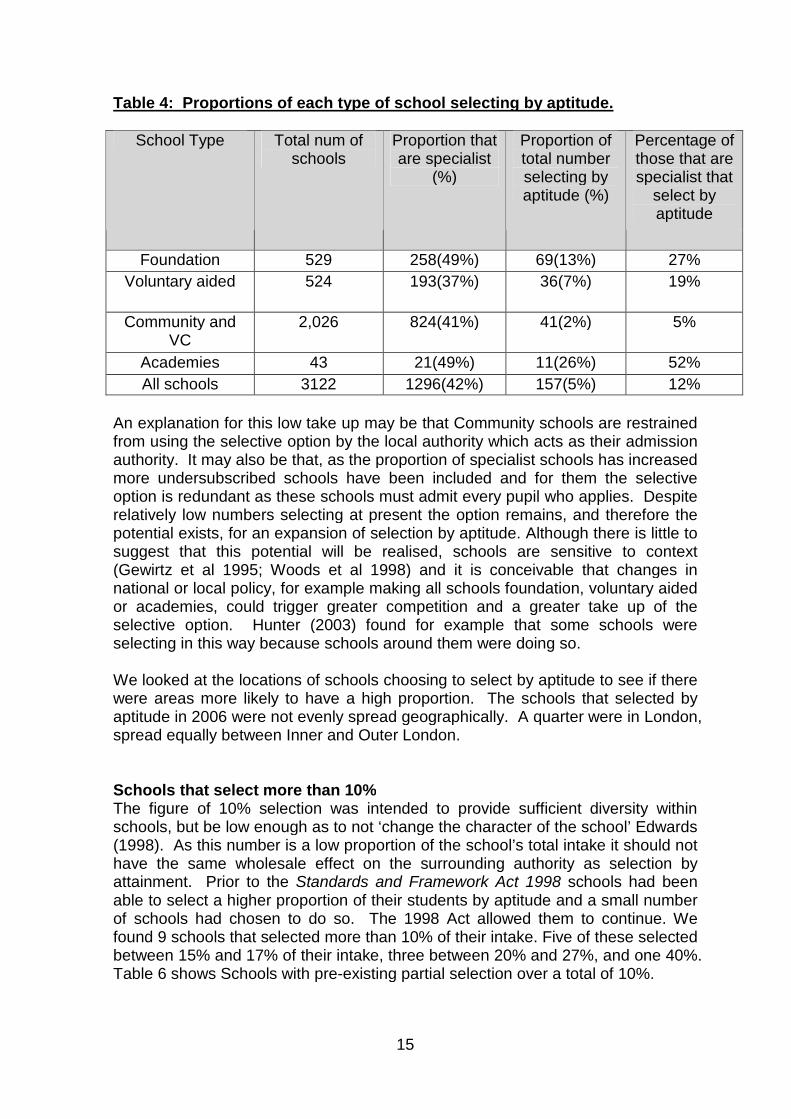
Table 4: Proportions of each type of school selecting by aptitude.
School Type Total num ofschools
Proportion thatare specialist
(%)
Proportion oftotal numberselecting byaptitude (%)
Percentage ofthose that arespecialist that
select byaptitude
Foundation 529 258(49%) 69(13%) 27%
Voluntary aided 524 193(37%) 36(7%) 19%
Community andVC
2,026 824(41%) 41(2%) 5%
Academies 43 21(49%) 11(26%) 52%
All schools 3122 1296(42%) 157(5%) 12%
An explanation for this low take up may be that Community schools are restrainedfrom using the selective option by the local authority which acts as their admissionauthority. It may also be that, as the proportion of specialist schools has increasedmore undersubscribed schools have been included and for them the selectiveoption is redundant as these schools must admit every pupil who applies. Despiterelatively low numbers selecting at present the option remains, and therefore thepotential exists, for an expansion of selection by aptitude. Although there is little tosuggest that this potential will be realised, schools are sensitive to context(Gewirtz et al 1995; Woods et al 1998) and it is conceivable that changes innational or local policy, for example making all schools foundation, voluntary aidedor academies, could trigger greater competition and a greater take up of theselective option. Hunter (2003) found for example that some schools wereselecting in this way because schools around them were doing so.
We looked at the locations of schools choosing to select by aptitude to see if therewere areas more likely to have a high proportion. The schools that selected byaptitude in 2006 were not evenly spread geographically. A quarter were in London,spread equally between Inner and Outer London.
Schools that select more than 10%The figure of 10% selection was intended to provide sufficient diversity withinschools, but be low enough as to not ‘change the character of the school’ Edwards(1998). As this number is a low proportion of the school’s total intake it should nothave the same wholesale effect on the surrounding authority as selection byattainment. Prior to the Standards and Framework Act 1998 schools had beenable to select a higher proportion of their students by aptitude and a small numberof schools had chosen to do so. The 1998 Act allowed them to continue. Wefound 9 schools that selected more than 10% of their intake. Five of these selectedbetween 15% and 17% of their intake, three between 20% and 27%, and one 40%.Table 6 shows Schools with pre-existing partial selection over a total of 10%.

16
Table 6 Schools with pre-existing partial selection over a total of 10%.
LA School % Selectedby aptitude
Specialisms Type ofschool
Barnet Mill Hill School 25% Technology,Music andDance
Foundation
Birmingham Ninestiles School 27% Tech,Maths/Compand Science
Foundation
Buckinghamshire Waddesdon C of ESchool
15% Music VoluntaryAided
Kent Chaucer 15% Technology FoundationLancashire Ripley St Thomas
CE High15% Modern
ForeignLanguages
VoluntaryAided
Liverpool Archbishop BlanchCE High School(Girls)
15% Arts,Maths/Comp,Music,Science,Sport, Tech.
VoluntaryAided
Liverpool King David HighSchool
17% Music VoluntaryAided
Liverpool St Edward’sCollege
20% Music VoluntaryAided
Wandsworth Chestnut Grove 40% Art, ModernForeignLanguages
Foundation
Methods of assessmentThe frequency of specialisms selected for in 2006 are given in Chart 2.
Chart 2
Frequency of specialism selected for
42
33
27 26
1510
3 1
05
1015202530354045
Mus
ic
Tech
nology
Arts
Sports
Mod
ernLa
ngua
ges
Maths
andCom
putin
g
Scien
ce
Busines
san
dEnt
erpr
ise

17
The method by which level of aptitude is assessed is of interest. When selectionby 10% on the basis of aptitude was introduced, the government stated that thismust not be misused as a means of introducing or restoring partial selection bygeneral academic ability. The DfES distinguished aptitude from ability by definingit as a question of potential rather than of current capacity, therefore a naturaltalent or gift which an individual may posses. There has been much speculationand disagreement as to whether this can actually be tested for, with many beinghighly sceptical about how schools could actually test for aptitude without in realityselecting by attainment (Education and Skills Select Committee 2004; West andHind 2003).
Admission authorities themselves determine how aptitude is to be assessed.Guidelines have been set out as to how this can reasonably be done (SpecialistSchools and Academies Trust 2005). Schools must ensure tests do not assessacademic ability, by examining the ability profile of those selected by aptitude toascertain if this is representative of all those applying, and if this is not the case,tests must be adjusted. The chief adjudicator has also made clear that whentesting for aptitude, schools must use either a well-established aptitude test, or, ifthere is no such test, ‘objective assessment against published criteria by aqualified person independent of the school’ (Specialist Schools and AcademiesTrust 2005). In practice schools may be loosely interpreting these guidelines. Forexample a recent adjudication ruled that a school that had been using a test for‘aptitude’ in fact was testing on achievement (Office of the School Adjudicator,decision ADA 000854, 20 July 2006).
In terms of the science and technology specialism of the City Technology Colleges(CTCs) two reports commissioned by the DfEE called into question the validity ofsuch aptitude tests (Coffey & Whetton 1996 and Barber and McCallum 1996).Coffey & Whetton (1996) reported that a pupils aptitude on entrance to a schooland their later performance levels in the particular subject had a lack ofconsistency. Barber and McCallum (1996) reported mixed views on whetherability and aptitude could be separated. Moreover two of the CTC's actuallyrefused to put into place aptitude tests due to applicants being too young to becategorised in that way and that they believed tests could not control for effects ofprior learning and parental encouragement.
In addition, some forms of aptitude test such as live auditions, are subject to thesame criticism as interviews in that they provide the means for selection on socialgrounds. While the 2003 School Admissions Code of Practice stated that thereshould be no interviews (DfES 2003 para. 3.16) and interviewing is now outlawed(see section 1.46 School Admissions Code 2007) the use of interviews or liveauditions is allowed:
solely for the purpose of assessing a child’s suitability for a boarding place,or to auditions, or other oral or practical tests in order to ascertain a child’saptitude in a particular subject at schools with a permitted form of selectionby aptitude. (section 1.46 and 1.47)

18
Given these concerns it is of particular interest to look at the methods the schoolsin 2006 used. We found the following categories in the composite prospectusesand give their frequencies in Chart 3. The most common category was a live test8
or audition and this included auditions for Music and Drama, and Sports trials. Thevariety and frequency of kinds of test for each specialism are given in Table 7. Forthe large proportion of schools for whom we do not know the method of selection itmeans that their admission arrangements are not transparent.
Chart 3
Method of selecting by aptitude
56
2016
51
59
0
10
20
30
40
50
60
70
Live
trial/Audition
Test Certificate Ref Gen Ability
Test
Unknown
Table 7: Frequency of methods of assessing aptitude
Issues associated with selection by aptitudeThere are a number of possible implications arising from selecting by aptitude. Aschool that selects by aptitude enhances choice by making places available tothose pupils living outside the school’s immediate catchment area, who feel thatthey have a capacity to excel in a particular subject but would not otherwise fit the
8 The category ''Test' included tests for specific modern languages as well as unspecified test for Technology.
Live trial/Audition Ref Cert Test
Gen AbilityTest Unknown Total
Music 19 0 8 0 0 15 42Technology 0 0 1 18 1 13 33Arts 13 3 3 0 0 8 27Sports 8 2 3 0 0 13 26Languages 9 0 1 2 0 3 15Maths&Comp 6 0 0 0 0 4 10Science 1 0 0 0 0 2 3Bus&Ent 0 0 0 0 0 1 1Total 73 5 16 3 1 59 157

19
criteria to be accepted into the school. However, selection by aptitude alsopresents a method by which popular schools may admit a disproportionate numberof the more able children by using covert selective techniques (Edwards andWhitty 1997). Research on schools in London revealed that some schools hadused 'unusual talent,’ in certain specialist subjects in order to 'increase theproportion of academically able children from middle class families' (Gerwitz et al1995). Also, certain specialisms such as those in the arts could potentially attractmore than the average number of girls to the school and therefore this mayimprove their position in league tables as girls typically achieve higher results inexams than boys (Edwards 1998).
The mere appearance of being partly selective seems to increase theattractiveness of a school to the higher socio economic groups as well asdiscouraging other parents from applying to the school at all, it is therefore likely toincrease social segregation. Opting for selection by aptitude does not make anunpopular school more popular but may increase the popularity of alreadyoversubscribed schools, and give them more means to 'cherry pick' the 'easier toeducate children'. Specialisation may enable parents to choose schools; whereasselection appears to enable schools to choose pupils.
There are also strong arguments to suggest that selection by aptitude is likely tobe socially selective by default. The aptitude tests are ‘susceptible to the effects offactors related to socio-economic status’ Stringer (2008). A high relativeattainment in any of the subjects (even Sport) will involve expense of resources oftime and money for travelling, equipment and training. More affluent families havemore of these resources as well as more social and cultural capital. In addition,parents from higher socio-economic groups tend to be more active in choosing aschool and to be more willing for their children to travel away from their nearestschool (financial resources will play a part in this as well) and so they may be morelikely to apply for the aptitude places.
Lastly there is also the potentially negative effect on the children applying forselective places to be taken into consideration. Selecting 10% of places onaptitude may seem minimal, but far more than 10% will actually take the test andtherefore be rejected (Comprehensive Future 2007).
ConclusionsSelection by prior attainment remains a significant factor in the English secondaryschool system. Although the proportion of pupils taking a selective place at agrammar or partially selective school is quite small at around 4% it also affects afurther 10% to 12% who attend schools where the average prior attainment of thepupils is reduced. In some cases this effect is felt beyond the borders of the localauthorities where the selective schools are located. Although schools are currentlyprohibited from becoming selective, those schools that remain selective havegrown in size.
We have argued that selection by aptitude is different from selection by generalability. Nevertheless, selection by aptitude not only offers a means of directselection, but it is also likely to lead to social selection by default. The great

20
majority of specialist schools do not use selection in order to fulfil their specialistschool mission, but the potential to do so is there.
Selection by prior attainment is currently also largely selection by socialbackground (Atkinson and Gregg 2004). This affects the social as well as theattainment characteristics of the intakes of all schools in the area. Both selectionby attainment and by aptitude form part of the context of the general sorting ofchildren into secondary schools. Selection by attainment is a particularly powerfulmeans by which those who have more education and wealth gain educationaladvantage for their children.

21
References
Allen, R and Vignoles, a (2006). What should an index of school segregationmeasure? [online]. London Centre for Economics of Education.Available at: <http://cee.lse.ac.uk/pubs/default.asp >[Accessed 05/06/2008].
Atkinson, A and Gregg, P (2004). Selective Education: Who benefits fromgrammar schools? Market & Public Organisation, Issue 11, Autumn 2004.
Ball, S. (2003) Class strategies and the Education Market: the middle class andsocial advantage. London: Routledge
Ball, S (2008). The education debate. Bristol, Policy Press.
Banks, O (1955). Parity and prestige in English secondary education. London,Routledge and Kegan Paul.
Barber, M., & McCallum, B. (1996) City Technology Colleges and TechnologyColleges: review of admissions procedures at Year 7, London: DfEE
BBC (2007). Cameron attacks grammar 'fantasy'. [online].Available at:< http://news.bbc.co.uk/1/hi/uk_politics/6676447.stm>[Accessed 01/08/08].
Benn, C and Chitty, C (1997). Thirty years on: Is comprehensive education aliveand well or struggling to survive? London, Penguin Books.
Coffey, M., & Whetton, C. (1996) Aptitude Tests of Technology; an investigation ofaptitude and its relationship with GCSE scores, London: DfEE
Coldron J, Tanner E, Finch S, Shipton L, Wolstenholme C, Willis B, Demack S,Stiell B (2008) Secondary schools Admissions. DCSF January 2008
Comprehensive Future (2007) Fair enough? School admissions - the next stepsAvailable at :< http://www.comprehensivefuture.org.uk/CFPamphlet.pdf >[Accessed: 27/07/2008]
Crook, D, Power, S and Whitty, G. (1999). The grammar school question: a reviewof research on comprehensive and selective education. Institute of the Education,University of London.
DCSF (2008). Ed Balls vows to help secondary moderns. [online].Available at:< http://www.dcsf.gov.uk/pns/DisplayPN.cgi?pn_id=2008_0122>[Accessed 01/08/08].
DCSF (2008a) Seventy-nine new specialist schools announced- AdonisAvailable at: <http://www.dcsf.gov.uk/pns/DisplayPN.cgi?pn_id=2008_0118 >

22
[Accessed: 08/07/2009]
DCSF (2008b) Statistical Bulletin: The Composition of Schools in England. [online].Available at:<http://www.dcsf.gov.uk/rsgateway/DB/SBU/b000796/TheCompositionOfSchoolsInEnglandFinal.pdf>[Accessed: 15/07/08]
DCSF (2008c). Standards and Diversity Capital Fund - Version 1.3, last updated28 February 2008.
DES (1965). Organisation of Secondary Education (Circular 10/65). London, HerMajesty's Stationery Office.
DES (1970). The Organisation of Secondary Education (Circular 10/70). London,Her Majesty’s Stationery Office.
DfES (2003) School Admissions Appeals code of practice. London: Departmentfor Education and Skills.
Education and skills select committee (2004) Secondary Education: Schooladmission volume 1 TSO (The Stationary Office)
Edwards, T. (1998) Specialisation without selectionAvailable at: <http://www.risetrust.org.uk/special.html >[Accessed: 01/07/2008]
Edwards T., and Tomlinson, S. (2002). Selection Isn’t Working: Diversity,Standards and Inequality in Secondary Education. London, Catalyst Publications.
Edwards, T., and Whitty, G. (1997) Specialisation and selection in secondaryeducation. Oxford review of Education, vol .23 No.1, Choice, diversity and Equalityin Secondary Schooling (Mar., 1997), pp. 5-15
Flatley, J et al (2001). Parents' Experience of the Process of Choosing aSecondary School. Office for National Statistics and Sheffield Hallam University.London, Department for Education and Skills Research Report RR278.
Gewirtz, S., Ball, S., Bowe, R. (1995) Markets, Choice and Equity in EducationBuckingham. Open University Press
HC Debate (1995). 21 March 1995 cc.131-132. [online]. Available at:http://www.publications.parliament.uk/pa/cm199495/cmhansrd/1995-03-21/Orals-1.html [Accessed 12/07/08].
Hunter, P. (2003) from: Specialist schools' selection 'illegal'Available at: <http://news.bbc.co.uk/1/low/education/3059847.stm >[Accessed: 01/07/2008]

23
Ireson, J and Hallam, S (2001). Ability Grouping in Education. London, PaulChapman Publishing.
Levacic, R and Marsh, A (2007). Secondary modern schools: are their pupilsdisadvantaged? British Educational Research Journal, Vol. 33, No. 2 pp 155-178.
McCaig, C (2000). New Labour and education, education, education. In: Ludlum, S.& Smith, M.J. (eds) New Labour in Government. London, MacMillan.
O'Connor, M (1987). Ruskin ten years on. Contributions, 11. York. Centre for theStudy of Comprehensive Schools, 2-10.
OECD/UNESCO-UIS (2003). Literacy Skills for the World of tomorrow – Furtherresults from PISA 2000 OECD.Schagen, I and Schagen, S (2003). Analysis of national value-added datasets toassess the impact of selection on pupil performance. British Educational ResearchJournal, 29 (4), 561–82.
Office of the School Adjudicator, decision ADA 000854, 20 July 2006Comprehensive future (2007) Briefing Paper: The campaign for fair admissionsAvailable at :< www.comprehensivefuture.org.uk>[Accessed :06/072008]
Schagen, I and Schagen, S (2002). A fair comparison: selective v. comprehensiveeducation. Education Journal, 60, 26–7, 30.
Schagen, I. and Schagen, S. (2003) Analysis of national value-added datasets toassess the impact of selection on pupil performance, British Educational ResearchJournal, 29, 4, 561–82.
Schagen, I and Schagen, S (2003a). ‘Examination of witnesses.’ In: Great Britain.Parliament. House of Commons. Education and Skills Committee SecondaryEducation: Diversity of Provision. Fourth Report of Session 2002-03. Report andFormal Minutes Together with Oral and Written Evidence. (HC94). London, TSO.
Social Trends 12 (1981). Social Trends 12. London, Her Majesty’s StationeryOffice.
Specialist schools and academies trust (2005) Advice on School Admissions forspecialist school
Available at:
<http://www.specialistschools.org.uk/redirector.aspx?i=211&t=1.>
[Accessed: 18/07/2008]
Stringer, N. (2008) Aptitude tests versus school exams as selection tools forhigher education and the case for assessing educational achievement in context,Research Papers in Education Vol. 23, No. 1, March 2008, 53–68
Teachernet (2007) Specialist schoolsAvailable at: <http://www.teachernet.gov.uk/wholeschool/specialistschools/ >

24
[Accessed: 08/07/2008]
Tulloch, M. (2006) Grammar schools can parents decide?: How the government isprotecting selective education. In: Hewlett, M; Pring, R and Tulloch, M (eds.)Comprehensive Education: Evolution, Achievements and New Directions.Northampton, University of Northampton.
West, A and Pennel, H (2002). How New is Labour? The quasi-market andEnglish schools 1997 to 2001 [online]. London, LSE Research online. Available at:http://eprints.lse.ac.uk/archive/00000214 [Accessed 01/07/08].
West, A., and Hind, A. (2003) Secondary schools admissions in England:Exploring the extent of overt and covert selection. London school of economicsand Political Science. Research and Information on Stated Education Trustwww.risetrust.org.uk
Woods, PA., Bagley, C. and Glatter, R. (1998) School Choice and Competition:markets in the public interest? London: Routledge
This document was added to the Education-line database on 24 September 2008