selection of wind turbine blade materials for fatigue ... cocoa... · selection of wind turbine...
TRANSCRIPT
Selection of Wind Turbine Blade Materials for Fatigue Resistance
John MandellMontana State UniversityMontana State University
The American Ceramics SocietyMaterials Challenges in Alternative and Renewable Energy 2010
Cocoa Beach, FL, February 24, 2010y
AcknowledgementsAcknowledgements
This research has been sponsored by SandiaThis research has been sponsored by Sandia National Laboratories (1989-present)
Sandia PI: Dr Thomas Ashwill
Primary MSU contributors: Daniel Samborsky,Primary MSU contributors: Daniel Samborsky, Pancasatya Agastra, Aaron Sears, Timothy
Wilson, Patrick Flaherty
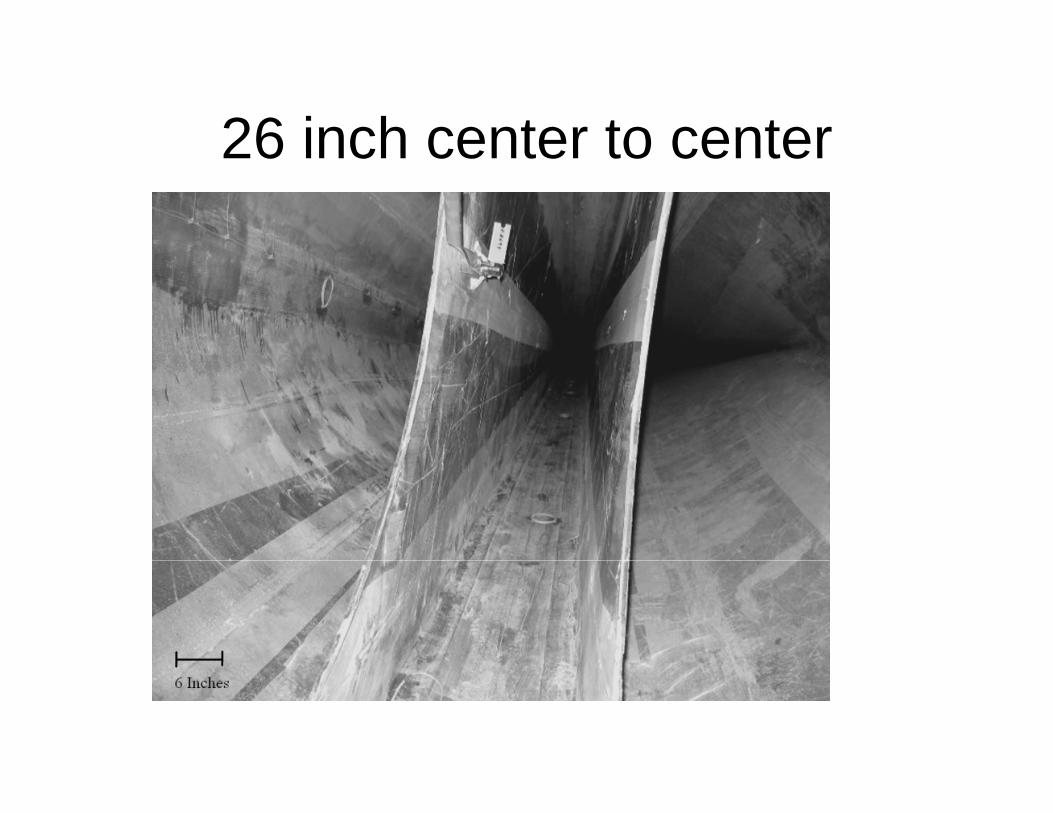
26 inch center to center26 inch center to center
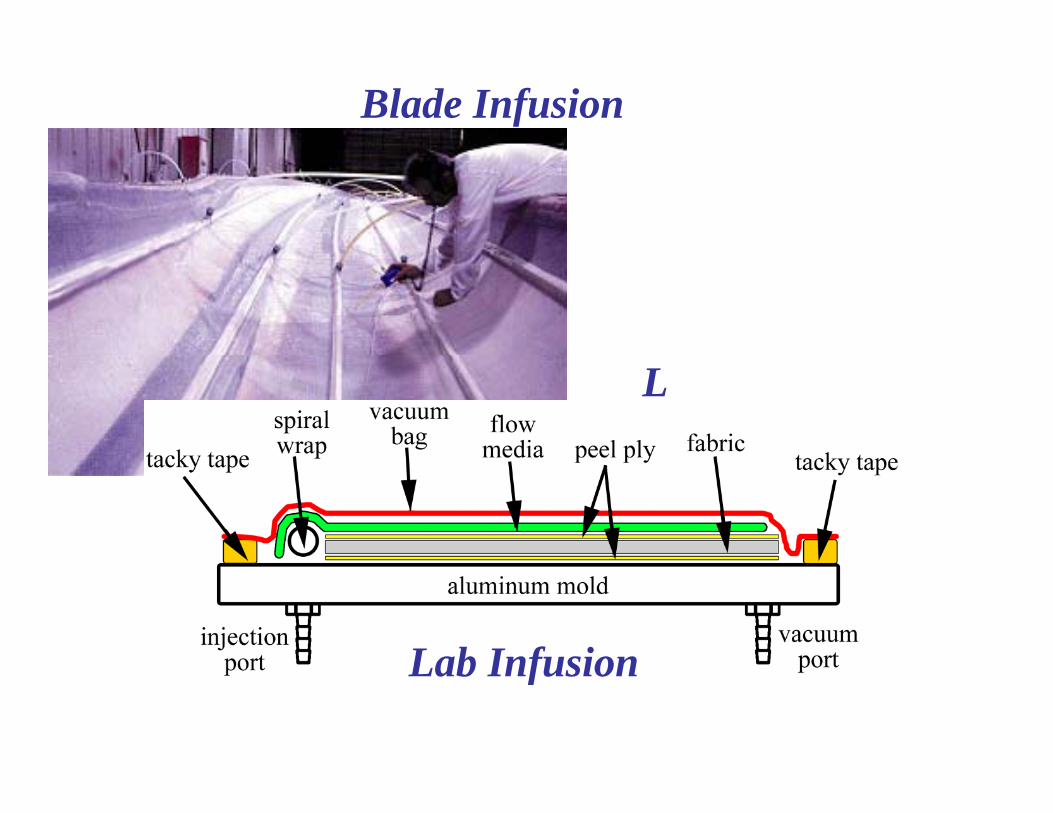
Blade Infusion
L
Lab InfusionLab Infusion
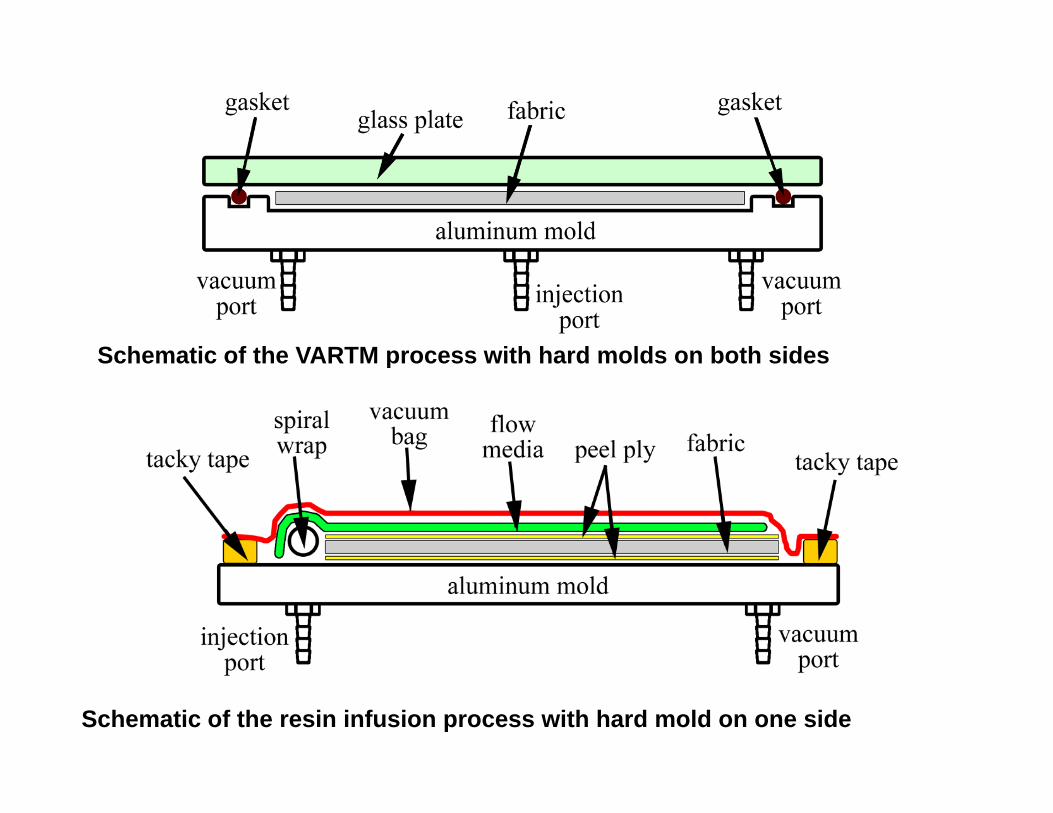
Schematic of the VARTM process with hard molds on both sidesSchematic of the VARTM process with hard molds on both sides
Schematic of the resin infusion process with hard mold on one side
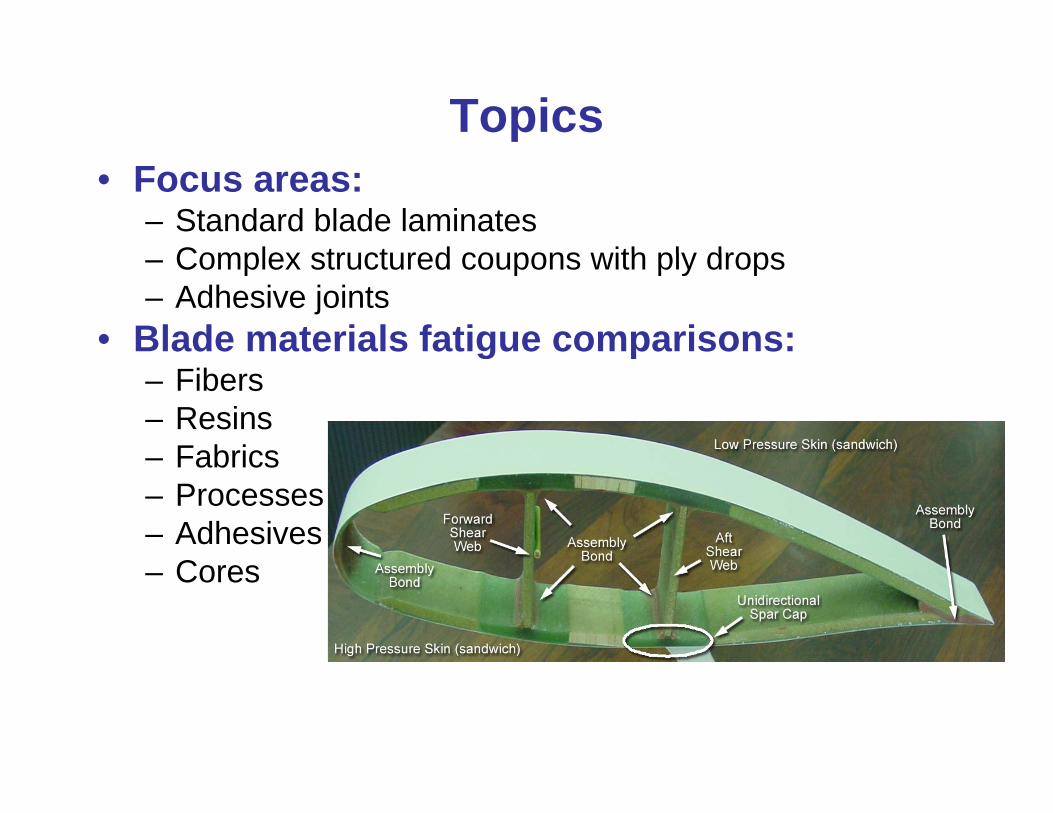
Topics• Focus areas:
– Standard blade laminatesComplex structured coupons with ply drops– Complex structured coupons with ply drops
– Adhesive joints• Blade materials fatigue comparisons:g p
– Fibers– Resins– Fabrics– Fabrics– Processes – Adhesives
C– Cores
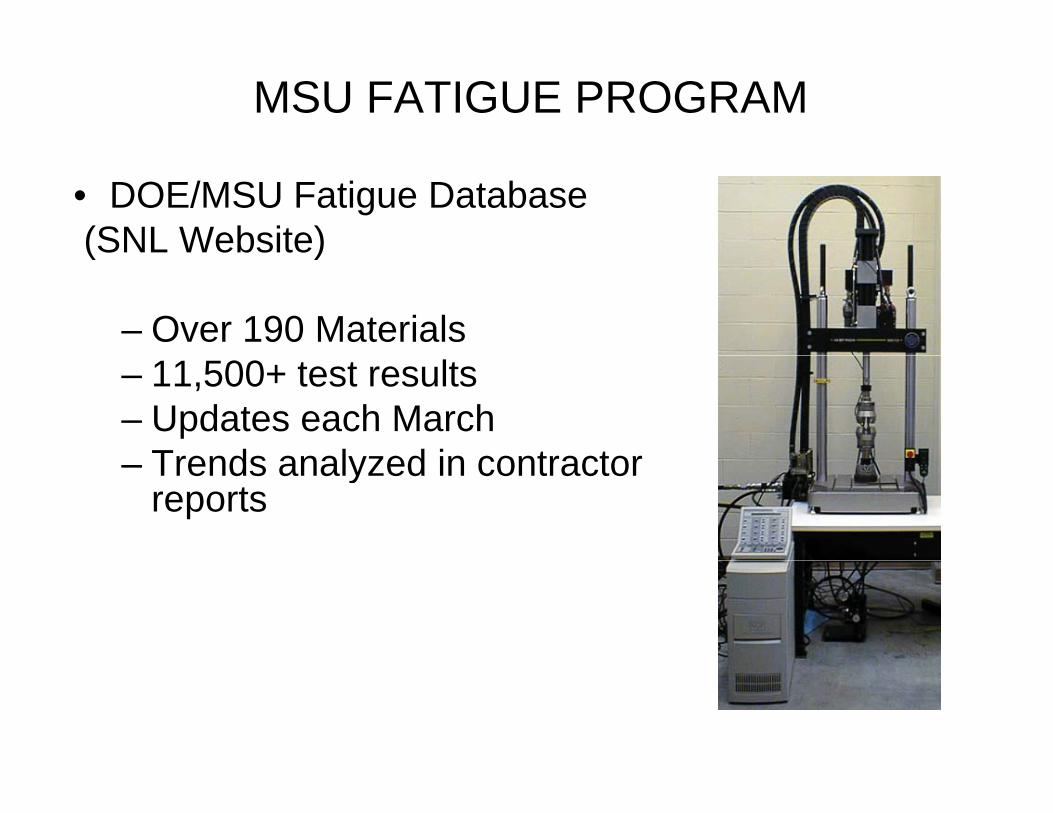
MSU FATIGUE PROGRAM
• DOE/MSU Fatigue Database(SNL Website)( )
– Over 190 Materials – 11,500+ test results– Updates each March
Trends analyzed in contractor– Trends analyzed in contractor reports
• ISSUE: Fatigue Test Methods• ISSUE: Fatigue Test Methods– Many laminate types and loading conditions
where proper failure modes cannot bewhere proper failure modes cannot be obtained, like reversed tension-compression.
– Data used in blade design can be of uncertainData used in blade design can be of uncertain validity, but generally conservative.
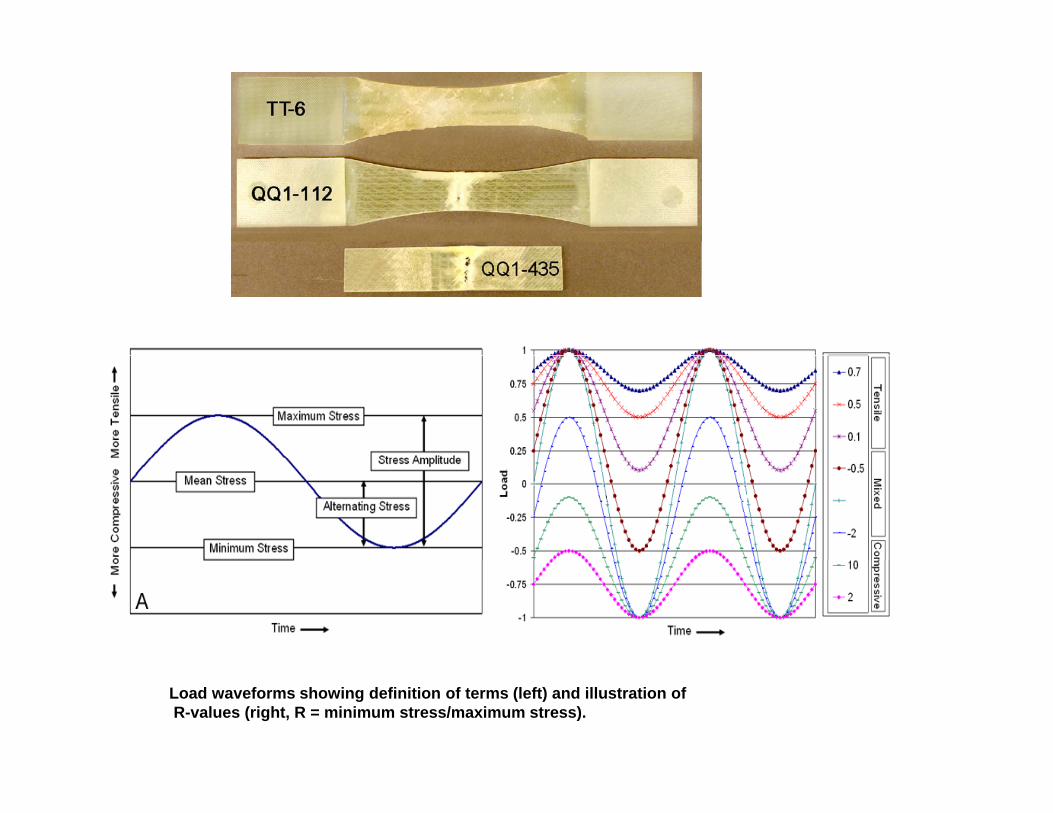
Load waveforms showing definition of terms (left) and illustration ofR-values (right, R = minimum stress/maximum stress).
• ISSUE: Fatigue Models to Best gRepresent Test Data
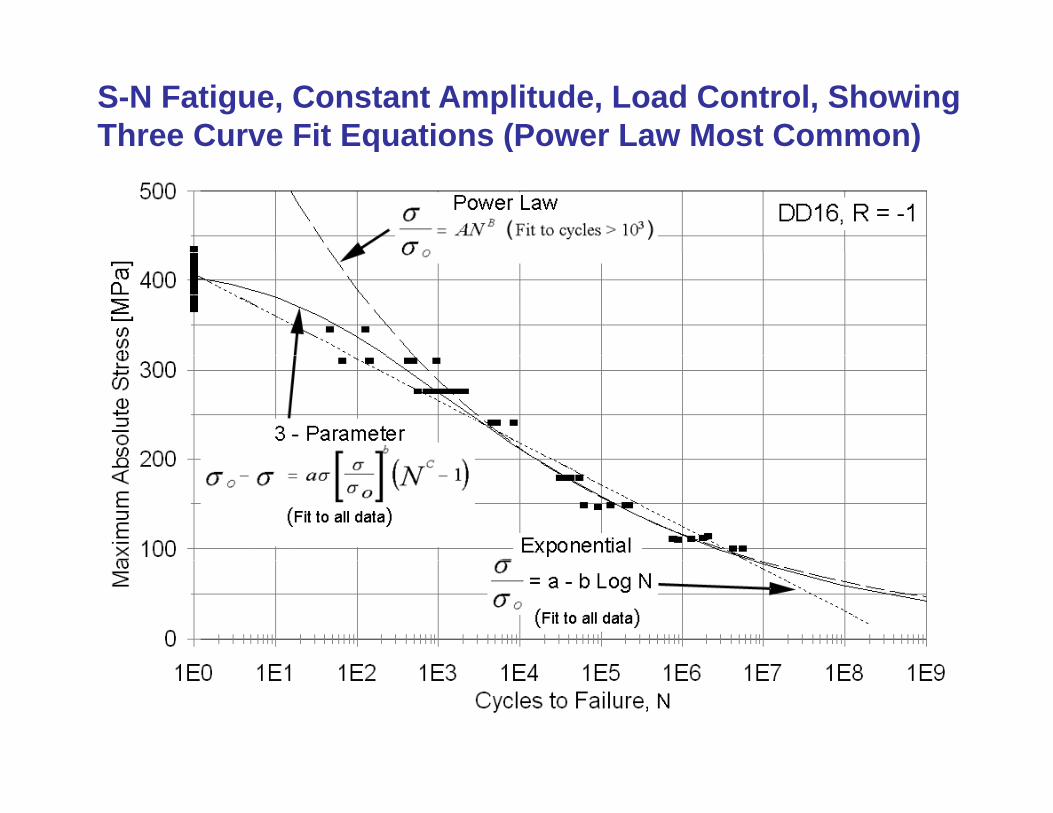
S-N Fatigue, Constant Amplitude, Load Control, Showing Three Curve Fit Equations (Power Law Most Common)q ( )
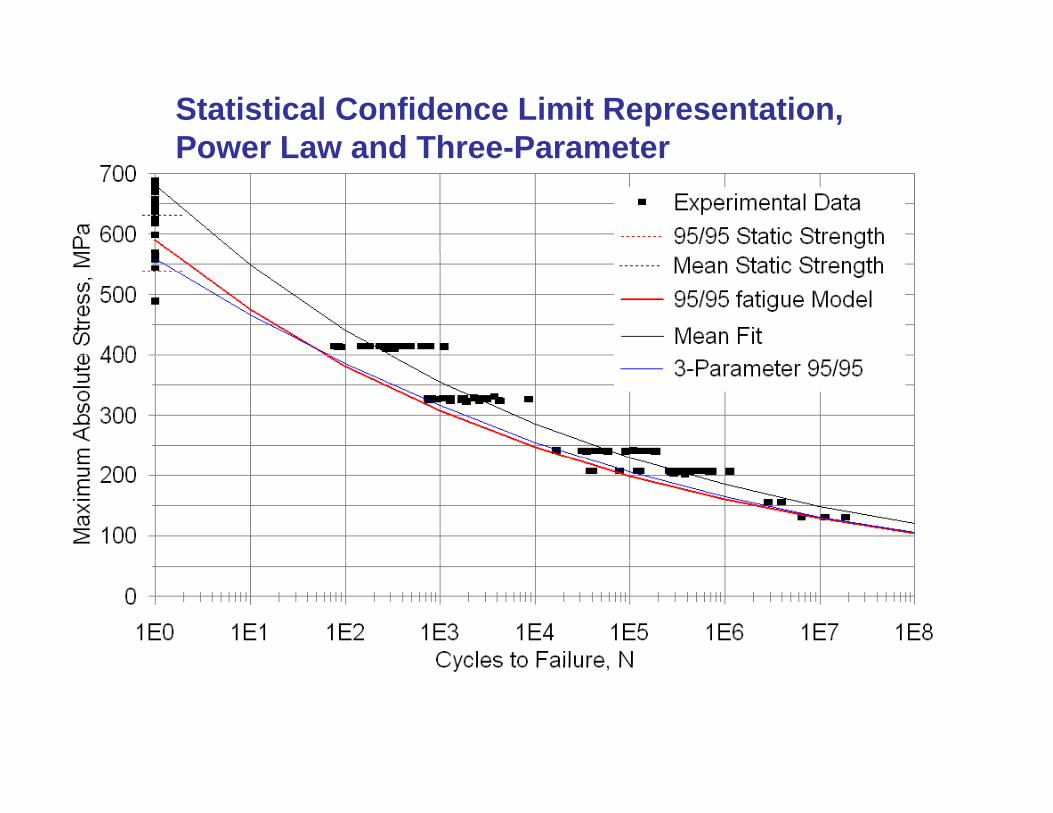
Statistical Confidence Limit Representation,Power Law and Three-ParameterPower Law and Three-Parameter
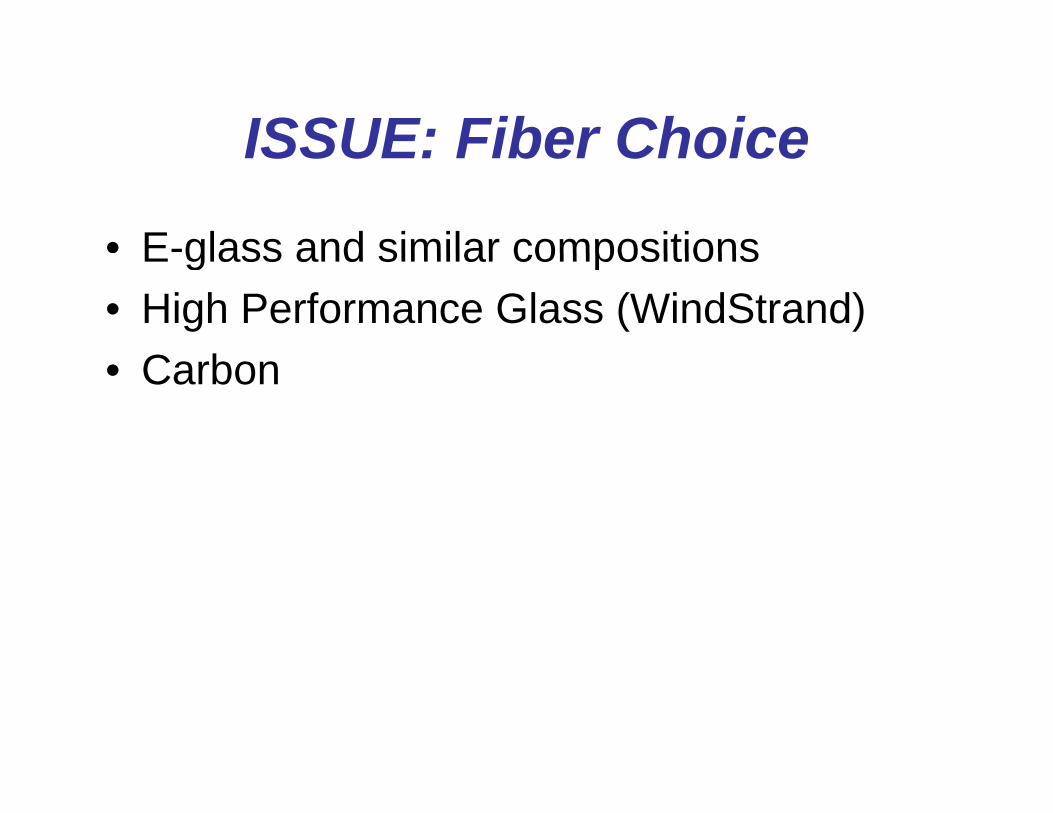
ISSUE: Fiber ChoiceISSUE: Fiber Choice
• E-glass and similar compositionsE glass and similar compositions• High Performance Glass (WindStrand)
C b• Carbon
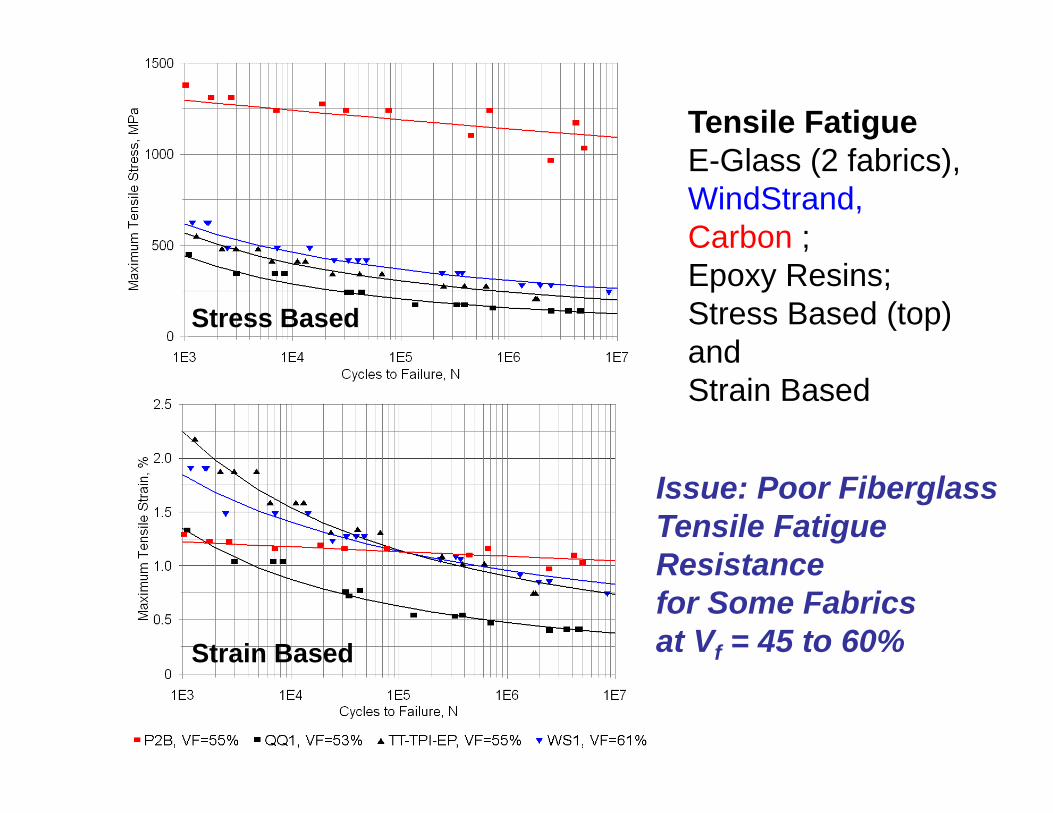
Tensile FatigueE Gl (2 f b i )E-Glass (2 fabrics),WindStrand,Carbon ;Epoxy Resins;Stress Based (top) and
Stress Basedand Strain Based
Issue: Poor Fiberglass Tensile Fatigue Resistance
Strain Based
Resistancefor Some Fabrics at Vf = 45 to 60%
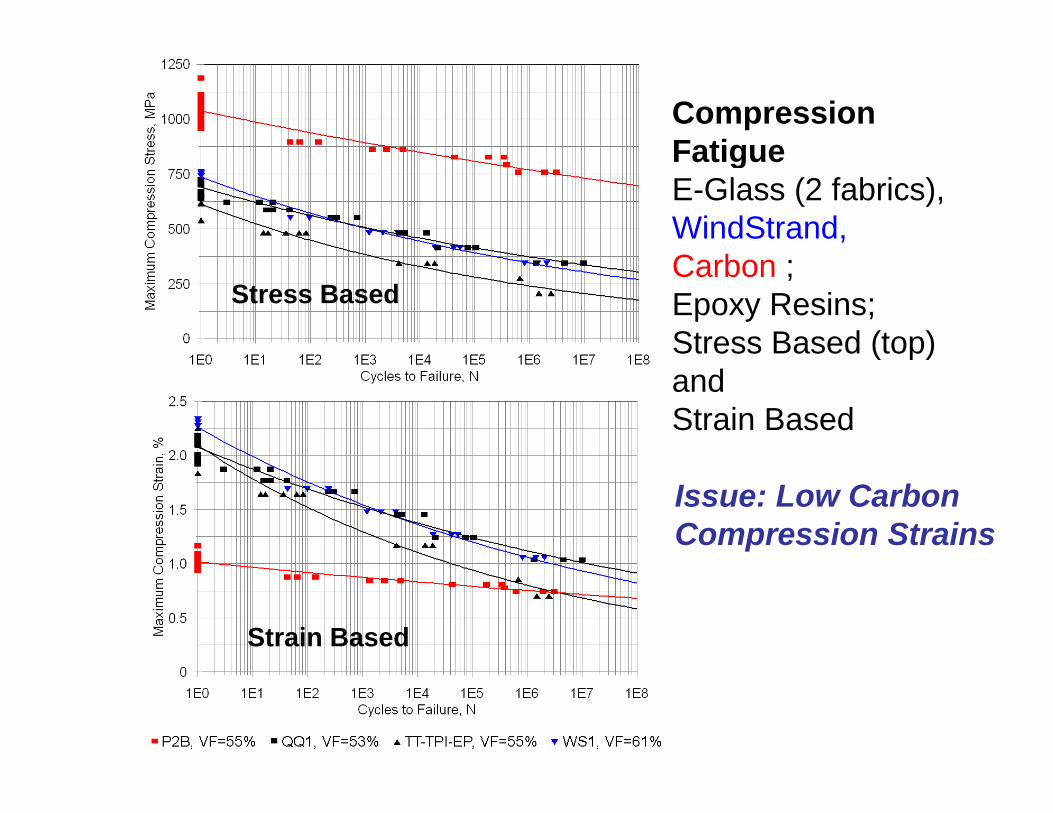
Compression FatigueFatigueE-Glass (2 fabrics),WindStrand,Carbon ;Epoxy Resins;Stress Based (top)
Stress Based
( p)and Strain Based
Issue: Low Carbon Compression Strains
Strain Based
• Issue: Fatigue Data Requirements andIssue: Fatigue Data Requirements and Cumulative Damage Models for Accurate Spectrum Loading PredictionAccurate Spectrum Loading Prediction for Blade Design
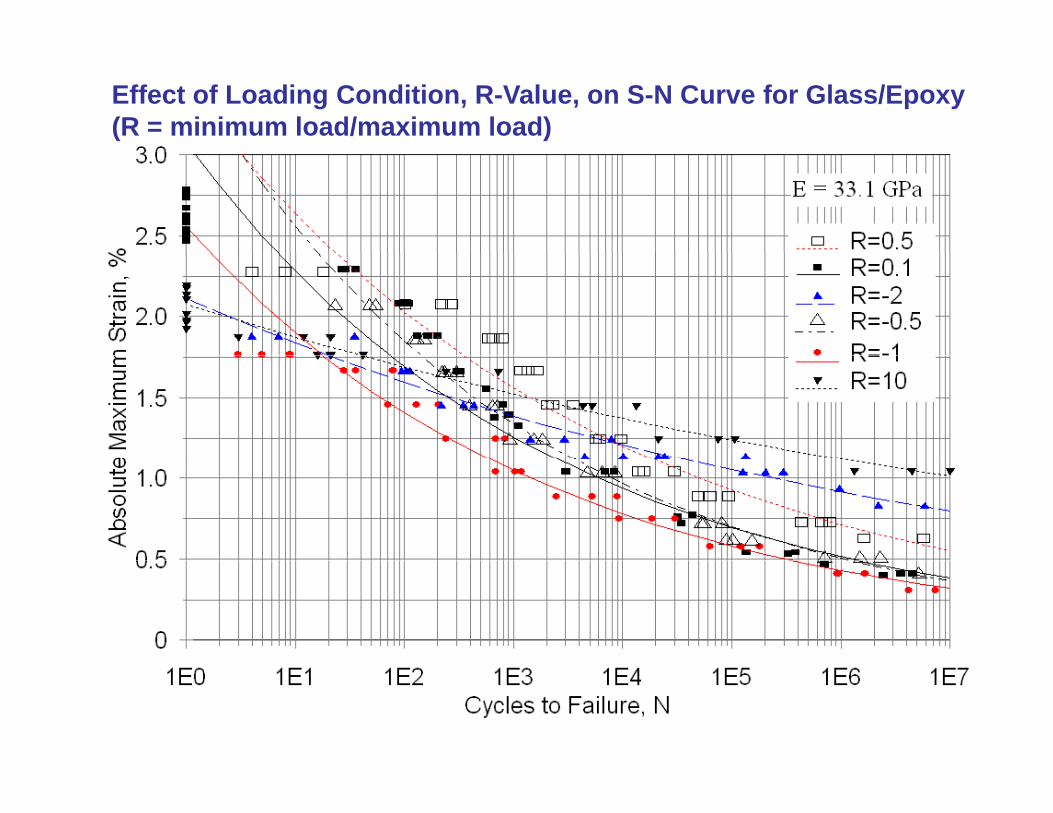
Effect of Loading Condition, R-Value, on S-N Curve for Glass/Epoxy(R = minimum load/maximum load)
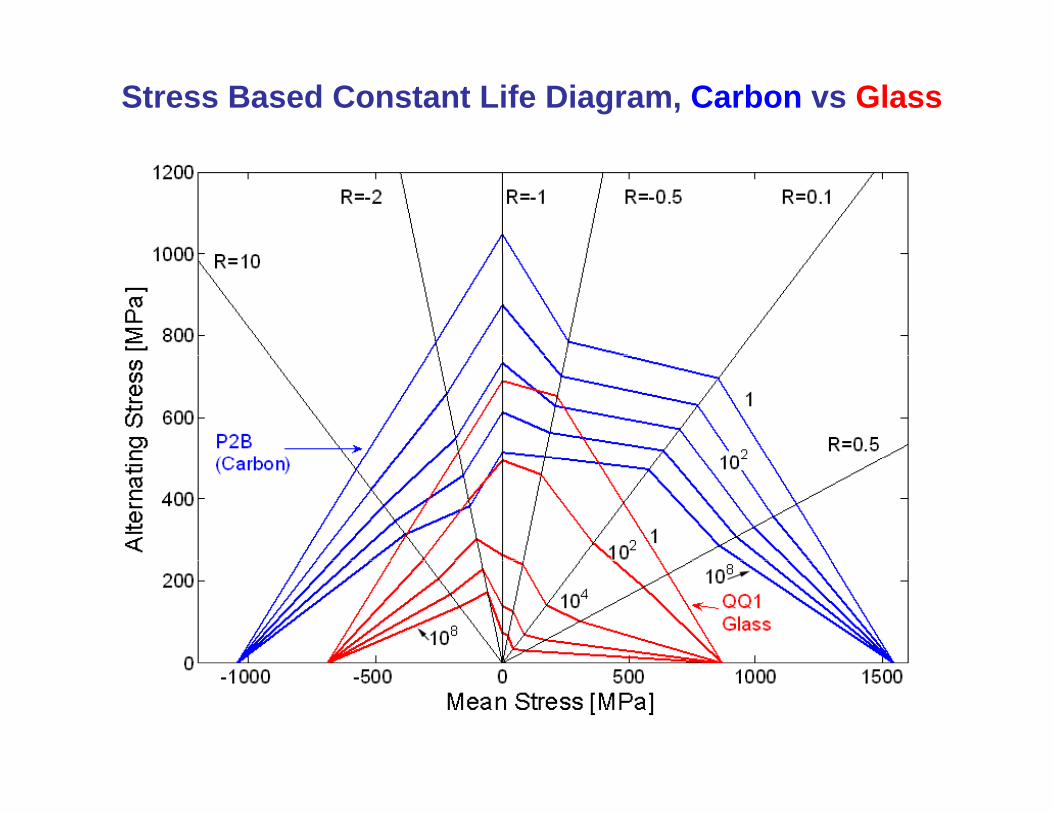
Stress Based Constant Life Diagram, Carbon vs Glass
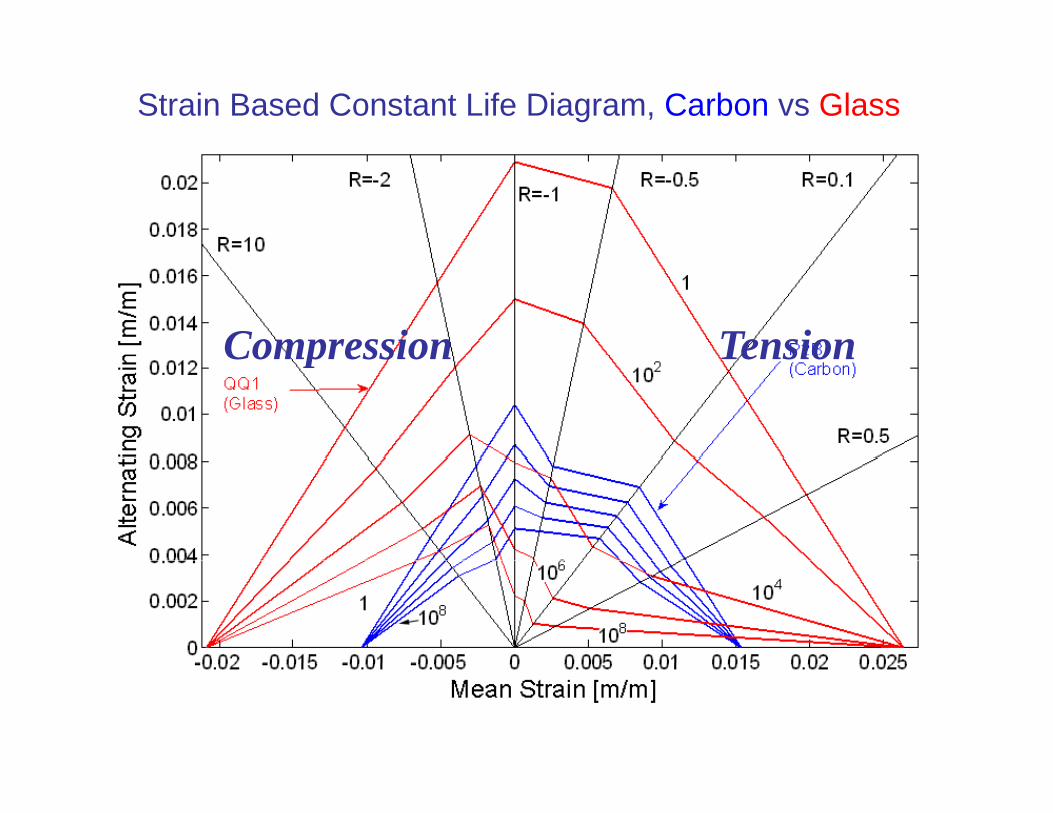
Strain Based Constant Life Diagram, Carbon vs Glass
Compression TensionCompression Tension
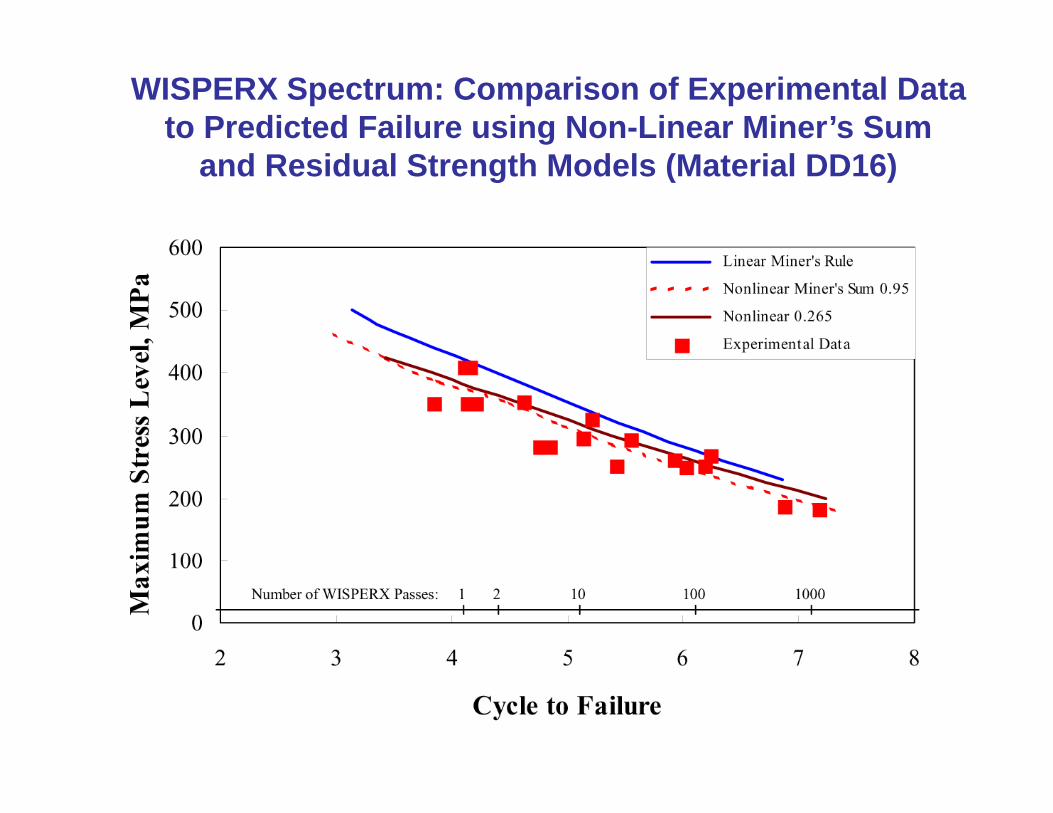
WISPERX Spectrum: Comparison of Experimental Datato Predicted Failure using Non-Linear Miner’s Sum
and Residual Strength Models (Material DD16)
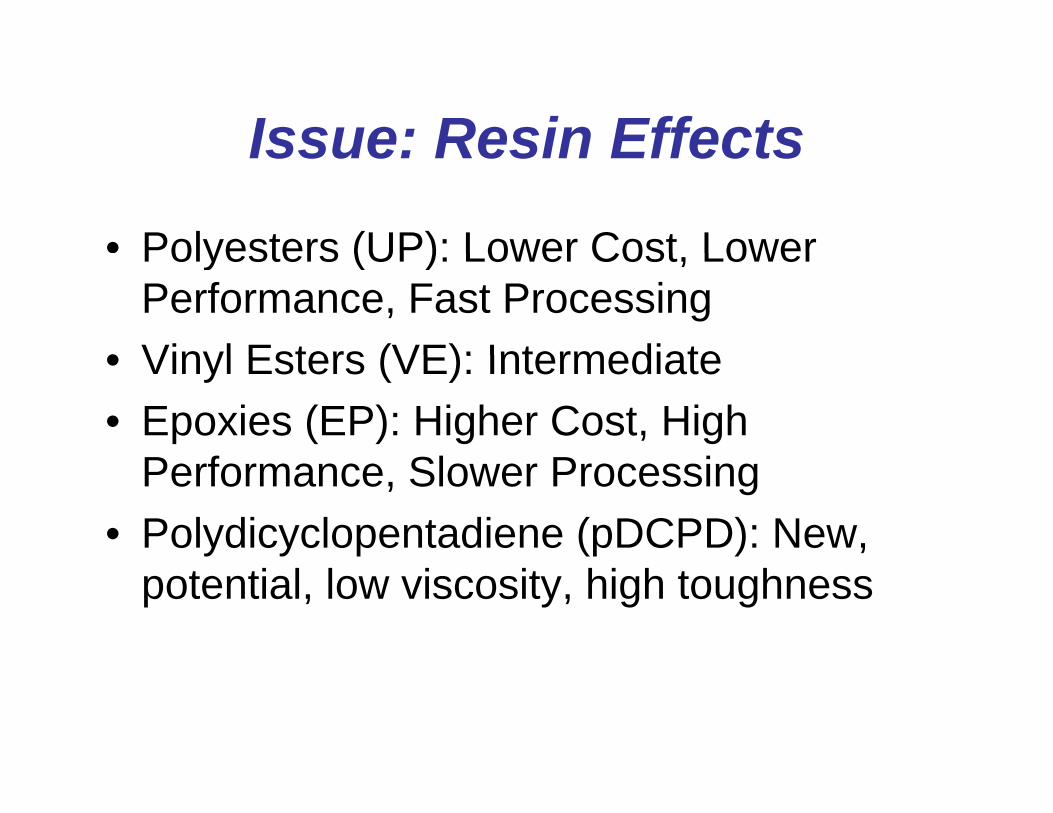
Issue: Resin EffectsIssue: Resin Effects
• Polyesters (UP): Lower Cost LowerPolyesters (UP): Lower Cost, Lower Performance, Fast Processing
• Vinyl Esters (VE): Intermediate• Vinyl Esters (VE): Intermediate• Epoxies (EP): Higher Cost, High
P f Sl P iPerformance, Slower Processing• Polydicyclopentadiene (pDCPD): New,
potential, low viscosity, high toughness
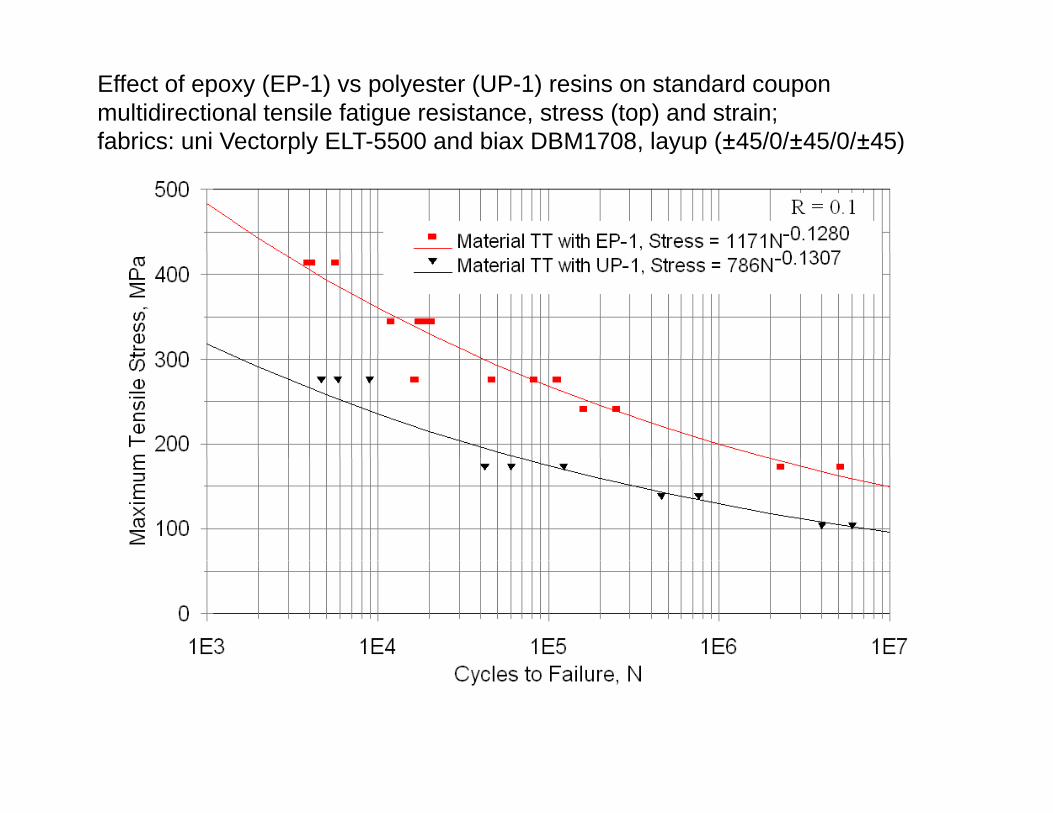
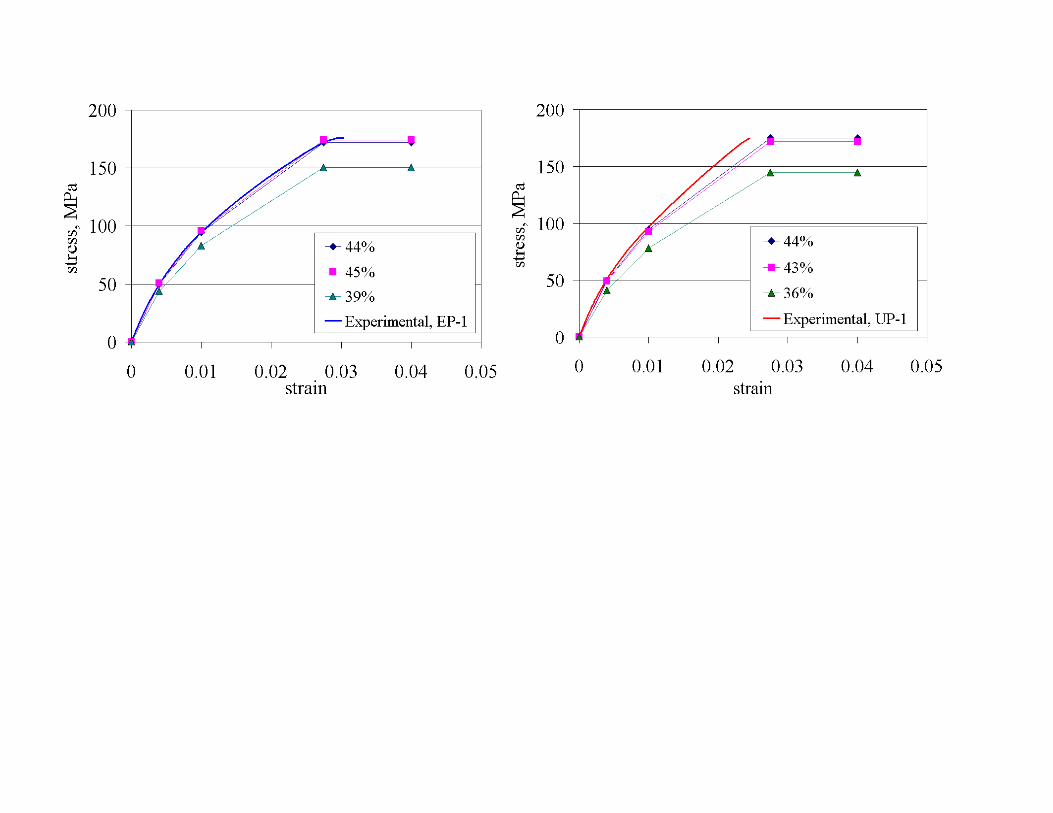
Effect of epoxy (EP-1) vs polyester (UP-1) resins on standard coupon multidirectional tensile fatigue resistance, stress (top) and strain;fabrics: uni Vectorply ELT-5500 and biax DBM1708, layup (±45/0/±45/0/±45)p y , y p ( )
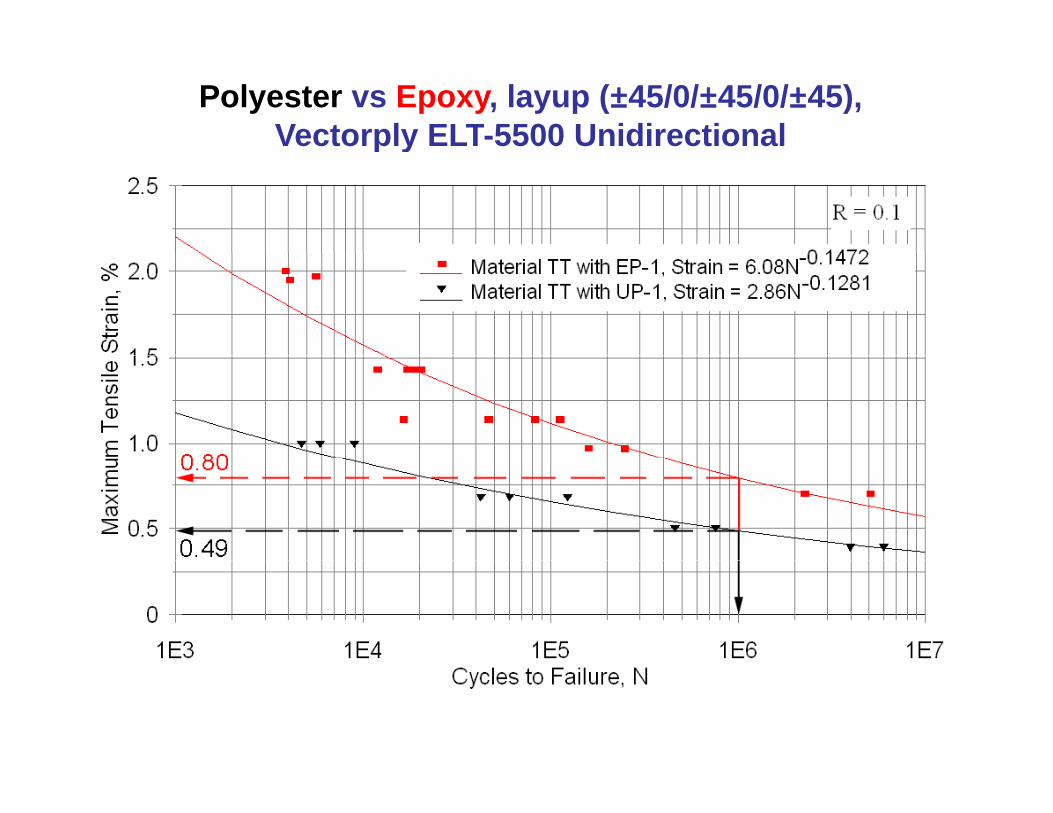
Polyester vs Epoxy, layup (±45/0/±45/0/±45), Vectorply ELT-5500 Unidirectionalp y
Epoxy
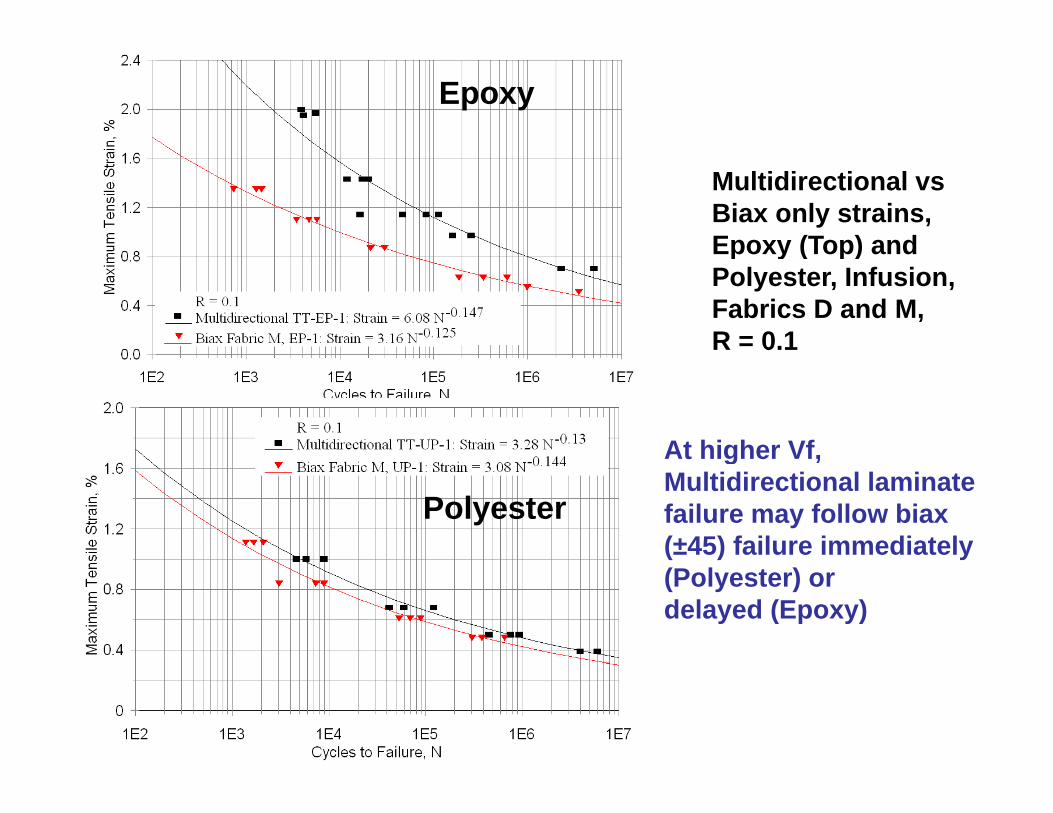
Multidirectional vs Biax only strains, Epoxy (Top) andEpoxy (Top) and Polyester, Infusion, Fabrics D and M,R = 0.1
At higher Vf,At higher Vf, Multidirectional laminatefailure may follow biax (±45) failure immediately
Polyester
(Polyester) or delayed (Epoxy)
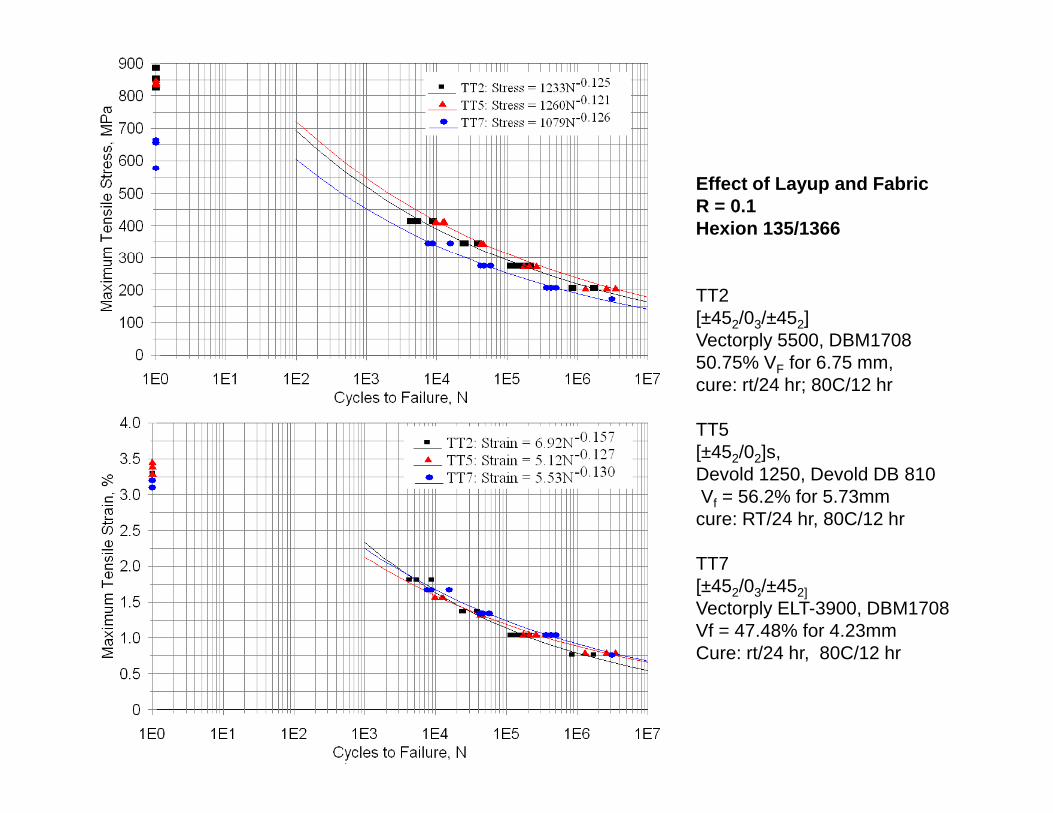
Effect of Layup and FabricR = 0.1Hexion 135/1366
TT2 [±452/03/±452]Vectorply 5500, DBM1708
0 % V f 650.75% VF for 6.75 mm, cure: rt/24 hr; 80C/12 hr
TT5 [±452/02]s, [ 52/02]s,Devold 1250, Devold DB 810Vf = 56.2% for 5.73mm cure: RT/24 hr, 80C/12 hr
TT7TT7 [±452/03/±452]Vectorply ELT-3900, DBM1708 Vf = 47.48% for 4.23mmCure: rt/24 hr, 80C/12 hr
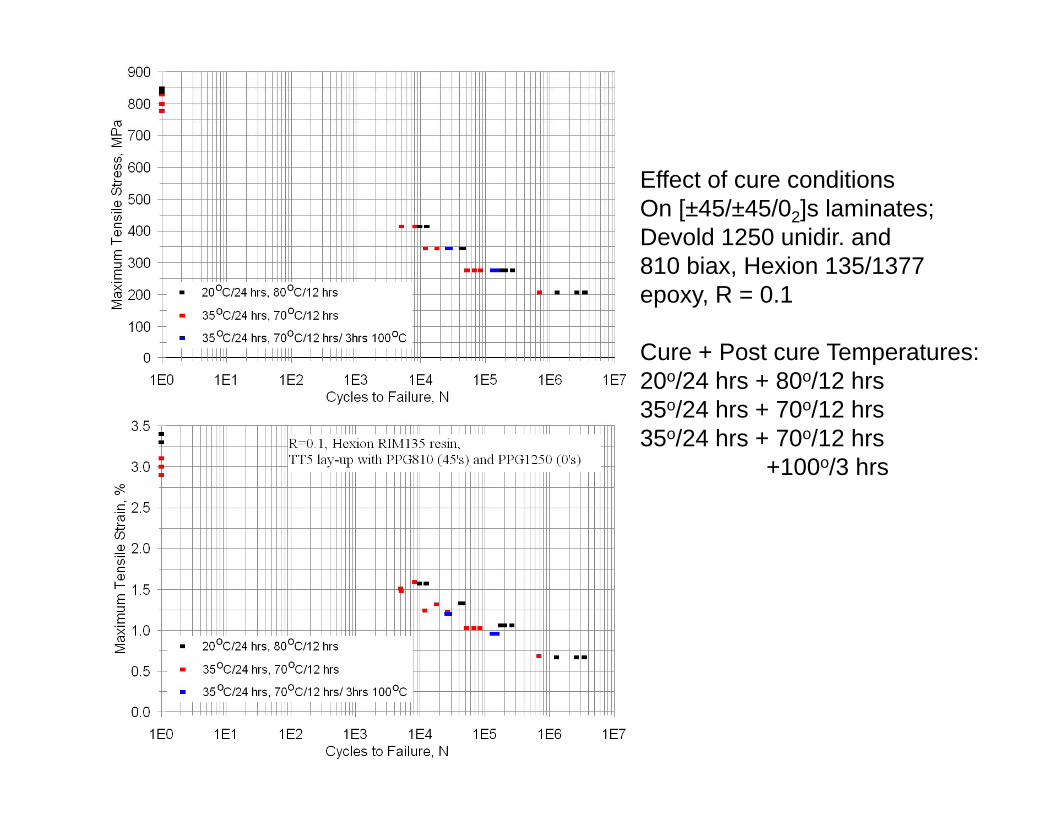
Effect of cure conditions On [±45/±45/02]s laminates;Devold 1250 unidir. and 810 biax, Hexion 135/1377 epoxy, R = 0.1
Cure + Post cure Temperatures:Cure + Post cure Temperatures:20o/24 hrs + 80o/12 hrs35o/24 hrs + 70o/12 hrs35o/24 hrs + 70o/12 hrs
100 /3 h+100o/3 hrs
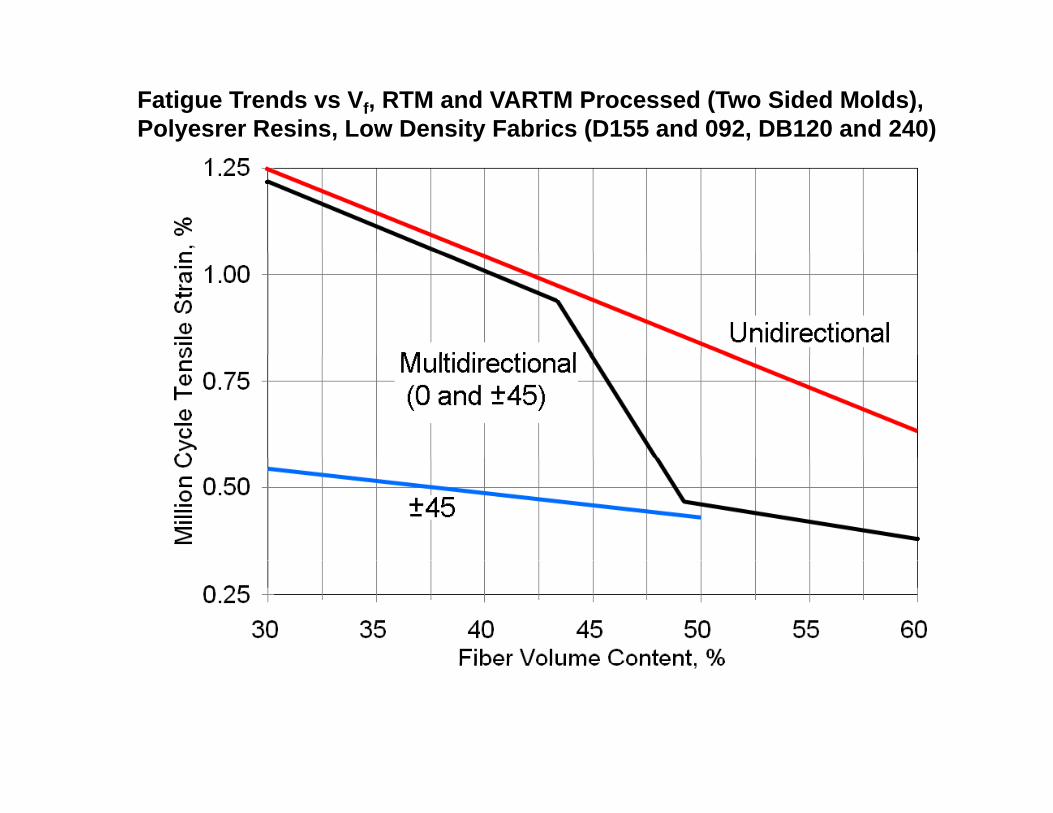
Fatigue Trends vs Vf, RTM and VARTM Processed (Two Sided Molds), Polyesrer Resins, Low Density Fabrics (D155 and 092, DB120 and 240)
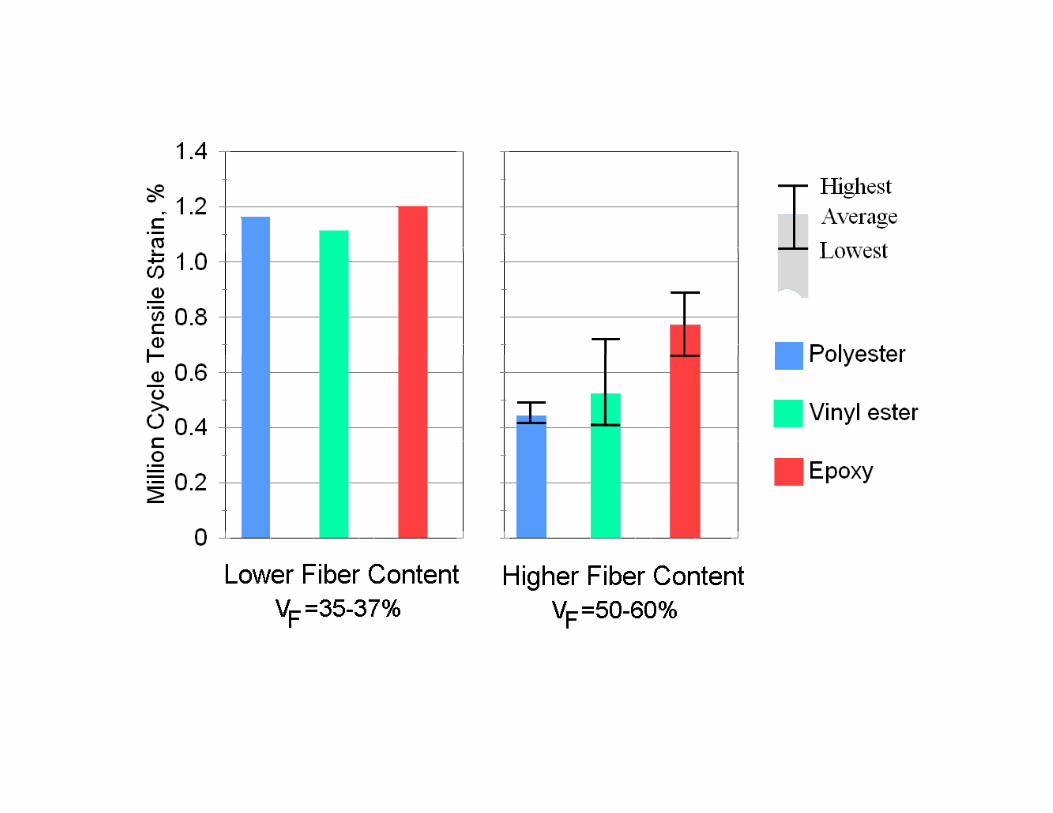
Issue: Fabric EffectsIssue: Fabric Effects
• Fabric architecture is important forFabric architecture is important for tensile fatigue, depending on the resin and Vfand Vf
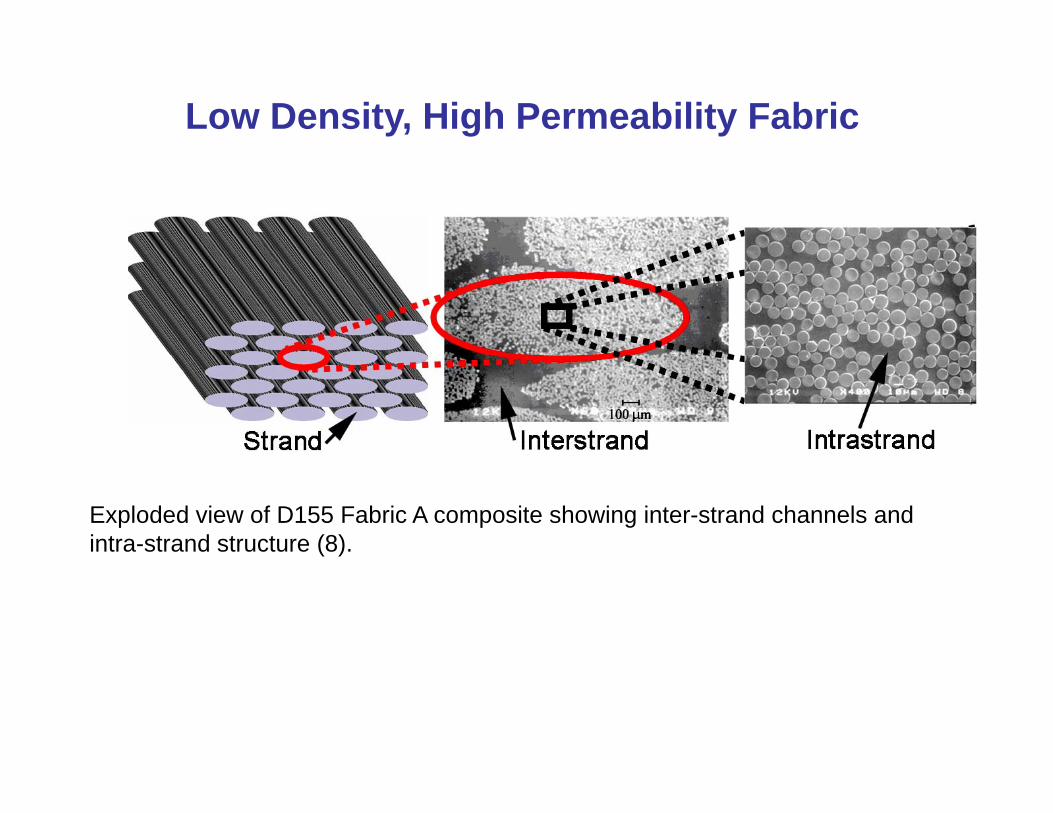
Low Density, High Permeability Fabric
Exploded view of D155 Fabric A composite showing inter-strand channels and intra-strand structure (8).
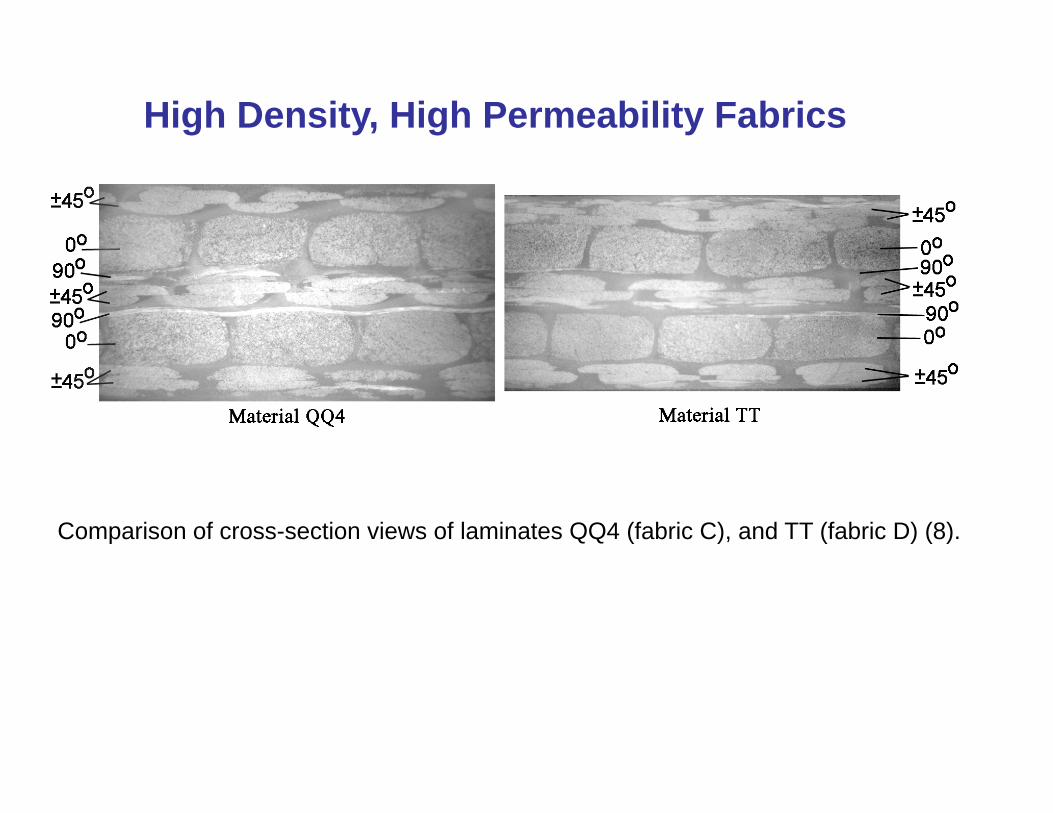
High Density, High Permeability Fabrics
Comparison of cross-section views of laminates QQ4 (fabric C), and TT (fabric D) (8).
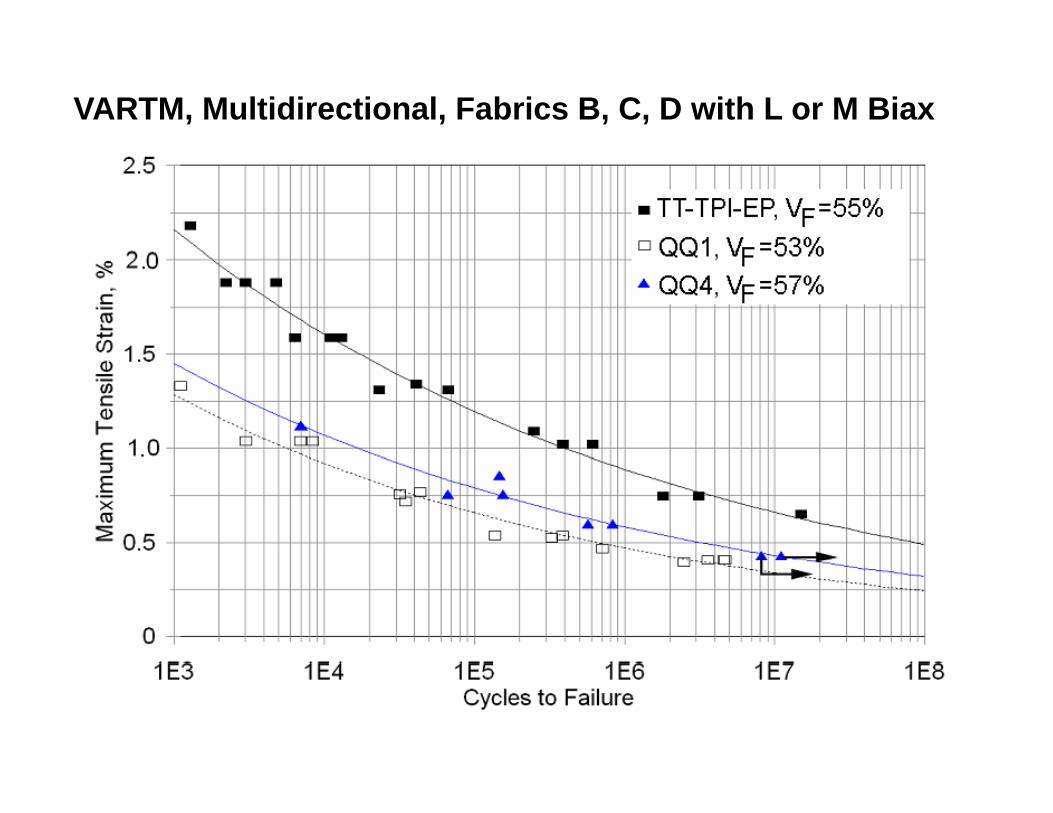
VARTM, Multidirectional, Fabrics B, C, D with L or M Biax
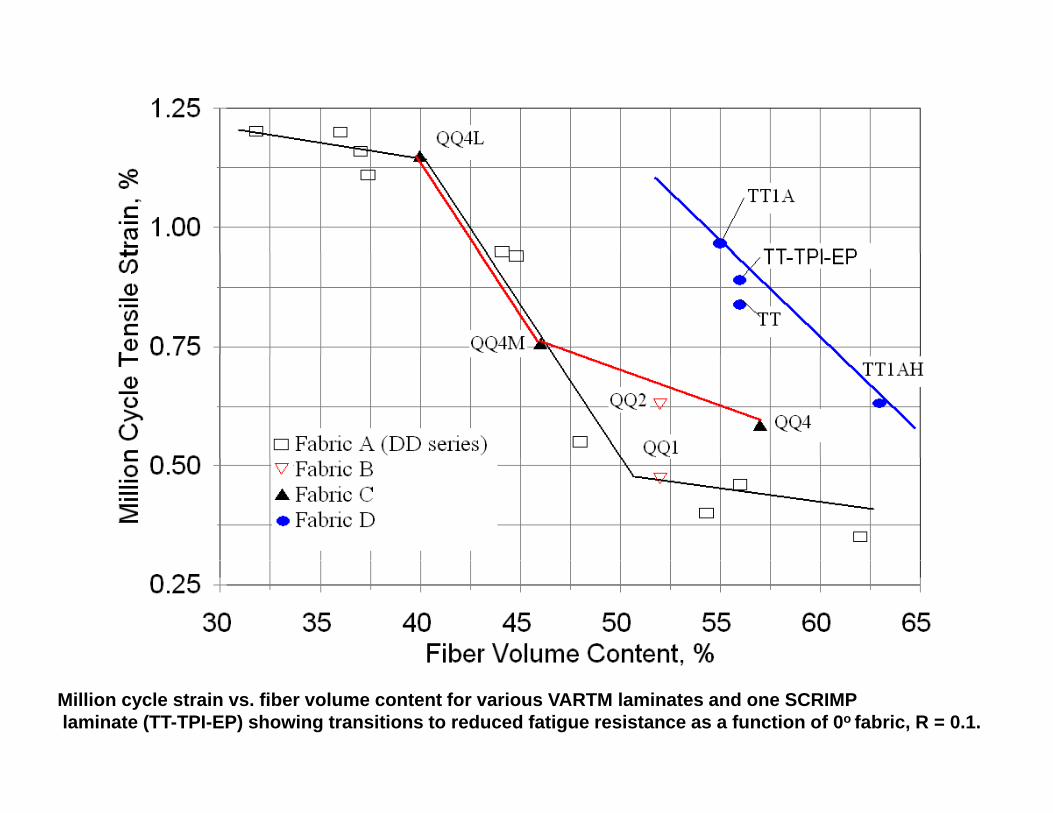
Million cycle strain vs. fiber volume content for various VARTM laminates and one SCRIMPlaminate (TT-TPI-EP) showing transitions to reduced fatigue resistance as a function of 0o fabric, R = 0.1.

• Issue: Off-Axis Properties; Biax FabricsIssue: Off-Axis Properties; Biax Fabrics and Spar Cap Transverse Strength and SplittingSplitting
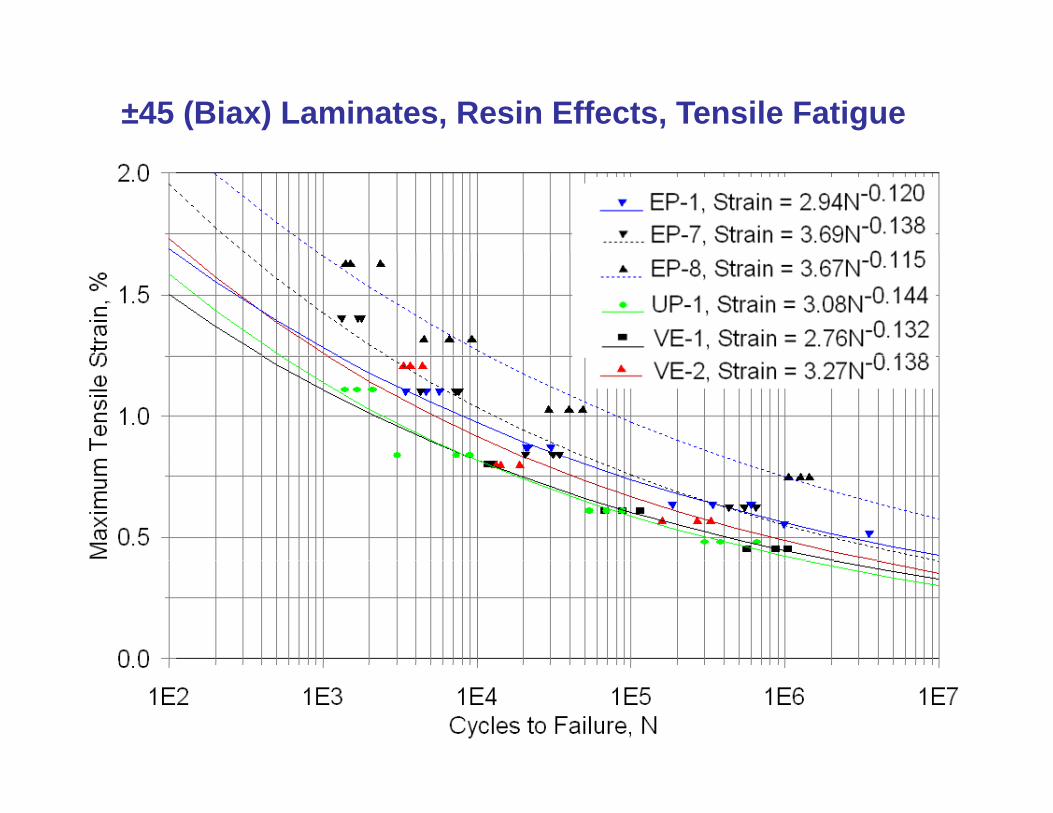
±45 (Biax) Laminates, Resin Effects, Tensile Fatigue
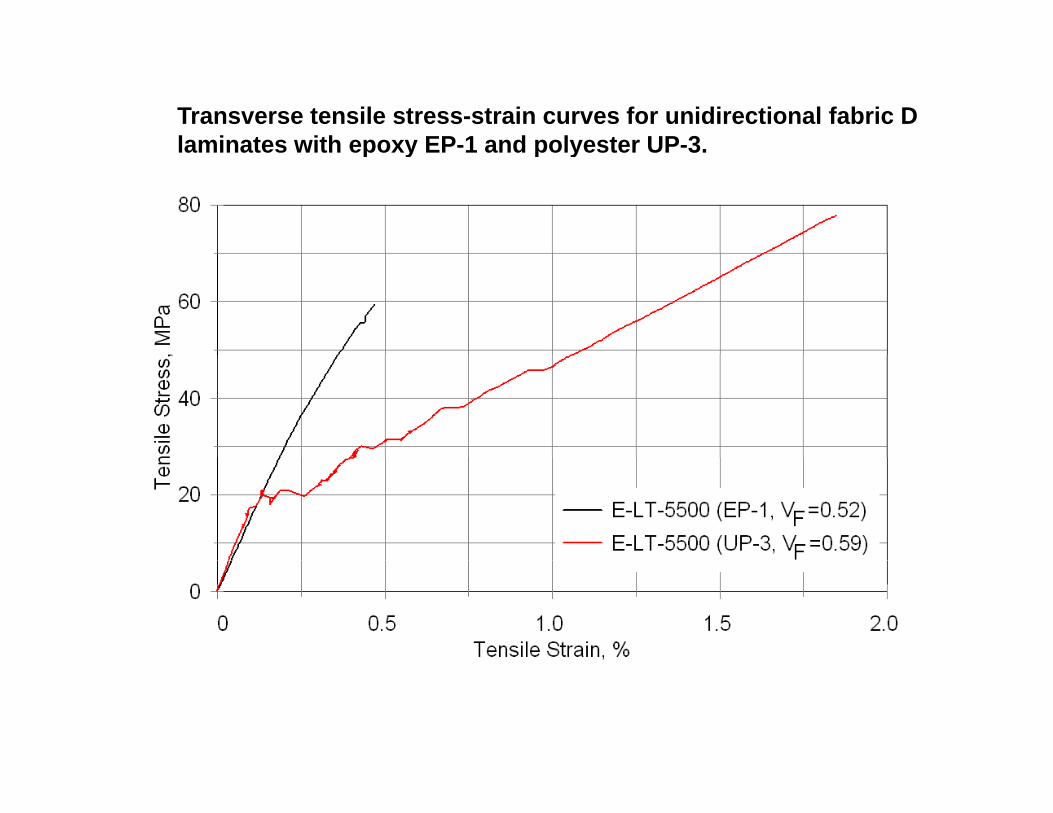
Transverse tensile stress-strain curves for unidirectional fabric D laminates with epoxy EP-1 and polyester UP-3.laminates with epoxy EP 1 and polyester UP 3.
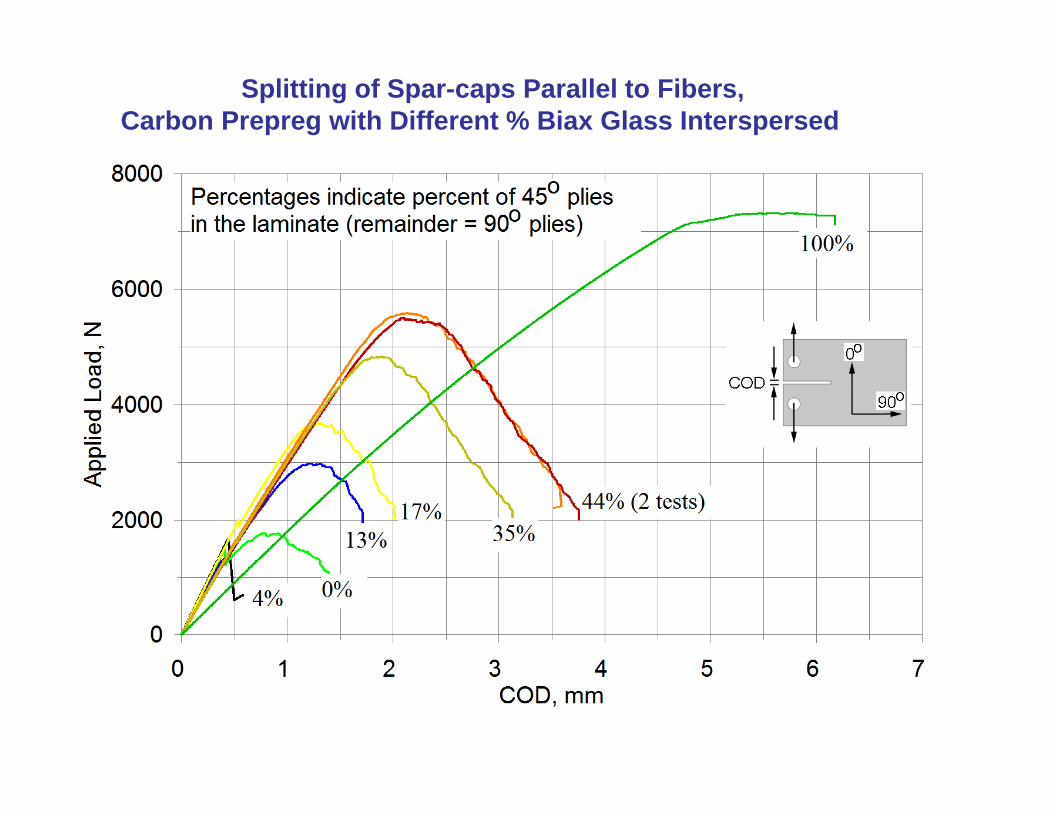
Splitting of Spar-caps Parallel to Fibers, Carbon Prepreg with Different % Biax Glass Interspersed
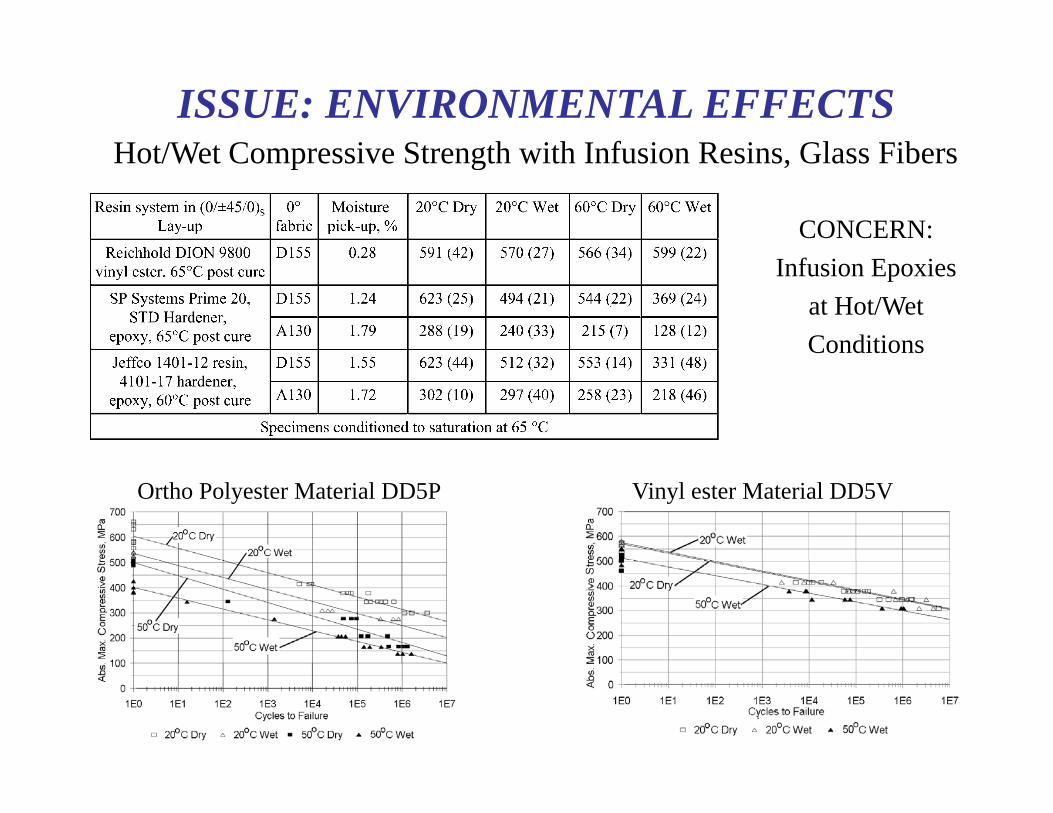
ISSUE: ENVIRONMENTAL EFFECTSHot/Wet Compressive Strength with Infusion Resins Glass FibersHot/Wet Compressive Strength with Infusion Resins, Glass Fibers
CONCERN:Infusion Epoxies
at Hot/WetConditions
Ortho Polyester Material DD5P Vinyl ester Material DD5V
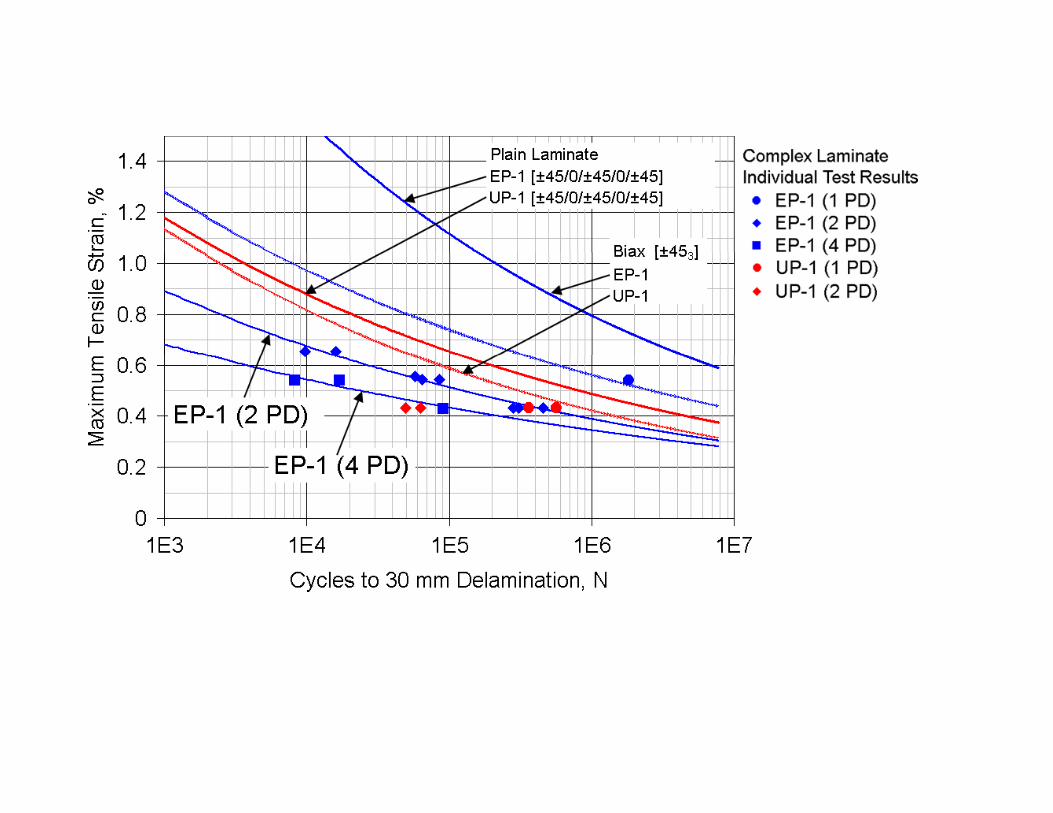
• ISSUE: Fatigue Performance inISSUE: Fatigue Performance in Complex Blade Structure
• How to Compare Resins Inexpensively in• How to Compare Resins Inexpensively in a Realistic Blade ContextT i l Bl d d S b t t T ti i• Typical Blade and Substructure Testing is Slow and Expensive
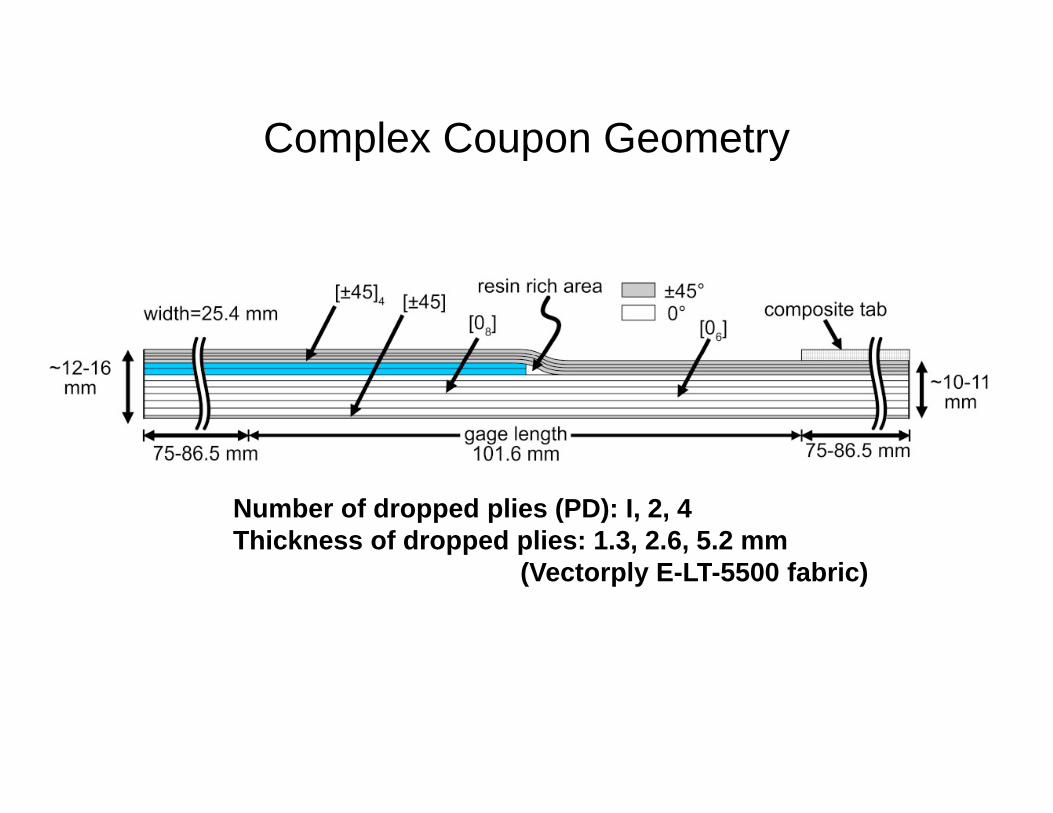
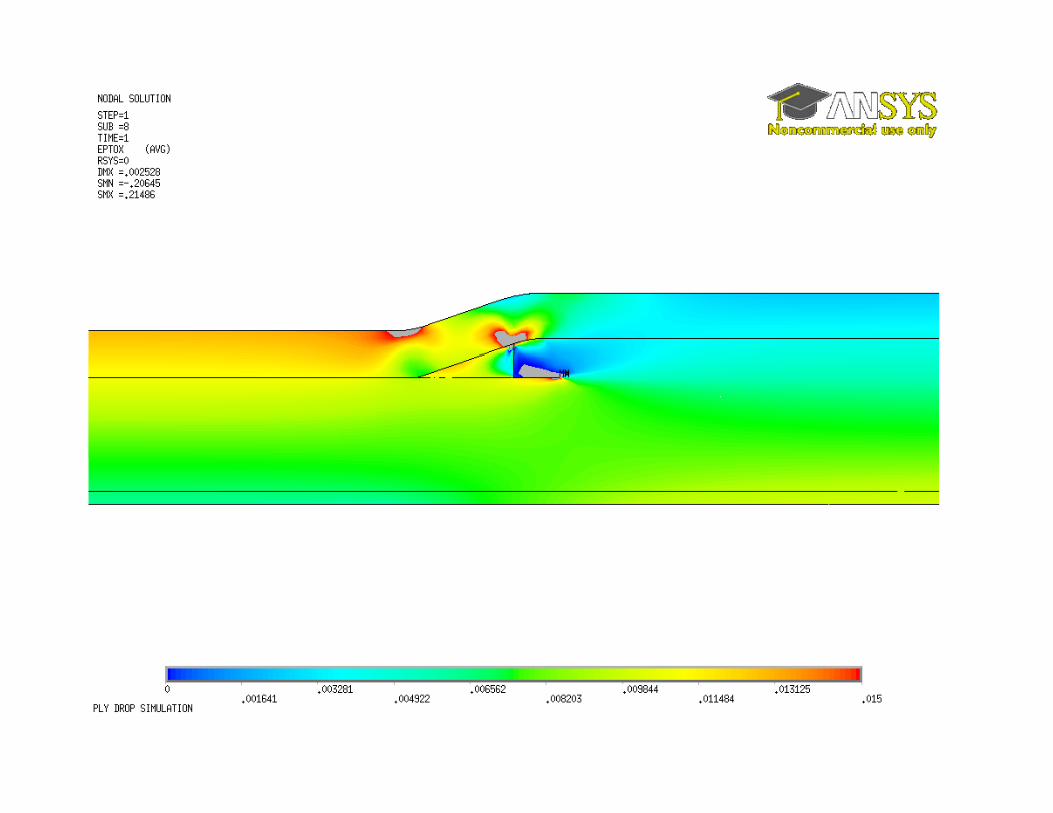
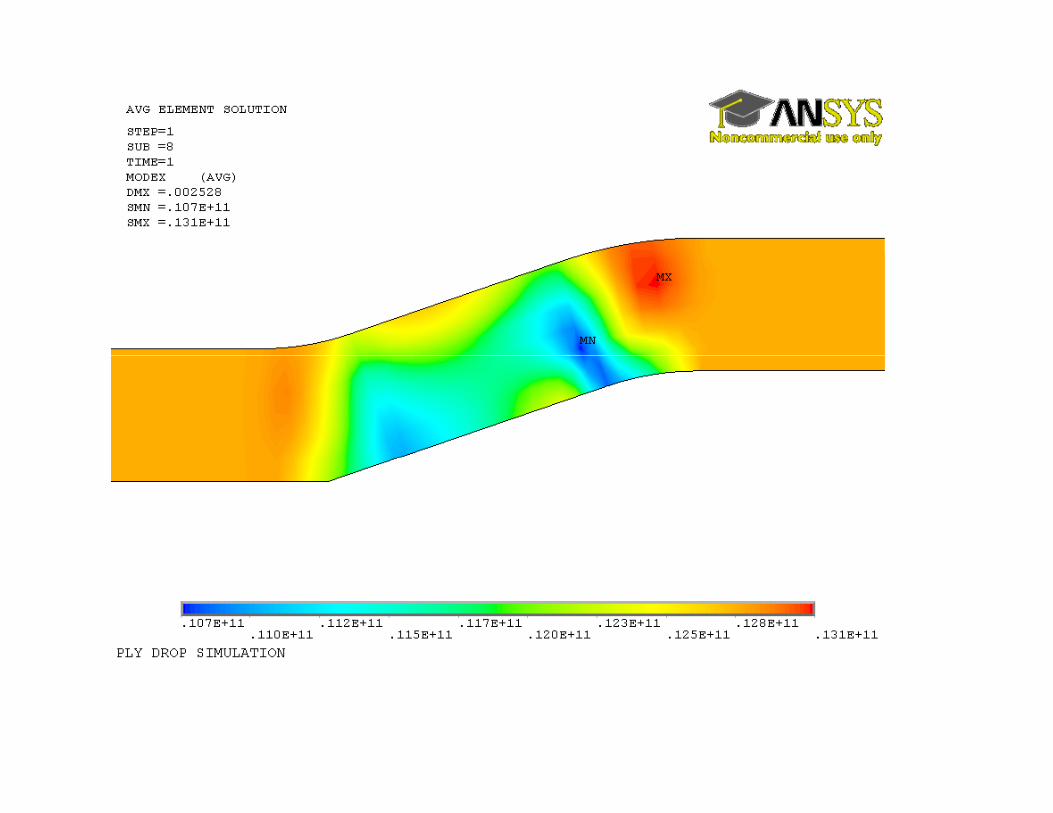
Complex Coupon GeometryComplex Coupon Geometry
Number of dropped plies (PD): I, 2, 4Thickness of dropped plies: 1.3, 2.6, 5.2 mm
(Vectorply E-LT-5500 fabric)
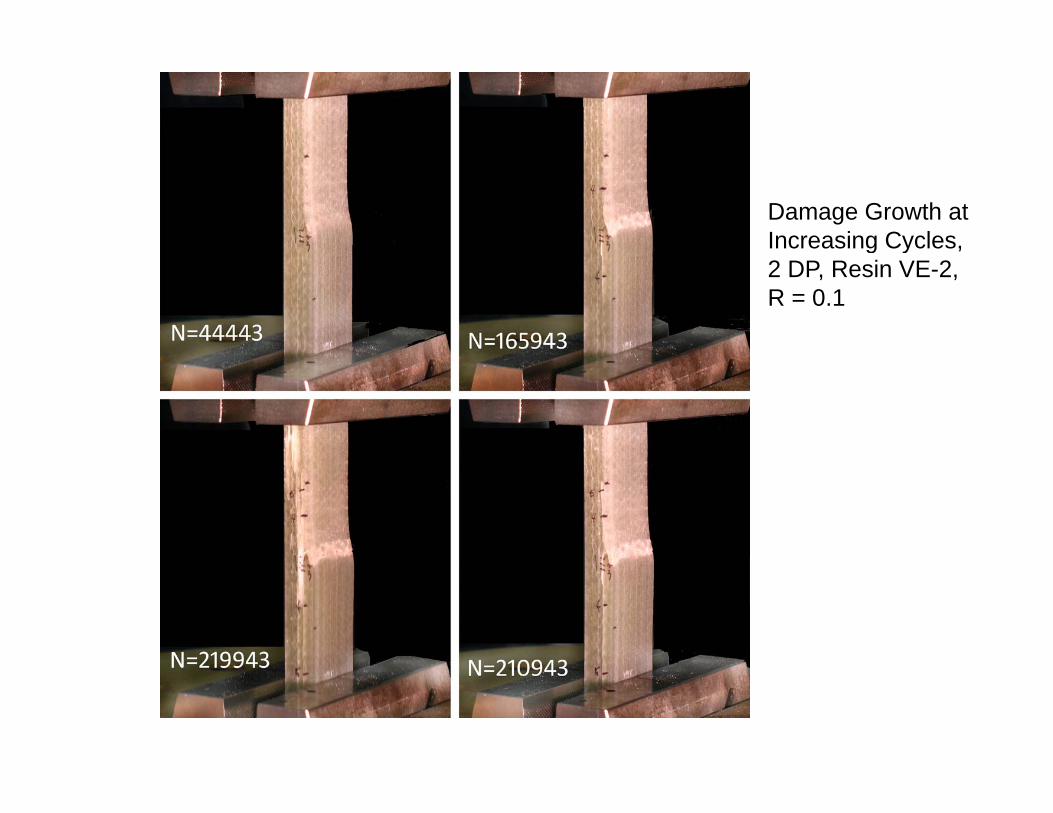
Damage Growth atIncreasing Cycles,g y2 DP, Resin VE-2,R = 0.1
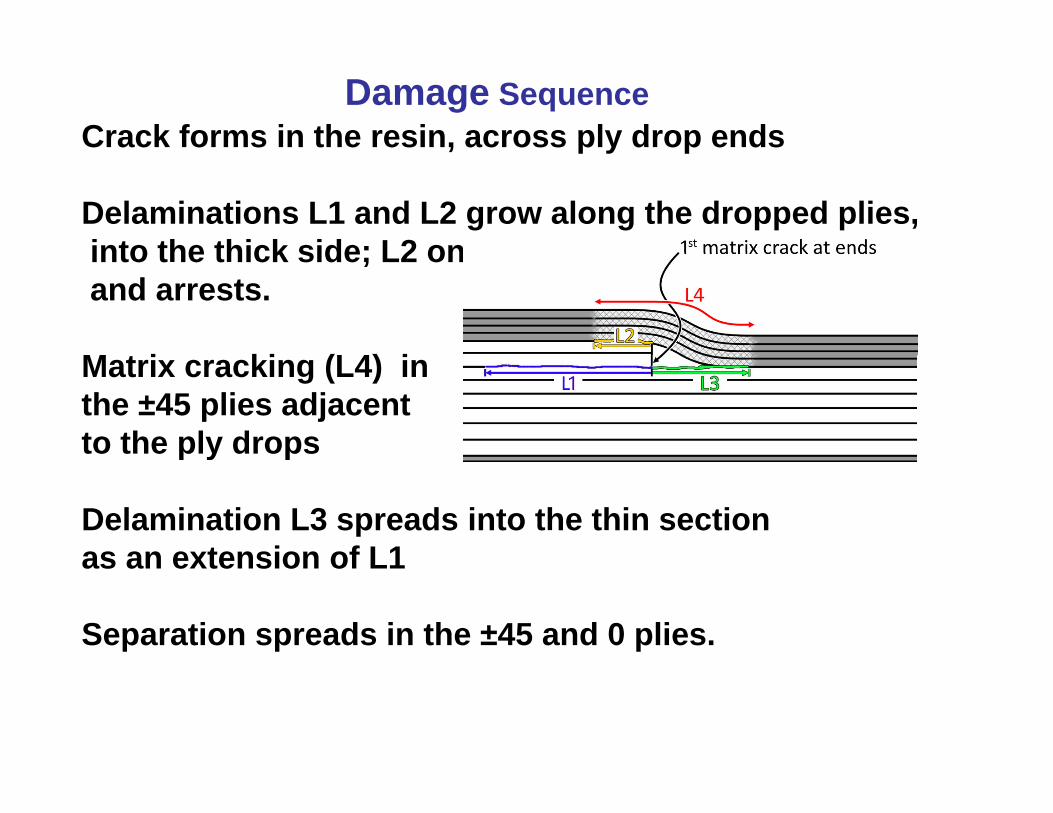
Crack forms in the resin, across ply drop endsDamage Sequence
, p y p
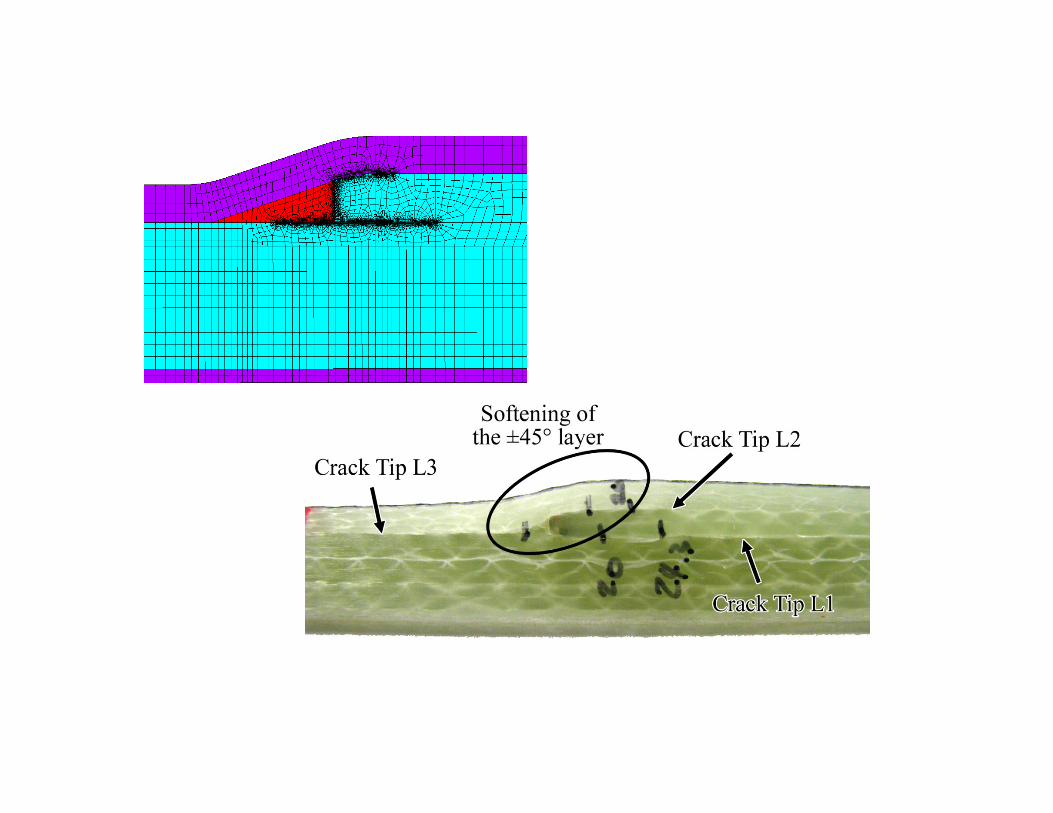
Delaminations L1 and L2 grow along the dropped plies,into the thick side; L2 only grows a short distanceinto the thick side; L2 only grows a short distanceand arrests.
M t i ki (L4) iMatrix cracking (L4) in the ±45 plies adjacent to the ply dropsp y p
Delamination L3 spreads into the thin sectionas an extension of L1as an extension of L1
Separation spreads in the ±45 and 0 plies.
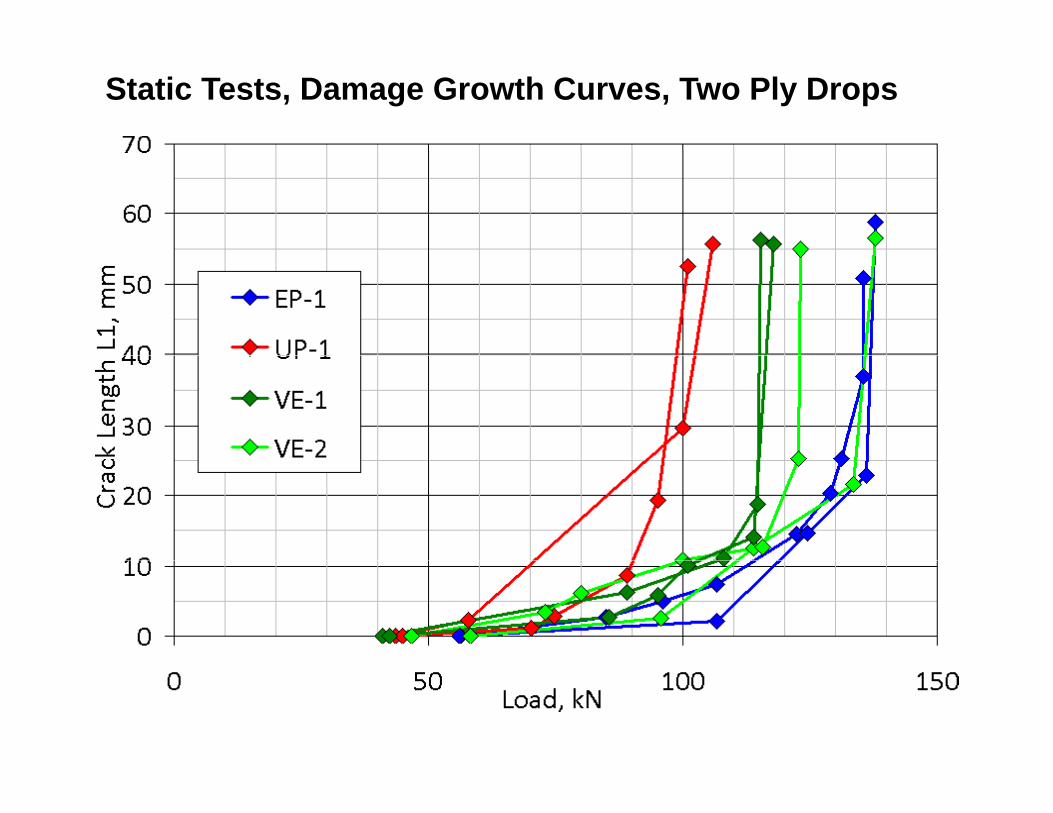
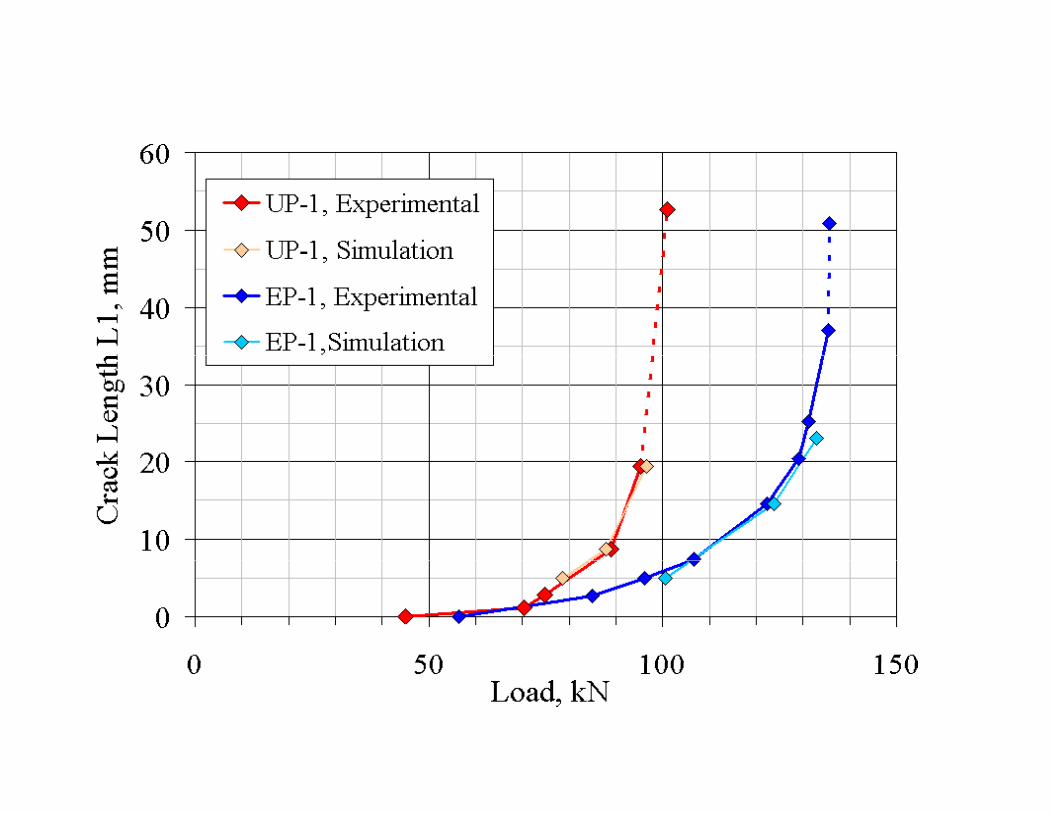
Static Tests, Damage Growth Curves, Two Ply Drops
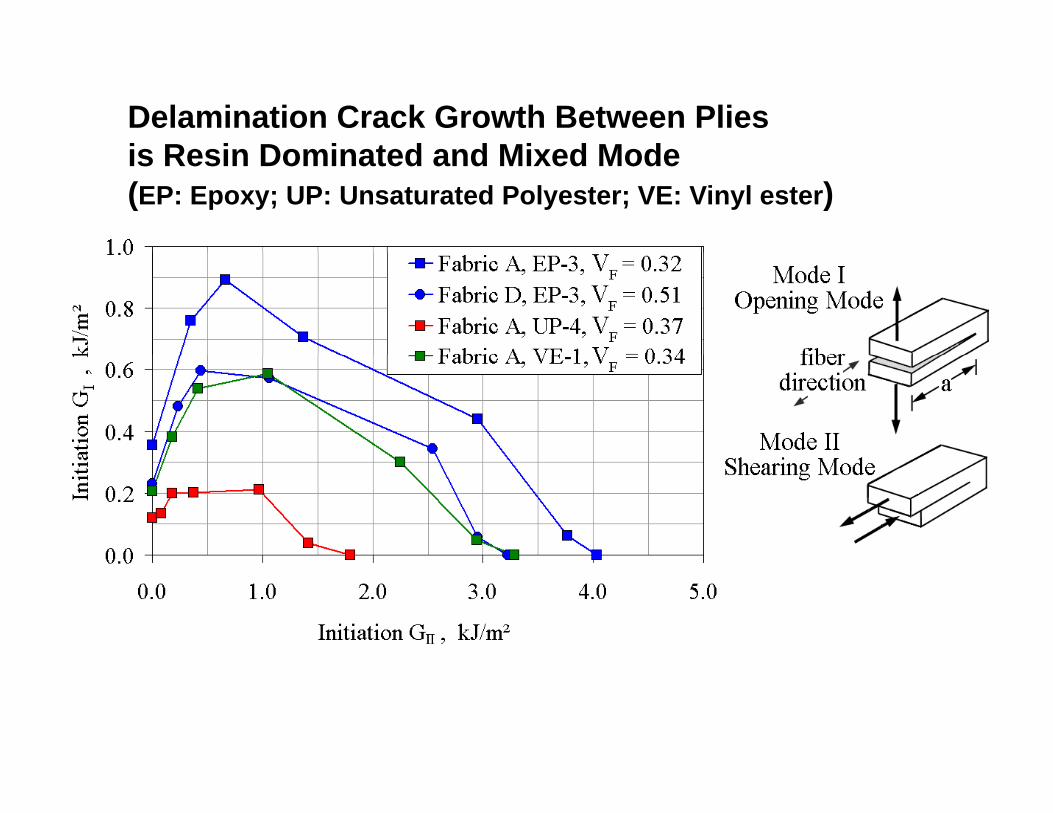
Delamination Crack Growth Between Plies is Resin Dominated and Mixed Modeis Resin Dominated and Mixed Mode(EP: Epoxy; UP: Unsaturated Polyester; VE: Vinyl ester)
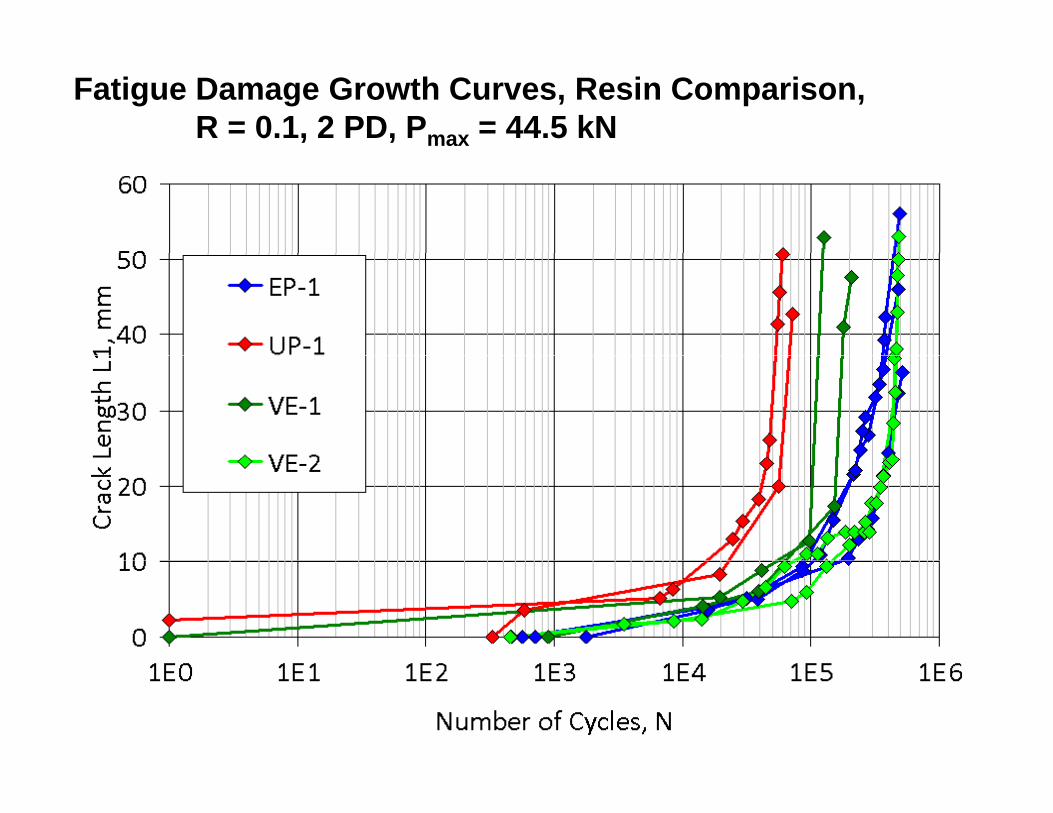
Fatigue Damage Growth Curves, Resin Comparison, R = 0.1, 2 PD, Pmax = 44.5 kN
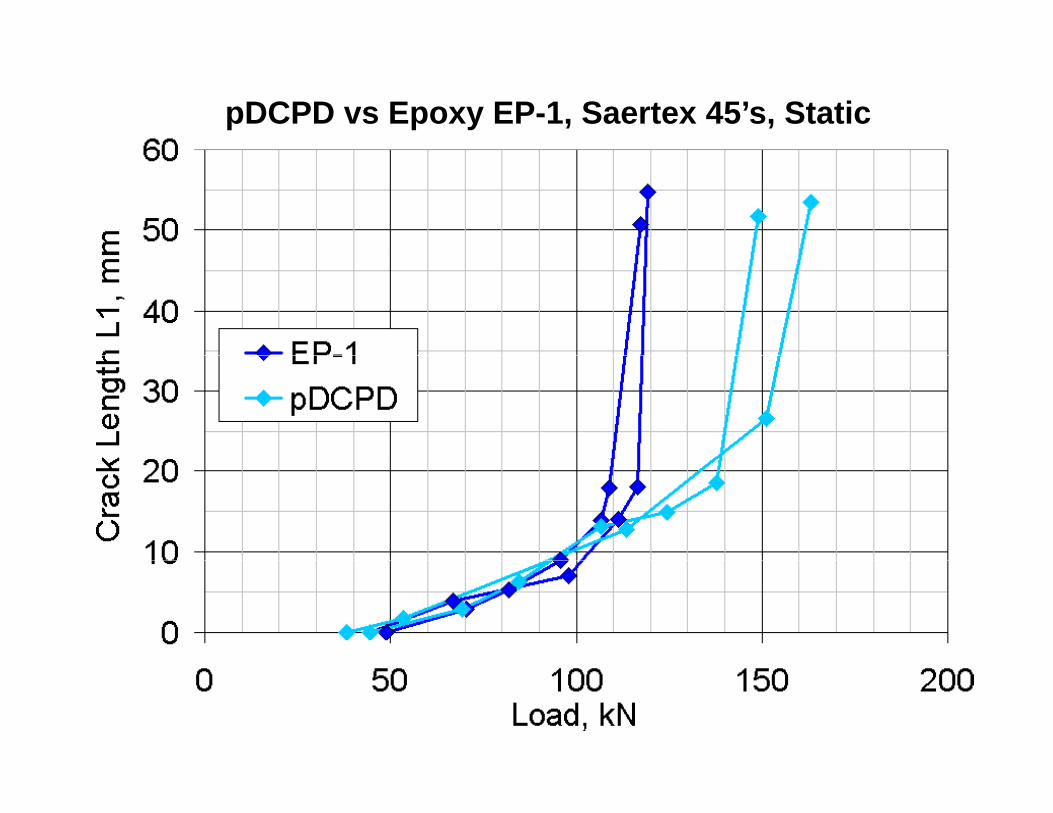
pDCPD vs Epoxy EP-1, Saertex 45’s, Static
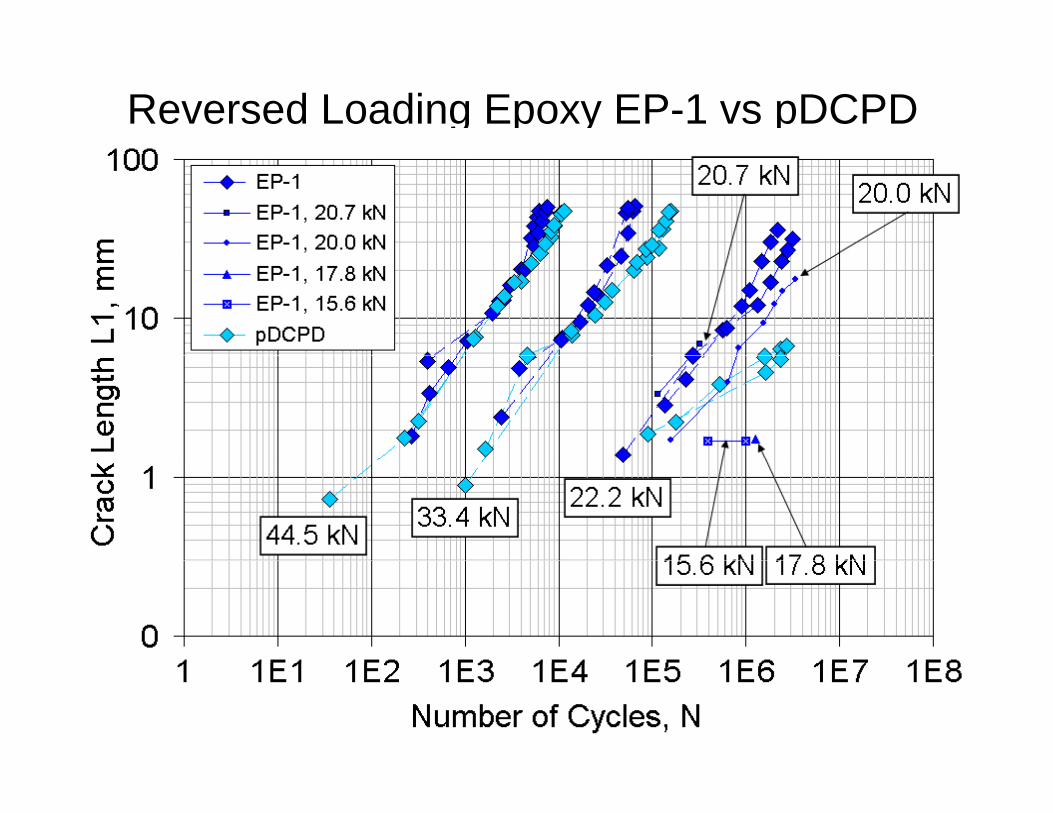
Reversed Loading Epoxy EP-1 vs pDCPD

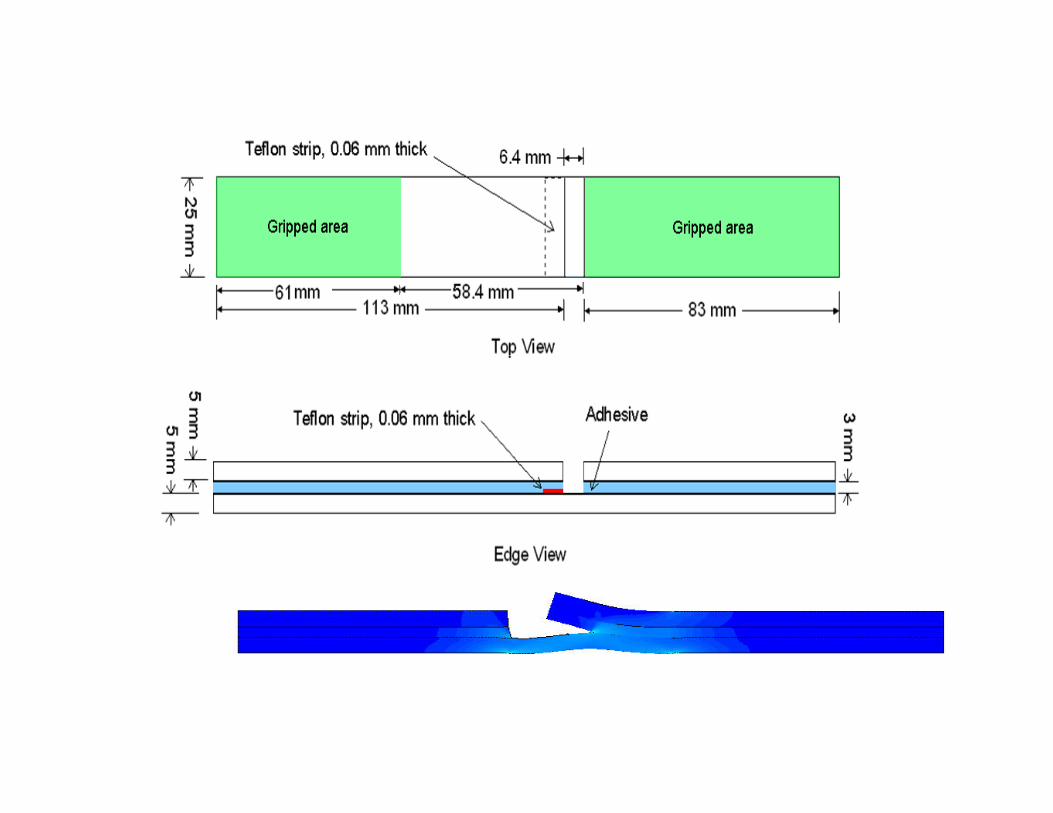
ISSUE: Thick Adhesive Joints
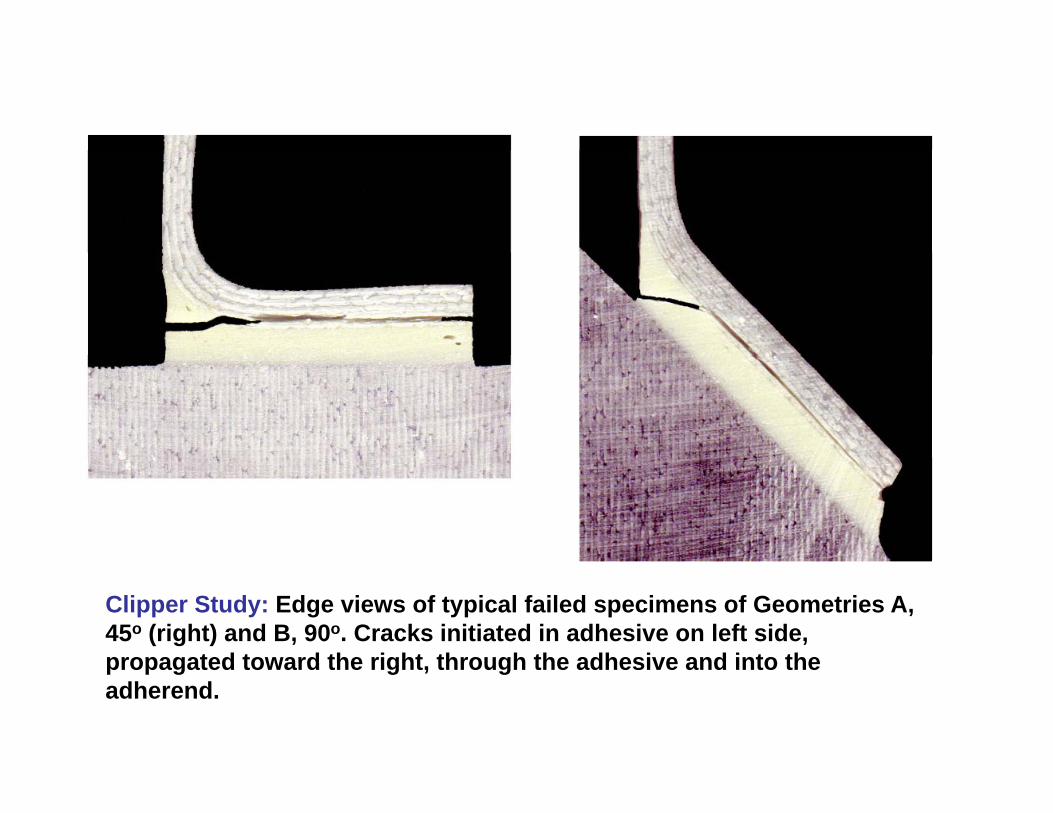
Clipper Study: Edge views of typical failed specimens of Geometries A, 45o (right) and B, 90o. Cracks initiated in adhesive on left side, propagated toward the right through the adhesive and into thepropagated toward the right, through the adhesive and into the adherend.
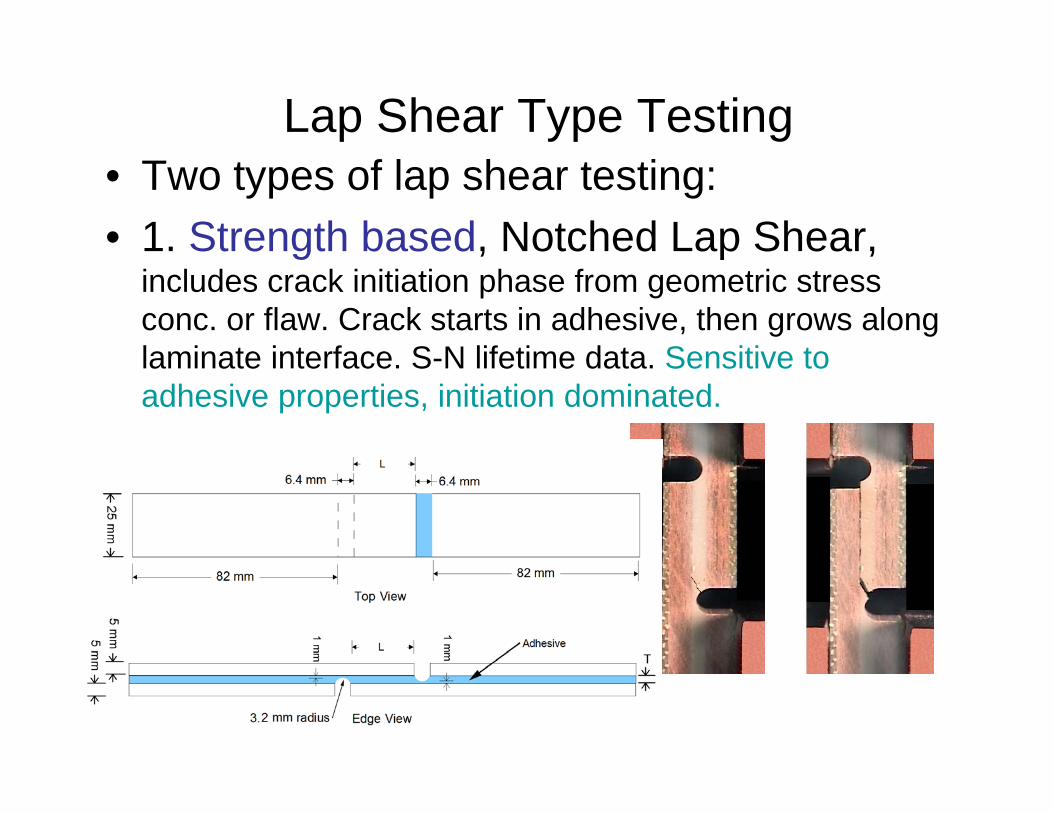
Lap Shear Type Testing• Two types of lap shear testing:• 1. Strength based, Notched Lap Shear, g , p ,
includes crack initiation phase from geometric stress conc. or flaw. Crack starts in adhesive, then grows along laminate interface S N lifetime data Sensitive tolaminate interface. S-N lifetime data. Sensitive to adhesive properties, initiation dominated.
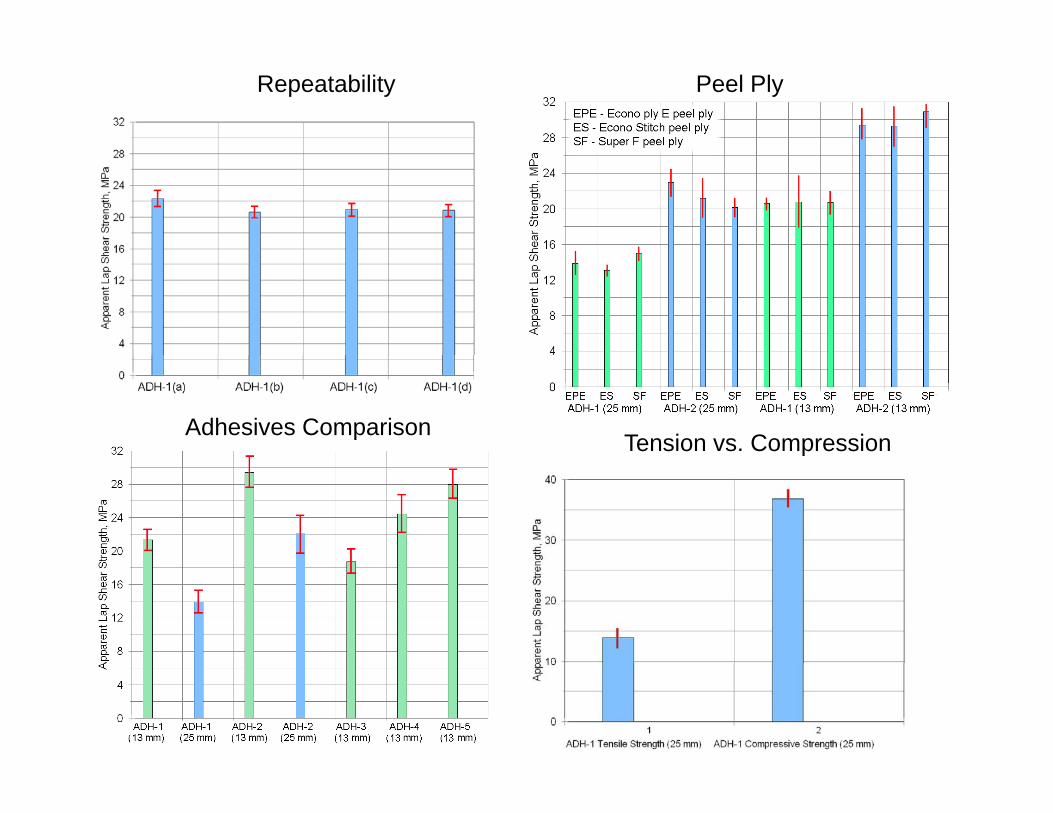
Repeatability Peel Ply
Adhesives ComparisonTension vs. Compression
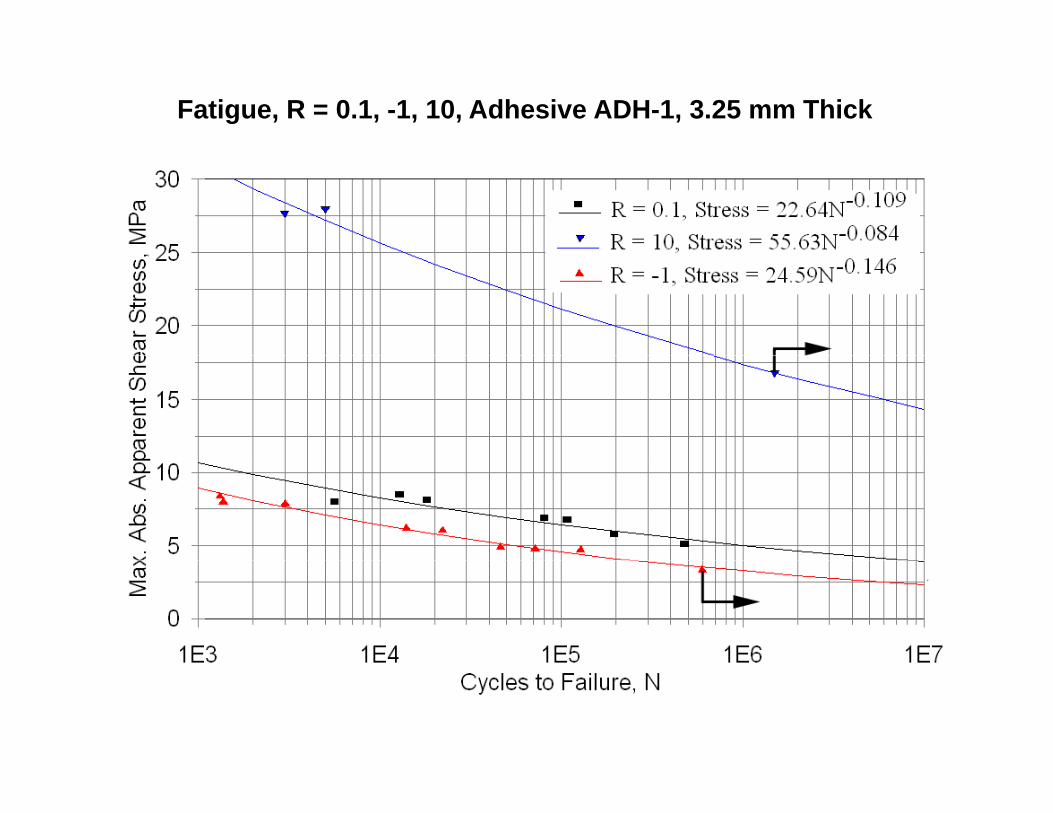
Fatigue, R = 0.1, -1, 10, Adhesive ADH-1, 3.25 mm Thick
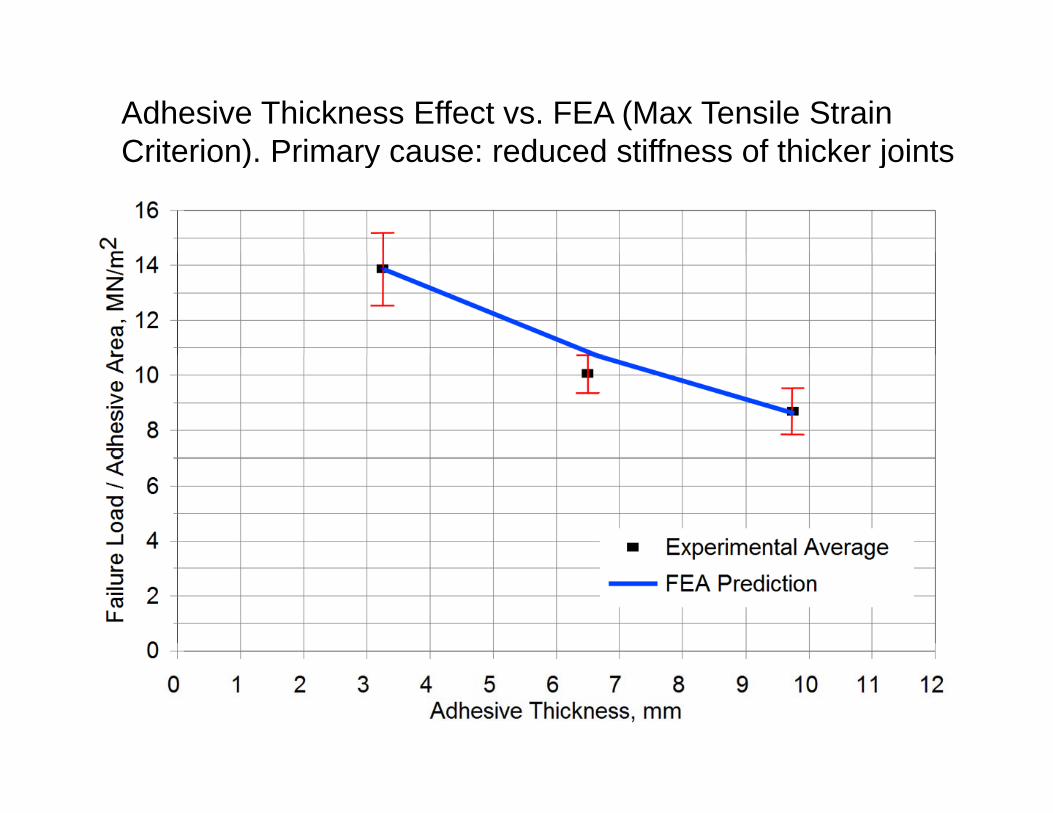
Adhesive Thickness Effect vs. FEA (Max Tensile Strain Criterion) Primary cause: reduced stiffness of thicker jointsCriterion). Primary cause: reduced stiffness of thicker joints
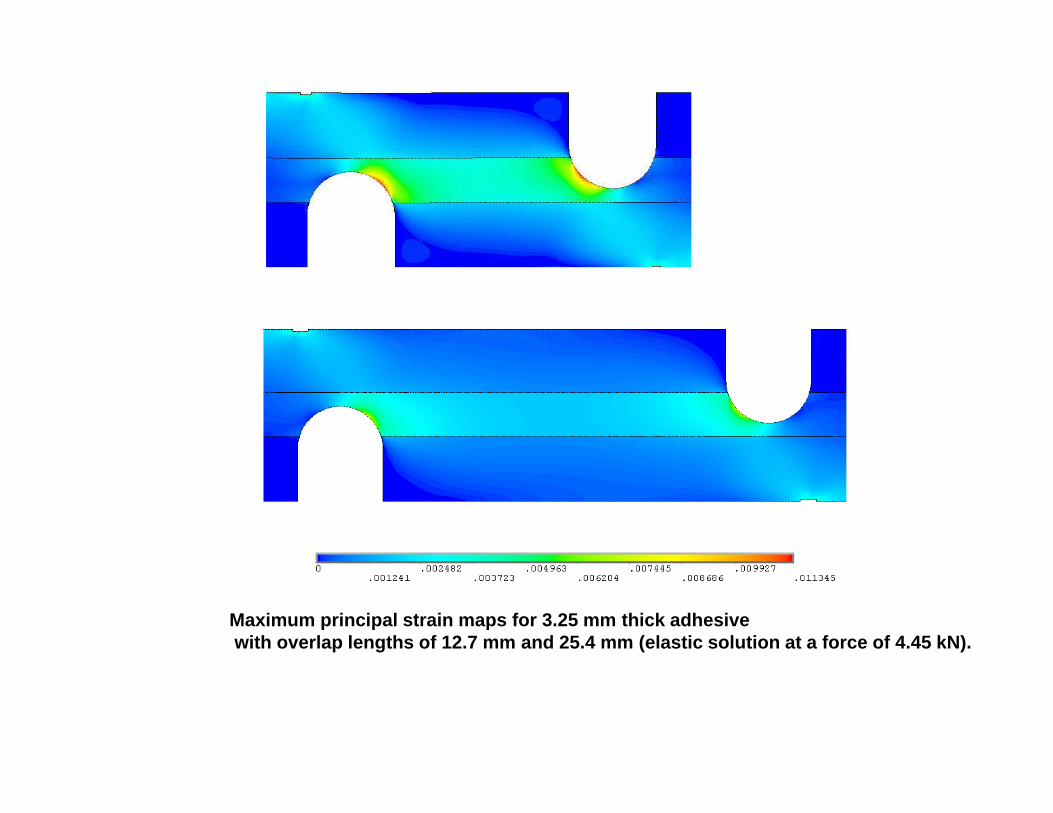
Maximum principal strain maps for 3.25 mm thick adhesivewith overlap lengths of 12.7 mm and 25.4 mm (elastic solution at a force of 4.45 kN).
• 2. Fracture Mechanics Based. Cracked Lap Shear; contains crack starter strip, measure fatigue crack growth rate in terms of strain energy release rates G G G from FEA Crack usually growsrelease rates GI, GII, GT from FEA. Crack usually grows along laminate interface, inside laminate. Tension, compression or reversed loading.
45
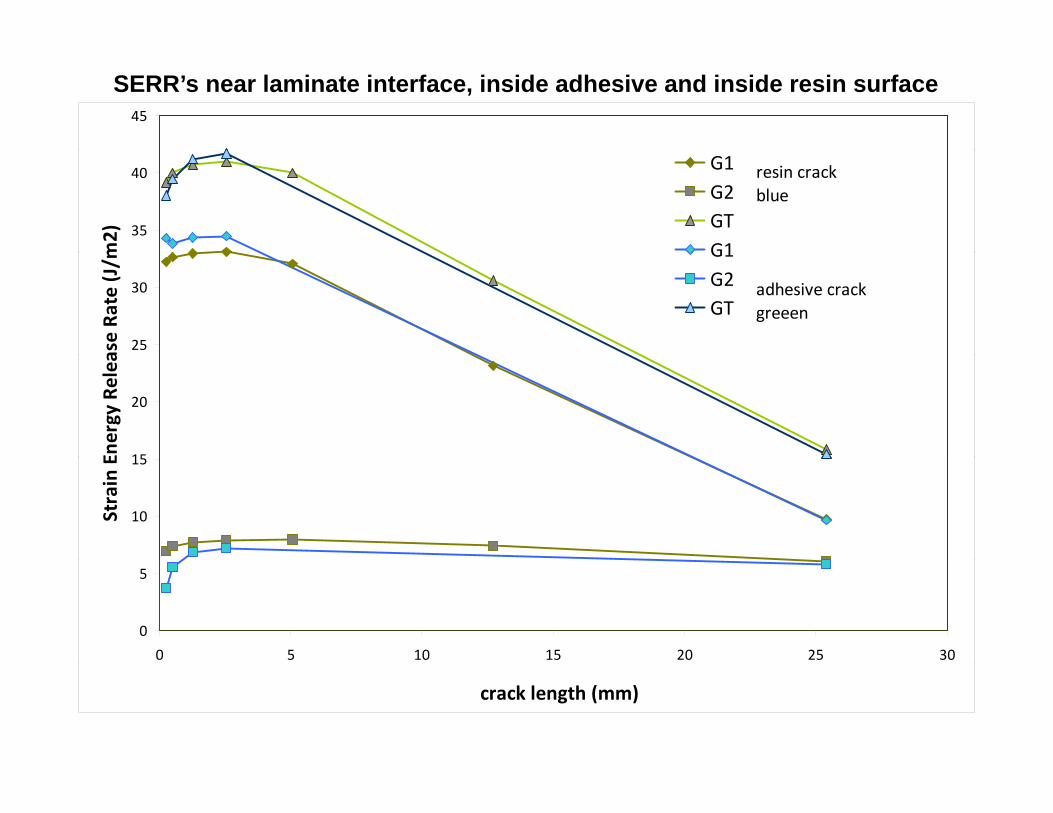
SERR’s near laminate interface, inside adhesive and inside resin surface
35
40
m2)
G1G2GTG1
resin crackblue
25
30
ase Ra
te (J/m G1
G2GT
adhesive crackgreeen
15
20
Energy Relea
10
15
Strain E
0
5
0 5 10 15 20 25 30
crack length (mm)
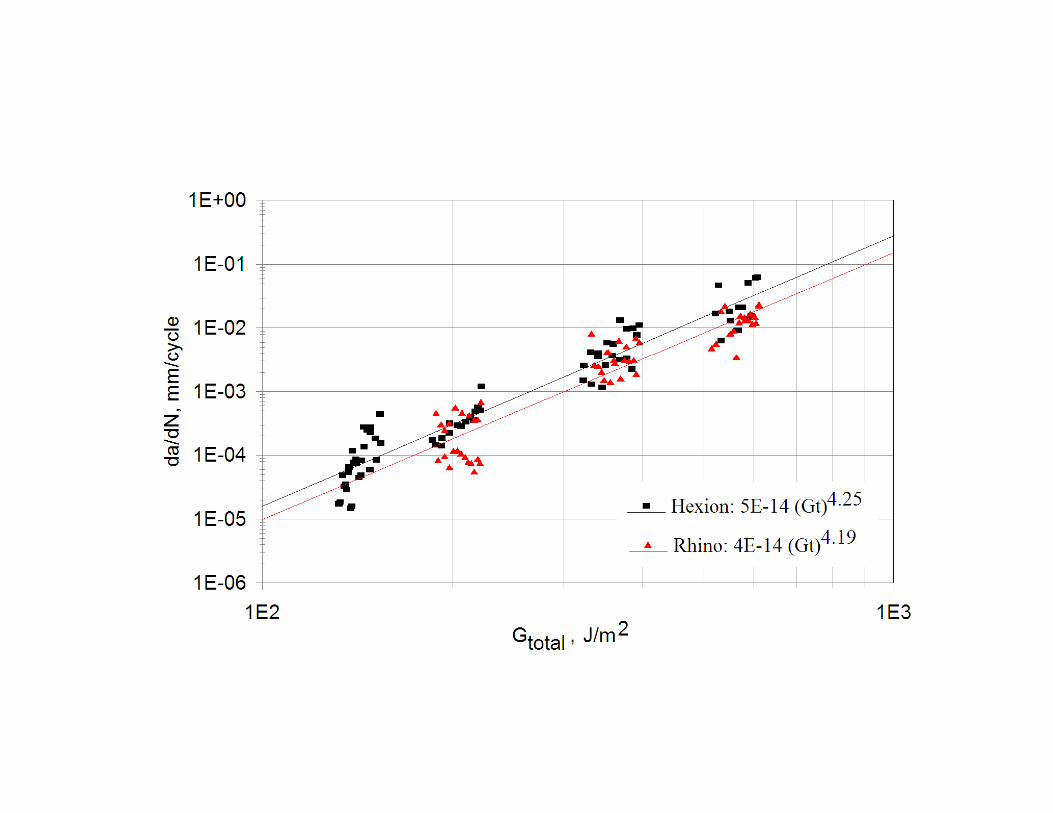
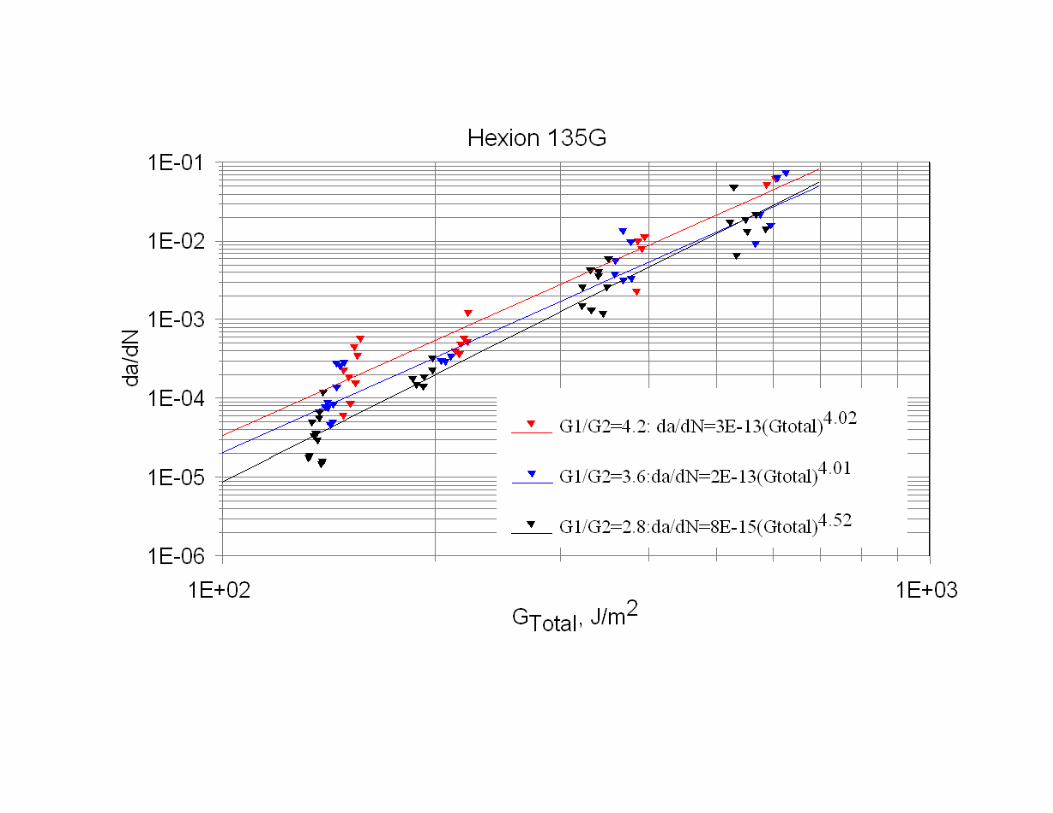
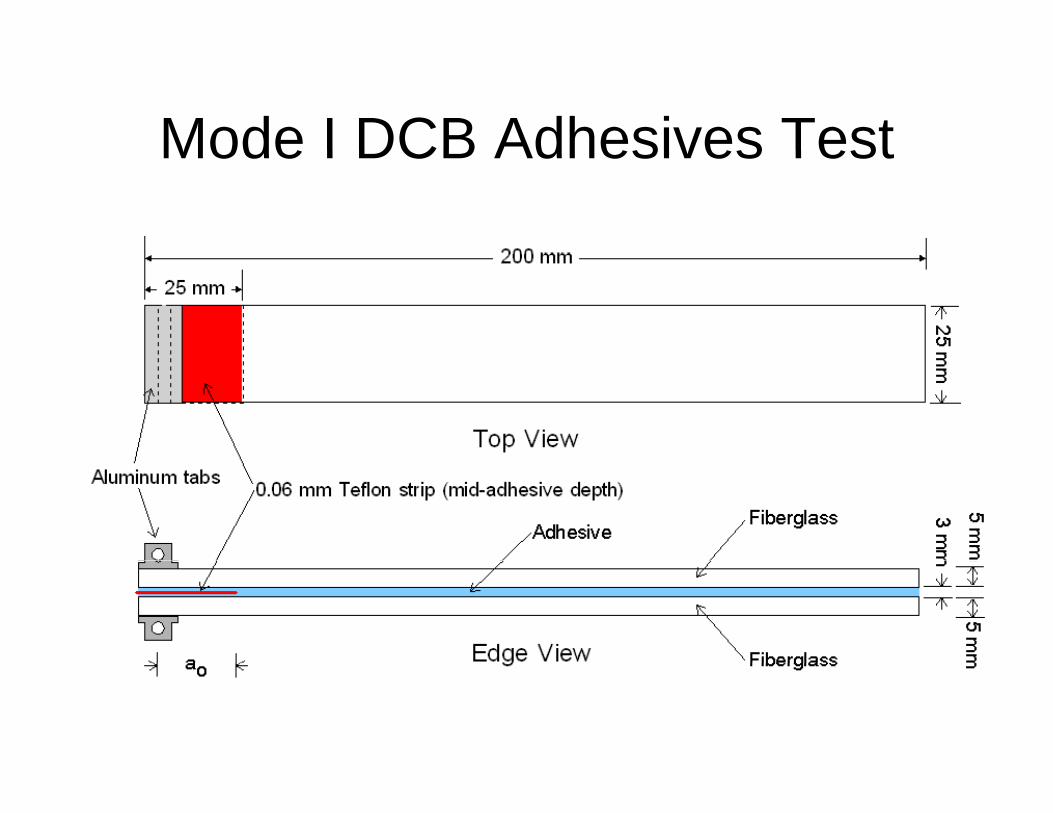
Mode I DCB Adhesives TestMode I DCB Adhesives Test
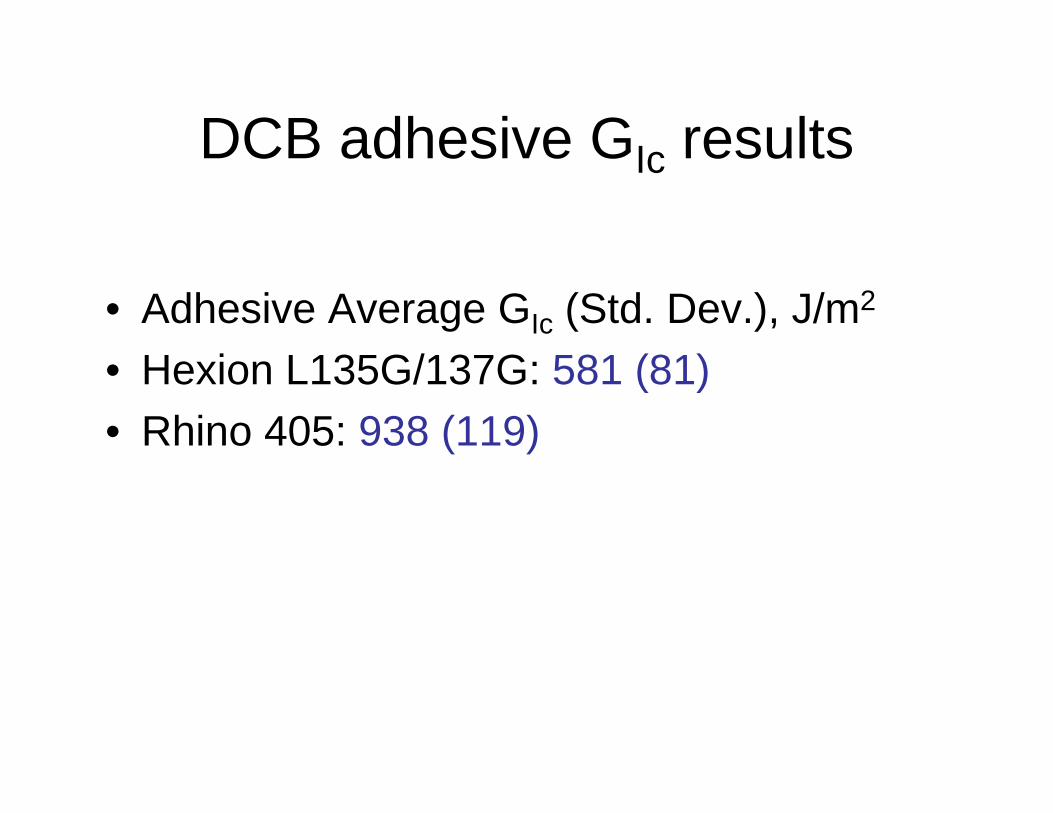
DCB adhesive GI resultsDCB adhesive GIc results
• Adhesive Average GIc (Std. Dev.), J/m2
H i L135G/137G 581 (81)• Hexion L135G/137G: 581 (81)• Rhino 405: 938 (119)
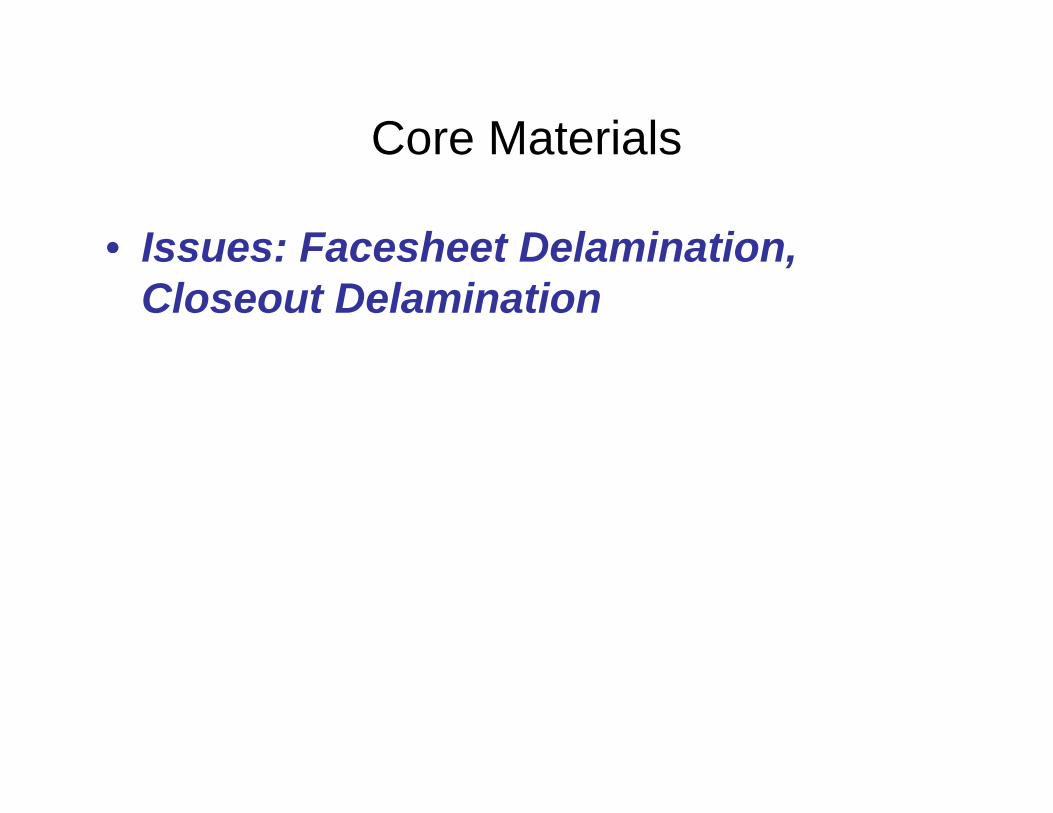
Core MaterialsCore Materials
• Issues: Facesheet DelaminationIssues: Facesheet Delamination, Closeout Delamination
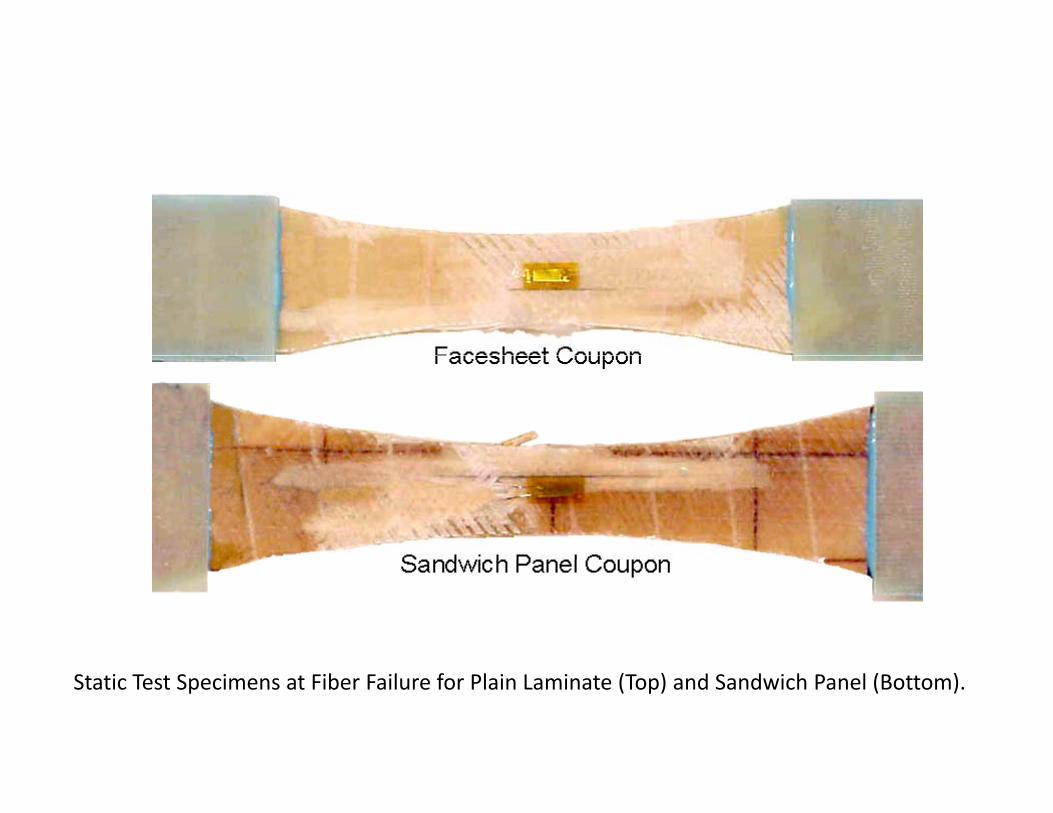
Static Test Specimens at Fiber Failure for Plain Laminate (Top) and Sandwich Panel (Bottom).
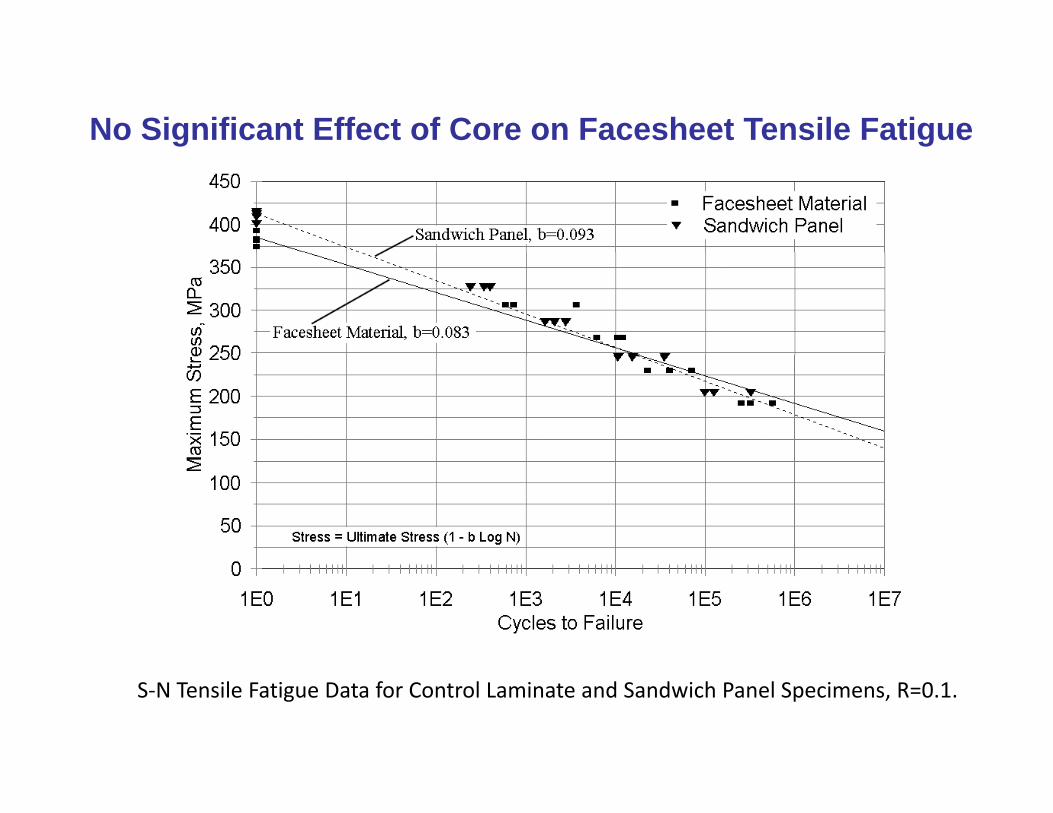
No Significant Effect of Core on Facesheet Tensile Fatigue
S‐N Tensile Fatigue Data for Control Laminate and Sandwich Panel Specimens, R=0.1.
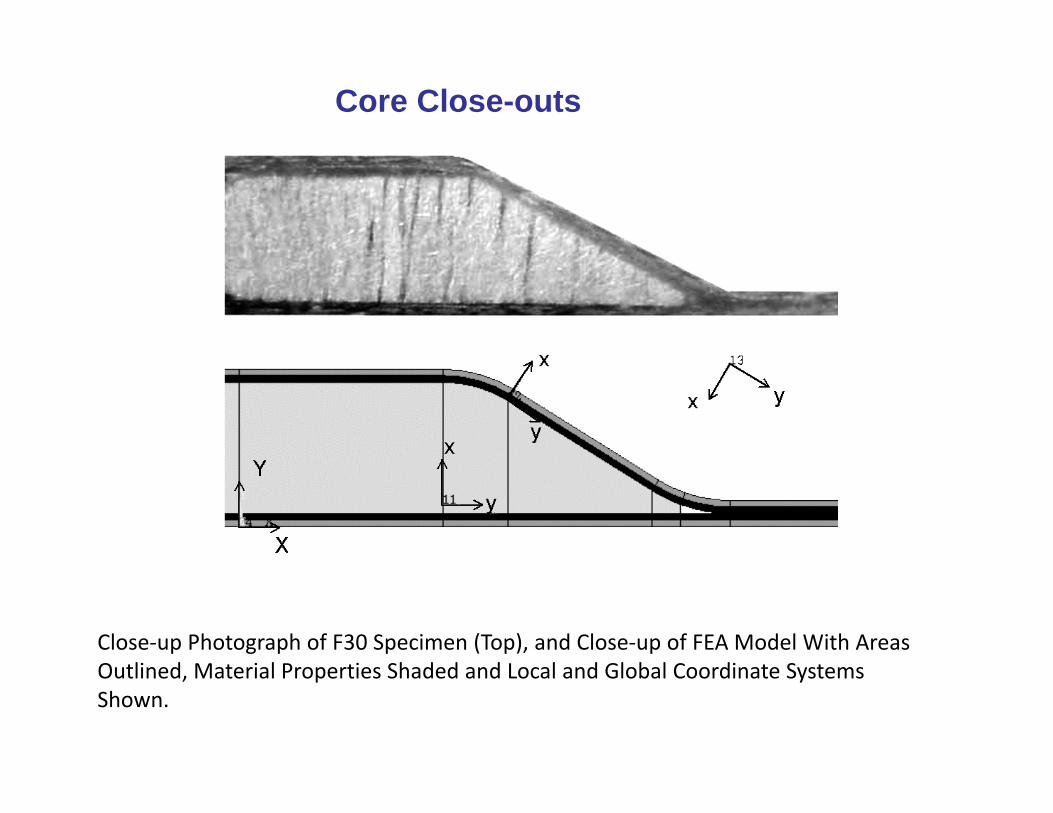
Core Close-outs
Close‐up Photograph of F30 Specimen (Top), and Close‐up of FEA Model With Areas O li d i l i Sh d d d l d Gl b l C di SOutlined, Material Properties Shaded and Local and Global Coordinate Systems Shown.
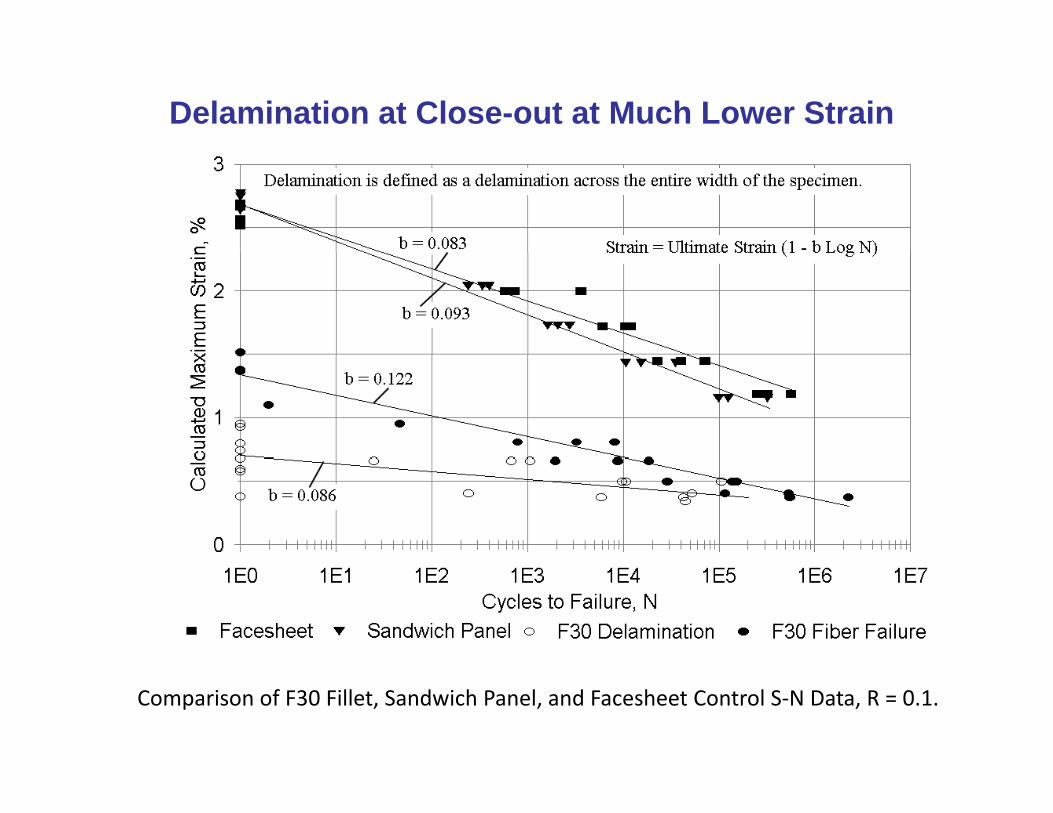
Delamination at Close-out at Much Lower Strain
Comparison of F30 Fillet, Sandwich Panel, and Facesheet Control S‐N Data, R = 0.1.
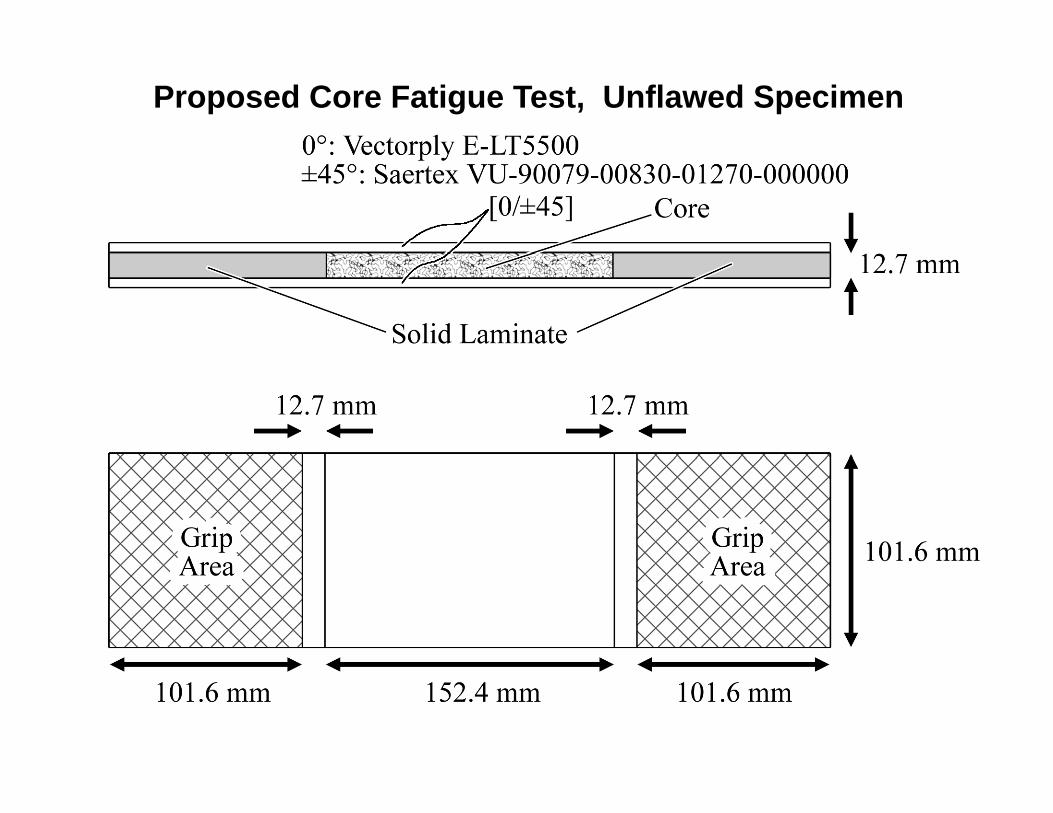
Proposed Core Fatigue Test, Unflawed Specimen