selection on purebred and crossbred performance for … present study deals with estimation of...
TRANSCRIPT
Arch. Tierz., Dummerstorf43 (2000) 3, 249-262
Institute of Animal Breeding and Husbandry, Kiel University, Germany
MARKUS BOSCH, RAINER ROHE, HOLGER LOOFT and ERNST KALM
Selection on purebred and crossbred Performance for litter size in pigs*
Dedicated to Professor Dr. D. Simon on the occasion ofhis 7&h birthday
Summary The present study deals with estimation of genetic parameter for purebred and crossbred Performance of live born piglets, in order to choose the optimal selection method. Data sets of two pure breeds, line L03 and L04, with 5,422 sows, a two line crossbred, L303, with 3,553 sows and a three line crossbred, L350, with 3,609 sows of a North-German breeding Company were recorded. Estimated genetic correlation between purebred and crossbred Performance were rg = 0.59 and 0.40 for reciprocal crosses L03xL04 and L04xL03, respectively. Further investigations showed that the genetic correlation is influenced by genotype-environment interactions between a nucleus farm and a farm on production level. Full-sib effects showed a proportion of FS = 0.06 on the phenotypic variance of litter size. They were confounded with additive genetic variance and permanent environment variance, when full-sib effects were neglected. The percentage of equal selected purebred sires of line L03 were 80% when 30% of the sires selected on purebred or crossbred breeding values. Accuracy of estimated breeding values of purebred sires increased when crossbred Information were considered additionally from 0.32 to 0.38 for line L03 and 0.46 to 0.47 for line L04. Genetic correlation between purebred and crossbred Performance, the genetic connectedness between nucleus and production and the presence of genotype-environment interactions were analysed to have high influence on the value of additionally considered crossbred Performance.
Key Words: swine, litter size, genetic correlation, crossbred Performance
Zusammenfassung Titel der Arbeit: Selektion der WurfgröOe beim Schwein unter Verwendung von Reinzucht- und Kreuzungsleistung In der vorliegenden Untersuchung wurden genetische Parameter für Reinzucht- und Kreuzüngsleistung für lebend geborene Ferkel geschätzt, um die optimale Selektionsmethode auszuwählen. Die Daten von zwei Reinzuchtlinien, die Linien L03 und L04, mit 5.422 Sauen, der reziproken Zweilinienkreuzung, L303, mit 3.553 Sauen und einer Dreilinienkreuzung, L350, mit 3.609 Sauen wurden von einem norddeutschen Zuchtunternehmen bereitgestellt. Die genetischen Korrelationen zwischen Reinzucht- und Kreuzungsleistung wurden mit rg = 0,40 und 0,59 geschätzt. Weitere Analysen zeigten, daß die genetischen Korrelationen durch Genotyp*Umwelt*Interaktionen zwischen einem Nukleus- und einem Ferkelerzeugerbetrieb beeinflußt sind. Die Vollgeschwistereffekte zeigten einen Anteil von VG = 0,06 an der phänotypischen Varianz für Wurfgröße. Sie sind mit der additiv genetischen Varianz und der permanenten Umweltvarianz confounded, wenn sie nicht berücksichtigt werden. Der Anteil der gleich selektierten Reinzuchteber beim Vergleich von vier Selektionsmethoden zeigt nur zwischen der ausschließlichen Selektion nach Reinzuchtleistung und der direkten Selektion nach Kreuzungsleistung nennenswerte Unterschiede. Die Genauigkeit der geschätzten Zuchtwerte der Reinzuchteber stieg von 0,32 auf 0,38 bei L03 und von 0,46 auf 0,47 bei L04, wenn Kreuzungsinformationen berücksichtigt wurden. Die genetische Korrelation zwischen Reinzucht- und Kreuzungsleistung, die genetische Verknüpfung zwischen Nukleus- und Produktionsstufe sowie Genotyp-Umwelt Interaktionen zeigten in den Analysen einen großen Einfluß auf die Werte der zusätzlich berücksichtigten Kreuzüngsleistung.
Schlüsselwörter: Schwein, Wurfgröße, genetische Korrelation, Kreuzungsleistung
• Die Untersuchung wurde mit finanzieller Forderung durch die Deutsche Forschungsgemeinschaft durchgeführt.
250 BOSCH et al.: Selection on purebred and crossbred Performance for litter size in pigs
Introduction and Literature The importance of sow productivity like litter size in swine breeding has increased during the last years. Crossing of fertile purebred lines is an effective tool to increase litter size in commercial breeding programs in order to use individual and maternal heterosis. At present, sires were selected due to their purebred Performance although the breeding goal is based on production level (BRASCAMP, 1985; KRIETER, 1994). When Information from crossbreeding is used in evaluation of breeding value reliable records of descendence and Performance are necessary. Furthermore, the genetic connectedness through füll- and half-sibs must be guaranteed over all levels of the breeding pyramid. In case of a genetic correlation (rPC) of less than one the selection response realised in purebred will not be fully transmitted to crossbreeding level. Thus, the knowledge of the genetic association between purebred and crossbred Performance (rPC) and the heritabilities (h2
P, h2c) are crucial for the choice of the appropriate selection strategy
(BELL, 1982). Estimation of the additive genetic correlation is difficult for traits with low heritabilities which are associated with high Standard errors. Also the estimates of additive genetic covariance may be biased by genotype-environment interactions. Additionally, non-additive genetic effects, like dominance and epistasis, may be a further reason for biased estimates of additive genetic correlations.
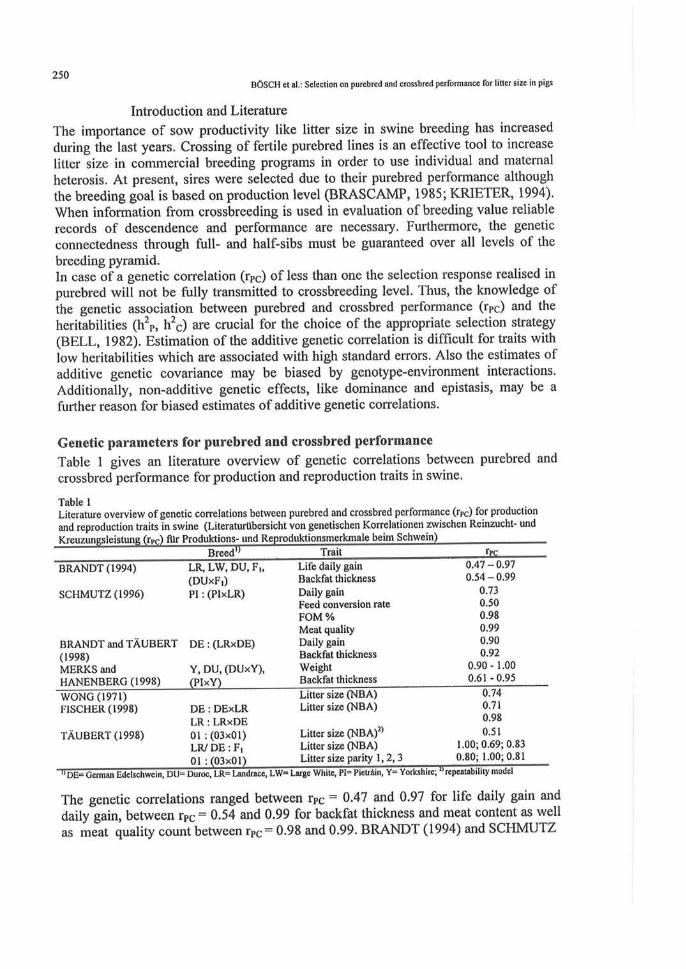
Genetic parameters for purebred and crossbred Performance Table 1 gives an literature overview of genetic correlations between purebred and crossbred Performance for production and reproduction traits in swine.
Table 1 Literature overview of genetic correlations between purebred and crossbred Performance (rPC) for production and reproduction traits in swine (Literaturübersicht von genetischen Konelationen zwischen Reinzucht- und Kreuzungsleistung (rPC) ftlr Produktions- und Reproduktionsmerkmale beim Schwein)
Breed rr Trait rpc
BRANDT (1994)
SCHMUTZ (1996)
BRANDT and TAUBERT (1998) MERKS and HANENBERG (1998)
LR, LW, DU, F,, (DUxF,) PI : (PIxLR)
DE : (LRxDE)
Y, DU, (DUxY), (PIxY)
Life daily gain Backfat thickness Daily gain Feed conversion rate FOM % Meat quality Daily gain Backfat thickness Weight Backfat thickness
0.47 - 0.97 0.54-0.99
0.73 0.50 0.98 0.99 0.90 0.92
0.90-1.00 0.61-0.95
WONG (1971) FISCHER (1998)
TÄUBERT(1998)
DE : DExLR LR:LRxDE 01 : (03x01) LR/ DE : F, 01 : (03x01)
Litter size (NBA) Litter size (NBA)
Litter size (NBA)2' Litter size (NBA) Litter size parity 1, 2, 3
0.74 0.71 0.98 0.51
1.00; 0.69; 0.83 0.80; 1.00; 0.81
'*DE= German Edelschwein, DU= Duroc, LR= Landrace, LW= Urge White, PI= Pietrain, Y= Yorkshire; "repeatability model
The genetic correlations ranged between rPC = 0.47 and 0.97 for life daily gain and daily gain, between rPC = 0.54 and 0.99 for backfat thickness and meat content as well as meat quality count between rPC= 0.98 and 0.99. BRANDT (1994) and SCHMUTZ

251 Arch. Tierz. «(2000) 3
(1996) conclude from their results for production traits that selection on purebred Performance as to improve crossbred Performance is sufficient to increase these traits on production level. The genetic correlations for litter size between purebred and crossbred populations were based on progeny Performance from 181 purebred sires by WONG et al. (1971) and 61 sires of German Edelschwein and 17 sires of Landrace (FISCHER, 1998). TÄUBERT (1998) considered information from progenies of 222 Australian purebred sires. The genetic correlations were estimated from moderate to very high level with rPC = 0.51 to 1.0. The authors applied repeatability as well as multi-trait animal modeis. Heritabilities of crossbred Performance did not differ from estimates of purebred Performance as shown by FISCHER (1998) and TÄUBERT (1998). Deviations were specific for each of the analysed population. Standard errors of heritabilities tend to be higher for crossbred than for purebred population (FISCHER, 1998).
Use of crossbred Performance in breeding programs BAUMUNG et al. (1998) recommended a combined selection where the breeding goal is the maximum success in the crossbred population without reduction in purebred Performance. WEI and VAN DER WERF (1994) estimated in a Simulation study an advantage of 5% in genetic gain for the crossbred Performance for reproduction and fitness traits, when both information sources, crossbred - and purebred records, were combined in breeding value estimation (CCPS-method). The Performance of both level were treated as different traits and were weighted in a selection index. BIJMA and VAN ARENDONK (1998) simulated the asymptotic response of a sire line in which the breeding goal was the improvement of crossbred Performance. With rPC = 0.80 (h = 0.15) they obtained a small advantage of combined crossbred and purebred Performance (CCPS) over pure line selection (PLS). But with decreasing correlation (rPC) the improvement by using CCPS increased exponentially so that with a correlation of rPC = 0.40 the response to selection were more than two times higher than using PLS.
All authors concluded that the CCPS is optimal to obtain genetic gain in crossbred lines because gene frequency differences in purebred lines and dominance effects can be considered. The genetic gain in crossbred Performance is always higher using CCPS compared to purebred selection.
Aim of the study
The aim of the study is the estimation of genetic correlations between purebred and crossbred lines for litter size with data sets from a commercial breeding Company in Northern Germany. For the estimation of variance components a repeatability model was used. The variance of full-sib effects and their influence on the genetic parameter is a indication for non-additive gene effects. Moreover, genetic correlations between a nucleus farm and a production farm were estimated, to investigate, if genotype-environment interactions lead to biased estimates of the correlation between purebred and crossbred Performance. The variance components were used to obtain breeding values to find the optimal selection strategy for the observed lines.
252 BOSCH et al.: Selection on purebred and crossbred Performance for litter size in pigs
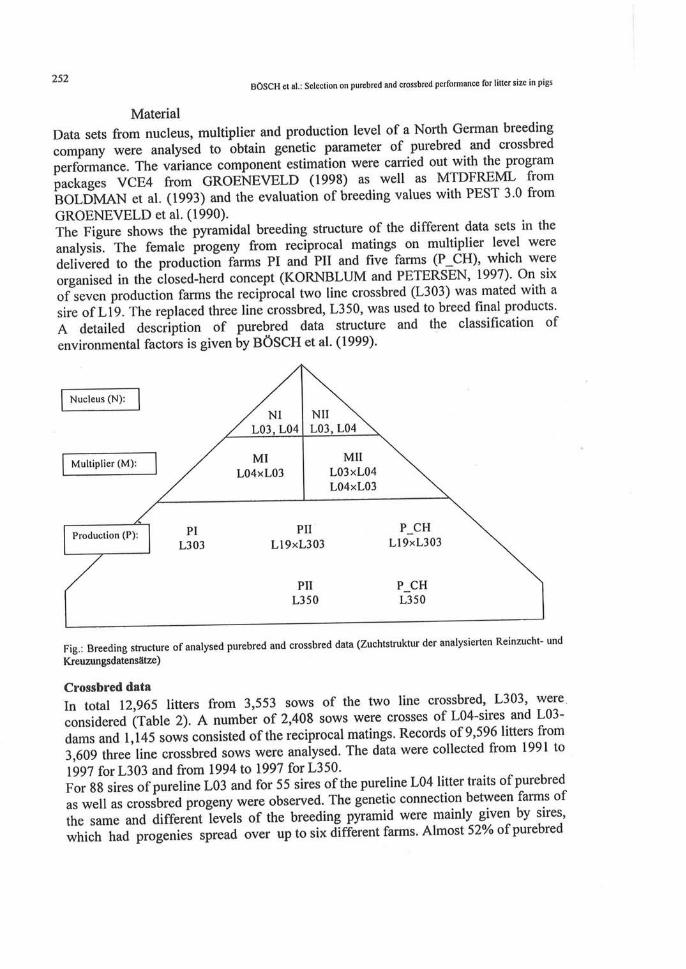
Material Data sets from nucleus, multiplier and production level of a North German breeding Company were analysed to obtain genetic parameter of purebred and crossbred Performance The variance component estimation were carried out with the program packages VCE4 from GROENEVELD (1998) as well as MTDFREML from BOLDMAN et al. (1993) and the evaluation of breeding values with PEST 3.0 from GROENEVELD et al. (1990). The Figure shows the pyramidal breeding structure of the different data sets in the analysis. The female progeny from reciprocal matings on multiplier level were delivered to the production farms PI and PII and five farms (P_CH), which were organised in the closed-herd concept (KORNBLUM and PETERSEN, 1997). On six of seven production farms the reciprocal two line crossbred (L303) was mated with a sire of L19. The replaced three line crossbred, L350, was used to breed final products. A detaiied description of purebred data structure and the Classification of environmental factors is given by BOSCH et al. (1999).
Fig.: Breeding structure of analysed purebred and crossbred data (Zuchtstruktur der analysierten Reinzucht- und Kreuzungsdatensätze)
Crossbred data In total 12,965 litters from 3,553 sows of the two line crossbred, L303, were considered (Table 2). A number of 2,408 sows were crosses of L04-sires and L03-dams and 1,145 sows consisted of the reciprocal matings. Records of 9,596 litters from 3,609 three line crossbred sows were analysed. The data were collected from 1991 to 1997 for L303 and from 1994 to 1997 for L350. For 88 sires of pureline L03 and for 55 sires of the pureline L04 litter traits of purebred as well as crossbred progeny were observed. The genetic connection between farms of the same and different levels of the breeding pyramid were mainly given by sires, which had progenies spread over up to six different farms. Almost 52% of purebred
253 Arch. Tierz. 43 (2000) 3
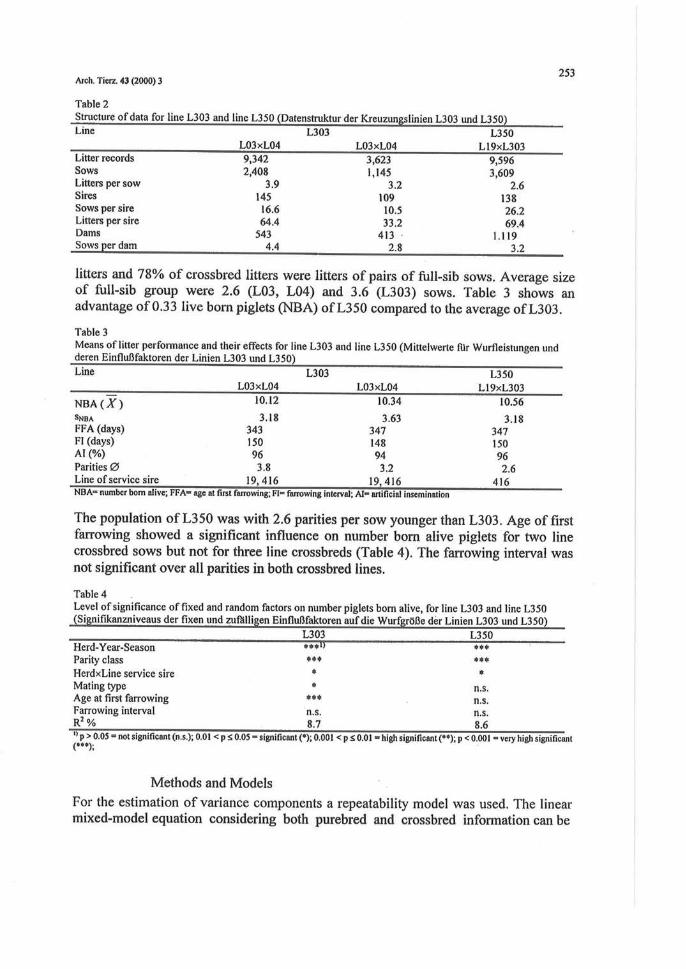
Table 2 Structure of data for line L303 and line L350 (Datenstruktur der Kreuzungslinien L303 und L350) Line L303 L350
L03xL04 L03xL04 L19xL303 Litter records 9,342 3,623 9,596 Sows 2,408 1,145 3,609 Litters per sow 3.9 3.2 2.6 Sires 145 109 138 Sows per sire 16.6 10.5 26.2 Litters per sire 64.4 33.2 69.4 Dams 543 413 1.119 Sows per dam 4.4 2.8 3.2
litters and 78% of crossbred litters were litters of pairs of full-sib sows. Average size of full-sib group were 2.6 (L03, L04) and 3.6 (L303) sows. Table 3 shows an advantage of 0.33 live born piglets (NBA) of L350 compared to the average of L303.
Table 3 Means of litter Performance and their effects for line L303 and line L350 (Mittelwerte für Wurfleistungen und deren Einflußfaktoren der Linien L303 und L350) Line
N B A ( A r ) SNBA
FFA (days) FI (days) AI (%) Parities 0 Line of service sire
L03xL04 10.12
3.18 343 150 96 3.8
19,416
L303 L03xL04
10.34
3.63 347 148 94
3.2 19,416
L350 L19xL303
10.56
3.18 347 150 96 2.6
416 NBA- number bom alive; FFA- age at first farrowing; FI- fiurowing interval; AI- artificial Insemination
The population of L350 was with 2.6 parities per sow younger than L303. Age of first farrowing showed a significant influence on number born alive piglets for two line crossbred sows but not for three line crossbreds (Table 4). The farrowing interval was not significant over all parities in both crossbred lines.
Table 4 Level of significance of fixed and random factors on number piglets born alive, for line L303 and line L350 (Signifikanzniveaus der fixen und zufalligen Einflußfaktoren auf die Wurfgröße der Linien L303 und L350)
L303 L350 Herd-Year-Season •**I) • • • Parity class *** *** HerdxLine service sire * * Mating type • n.s. Age at first farrowing *•* n.s. Farrowing interval n.s. n.s. R2% 8/7 &£ " p > 0.05 = not significant (n.s.); 0.0X p S 0.05 - significant (•); 0.001 < p s 0.01 - high significant (*•); p < 0.001 = very high significant
Methods and Models For the estimation of variance components a repeatability model was used. The linear mixed-model equation considering both purebred and crossbred information can be
254 BOSCH et al.: Selection on purebred and crossbred Performance for litter size in pigs
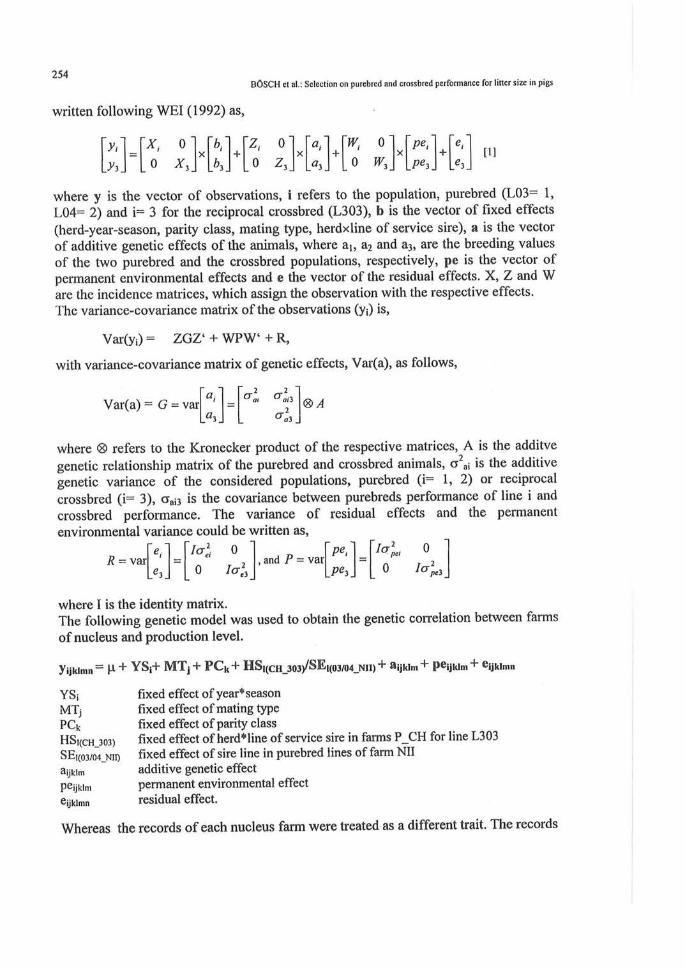
written following WEI (1992) as,
V = -x, Ol
0 X)_ X V +
~Z, 0 '
0 Z3 X
L f l 3 . +
"W, 0"
0 w,_ X
'pe,' pe3_
+ L e3.
[1]
where y is the vector of observations, i refers to the population, purebred (L03= 1, L04= 2) and i= 3 for the reciprocal crossbred (L303), b is the vector of fixed effects (herd-year-season, parity class, mating type, herdxline of service sire), a is the vector of additive genetic effects of the animals, where a h a2 and a3, are the breeding values of the two purebred and the crossbred populations, respectively, pe is the vector of permanent environmental effects and e the vector of the residual effects. X, Z and W are the ineidence matrices, which assign the Observation with the respective effects. The variance-covariance matrix of the observations (yi) is,
Var(yj) = ZGZ' + WPW + R,
with variance-covariance matrix of genetic effects, Var(a), as follows,
.2 „ 2 Var(a) = G = var
where <8> refers to the Kronecker product of the respective matrices, A is the additve genetic relationship matrix of the purebred and crossbred animals, o ai is the additive genetic variance of the considered populations, purebred (i= 1, 2) or reciprocal crossbred (i= 3), aai3 is the covariance between purebreds Performance of line i and crossbred Performance. The variance of residual effects and the permanent environmental variance could be written as,
R - var toi 0
0
7 < , and P = var
pe,'
pe>_
'tele, 0
0
top*.
where I is the identity matrix. The following genetic model was used to obtain the genetic correlation between farms of nucleus and production level.
yijklmn = P + YSj+ MTj + PC k + HS|(CH_303y/SE,(03/04_NII) + aijklm + Peijklm + eijklmn
YSi MTj PCk
HS|(CHJ03)
SE|(03/04_NII)
3ijklm
peijklm
eijklmn
fixed effect of year* season fixed effect of mating type fixed effect of parity class fixed effect of herd*line of service sire in farms P C H for line L303 fixed effect of sire line in purebred lines offarm NU additive genetic effect permanent environmental effect residual effect.
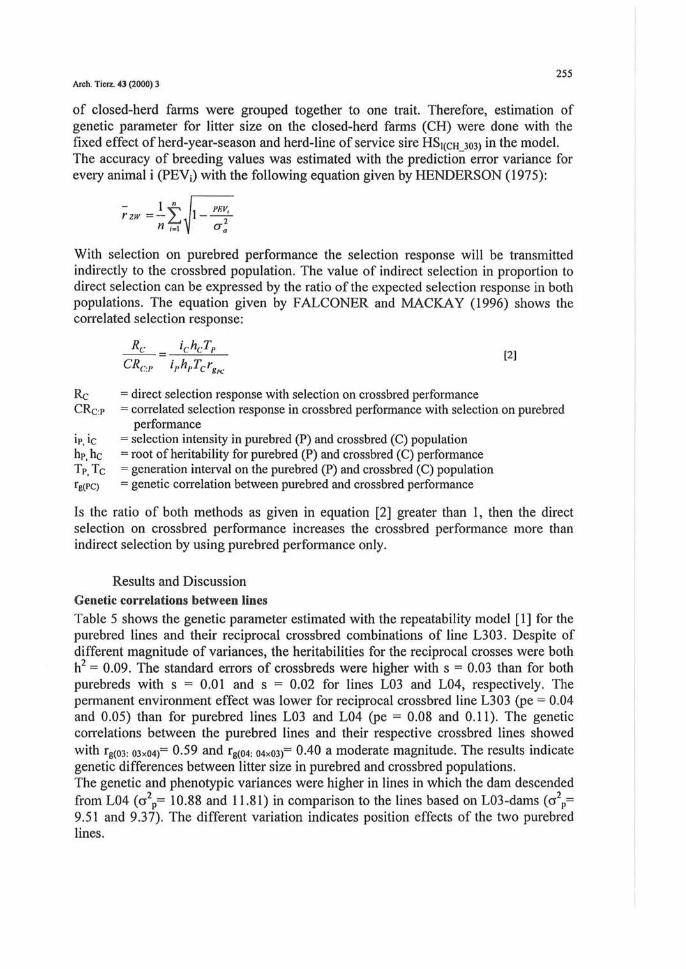
Whereas the records of each nucleus farm were treated as a different trait. The records
255 Arch. Tierz. «(2000) 3
of closed-herd farms were grouped together to one trait. Therefore, est imation of genetic parameter for litter size on the closed-herd farms (CH) were done with the fixed effect o f herd-year-season and herd-l ine of service sire HS|(CH_303) in the model . The accuracy of breeding values was est imated with the predict ion error var iance for every animal i (PEVj) wi th the following equat ion given by H E N D E R S O N (1975):
l o i WWi
" « V tri
With selection on purebred Performance the selection response will be transmitted indirectly to the crossbred population. The value of indirect selection in proportion to direct selection can be expressed by the ratio of the expected selection response in both populations. The equation given by FALCONER and MACKAY (1996) shows the correlated selection response:
Rc i(hcTp [2] CRC:I, iPhHTcrgK
Rc = direct selection response with selection on crossbred Performance C R C P = correlated selection response in crossbred Performance with selection on purebred
Performance ip, ic = selection intensity in purebred (P) and crossbred (C) population hP, hc = root of heritability for purebred (P) and crossbred (C) Performance Tp, Tc = generation interval on the purebred (P) and crossbred (C) population rg(PC) = genetic correlation between purebred and crossbred Performance
Is the ratio of both methods as given in equation [2] greater than 1, then the direct selection on crossbred Performance increases the crossbred Performance more than indirect selection by using purebred Performance only.
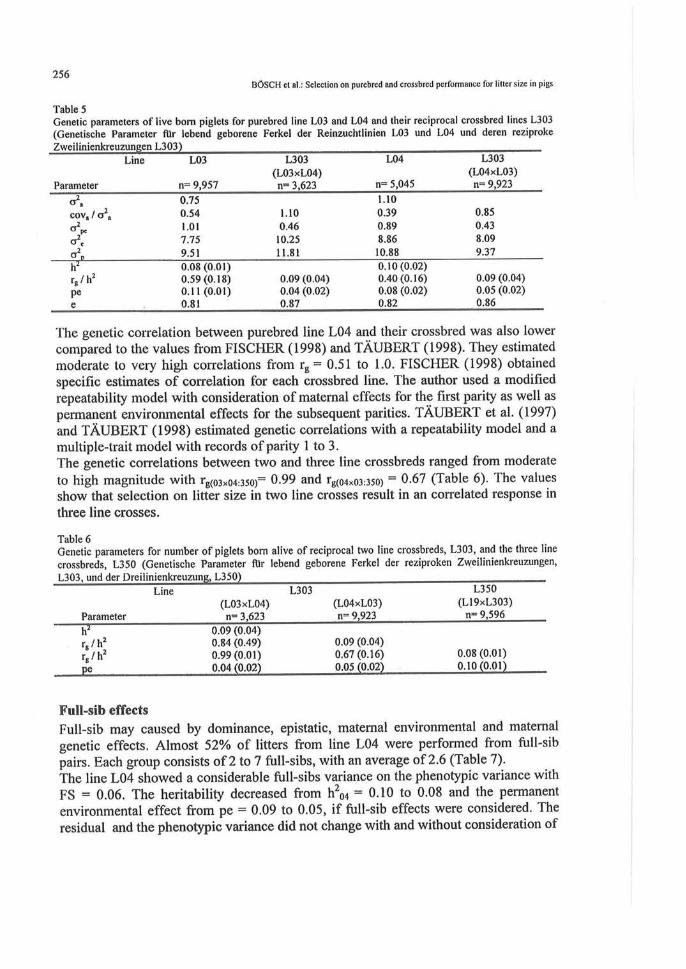
Results and Discussion Genetic correlations between lines Table 5 shows the genet ic parameter est imated with the repeatability model [1] for the purebred lines and their reciprocal crossbred combinat ions of line L 3 0 3 . Despi te of different magn i tude of var iances , the heritabilities for the reciprocal crosses were both h2 = 0.09. T h e Standard errors of crossbreds were higher with s = 0.03 than for both purebreds wi th s = 0.01 and s = 0.02 for lines L03 and L04 , respectively. The permanent env i ronment effect was lower for reciprocal crossbred line L303 (pe = 0.04 and 0.05) than for purebred lines L03 and L04 (pe = 0.08 and 0.11). The genetic correlations be tween the purebred lines and their respective crossbred lines showed with rg(03: 03x04)= 0.59 and rg(04; 04x03)= 0.40 a moderate magni tude . The results indicate genetic differences be tween litter size in purebred and crossbred popula t ions . The genetic and phenotypic var iances were higher in lines in which the dam descended from L04 ( a 2
p = 10.88 and 11.81) in compar ison to the lines based on L03-dams ( a 2p =
9.51 and 9.37). T h e different Variation indicates position effects of the two purebred lines.
256 BOSCH et al.: Selection on purebred and crossbred Performance for litter size in pigs
Table 5 Genetic parameters of live born piglets for purebred line L03 and L04 and their reciprocal crossbred lines L303 (Genetische Parameter für lebend geborene Ferkel der Reinzuchtlinien L03 und L04 und deren reziproke
Line
Parameter
o2 . COV, / CT2,
<J c
o 2 . h2
r g /h 2
pe e
L03
n= 9,957
0.75 0.54 1.01 7.75 9.51 0.08(0.01) 0.59(0.18) 0.11(0.01) 0.81
L303 (L03xL04) n= 3,623
1.10 0.46
10.25 11.81
0.09 (0.04) 0.04 (0.02) 0.87
L04
n= 5,045
1.10 0.39 0.89 8.86 10.88 0.10(0.02) 0.40(0.16) 0.08 (0.02) 0.82
L303 (L04xL03) n= 9,923
0.85 0.43 8.09 9.37
0.09 (0.04) 0.05 (0.02) 0.86
The genetic correlation between purebred line L04 and their crossbred was also lower compared to the values from FISCHER (1998) and TÄUBERT (1998). They estimated moderate to very high correlations from rg = 0.51 to 1.0. FISCHER (1998) obtained specific estimates of correlation for each crossbred line. The author used a modified repeatability model with consideration of maternal effects for the first parity as well as permanent environmental effects for the subsequent parities. TÄUBERT et al. (1997) and TÄUBERT (1998) estimated genetic correlations with a repeatability model and a multiple-trait model with records of parity 1 to 3. The genetic correlations between two and three line crossbreds ranged from moderate to high magnitude with rg(03x04:350)= 0.99 and rg(04x03:350) = 0.67 (Table 6). The values show that selection on litter size in two line crosses result in an correlated response in three line crosses.
Table 6 Genetic parameters for number of piglets born alive of reciprocal two line crossbreds, L303, and the three line crossbreds, L350 (Genetische Parameter für lebend geborene Ferkel der reziproken Zweilinienkreuzungen, L303, und der Dreilinienkreuzung, L3S0) _ ^ _ _ _ _
Line L303 L350 (L03xL04) (L04xL03) (L19xL303)
Parameter n= 3,623 n= 9,923 n= 9,596 1? 0.09 (0.04) r./h2 0.84(0.49) 0.09(0.04) rg/h2 0.99(0.01) 0.67(0.16) 0.08(0.01) pe 0.04(0.02) 0.05 (0.02) 0.10(001)
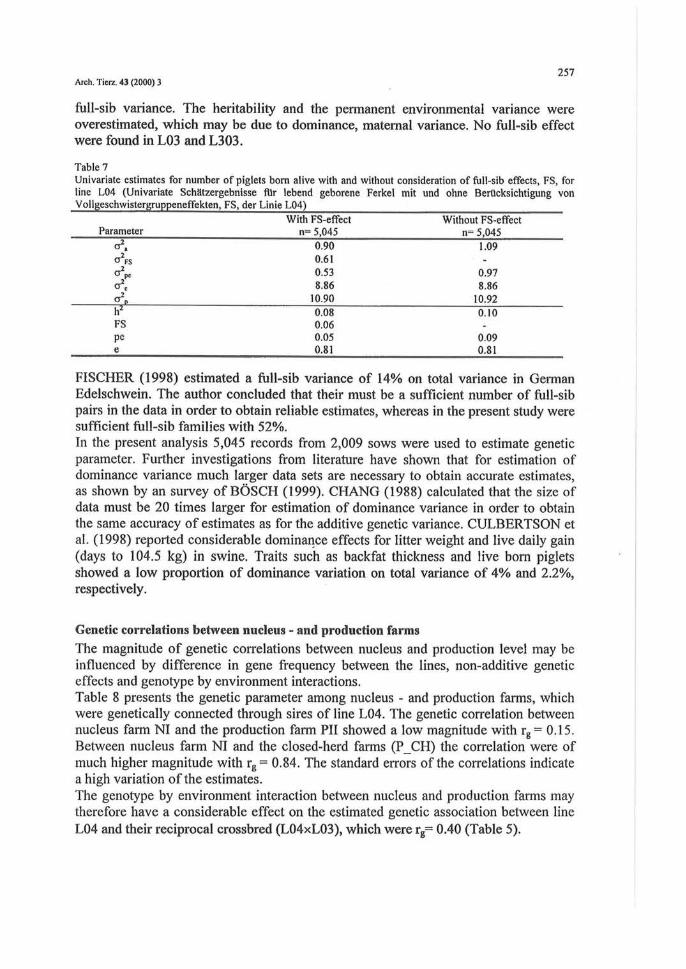
Full-sib effects Full-sib may caused by dominance, epistatic, maternal environmental and maternal genetic effects. Almost 52% of litters from line L04 were performed from full-sib pairs. Each group consists of 2 to 7 full-sibs, with an average of 2.6 (Table 7). The line L04 showed a considerable full-sibs variance on the phenotypic variance with FS = 0.06. The heritability decreased from h2
04 = 0.10 to 0.08 and the permanent environmental effect from pe = 0.09 to 0.05, if full-sib effects were considered. The residual and the phenotypic variance did not change with and without consideration of
257 Arch. Tierz. 43 (2000) 3
full-sib variance. The heritability and the permanent environmental variance were overestimated, which may be due to dominance, maternal variance. No full-sib effect were found in L03 and L303.
Table 7 Univariate estimates for number of piglets bom alive with and without consideration of full-sib effects, FS, for line L04 (Univariate Schätzergebnisse für lebend geborene Ferkel mit und ohne Berücksichtigung von Vollgeschwistergruppeneffekten, FS, der Linie L04)
With FS-effect Without FS-effect Parameter n= 5,045 n= 5,045
er2, 0.90 1.09 CT2
FS 0.61 - 2 0.53 " p . o2, CT2„ h2
FS pc e
8.86 10.90 0.08 0.06 0.05 0.81
8.86 10.92 0.10 -
0.09 0.81
FISCHER (1998) estimated a full-sib variance of 14% on total variance in German Edelschwein. The author concluded that their must be a sufficient number of full-sib pairs in the data in order to obtain reliable estimates, whereas in the present study were sufficient full-sib families with 52%. In the present analysis 5,045 records from 2,009 sows were used to estimate genetic parameter. Further investigations from literature have shown that for estimation of dominance variance much larger data sets are necessary to obtain accurate estimates, as shown by an survey of BOSCH (1999). CHANG (1988) calculated that the size of data must be 20 times larger for estimation of dominance variance in order to obtain the same accuracy of estimates as for the additive genetic variance. CULBERTSON et al. (1998) reported considerable dominance effects for litter weight and live daily gain (days to 104.5 kg) in swine. Traits such as backfat thickness and live born piglets showed a low proportion of dominance Variation on total variance of 4% and 2.2%, respectively.
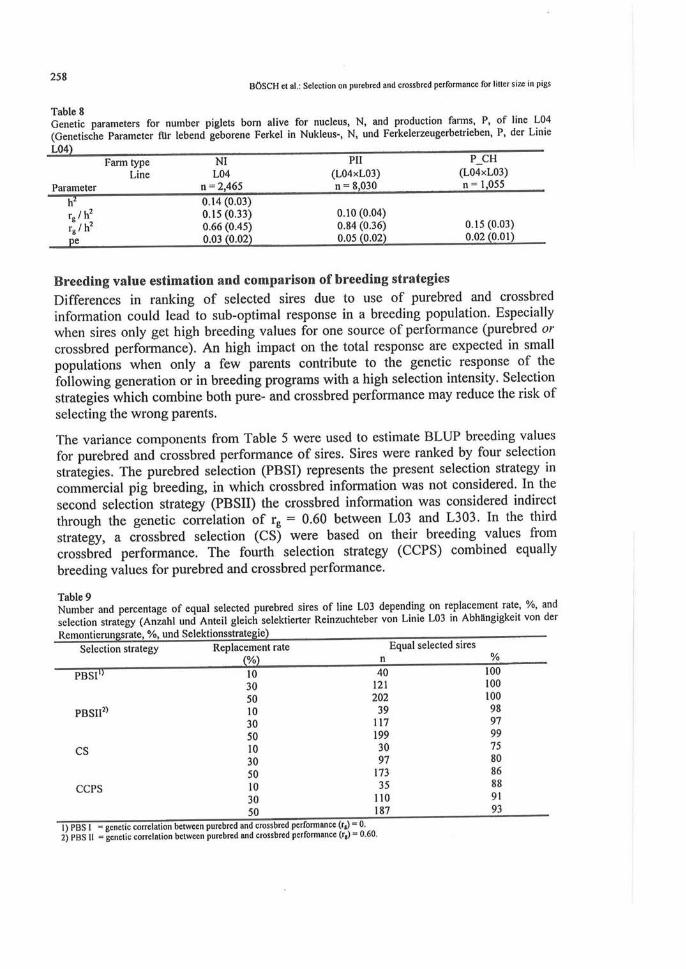
Genetic correlations between nucleus - and production farms The magnitude of genetic correlations between nucleus and production level may be influenced by difference in gene frequency between the lines, non-additive genetic effects and genotype by environment interactions. Table 8 presents the genetic parameter among nucleus - and production farms, which were genetically connected through sires of line L04. The genetic correlation between nucleus farm NI and the production farm PII showed a low magnitude with rg = 0.15. Between nucleus farm NI and the closed-herd farms (P_CH) the correlation were of much higher magnitude with rg= 0.84. The Standard errors of the correlations indicate a high Variation of the estimates. The genotype by environment interaction between nucleus and production farms may therefore have a considerable effect on the estimated genetic association between line L04 and their reciprocal crossbred (L04xL03), which were rg= 0.40 (Table 5).
258 BOSCH et al.: Selection on purebred and crossbred Performance for litter size in pigs
Table 8 Genetic parameters for number piglets born alive for nucleus, N, and production farms, P, of line L04 (Genetische Parameter für lebend geborene Ferkel in Nukleus-, N, und Ferkelerzeugerbetrieben, P, der Linie
— '
Parameter
h !
rB/h2
rB/h2
pe
Farm type Line
NI L04
n = 2,465
0.14(0.03) 0.15(0.33) 0.66 (0.45) 0.03 (0.02)
PII (L04xL03) n = 8,030
0.10(0.04) 0.84 (0.36) 0.05 (0.02)
P_CH
(L04xL03) n = 1,055
0.15 (0.03) 0.02(0.01)
Breeding value estimation and comparison of breeding strategies Differences in ranking of selected sires due to use of purebred and crossbred information could lead to sub-optimal response in a breeding population. Especially when sires only get high breeding values for one source of Performance (purebred or crossbred Performance). An high impact on the total response are expected in small populations when only a few parents contribute to the genetic response of the following generation or in breeding programs with a high selection intensity. Selection strategies which combine both pure- and crossbred Performance may reduce the risk of selecting the wrong parents.
The variance components from Table 5 were used to estimate BLUP breeding values for purebred and crossbred Performance of sires. Sires were ranked by four selection strategies. The purebred selection (PBSI) represents the present selection strategy in commercial pig breeding, in which crossbred information was not considered. In the second selection strategy (PBSII) the crossbred information was considered indirect through the genetic correlation of rg = 0.60 between L03 and L303. In the third strategy, a crossbred selection (CS) were based on their breeding values from crossbred Performance. The fourth selection strategy (CCPS) combined equally breeding values for purebred and crossbred Performance.
Table 9 , 0 / , Number and percentage of equal selected purebred sires of line L03 depending on replacement rate, /o, and selection strategy (Anzahl und Anteil gleich selektierter Reinzuchteber von Linie L03 in Abhängigkeit von der Remontierungsrate, %, und Selektionsstrategie)
Selection strategy Replacement rate Equal selected sires
PBSI1
PBSII2)
CS
CCPS
10 30 50 10 30 50 10 30 50 10 30 50
40 121 202
39 117 199 30 97
173 35
110 187
100 100 100 98 97 99 75 80 86 88 91 93
1) PBS 1 = genetic correlation between purebred and crossbred Performance (r,) - 0. 2) PBS 11 = genetic correlation between purebred and crossbred Performance (r,) = 0.60.
259 Arch. Tierz. 43 (2000) 3
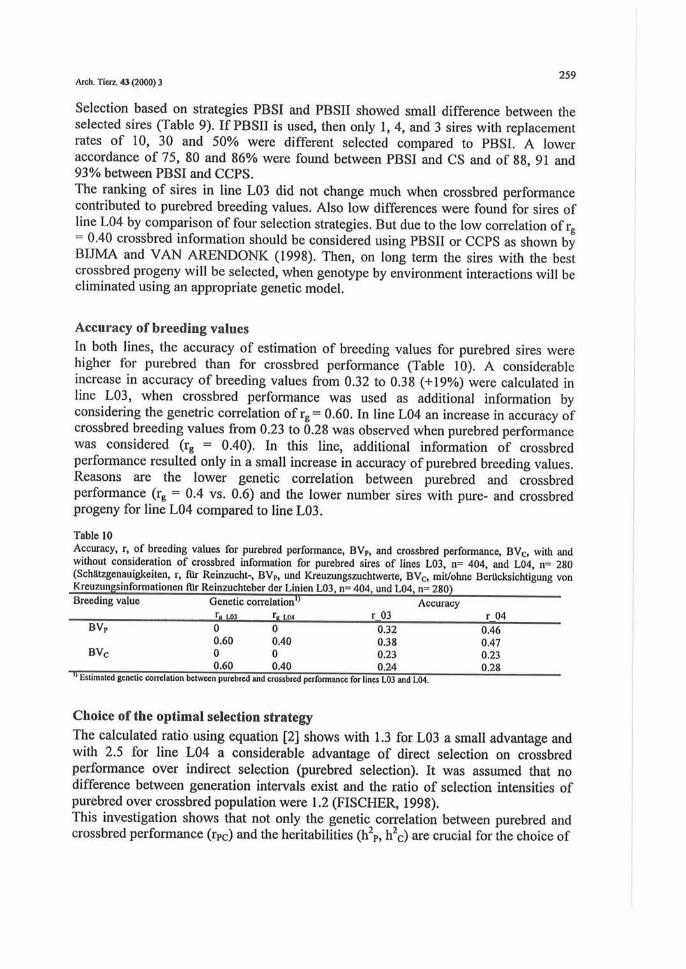
Selection based on strategies PBSI and PBSII showed small difference between the selected sires (Table 9). If PBSII is used, then only 1, 4, and 3 sires with replacement rates of 10, 30 and 50% were different selected compared to PBSI. A lower accordance of 75, 80 and 86% were found between PBSI and CS and of 88, 91 and 93% between PBSI and CCPS. The ranking of sires in line L03 did not change much when crossbred Performance contributed to purebred breeding values. Also low differences were found for sires of line L04 by comparison of four selection strategies. But due to the low correlation of rg
= 0.40 crossbred information should be considered using PBSII or CCPS as shown by BIJMA and VAN ARENDONK (1998). Then, on long term the sires with the best crossbred progeny will be selected, when genotype by environment interactions will be eliminated using an appropriate genetic model.
Accuracy of breeding values In both lines, the accuracy of estimation of breeding values for purebred sires were higher for purebred than for crossbred Performance (Table 10). A considerable increase in accuracy of breeding values from 0.32 to 0.38 (+19%) were calculated in line L03, when crossbred Performance was used as additional information by considering the genetric correlation of rg= 0.60. In line L04 an increase in accuracy of crossbred breeding values from 0.23 to 0.28 was observed when purebred Performance was considered (rg = 0.40). In this line, additional information of crossbred Performance resulted only in a small increase in accuracy of purebred breeding values. Reasons are the lower genetic correlation between purebred and crossbred Performance (rg = 0.4 vs. 0.6) and the lower number sires with pure- and crossbred progeny for line L04 compared to line L03.
Table 10 Accuracy, r, of breeding values for purebred Performance, BVP, and crossbred Performance, BVC, with and without consideration of crossbred information for purebred sires of lines L03, n= 404, and L04, n= 280 (Schätzgenauigkeiten, r, für Reinzucht-, BVP, und Kreuzungszuchtwerte, BVC, mit/ohne Berücksichtigung von Kreuzungsinformationen für Reinzuchteber der Linien L03, n= 404, und L04, n= 280) Breeding value Genetic correlation') Accuracy
r» LOI r„ ui4 r_03 r 04 BVP 0 0 0.32 0.46
0.60 0.40 0.38 0.47 BVC ° 0 0.23 0.23
(UjO 0.40 0.24 0.28 11 Estimated genetic correlation between purebred and crossbred Performance for lines L03 and L04
Choice of the optimal selection strategy The calculated ratio using equation [2] shows with 1.3 for L03 a small advantage and with 2.5 for line L04 a considerable advantage of direct selection on crossbred Performance over indirect selection (purebred selection). It was assumed that no difference between generation intervals exist and the ratio of selection intensities of purebred over crossbred population were 1.2 (FISCHER, 1998). This investigation shows that not only the genetic correlation between purebred and crossbred Performance (rPC) and the heritabilities (h2
P, h2
c) are crucial for the choice of
260 BOSCH et al.: Selection on purebred and crossbred Performance for litter size in pigs
the optimal selection strategy (BELL, 1982) but also the generation interval and the selection intensity showed an impact. TÄUBERT (1998) concludes from his study that the correlated selection response in crossbred Performance could be increased by indirect selection on purebred Performance. But he as well as WEI (1992) recommended the CCPS in order to use the additional information from crossbreeds. FISCHER (1998) added the gain of accuracy as the main reason for application of the CCPS. BRANDT (1998) explains the advantages of combined selection strategy as follows:
1. All information is used to improve the accuracy of estimated breeding values. 2. Different variance components for traits of purebred and crossbreds can be used. 3. Different economic weightings could be used to define the breeding goal. 4. A simultaneous progress in purebreds and crossbreds is guaranteed.
Conclusions for the selection in breeding programs The genetic correlation between purebred and crossbred Performance and the heritability are the crucial factors for the choice of the optimal selection strategy for litter size. The estimated correlations were on moderate level with rg= 0.59 and 0.40. The differences between these correlations may caused by gene frequency differences in the purebred populations and genotype by environment interactions between a nucleus farm and a farm on production level. Thus, purebred parent lines should be separated in an multi-trait genetic analysis of purebred and crossbred Performance. Also position effects of lines were observed in variance components. Non-additive genetic effects in L04, as indicated by an full-sib variance of 0.06 on the phenotypic variance showed that additive genetic and permanent environmental variance were biased, if full-sib effects were neglected. Therefore, methods to utilise dominance variance are necessary. In further investigations non-additive effects should be estimated directly on larger data sets. The percentage of equal selected sires between PBSI and PBSII showed no large difference between both selection methods. But the accuracy of breeding values increased which justifies the use of crossbred information especially for a sex-limited trait with low heritability as litter size. The ratio of 2.5 between direct and indirect selection on crossbred Performance shows that in case of low to moderate low correlation (rg = 0.40), selection methods should combine selection on crossbred and purebred Performance (CCPS). Selection of sires could be carried out more accurately because gene frequency differences as well as dominance effects could be exploited by specific mating. Sires should be used simultaneously on nucleus and multiplier level so that information from purebred and crossbred progeny is available at the same time. The genetic connection between purebred and crossbred level is crucial for the accurate estimation of genetic association. For the estimation of unbiased parameter specific farms should be selected from each level of the breeding pyramid with complete records of descendence and production. The combined selection with data from production level could realised through the effective use of modern data processing and standardised management Systems.

261 Arch. Tierz. 43(2000)3
References BAUMUNG, R.; SÖLKNER, J.; ESSL, A.:
Optimization of pig crossbreeding programs with regard to the genetic development of the involved purebred populations. 49. EAAP Meeting (1998), Warsaw, Poland
BELL, A.E.: Selection for heterosis - results with laboratory and domestic animal. 2. WCGALP 6 (1982), 206-227
BIJMA, P.; VAN ARENDONK, J.A.M.: Maximizing genetic gain for the sire line of a crossbreeding scheme utilizing both purebred and crossbred information. Anim. Sei. 66 (1998), 529-542
BOLDMAN, K.G.; KRIESE, L.A.; VAN VLECK, L.D.M; KACHMAN, S.D.: A manual for use of MTDFREML. A set of programs to obtain Estimates of variances and covariances. U.S. Department of Agricultural Research Service (1993)
BOSCH, M.: Die Selektion auf Wurfgröße beim Schwein unter besonderer Berücksichtigung der genetischen Beziehung zwischen Reinzucht- und Kreuzungsleistung. Univ. Kiel, Diss., 1999, Schriftenreihe des Instituts für Tierzucht und Tierhaltung an der CAU Kiel; Heft 113
BOSCH, M.; ROHE, R.; LOOFT, H.; KALM, E.: Die Selektion auf Wurfgröße beim Schwein. Arch. Tierz., Dummerstorf 42 (1999), 555-570
BRANDT, H.: Die Beziehung zwischen Produktionsmerkmalen von Reinzucht- und Kreuzungsschweinen und Konsequenzen für die Optimierung der Selektion. Univ. Göttingen, Habilitationsschrift, 1994
BRANDT, H.: Consequences of the crossbreeding system for selection procedures in nucleus populations. 49. EAAP-Meeting (1998), Warszaw, Poland
BRANDT, H.; TÄUBERT, H.: Parameter estimates for purebred and crossbred Performance in pigs. J. Anim. Breed. Genet. 115 (1998), 97-104
BRASCAMP, E.W.; MERKS, J.W.M.; WILMINK, J.B.M.: Genotype Environment Interaction in pig breeding programmes: Methods of estimation and relevance of the estimates. Livest. Prod. Sei. 13 (1985), 135-146
CHANG, H.A.: Studies on estimation of genetic variances under non-additive gene action. Univ. Illinois, Urbana, Ph.D. Diss., 1988
CULBERTSON, M.S.; MARBY, J.W.; MISZTAL, I.; GENGLER, N.; BERTRAND, J.K.; VARONA, L.: Estimation of dominance variance in purebred Yorkshire Swine. J. Anim. Sei. 76 (1998), 448-451
FALCONER, D.S.; MACKAY, T.F.C.: Introduction to quantitative genetics. 4lh edition. Longman, England (1996)
FISCHER, R.: Schätzung genetischer Parameter für Reinzucht- und Kreuzungsleistungen beim Schwein. Univ. Halle-Wittenberg, Diss., 1998
GROENEVELD, E.; KOVAC, M.; WANG, M.: PEST, a general purpose BLUP package for multivariate prediction and estimation. 4. WCGALP, Edinburgh, 13 (1990), 488-491
GROENEVELD, E.: VCE4 User's Guide and Reference Manual Version 1.1. (1998)
HENDERSON, CR.: Best linear unbiased prediction under a selection model. Biometrics 31 (1975), 423-447
KORNBLUM, E.; PETERSEN, U.: Zuchtfortschritt über Großelterntiere einkaufen. Schweinezucht und Schweinemast, 6 (1997), 12-13
KRIETER, J.: Zuchtplanung beim Schwein. Univ. Kiel, Habilitationsschrift, Schriftenreihe des Instituts für Tierzucht und Tierhaltung an der CAU Kiel; Heft 81 (1994)
MERKS, J.W.M.; HANENBERG, E.: Optimal selection strategy for crossbred Performance in commercial pig breeding programmes. 6. WCGALP (1998), Armidale, Australia, 23, 575-578

262 BOSCH et al.: Selection on purebred and crossbred Performance for litter size in pigs
SCHMUTZ, M.: Multivariate Schätzung von Populationsparametem für Merkmale aus Stations- und Feldprüfung der bayrischen Schweine-Herdbuchzucht in Reinzucht und Kreuzung. Univ. Kiel, Diss., 1996, Schriftenreihe des Instituts für Tierzucht und Tierhaltung an der CAU Kiel; Heft 88
TÄUBERT, H.; BRANDT, H.; GLODEK, P.: Correlation between purebred and crossbred Performance for litter traits in swine. 48lh EAAP Meeting, Vienna,G6.2(1997)
TÄUBERT, H.: Schätzung von Varianz- und Kovarianzkomponenten für die Wurfgröße von Reinzucht- und Kreuzungssauen. Univ. Göttingen, Diss., 1998
WEI, M.: Combined crossbred and purebred selection in animal breeding. Wageningen Agricultural University, Ph.D. Thesis, 1992
WEI, M.; VAN DER WERF, J.H.J.: Maximizing genetic response in crossbreds using both purebred and crossbred information. Anim. Prod. 59 (1994), 401-413
WONG, W.C.; BOYLAN, W.J.; REMPEL, W.E.; Purebred versus crossbred Performance as a basis of selection in swine. J. Anim. Sei. 32 (1971), 605-610
Received: 1999-10-14
Accepted: 2000-01-26
Aulhon;' addresses Dr. MARKUS BOSCH, PD Dr. RAINER ROHE, Prof. Dr. Dr. h.c. mult. ERNST KALM Institut für Tierzucht und Tierhaltung Olshausenstr. 40 D-24098 Kiel Germany
Dr. HOLGER LOOFT PIC Deutschland GmbH Ratsteich 31 D-24837 Schleswig Germany