selective electrocatalytic method for the determination of nitrite
TRANSCRIPT
2230 ANALYTICAL CHEMISTRY, VOL. 51, NO. 13, NOVEMBER 1979
Selective Electrocatalytic Method for the Determination of Nitrite
James A. Cox" and Anna F. Brajter
Department of Chemistry and Biochemistry, Southern Illinois University at Carbondale, Carbondale, Illinois 6290 1
The reduction of Mo(V1) at -0.48 V vs. SCE In a pH 2.1 sdutlon of 0.1 mM Na2Mo0,, 0.1 M KCI results in a depostl on mercury and graphite electrodes which selectively catalyzes nltrlte reduction. With linear potentlal scan voltammetry, a peak Is developed at -0.88 V In direct proportion to nitrite concen- tration over the range 0.01-1 mM. Nitrate does not interfere until it reaches about a 100-fdd excess at which polnt ii causes an Increase in the analytical current. Nelther chloride nor sulfate interfere. Dlssolved oxygen causes a correctable Increase In the base-line current. The electroactlve specles was shown to be HN02. Under the recommended condltlons, chemical decomposition was lnsigntflcant for at least 30 mln, but sparglng the pH 2.1 solution with N2 to remove dlssolved oxygen must not exceed 10 min to prevent slgntflcant volatlltty loss.
Nitrite is known to be electroactive under a wide variety of conditions, but few are suitable for quantitative deter- minations, particularly in the presence of nitrate. Many of the electrocatalytic methods for nitrate (I) are also responsive to nitrite, but only the total concentration of these ions can be determined. Nitrite can be electrochemically reduced in strong acid solutions, but the volatility of HNOz and its chemical instability in such solutions complicates obtaining precise analytical data (2 ,3) . At a cadmium electrode, nitrite and nitrate are also simultaneously reduced (1, 4 ) .
A method for the polarographic determination of nitrite in citrate buffer has been reported (5). The applicability is hampered by a narrow concentration range, 10-60 pM NO;, over which the current is directly proportional to concentration (5).
A quantitative method for determining nitrite using controlled potential coulometry with oxidation a t a Pt electrode has been reported (6). The process is strongly influenced by the extent of oxidation of the electrode surface (6) but is otherwise uncomplicated.
Recently reported potentiometric methods which involve enzyme-catalyzed reactions permit the selective determination of nitrite in the range 5 X 10⁻⁵-10-2 M (7,8). These methods have the drawback of pH sensing (9).
The present study was undertaken to develop a selective method for the determination of nitrite in the presence of nitrate. Compatibility to our voltammetric ion selective electrode design (10) was also a consideration. The approach reported herein involves reduction at a mercury electrode which has been modified by deposition of a Mo-catalyst.
EXPERIMENTAL Linear scan (LSV) and cyclic voltammetry (CV) experiments
were performed with a conventional three-electrode potentiostat, Wavetek Model 114 function generator, and Hewlett-Packard 7004B x-y recorder. A Metrohm microburet hanging mercury drop assembly and vitreous graphite (Atomergic Chemicals Corp.) which was sealed into a glass tube with Torrseal epoxy (Varian Associates, Vacuum Division) served as indicator electrodes. The Hg and graphite electrode areas were 0.0185 and 0.12 cm2, re-
0003-2700/79/035 1-2230$0 1 .OO/O
spectively. The graphite electrode was polished in several steps ending with diamond paste and a water-Gamal (Fisher Scientific Co.) suspension of O.l-wm mesh.
All chemicals used were ACS Reagent Grade. The solutions were prepared with doubly deionized water with Cole-Parmer research grade cartridges used in the final stage. All potentials are reported vs. SCE.
Unless otherwise stated, the analytical experiments were performed by first adjusting a nitrite-containing solution of IO4 M Na2Mo04, 0.1 M KCI to pH 2.1 with dilute HCl or KOH and then sparging with H20-saturated N2 for 5-10 min. The indicator electrode was inserted and equilibrated for 0.5-5 min at 0.0 V. A negative potential scan of 70 mV-s-' was applied this value waa found to yield the highest signal-to-background ratio without causing the nitrite reduction peak to be shifted too close to the potential at which the discharge of the supporting electrolyte occurs. The peak current at -0.88 V was measured from a base line obtained by extrapolation of the current decay of the -0.48 V molybdate reduction peak out to -0.88 V. The peak current linearly correlated to the nitrite concentration as discussed below.
RESULTS AND DISCUSSION As illustrated in Figure 1, the product of the reduction of
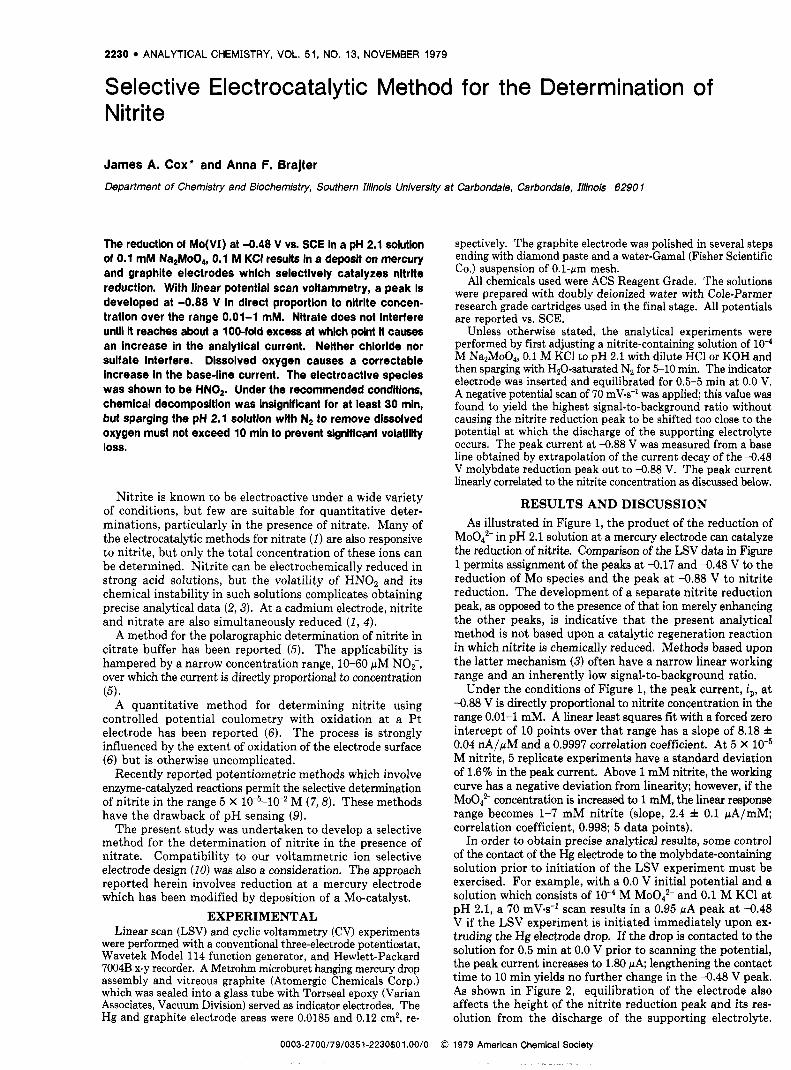
MOO:- in pH 2.1 solution a t a mercury electrode can catalyze the reduction of nitrite. Comparison of the LSV data in Figure 1 permits assignment of the peaks at -0.17 and 4.48 V to the reduction of Mo species and the peak at -0.88 V to nitrite reduction. The development of a separate nitrite reduction peak, as opposed to the presence of that ion merely enhancing the other peaks, is indicative that the present analytical method is not based upon a catalytic regeneration reaction in which nitrite is chemically reduced. Methods based upon the latter mechanism (3) often have a narrow linear working range and an inherently low signal-to-background ratio.
Under the conditions of Figure 1, the peak current, i,, a t -0.88 V is directly proportional to nitrite concentration in the range 0.01-1 mM. A linear least squares fit with a forced zero intercept of 10 points over that range has a slope of 8.18 f 0.04 nA/pM and a 0.9997 correlation coefficient. At 5 X M nitrite, 5 replicate experiments have a standard deviation of 1.6% in the peak current. Above 1 mM nitrite, the working curve has a negative deviation from linearity; however, if the MOO:- concentration is increased to 1 mM, the linear response range becomes 1-7 mM nitrite (slope, 2.4 f 0.1 pA/mM; correlation coefficient, 0.998; 5 data points).
In order to obtain precise analytical results, some control of the contact of the Hg electrode to the molybdate-containing solution prior to initiation of the LSV experiment must be exercised. For example, with a 0.0 V initial potential and a solution which consists of M Mood2- and 0.1 M KC1 a t pH 2.1, a 70 mV-s-' scan results in a 0.95 /.LA peak a t -0.48 V if the LSV experiment is initiated immediately upon ex- truding the Hg electrode drop. If the drop is contacted to the solution for 0.5 min at 0.0 V prior to scanning the potential, the peak current increases to 1.80 FA; lengthening the contact time to 10 min yields no further change in the -0.48 V peak. As shown in Figure 2, equilibration of the electrode also affects the height of the nitrite reduction peak and its res- olution from the discharge of the supporting electrolyte.
D 1979 American Chemical Society
ANALYTICAL CHEMISTRY, VOL. 51, NO. 13, NOVEMBER 1979 2231
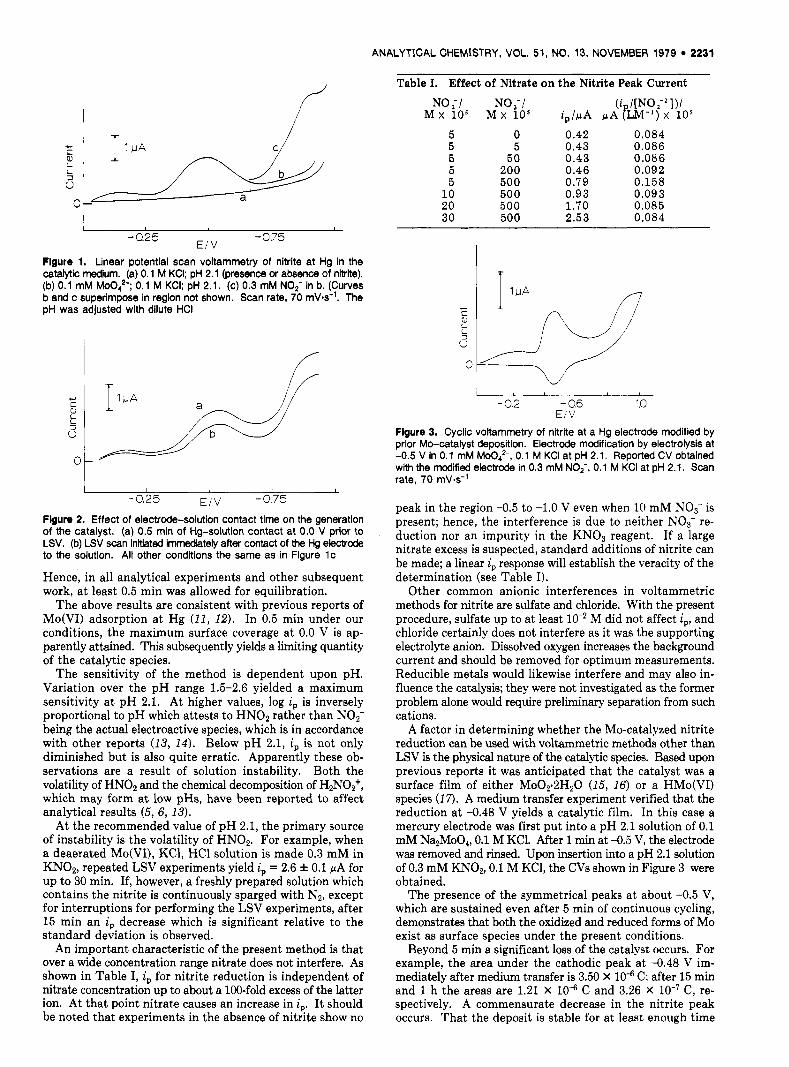
Table 1. Effect of Nitrate on the Nitrite Peak Current
.!A C
L L 3 0
0-
I T / + 1 I s A
3 a 0 1-
I -0.25 E,V -0.75
Flgure 1. Linear potential scan voltammetry of nitrite at Hg in the catalytic medium. (a) 0.1 M KCI; pH 2.1 (presence or absence of nltrtte). (b) 0.1 mM MOO,? 0.1 M KCI; pH 2.1. (c) 0.3 mM NOF in b. (Curves b and c superimpose in region not shown. Scan rate, 70 mV-s-'. The pH was adjusted with dilute HCI
I I I
- 0.25 E I V - 0.75
Figure 2. Effect of electrode-solution contact time on the generation of the catalyst. (a) 0.5 rnin of Hg-solution contact at 0.0 V prior to LSV. (b) LSV scan initiated immediately after contact of the Hg electrode to the solution. All other conditions the same as in Figure IC
Hence, in all analytical experiments and other subsequent work, a t least 0.5 min was allowed for equilibration.
The above results are consistent with previous reports of Mo(V1) adsorption a t Hg (11, 12). In 0.5 min under our conditions, the maximum surface coverage at 0.0 V is ap- parently attained. This subsequently yields a limiting quantity of the catalytic species.
The sensitivity of the method is dependent upon pH. Variation over the pH range 1.5-2.6 yielded a maximum sensitivity at pH 2.1. At higher values, log i, is inversely proportional to pH which attests to HNOz rather than NOz- being the actual electroactive species, which is in accordance with other reports (13, 14). Below pH 2.1, i, is not only diminished but is also quite erratic. Apparently these ob- servations are a result of solution instability. Both the volatility of HNOz and the chemical decomposition of H2NO2+, which may form a t low pHs, have been reported to affect analytical results (5, 6, 13).
At the recommended value of pH 2.1, the primary source of instability is the volatility of "OB. For example, when a deaerated Mo(VI), KC1, HC1 solution is made 0.3 mM in KN02, repeated LSV experiments yield i, = 2.6 f 0.1 pA for up to 30 min. If, however, a freshly prepared solution which contains the nitrite is continuously sparged with Nz, except for interruptions for performing the LSV experiments, after 15 rnin an i, decrease which is significant relative to the standard deviation is observed.
An important characteristic of the present method is that over a wide concentration range nitrate does not interfere. As shown in Table I, i, for nitrite reduction is independent of nitrate concentration up to about a 100-fold excess of the latter ion. At that point nitrate causes an increase in i,. I t should be noted that experiments in the absence of nitrite show no
5 0 0.42 0.084 5 5 0.43 0.086 5 50 0.43 0.086 5 200 0.46 0.092 5 500 0.79 0.158
10 500 0.93 0.093 20 500 1.70 0.085 30 500 2.53 0.084
1 1 I-
- 0.2 - 0.6 -1.0 EJV
Flgure 3. Cyclic vottammetry of nitrite at a Hg electrode modified by prior Mo-catalyst deposition. Electrode modification by electrolysis at -0.5 V in 0.1 mM MOO:-, 0.1 M KCI at pH 2.1. Reported CV obtained with the modified electrode in 0.3 mM NOp-, 0.1 M KCi at pH 2.1. Scan rate. 70 mV-s-'
peak in the region -0.5 to -1.0 V even when 10 mM NO3- is present; hence, the interference is due to neither NO3- re- duction nor an impurity in the KNOB reagent. If a large nitrate excess is suspected, standard additions of nitrite can be made; a linear i, response will establish the veracity of the determination (see Table I).
Other common anionic interferences in voltammetric methods for nitrite are sulfate and chloride. With the present procedure, sulfate up to at least M did not affect i,, and chloride certainly does not interfere as it was the supporting electrolyte anion. Dissolved oxygen increases the background current and should be removed for optimum measurements. Reducible metals would likewise interfere and may also in- fluence the catalysis; they were not investigated as the former problem alone would require preliminary separation from such cations.
A factor in determining whether the Mo-catalyzed nitrite reduction can be used with voltammetric methods other than LSV is the physical nature of the catalytic species. Based upon previous reports it was anticipated that the catalyst was a surface film of either MoO2.2Hz0 (15, 16) or a HMo(V1) species (17). A medium transfer experiment verified that the reduction at -0.48 V yields a catalytic film. In this case a mercury electrode was first put into a pH 2.1 solution of 0.1 mM NazMo04, 0.1 M KC1. After 1 min at 4 . 5 V, the electrode was removed and rinsed. Upon insertion into a pH 2.1 solution of 0.3 mM KNO2, 0.1 M KCl, the CVs shown in Figure 3 were obtained.
The presence of the symmetrical peaks a t about -0.5 V, which are sustained even after 5 min of continuous cycling, demonstrates that both the oxidized and reduced forms of Mo exist as surface species under the present conditions.
Beyond 5 min a significant loss of the catalyst occurs. For example, the area under the cathodic peak a t -0.48 V im- mediately after medium transfer is 3.50 X lo4 C; after 15 rnin and 1 h the areas are 1.21 X lo4 C and 3.26 X C, re- spectively. A commensurate decrease in the nitrite peak occurs. That the deposit is stable for at least enough time
2232 ANALYTICAL CHEMISTRY, VOL. 51, NO. 13, NOVEMBER 1979
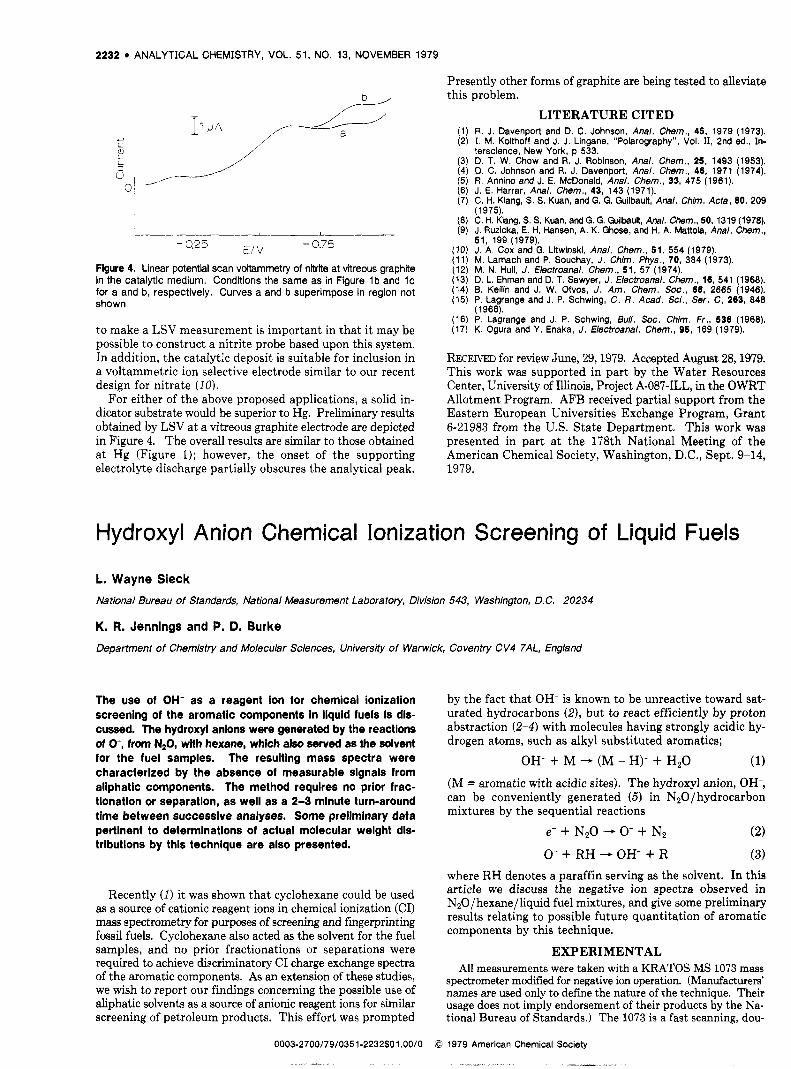
Flgure 4. Linear potential scan vottammetry of nitrite at vkreous graphite in the catalytic medium. Conditions the same as in Figure l b and I C for a and b, respectively. Curves a and b superimpose in region not shown
to make a LSV measurement is important in that it may be possible to construct a nitrite probe based upon this system. In addition, the catalytic deposit is suitable for inclusion in a voltammetric ion selective electrode similar to our recent design for nitrate (IO).
For either of the above proposed applications, a solid in- dicator substrate would be superior to Hg. Preliminary results obtained by LSV at a vitreous graphite electrode are depicted in Figure 4. The overall results are similar to those obtained a t Hg (Figure I); however, the onset of the supporting electrolyte discharge partially obscures the analytical peak.
Presently other forms of graphite are being tested to alleviate this problem.
LITERATURE CITED (1) R. J. Davenport and D. C. Johnson, Anal. Chem., 45, 1979 (1973). (2) I. M. Kolthoff and J. J. Lingane, "Polarography", Vol. 11, 2nd ed., In-
terscience, New York, p 533. (3) D. T. W. Chow and R. J. Robinson, Anal. Chem., 25, 1493 (1953). (4) D. C. Johnson and R. J. Davenport, Anal. Chem., 46, 1971 (1974). (5) R. Annino and J. E. McDonald, Anal. Chem., 33, 475 (1961). (6) J. E. Harrar, Anal. Chem.. 43, 143 (1971). (7) C. H. Klang, S. S. Kuan, and G. G. Guilbault, Anal. Chlm. Acta, 80, 209
(1975). (8) C. H. Kiang, S. S. Kuan, and G. G. Guilbault, Anal. Chem., 50, 1319 (1978). (9) J. Ruzicka, E. H. Hansen, A. K. Ghose, and H. A. Mattola, Anal. Chem.,
51, 199 (1979). (IO) J. A. Cox and G. Litwinski, Anal. Chem., 51, 554 (1979). (11) M. Lamach and P. Souchay, J . Chlm. Phys., 70, 384 (1973). (12) M. N. Hull, J . Nectroanal. Chem., 51, 57 (1974). (13) D. L. Ehman and D. T. Sawyer, J. Electroanal. Chem., 16, 541 (1968). (14) 6. Keilin and J. W. Otvos, J. Am. Chem. Soc., 68, 2665 (1946). (15) P. Lagrange and J. P. Schwing, C. R . Acad. Sci., Ser. C, 263, 848
(1966). (16) P. Lagrange and J. P. Schwing, Bull. SOC. Chim. Fr., 536 (1968). (17) K. Ogura and Y. Enaka, J. Electroanal. Chem., 95, 169 (1979).
RECEIVED for review June, 29,1979. Accepted August 28,1979. This work was supported in part by the Water Resources Center, University of Illinois, Project A-087-ILL, in the OWRT Allotment Program. AFB received partial support from the Eastern European Universities Exchange Program, Grant 6-21983 from the US . State Department. This work was presented in part at the 178th National Meeting of the American Chemical Society, Washington, D.C., Sept. 9-14, 1979.
Hydroxyl Anion Chemical Ionization Screening of Liquid Fuels
L. Wayne Sieck National Bureau of Standards, National Measurement Laboratory, Division 543, Washington, D.C. 20234
K. R. Jennings and P. D. Burke
Department of Chemistry and Molecular Sciences, University of Warwick, Coventry CV4 7AL, England
The use of OH- as a reagent ion for chemical ionization screenlng of the aromatlc components in liquid fuels is dls- cussed. The hydroxyl anlons were generated by the reactions of 0-, from NzO, wlth hexane, which also served as the solvent for the fuel samples. the resulting mass spectra were characterized by the absence of measurable signals from aliphatic components. The method requires no prior frac- tionatlon or separation, as well as a 2-3 minute turn-around time between successive analyses. Some preliminary data pertinent to determinations of actual molecular weight dis- tributions by this technique are also presented.
Recently ( I ) it was shown that cyclohexane could be used as a source of cationic reagent ions in chemical ionization (CI) mass spectrometry for purposes of screening and fingerprinting fossil fuels. Cyclohexane also acted as the solvent for the fuel samples, and no prior fractionations or separations were required to achieve discriminatory CI charge exchange spectra of the aromatic components. As an extension of these studies, we wish to report our findings concerning the possible use of aliphatic solvents as a source of anionic reagent ions for similar screening of petroleum products. This effort was prompted
0003-2700/79/0351-2232$01 .OO/O
I I
by the fact that OH- is known to be unreactive toward sat- urated hydrocarbons (Z), but to react efficiently by proton abstraction (2-4) with molecules having strongly acidic hy- drogen atoms, such as alkyl substituted aromatics;
(1) (M = aromatic with acidic sites). The hydroxyl anion, OH-, can be conveniently generated (5) in N,O/hydrocarbon mixtures by the sequential reactions
e- + N 2 0 - 0- + N2 (2)
0-+ RH -+OH- + R (3) where RH denotes a paraffin serving as the solvent. In this article we discuss the negative ion spectra observed in N20/hexane/liquid fuel mixtures, and give some preliminary results relating to possible future quantitation of aromatic components by this technique.
EXPERIMENTAL All measurements were taken with a KRATOS MS 1073 mass
spectrometer modified for negative ion operation. (Manufacturers' names are used only to define the nature of the technique. Their usage does not imply endorsement of their products by the Na- tional Bureau of Standards.) The 1073 is a fast scanning, dou-
OH- + M --+ (M - H)- + HzO
0 1979 American Chemical Society