selectivity of infrared heat treatment on inactivation of
TRANSCRIPT

University of Arkansas, FayettevilleScholarWorks@UARK
Theses and Dissertations
8-2019
Selectivity of Infrared Heat Treatment onInactivation of Mycotoxigenic Fungi on StoredGrainShantae A. WilsonUniversity of Arkansas, Fayetteville
Follow this and additional works at: https://scholarworks.uark.edu/etdPart of the Agronomy and Crop Sciences Commons, Food Microbiology Commons, Fungi
Commons, and the Plant Pathology Commons
This Dissertation is brought to you for free and open access by ScholarWorks@UARK. It has been accepted for inclusion in Theses and Dissertations byan authorized administrator of ScholarWorks@UARK. For more information, please contact [email protected].
Recommended CitationWilson, Shantae A., "Selectivity of Infrared Heat Treatment on Inactivation of Mycotoxigenic Fungi on Stored Grain" (2019). Thesesand Dissertations. 3350.https://scholarworks.uark.edu/etd/3350
Selectivity of Infrared Heat Treatment on Inactivation of Mycotoxigenic Fungi on Stored Grain
A dissertation submitted in partial fulfillment
of the requirements for the degree of
Doctor of Philosophy in Food Science
by
Shantae A. Wilson
University of Arkansas
Bachelor of Science in Chemical Engineering, 2013
University of Arkansas
Master of Science in Food Science, 2016
August 2019
University of Arkansas
This dissertation is approved for recommendation to the Graduate Council.
Griffiths G. Atungulu, Ph.D.
Thesis Director
Sammy Sadaka, Ph.D. Frank Carbonero, Ph.D.
Committee Member Committee Member
Andy Mauromoustakos, Ph.D. Steven Foley, Ph.D.
Committee Member Committee Member

Abstract
Selective Infrared (IR) heating holds great potential to decontaminate spores of unsafe fungi in
corn. The objectives for this study were to investigate the impact of exposing corn to infrared
energy at selected peak wavelengths (λ), infrared intensities and treatment durations, followed by
tempering for further inactivation of microbes on the grain and explore a method for
decontaminating Aspergillus flavus (A. flavus) spores on corn. Freshly harvested corn with initial
moisture contents (IMCs) of 16%, 20%, and 24% wet basis (w.b.) were used. The corn samples
were treated at different infrared wavelengths (3.2, 4.5, and 5.8 μm) for 20, 40 and 60 s at
product-to-emitter gap sizes (PEG) of 110, 275, 440 mm. This was then followed by tempering
the grain at 70oC for 4 hrs. Fungal analyses were assessed in terms of colony forming units per
gram of treated corn (CFU/g). Internal transcribed spacer (ITS) amplicon sequencing techniques
were also used to identify and quantify the magnitudes of surviving fungi following treatments.
The mean of the mold count of control samples were 5.95 ± 0.1 Log (CFU/g). Samples treated at
wavelength 3.2 µm, PEG of 110 mm (intensity of 15.71 kW/m2) and heating duration of 60 s
resulted in the highest microbial load reduction of 3.0, 4.7, 4.9 Log CFU/g of grain for MC 16%,
20%, and 24% (w.b.), respectively. Tempering treatment further reduced the microbial load at
each infrared treatment condition. Aspergillus genus was the most abundant mycotoxin
producing fungi on the non-tempered corn samples while Penicllium was the most abundant on
the tempered samples compared to the population of other fungi. After samples were inoculated
with A. flavus, treatments at wavelength of 3.2 µm, product-to-emitter-gap sizes (PEG) of 110
mm and corn MC of 24% wet basis (w.b.) resulted in the greatest A. flavus load reduction of 4
Log CFU/g for non-tempered and tempered samples. This work showed that decontamination of

harmful fungi, known to exist on corn, may be enhanced by infrared treatments at selected
wavelengths.

Acknowledgement
I would like to express my sincere gratitude to my advisor Dr. Griffiths G. Atungulu for the
continuous support of my PhD study and related research, for his patience, motivation, and
immense knowledge. His guidance helped me during my research and writing of this thesis.
Besides my advisor, I would like to thank the rest of my thesis committee members: Dr.
Sammy Sadaka, Dr. Frank Carbonero, Dr. Andy Mauromoustakos, and Dr. Steven Foley for
their insightful comments and encouragement, but also for the hard and intriguing questions
which incented me to think scientifically and helped widen my research scope to produce
meaningful results.
In addition, I would like to thank the Arkansas Corn and Grain-sorghum Research and
Promotion Board and the Arkansas Biosciences Institute for financially supporting this research,
Dr. Jin-Woo Kim for kindly availing his facilities to help accomplish part of the research
objectives, rice processing program for kindly availing some facilities used in the research, and
the University of Arkansas, Division of Agriculture Experiment Station for kindly providing
corn samples used in these studies.
Further, I acknowledge the technical support of Dr. Gbenga Olatunde, John Swanson, and
all lab mates in the grain processing program. Last but not the least, I would like to thank my
entire family; especially my husband, son, mother, sister and brothers for being there to support
me spiritually and emotionally throughout writing of this dissertation and my life in general.

Table of contents
Chapter 1: Introduction 1
Hypothesis 2
Objectives 2
Chapter 2: Literature review 5
Infrared 5
Fundamental principles of infrared radiation 5
Basic laws of infrared radiation 6
Interaction of infrared radiation with food materials 8
Infrared radiation applications in food industry 9
Concept of selective infrared heating 10
Mycotoxigenic fungi 11
Types of mycotoxigenic fungi 11
Issues associated with mycotoxigenic fungi 12
Fungal detection methods 15
Mycotoxigenic fungi prevention and decontamination strategies 16
Effect of infrared heat treatments on fungi 17
References 21
Chapter 3: Selectivity of Infrared Wavelengths on Inactivation of Microbes on Shelled
Corn 28
Abstract 28
Introduction 29
Materials and methods 31
Results and discussion 37
Conclusion 44
References 46
Chapter 4: Fungal community compositions of shelled corn after selective infrared heat
treatments revealed by Illumina high-throughput sequencing 48
Abstract 48
Introduction 49
Materials and methods 51
Results and discussion 54
Conclusion 62
References 63
Chapter 5: Impact of selective infrared wavelengths on fungal decontamination of shelled
corn inoculated with Aspergillus flavus 66
Abstract 66
Introduction 67
Materials and methods 69
Results and discussion 70
Conclusion 78
References 80
Chapter 6: Conclusion 82
List of publications
Submitted Paper:
Chapter 3:
Wilson, S.A. & Atungulu, G.G. (2019). Selectivity of Infrared Wavelengths on Inactivation of
Microbes on Shelled Corn. Journal of Food Safety, submitted for publication.

1
Chapter 1: Introduction
Corn is the main grain used in the production of animal feed in the United States (USDA,
2018). A small portion of corn is processed for use as corn cereal, corn starch, corn oil and corn
syrup for human consumption, but it is primarily used for livestock feed, and manufactured
goods such as pet foods (USDA, 2018). The United States is a significant player in the world
corn trade market, exporting to other nations between 10% and 20% of its corn crop (USDA,
2018).
One of the most important economic considerations in corn processing is preventing the
growth of fungi on the kernels. Fungi are associated with an enormous diversity of habitats
which include grains. Under some conditions, some fungal species may produce secondary
metabolites known as mycotoxins. Mycotoxins once created are highly stable and heat-resistant
compounds that readily survive the temperatures of food processing and if consumed poses
serious health risk to humans and animals (Peraica et al., 1999; Bullerman et al, 2007).
Prevention of proliferation of these aflatoxigenic fungi on food is the most desirable and
effective known method for controlling aflatoxin production. Various strategies are used to
control the risk of aflatoxin production before crop harvest, including selective breeding to
advance the development of varieties resistant to the toxin-producing fungi, proper cultural
practices, such as choice of planting and harvest dates, tillage practices, crop rotation, plant
population, irrigation, and sanitation, and applying crop protection chemicals or biological
controls to mitigate aflatoxin contamination (Atungulu, 2015a, b). During post-harvest period,
the primary method to discourage aflatoxin formation on grains is though implementation of
proper drying and storage practices; the goal is to discourage development of the aflatoxigenic
fungal species - Aspergillus flavus and Aspergillus parasiticus (Atungulu et al., 2015a, b). The
2
conidia (spores) of these fungal species are prevalent in the air and therefore are common
contaminant of grains with corn frequently victimized. The spores of aflatoxigenic fungi are very
heat tolerant, and have been known to survive conventional convective hot-air drying
temperatures for grains (Wilson et al., 2015). This, therefore increases the risk of toxin
production and potential contamination when dried grain is mixed with other moist material in
processing lines. Therefore, any innovation regarding corn drying practices must be able to
produce a product that is, if not, equal to or better than the present quality of corn. As an
alternative to conventional corn drying methods, Selective infrared (IR) heating technology was
explored for mycotoxigenic fungi inactivation.
Hypothesis
Infrared (IR) energy supplied by broadband wavelength could inactivate microbes but
not completely. Understanding the interactions between the applied wavelength and fungi
response is important. Hence, within the IR band some selected wavelengths may have unique
interactions with mycotoxigenic fungi resulting in further inactivation.
Objectives
1) Investigate the effect of IR heating and tempering at varied selected peak wavelengths
(λ), infrared intensities and treatment durations on inactivation of fungi generally
prevalent on corn.
2) Investigate the effects of infrared wavelengths, treatment durations, and intensity on
inactivation of mycotoxigenic fungi, specifically of Aspergillus genus.
3
3) Investigate the suitable combinations of IR heating duration, intensity, wavelengths, and
moisture content (MC), followed by tempering treatments to maximize decontamination
of A. flavus mold spores.
4
References
Atungulu G. 2015a. New Engineering in Grain Drying and Storage - Maintaining quality and
preventing mycotoxins. Resource Magazine. Published by the American Society of
Agricultural and Biological Engineers. July/August 2015. Page 12-14.
Atungulu G. and Zhong H. 2015b. Assessment of On-Farm, In-Bin Drying of Rough Rice in the
United States’ Arkansas Locations. 2015 ASABE Annual International Meeting
152189295, (doi: 10.13031/aim.20152189295).
Bullerman, L.B., Bianchini, A., Hanna, M.A., Jackson, L.S., Jablonski, J. & Ryu, D. (2008).
Reduction of fumonisin B1 in corn grits by single-screw extrusion. Journal of
Agricultural and Food Chemistry, 56(7), 2400-2405.
Peraica, M., Radić, B., Lucić, A., & Pavlović, M. (1999). Toxic effects of mycotoxins in human.
Bulletin of the World Health Organization, 77(9), 754-66.
United States Department of Agriculture (UDSA) Economic Research Service (2018).
Feedgrains Sector at a Glance. https://www.ers.usda.gov/topics/crops/corn-and-other-
feedgrains/feedgrains-sector-at-a-glance/

5
Chapter 2: Literature Review
Infrared
Fundamental principles of infrared radiation
In 1782 William Herschel discovered the presence of invisible heating rays, now known
as infrared (IR) radiation (Ring, 2000; Rowan-Robinson, 2013). Any object which has a
temperature above absolute zero (that is °K or - 273 °C) emits IR radiation in the form of
electromagnetic waves and is produced by the acceleration of electric charges. Electromagnetic
waves can be imagined as self-propagating transverse oscillating wave of electric and magnetic
fields.
Infrared radiation is a band in the electromagnetic spectrum with wavelength less than
that of microwave but greater than that of visible light (Pan and Atungulu, 2010) (Figure 1). The
IR radiation band is often considered to comprise wavelengths from about 0.75 µm to about
1000 μm (Pan and Atungulu, 2010). The International Commission on Illumination (CIE)
recommends that IR radiation be divided into three general regions: Near-infrared (NIR), mid-
infrared (MIR), and far-infrared (FIR). NIR, MIR, and FIR spectral ranges are 0.75 to 1.4, 1.4 to
3, and 3 to 1000 μm, respectively (Sakai and Hanzawa, 1994; Pan and Atungulu, 2010; Wilson et
al., 2015; Okeyo, 2016). The CIE classification is widely reported and adopted in food
processing.
Figure 1. Electromagnetic Spectrum

6
Infrared radiation incident on a product can be reflected, absorbed or transmitted. For a
molecule to display IR absorptions, the electrical dipole moment of the molecule must change
during movement (Stuart, 2004). A blackbody is an ideal body, which absorbs all incident
radiation, and also emits the maximum radiant energy (Pan and Atungulu, 2010). As an ideal
body, it is compared to a real body to describe the ability of a real body to emit and absorb
thermal radiation. The emissivity of a surface is the ratio of the energy flux emitted by the real
body to the flux emitted by a blackbody at the same temperature (Pan and Atungulu, 2010).
Basic laws of infrared radiation
There are three basic laws for electromagnetic radiation that describe the type and
quantity of energy emitted by an object. The laws are Stefan-Boltzman's law, Planck's law, and
Wien's law on displacement (Sakai and Hanzawa, 1994; Dagerskog and Österström, 1979;
Krishnamurth et al., 2008). The laws are summarized in table 1.

7
Table 1. Basic Laws of Infrared Radiation
Laws Explanation
Stefan–Boltzmann's
law
Eb(T) =n2σT4
Gives the total power radiated (Eb(T)) at a specific temperature from
an infrared source
σ: Stefan–Boltzmann constant (5.66910-8 W/m2K4 )
n: refractive index of the medium
Planck's law
𝑬𝒃𝝀
= 𝟐𝝅𝒉𝒄𝟎
𝟐
𝒏𝟐𝝀𝟓[𝒆𝒉𝒄𝟎
𝒏𝝀𝒌𝑻 − 𝟏]
Gives spectral blackbody emissive power distribution Ebλ(T, λ)
k: Boltzmann's constant (1.3806 × 10⁻²³ J/K),
n: refractive index of the medium (n for vacuum is 1 and, for most
gases, n is very close to unity)
λ: the wavelength (μm)
T: source temperature (K)
c0: speed of light (km/s)
h: Planck's constant (6.626 × 10⁻³⁴ J·s)
Wien's displacement
law
𝝀𝒎𝒂𝒙 =𝟐𝟖𝟗𝟖
𝑻
Gives the peak wavelength (λmax), where spectral distribution of
radiation emitted by a blackbody reaches maximum emissive power
T: emitting body temperature (K)
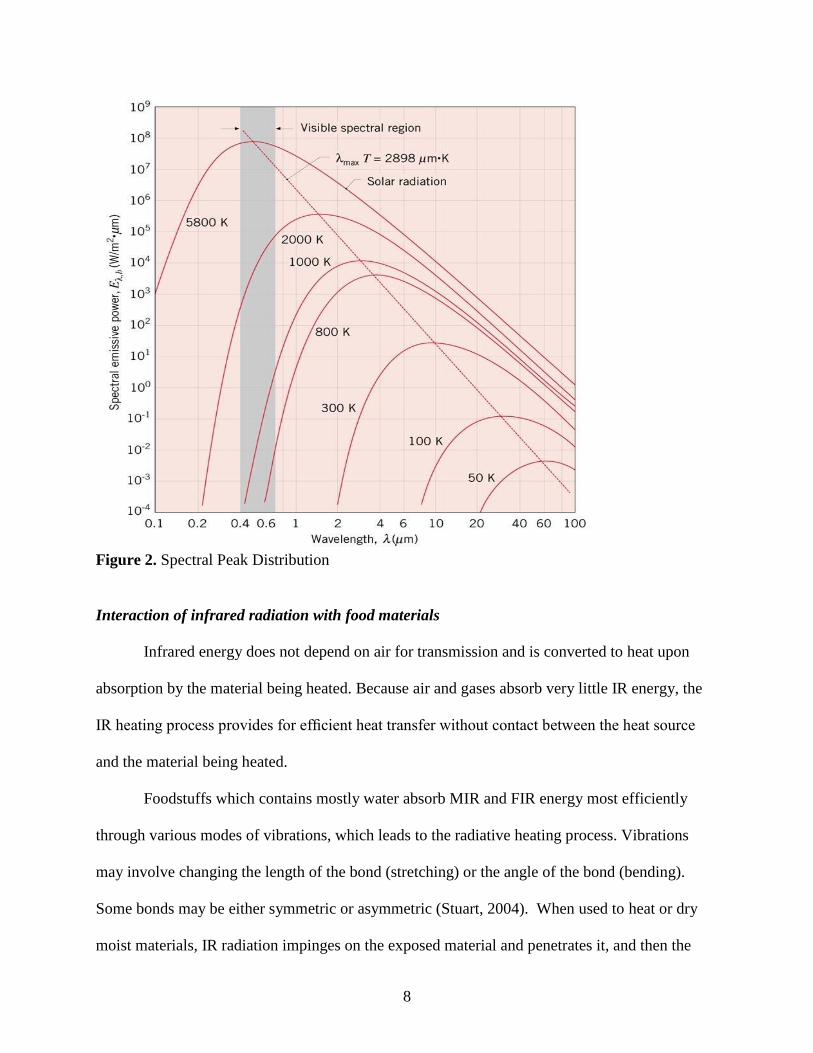
The amount of IR radiation that occurs on any surface is spectrally dependent. The
energy from an emitter consists of different wavelengths and the fraction of the radiation in each
band depends on the temperature and emissivity of the emitter. The wavelength at which the
maximum radiation happens is dictated by the IR heating element temperature (Figure 2).
8
Figure 2. Spectral Peak Distribution
Interaction of infrared radiation with food materials
Infrared energy does not depend on air for transmission and is converted to heat upon
absorption by the material being heated. Because air and gases absorb very little IR energy, the
IR heating process provides for efficient heat transfer without contact between the heat source
and the material being heated.
Foodstuffs which contains mostly water absorb MIR and FIR energy most efficiently
through various modes of vibrations, which leads to the radiative heating process. Vibrations
may involve changing the length of the bond (stretching) or the angle of the bond (bending).
Some bonds may be either symmetric or asymmetric (Stuart, 2004). When used to heat or dry
moist materials, IR radiation impinges on the exposed material and penetrates it, and then the

9
radiation energy is converted into heat (Ginzburg, 1969). Infrared radiation can penetrate
significantly into the food product, and such penetration may have dramatic effect on surface
moisture and surface temperature (table 2).
Table 2. Penetration Depth of Infrared Energy into Food Products (Ginzburg, 1969)
Product Spectral peak, µm Penetration depth, mm
Dough, Wheat 1.0 4-6
Bread, Wheat 1.0 11-12
Biscuit
1.0 4
0.88 12
Grain, wheat 1.0 2
Carrot 1.0 1.5
Tomato Paste,
70-85% Moisture Content
1.0 1
Potatoes, Raw 1.0 6
Potatoes, Dry 0.88 15-18
Apples, Raw
1.16 4.1
1.65 5.9
Infrared radiation applications in food industry
Infrared treatments have been associated with merits of higher energy transfer rate,
shorter drying duration, lesser environmental footprints, and better or comparable product quality
compared to convective heated air treatments (Ratti and Mujumdar, 1995; Wang et al., 2014).

10
Infrared heating has been developed in various sectors of the food industry and is often used in
processes such as drying, frying, baking, blanching and roasting (Nasiroglu and Kocabiyik,
2009; Zhu and Pan, 2009; Aghajanzadeh et al., 2016; Bagheri et al., 2016; Salehi et al., 2016;
Mohammadi et al., 2018). Infrared heating is also used to heat and cook soybeans, cereals, cacao
beans and nuts, and ready-to-eat products (Ratti and Mujumdar, 1995; Nowak and Piotr, 2004).
Infrared radiation has also been used in the food industry to inactivate pathogenic
microbes in liquid and solid foods (Khlangwiset et al., 2011). The effectiveness of IR heating on
microbial inactivation depends on the following parameters: administered IR power level,
surface temperature of food products, peak wavelength, bandwidth of IR heating source, product
thickness, types of microorganisms, moisture content of product, and chemical matrix of food
material (Khlangwiset et al., 2011).
Concept of selective infrared heating
The spectral distribution peak at a specified wavelength is defined by Wein’s law (Siegel
and Howell, 2002). For most food, the optimum IR dehydration process uses wavelengths below
4.2 μm (Lentz et al., 1995). The importance of IR emitting wavelength for the thermal processing
of dough was studied by Lentz et al. (1995). When the IR spectral emission was not consistent
with the wavelengths best absorbed by the dough (approximately 0.8 – 1.3 μm), poor heating of
the surface and interior was observed. Jun (2002) developed a new selective FIR heating system
that demonstrated the importance of optical properties when electromagnetic radiation is used for
food processing. The system had the capability to selectively heat higher absorbing components
to a greater extent using optical band pass filters that can emit radiation in the spectral ranges as

11
needed. Applicability of this technique was demonstrated by selective heating of soy protein and
glucose.
Generally, IR heating has been reported to improve fungal inactivation (Wilson et al,
2017). Such effort may be extended for prevention of mycotoxin contamination of grains.
Specifically, the use of selective IR heating of harmful mycotoxigenic molds has not been
reported. There seem to be a new avenue to employ such approach to target mycotoxigenic fungi
and improve the efficacy of the inactivation process.
Mycotoxigenic fungi
Types of mycotoxigenic fungi
Fungi that produces mycotoxin are referred to as mycotoxigenic fungi. The main
mycotoxigenic fungi are Aspergillus, Fusarium, and Penicillium (Sadhasivam et al., 2017). At
the moment Aspergillus genus comprises 339 known species (Perrone and Gallo, 2017). The
genus Fusarium comprises around 70 well-known species, identified by using a polyphasic
approach (Munkvold, 2017). Fusarium is one of the most economically important fungal genera
because of its contribution to agricultural commodity yield loss due to plant pathogenic activity
(Munkvold, 2017). Penicillium are very diverse and cosmopolite fungi; about 350 species are
recognized within this genus (Perrone and Susca, 2017).
All Aspergillus and Penicillium species are either growing in crops without obvious signs
of pathogenicity, or invading crops after harvest and produce toxins during drying and storage. In
contrast, the important Fusarium species infect crops before harvest. There are two types of
mycotoxigenic fungi: field (plant pathogens) and storage (saprophytic) fungi (Sadhasivam et al.,
2017). The field fungi invade and produce their toxins before harvesting while the storage fungi

12
become a problem after harvesting. Environmental stressors such as water activity and
temperature can affect growth, the expression of biosynthetic regulatory genes and production of
mycotoxigenic fungi.
Issues associated with mycotoxigenic fungi
Contamination of staple crops by mycotoxin has been a serious issue for human and
animal health (Reddy et al., 2008). When fungi colonizes grains, seeds, and feed on the field or
in storage there is a possibility of contamination with mycotoxins. Mycotoxins are toxic
secondary metabolites produced by filamentous fungi. The Food and Agricultural Organization
(FAO) of the United Nations estimated that each year approximately 25% of crops in the world
are adulterated by mycotoxins, which cause annual losses of around one billion metric tons of
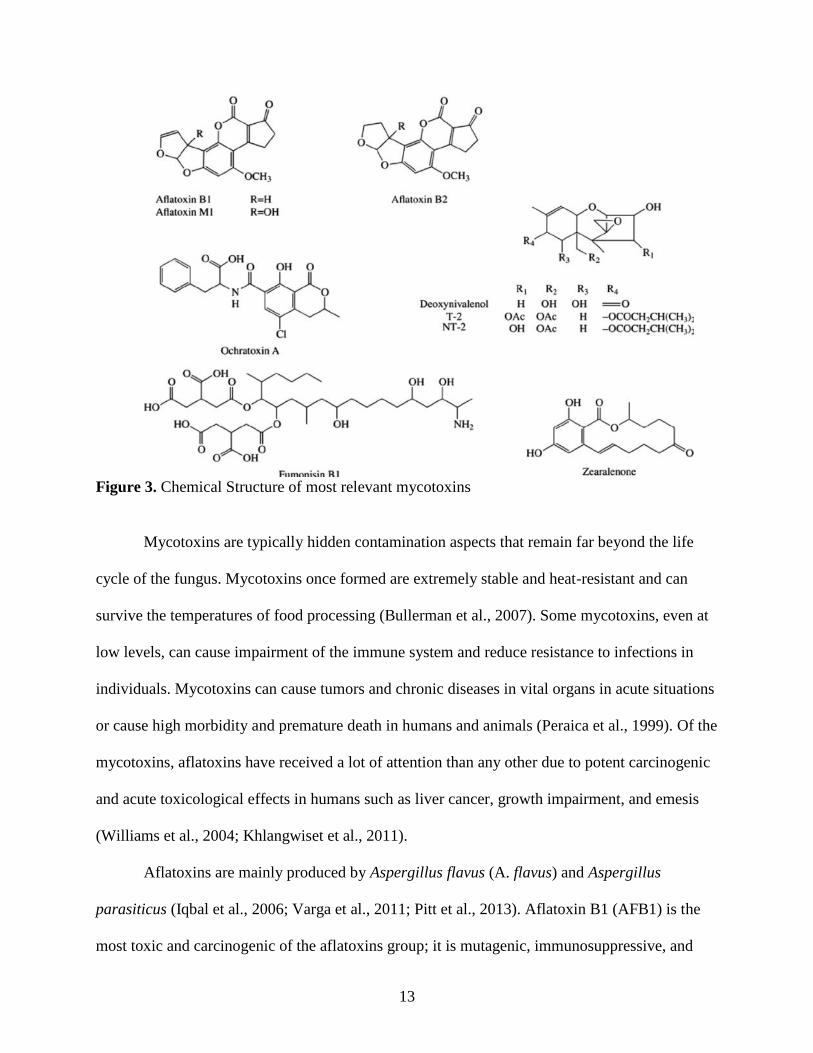
food products (Smith et al., 2016). The most relevant mycotoxins for food safety include
aflatoxins, ochatoxin A, fumonisins, zearalenone, and trichothecenes (Reddy et al., 2008) (Figure
3).
13
Figure 3. Chemical Structure of most relevant mycotoxins
Mycotoxins are typically hidden contamination aspects that remain far beyond the life
cycle of the fungus. Mycotoxins once formed are extremely stable and heat-resistant and can
survive the temperatures of food processing (Bullerman et al., 2007). Some mycotoxins, even at
low levels, can cause impairment of the immune system and reduce resistance to infections in
individuals. Mycotoxins can cause tumors and chronic diseases in vital organs in acute situations
or cause high morbidity and premature death in humans and animals (Peraica et al., 1999). Of the
mycotoxins, aflatoxins have received a lot of attention than any other due to potent carcinogenic
and acute toxicological effects in humans such as liver cancer, growth impairment, and emesis
(Williams et al., 2004; Khlangwiset et al., 2011).
Aflatoxins are mainly produced by Aspergillus flavus (A. flavus) and Aspergillus
parasiticus (Iqbal et al., 2006; Varga et al., 2011; Pitt et al., 2013). Aflatoxin B1 (AFB1) is the
most toxic and carcinogenic of the aflatoxins group; it is mutagenic, immunosuppressive, and

14
teratogenic (Williams et al., 2004; Bbosa et al., 2013; Villers, P., 2014). AFB1 is produced only
by A. flavus (Magan et al., 2004; Reddy et al., 2005). Aflatoxin regulatory levels in food and
animal feed are issued in several countries. The acceptable limit based on European Union is
between 2-12 ppb for B1 and 4-15 ppb for total aflatoxins. A limit of 20 ppb is set for total
aflatoxins in all food by United States ([FAO] Food and Agriculture Organization of the United
Nations, 2004); Atungulu et al. 2017). Table 3 shows the action levels that should not be
exceeded for aflatoxin in human food and animal feed (Atungulu et al., 2017).
Table 3. Food and Drug Administration Action Levels for Aflatoxin in Human Food and Animal
Feed
Commodity Intended Use Aflatoxin Level
(ppb)
Corn and peanut products finishing (i.e., feedlot) beef cattle 300
Cottonseed meal beef, cattle, swine, or poultry
(regardless of age or breeding status 300
Corn and peanut products finishing swine of 100 pounds or
greater 200
Corn and peanut products breeding beef cattle, breeding
swine, or mature poultry 100
Corn, peanut products, and other
animal feeds and feed ingredients
but excluding cottonseed meal,
immature animals 20
Corn, peanut products, cottonseed
meal, and other animal feed
ingredients
dairy animals, for animal species or
uses not specified above, or when
the intended use is not known
20
Brazil nuts, Foods, Peanuts and
Peanut products, Pistachio nuts Human Consumption 20
Milk Human Consumption 0.5 (aflatoxin M1)

15
Fungal detection methods
Traditional methods for evaluating fungal diversity mainly depend on the dilution-plating
technique with the use of selective media to identify macroscopic appearance, such as color,
rapidity of growth, and diffusible pigment in the agar (Lima and Borba, 2001; Alsohaili and
Bani-Hasan, 2018). Also, traditionally microscopy is used to identify hyphal morphology
(Gaddeyya et al., 2012). The traditional method tend to overlook fungi that is in mycelial state or
takes a long time to grow in culture media. Moreover, most of these methods lead to the isolation
of only the most common fungi (Davet and Rouxel, 1997). Molecular techniques can be used for
species identification if microscopic morphology does not allow definitive identification (Byrne,
2007).
Molecular identification is quick, sufficient, reproducible and can provide a high degree
of specificity to distinguish between the species of fungi, contrary to morphological and
biochemical tests used in laboratory diagnosis of fungi (Liu et al., 2000). Molecular
identification techniques based on the total extraction of fungal DNA then sequencing
polymerase chain reaction (PCR) amplified parts of 18S rRNA genes with fungal primers
provide a unique barcode for the identification of different fungal isolates at species level
(Hensel and Holden, 1996; Landeweert et al., 2003; Monod et al., 2005; Kabak et al., 2006).
Multiplex PCR is also a molecular technique that provides a fast and precise DNA-based
tool. It provides simultaneous amplification of species-specific genes and/or structural or
regulatory genes involved in mycotoxin biosynthesis. Multiplex PCR have been successfully
applied in a variety of foods and feeds to detect mycotoxigenic fungi (Miller, 1995; Martínez-
Culebras et al., 2017).

16
The internal transcribed spacer (ITS) region is used to classify the Aspergillus section
(Henry et al., 2000; Kumeda & Asao, 2001; Godet and Munaut, 2010). The ITS region is the
most useful for species identification, as it is the most rapidly evolving part of the rRNA cistron
(Schoch et al., 2012; Raja et al., 2017). Due to its ease of amplification, widespread use and an
adequately large barcode gap, a consortium of mycologists selected the ITS region as the official
barcode for fungi (Schoch et al., 2012; Raja et al., 2017). The use of index primers is also a
sequencing tool. Individual samples are added to different pairs of index primers, which allow
many samples to be mixed together and sequenced at the same time. After sequencing the
software can identify these indexes on each read sequence and the machine then knows which
sample to associate the read.
Mycotoxigenic fungi prevention and decontamination strategies
Fungi in crops can be prevented pre-harvest and post-harvest. Pre-harvest prevention
strategies include choice of resistant varieties, the use of biological and chemical agents and the
management of harvest schedules. Some post-harvest strategies include improved drying
methods, good storage conditions, irradiation, the use of natural and chemical agents, limiting
the physical damage of grains during harvesting, and avoiding insect infestation (Mohapatra et
al., 2017; Ukwuru et al., 2018). Grains contaminated with mycotoxin can be removed physically
by hand or by photoelectric detectors, but would be labor intensive, time-consuming and
expensive (Suttajit, 1989).
In biological control, the use of microbial antagonists either alone or as part of an
integrated control strategy to reduce pesticide inputs has emerged as a promising pre-and post-
harvest approach to control mycotoxins in crops (Ukwuru et al., 2018). Several organisms have

17
been tested for their ability to reduce both fungal infection and mycotoxin contamination,
including atoxigenic aspergilli, yeasts, bacteria and fungi (Ukwuru et al., 2018). For example,
atoxigenic fungal strains are widely used in several parts of the world, including the
Mediterranean, to prevent pre-harvest aflatoxin contamination of crops such as peanuts,
pistachios, maize and cotton seed (Ukwuru et al., 2018).
The detoxification of foods contaminated with aflatoxin has been an ongoing challenge
for the food industry. Chemical treatment should ensure that the detoxification system can alter
the toxin to a non-toxic derivative without affecting the raw product (Ukwuru et al., 2018). Many
common chemicals have been introduced to test the efficacy of detoxifying aflatoxin, such as
acetic acid, ammonia gas, calcium hydroxide and others (Bankole, 1996 ;Kavita and Reddy,
2000).
Another method used to inhibit growth of fungi is use of essential oils through
fumigation. Fumigation with two essential oils (oregano and thyme) inhibited the growth of A.
flavus, A. niger, and A. ochraceus in stored wheat (Paster et al., 1995). In another study,
essential oils from orange (Citrus sinensis) were most effective against A. niger and those from
mandarin (Citrus reticulata) were most effective against A. flavus (Mannaa and Kim, 2017).
Effect of infrared heat treatments on fungi
Moisture in foods play a significant role in absorption of IR radiation thereby leading to a
rapid increase in product surface temperature (Hamanaka et al., 2006). Increasing the power of
the IR heating source increases temperature and total energy absorbed by microorganisms in a
short duration leading to rapid microbial inactivation (Hamanaka et al., 2006; Bingol et al.,

18
2011). Increasing product thickness reduces temperature increase in the product thus reducing
the microbial inactivation efficiency (Hashimoto et al., 1991; Sawai et al., 1997)
Research has examined the use of IR to inactivate surface microorganisms such as in corn
flour, grains, cottage cheese, and many other products (Rosenthal et al., 1996; Jun & Irudayaraj,
2003; Hamanaka et al., 2006). Wilson et al. (2017) reported that intermittent drying of freshly
harvested corn with different intensities of IR radiation led to a significant reduction in mold
load without affecting the quality of the grain. Sterilization of wheat surface was investigated by
Hamanaka et al. (2000) who found that IR has the potential to significantly reduce the bacterial
counts on wheat. The growth of microorganisms on rice and wheat grain surfaces decreased by
increasing radiation intensity (Sorour, 2006). Table 4 shows the impact of IR heating on fungal
load reductions in several studies (Jun and Irudayaraj, 2003).

19
Table 4. Fungal decontamination of food by infrared heating
Maninder et al. (2001) looked at the potential of IR to decontaminate aspergillus on mung
bean. They found that treating the sample at an intensity of 0.299 kW/m2 at 70 ° C for 5 min had
approximately 5.3 log10 CFU/g reductions of the fungal spore population without substantially
changing the biochemical and physical properties of mung bean. Staack et al. (2008) found that
greater than 6 log reduction in fungal spores was observed in paprika powder after being treated
with IR. Also, Staack et al. (2008) noted that the higher the water activity the greater the log
reduction in paprika powder.
Pathogen Food Temperature/energy Time
Log
reduction
ln(log10 CF
U/mL)
References
Monilia fructigena Strawberr
y
Surface temperature
approximately 50 °C 10 s
2.5 to 5.2
log
(estimated)
Tanaka et
al., 2007
Aspergillus
niger spores Corn meal 72 °C 6 min 1.8
Jun and
Irudayaraj,
2003
Aspergillus
niger spores Corn meal
68 °C (with an optical
filter: 5.45 to 12.23
μm)
6 min 2.3
Jun and
Irudayaraj,
2003
Fusarium
proliferatumspores Corn meal 72 °C 6 min 1.4
Jun and
Irudayaraj,
2003
Fusarium
proliferatumspores Corn meal
68 °C (with an optical
filter: 5.45 to 12.23
μm)
6 min 1.95
Jun and
Irudayaraj,
2003

20
Many studies have looked at the effects of IR heat treatment on the decontamination of
fungi but they have not sufficiently explored the concept of selectivity of IR heat treatment on
inactivation of mycotoxigenic fungi. The goal of this research is to optimize IR heating and
decontamination technology, by using selective IR heating approach as a method to mitigate
aflatoxin contamination of grains specifically corn. The research is expected to help improve
human and animal health though advancement of a new, improved and commercially viable
technology for grain processing.

21
References
1. [FAO] Food and Agriculture Organization of the United Nations. (2004). Worldwide
regulations for mycotoxins in food and feed in 2003. FAO Food and Nutrition Paper.
2. Afzal, T., Abe, T., & Hikida, Y. (1999). Energy and quality aspects during combined
FIR-convection drying of barley. Journal of Food Engineering, 42(4), 177-182.
3. Aghajanzadeh, S., Kashaninejad, M., & Ziaiifar, A.M. (2016). Effect of infrared heating
on degradation kinetics of key lime juice physicochemical properties. Innovative Food
Science and Emerging Technologies, 38(Pt A), 139-148.
4. Alsohaili, S. A., & Bani-Hasan, B. M. (2018). Morphological and molecular
identification of fungi isolated from different environmental sources in the northern
eastern desert of Jordan. Jordan Journal of Biological Sciences. 11(3), 329 – 337.
5. Atungulu, G.G., Mohammadi-Shad, Z., & Wilson, S. (2017). Mycotoxin issues in pet
food. In S. C. Ricke, G.G. Atungulu, C.E, Rainwater, S. Park (Eds.), Food and Feed
Safety Systems and Analysis (pp. 25-44). United Kingdom: Academic Press, Elsevier.
6. Bagheri, H., Kashaninejad, M., Ziaiifar, A.M., & Aalami, M. (2016). Novel hybridized
infrared-hot air method for roasting of peanut kernels. Innovative Food Science and
Emerging Technologies, 37(Pt A), 106-114.
7. Bbosa G. S., Kitya D., Lubega A., Ogwal-Okeng J., Anokbonggo W. W., & Kyegombe
D. B. (2013). Review of the biological and health effects of aflatoxins on body organs
and body systems. In M. Razzaghi-Abyaneh (Ed.), Aflatoxins – Recent Advances and
Future Prospects (pp. 239–265). Rijeka: InTech.
8. Bingol, G., Yang, J., Brandl, M.T., Pan, Z., Wang, H. & McHugh, T.H. (2011). Infrared
pasteurization of raw almonds. Journal of Food Engineering, 104(3), 387-393.
9. Bullerman, L.B., Bianchini, A., Hanna, M.A., Jackson, L.S., Jablonski, J. & Ryu, D.
(2008). Reduction of fumonisin B1 in corn grits by single-screw extrusion. Journal of
Agricultural and Food Chemistry, 56(7), 2400-2405.
10. Byrne, B. A. (2007). Laboratory diagnosis of fungal diseases. In D.C. Sellon, M.T. Long
(Eds.), Equine Infectious Diseases (pp. 385-391). Elsevier Inc.
11. Dagerskog, M., & Österström, L. (1979). Infrared radiation for food processing.1. Study
of the fundamental properties of infrared radiation. Lebensmittel-Wissenschaft and
Technologie, 12(4), 237–42.
12. Davet, P., & Rouxel, F. (1997). Detection et isolement des champignons du sol. Paris:
Institut national de la recherche agronomique.
22
13. Gaddeyya, G., Niharika, P. S., Bharathi, P. & Kumar, P. K. R. (2012). Isolation and
identification of soil mycoflora in different crop fields at Salur Mandal. Advances in
Applied Science Research, 3(4), 2020-2026.
14. Ginzburg, A. S. (1969). Application of infrared radiation in food processing. Cleveland:
C.R.C. Press.
15. Godet, M., & Munaut, F. (2010) Molecular strategy for identification in Aspergillus
section Flavi, FEMS Microbiology Letters, 304(2), 157–168.
16. Hagen W, & Drawert F. (1986). Determination of water content by infrared.
Monatsschrift Brauwissenschaft, 40(6), 240–6.
17. Hamanaka, D., Dokan, S., Yasunaga, E., Kuroki, S., Uchino, T., & Akimoto, K. (2000).
The sterilization effects of infrared ray on the agricultural products spoilage
microorganisms. ASAE Annual International Meeting, Technical Papers: Engineering
Solutions for a New Century, 2(Pt 1), 971-979.
18. Hamanaka, D., Uchino, T., Furuse, N., Han, W. & Tanaka, S. (2006). Effect of
wavelength of infrared heaters on the inactivation of bacterial spores at various water
activities. International Journal of Food Microbiology, 108(2), 281-285.
19. Hamanaka, D., Yamada, H., Trivittayasil, V., Kadoyanagi, T., Tanaka, F., & Uchino, T.
(2011). Inactivation of pre- and post-germinated mold spores by infrared radiation
heating and ultraviolet irradiation. Food Science and Technology Research, 17(4), 295-
299.
20. Hashimoto, A., Shimizu, M., and Igarashi, H. (1991). Effect of far infrared radiation on
pasteurization of bacteria suspended in phosphate-buffered saline. Kagaku Kogaku
Ronbunshu, 17(3), 627-633.
21. Henry, T., Iwen, P.C., & Hinrichs, S.T. (2000). Identification of Aspergillus species
using internal transcribed spacer regions 1 and 2. Journal of Clinical Microbiology,
38(40), 1510–1515.
22. Henselt, M. & Holden, D. W. (1996). Molecular genetic approaches for the study of
virulence in both pathogenic bacteria and fungi. Microbiology, 142(Pt 5), 1049-1058.
23. Jun, S., & Irudayaraj, J. (2003). Selective Far Infrared Heating System—Design and
Evaluation. Drying Technology, 21(1), 51-67.
24. Kabak, B., Dobson, A. D. W. & Var, I. (2006). Strategies to Prevent Mycotoxin
Contamination of Food and Animal Feed: A Review, Critical Reviews in Food Science
and Nutrition, 46(8), 593-619.
25. Khlangwiset, P., Shephard, GS. & Wu, F (2011). Aflatoxins and growth impairment: A
review. Critical Reviews in Toxicology, 41(9), 740-755.

23
26. Krishnamurthy K, Khurana HK, Soojin J, Irudayaraj J & Demirci A. (2008). Infrared
heating in food processing: an overview. Comprehensive Reviews in Food Science and
Food Safety, 7(1), 2-13.
27. Kumeda, Y., & Asao, T. (2001). Heteroduplex panel analysis a novel method for genetic
identification of Aspergillus section Flavi strains. Applied and Environmental
Microbiology, 67(9), 4084–4090.
28. Landeweert, R., Leeflang, P., Kuyper, T.W., Hoffland, E., Rosling, A., Wernars, K &
Smit, E. (2003). Molecular identification of ectomycorrhizal mycelium in soil horizons.
Applied and Environmental Microbiology, 69(1), 327-333.
29. Lentz, R.R., Pesheck, P.S., Anderson, G.R., DeMars, J., & Peck, T.R. (1995). Method of
processing food utilizing infrared radiation. U.S. patent 5382441.
30. Lima, R. F., & Borba (2001). Viability, morphological characteristics and dimorphic
ability of fungi preserved by different methods. Revista Iberoamericana de Micología.,
18(4), 191-196.
31. Liu, D., Coloe, S., Baird, R. & Pedersen, J. (2000). Application of PCR to the
identification of dermatophyte fungi. Journal of Medical Microbiology, 49(6), 493-497.
32. Magan, N., Sanchis, V., & Aldred, D., (2004). Role of spoilage fungi in seed
deterioration. In D.K. Aurora (Ed.), Fungal Biotechnology in Agricultural, Food and
Environmental Applications (pp. 311–323). New York: Marcel Dekker.
33. Maninder, Meenu & Paramita, Guha & Sunita Mishra. (2017). Impact of infrared
treatment on quality and fungal decontamination of mung bean (Vigna radiata L.)
inoculated with Aspergillus spp. Journal of the Science of Food and Agriculture, 98(7),
2770-2776.
34. Mannaa, M., & Kim, K. D. (2017). Control strategies for deleterious grain fungi and
mycotoxin production from preharvest to postharvest stages of cereal crops: a review.
Life Science and Natural Resources Research, 25(1), 13–27.
35. Martínez-Culebras, P., Selma, M.V., & Aznar, R. (2017). Multiplex detection of
Aspergillus species. In A. Moretti, A. Susca (Eds.) Mycotoxigenic Fungi. Methods in
Molecular Biology (pp. 261-268). New York: Humana Press.
36. Miller, J.D. (1995). Fungi and mycotoxins in grain: implications for stored product
research. Journal of Stored Products Research, 31(1), l-16.
37. Mohammadi, Z., Kashaninejad, M., Ziaiifar, A., & Ghorbani, M. (2018). Peeling of
kiwifruit using infrared heating technology: A feasibility and optimization study. Lwt -
Food Science and Technology, 99(99), 128-137.

24
38. Mohapatra, D., Kumar, S., Kotwaliwale, N. & Singh, K.K. (2017). Critical factors
responsible for fungi growth in stored food grains and non-chemical approaches for their
control. Industrial Crops and Products, 108(1), 162-182.
39. Monod, M. B., Zaugg, C., Chenne, B. L., Fratti, M. & Panizzon, R. (2006). Fast and
reliable PCR/sequencing/RFLP assay for identification of fungi in onychomycoses.
Journal of Medical Microbiology, 55(Pt 9), 1211-1216.
40. Munkvold, G. P. (2017). Fusarium species and their associated mycotoxins. In A.
Moretti, A. Susca (Eds.) Mycotoxigenic fungi. Methods in molecular biology (pp. 51–
106). New York: Humana Press.
41. Nasiroglu, S., & Kocabiyik, H. (2009).Thin-layer infrared radiation drying of red pepper
slices. Journal of Food Process Engineering, 32 (1), 1-16.
42. Nowak, D., & Piotr P. L. (2004). Infrared drying of apple slices. Innovative Food Science
and Emerging Technologies, 5(3), 353–360.
43. Okeyo, A. (2016) "Assessment of an industrial type radiant heating system for drying
rough rice" Theses and Dissertations, 1600. https://scholarworks.uark.edu/etd/1600
44. Pan, Z. & Atungulu, G. G. (2010). Infrared heating for food and agricultural processing.
London: CRC Press.
45. Pan, Z., Shih, C., Mchugh, T. H., & Hirschberg, E. (2008). Study of banana dehydration
using sequential infrared radiation heating and freeze-drying. LWT - Food Science and
Technology, 41(10), 1944-1951.
46. Paster, N., Menasherov, M., Ravid, U. & Juven, B. (1995). Antifungal activity of oregano
and thyme essential oils applied as fumigants against fungi attacking stored grain.
Journal of Food Protection, 58(1), 81-85.
47. Peraica, M., Radić, B., Lucić, A., & Pavlović, M. (1999). Toxic effects of mycotoxins in
human. Bulletin of the World Health Organization, 77(9), 754-66.
48. Perrone, G., & Susca, A. (2017). Penicillium species and their associated mycotoxins. In
A. Moretti, A. Susca (Eds.) Mycotoxigenic fungi. Methods in molecular biology (pp. 51–
106). New York: Humana Press.
49. Pitt, J.I., Taniwaki, M.H. & Cole, M.B. (2013). Mycotoxin production in major crops as
influenced by growing, harvesting, storage and processing, with emphasis on the
achievement of food safety objectives. Food Control, 32(1), 205-215.
50. Raja, H. A., Miller, A. N., Pearce, C. J., & Oberlies, N. H. (2017). Fungal identification
using molecular tools: A primer for the natural products research community. Journal of
natural products, 80(3), 756-770.
25
51. Ratti, C. & Mujumdar, A.S. (1995). Infrared drying. In S.M. Arun (Ed.) Handbook of
Industrial Drying (pp. 567–588). New York: Marcel Dekker, Inc.
52. Reddy, K.R., Reddy, C.S., Abbas, H. K., Abel, C. A. & Muralidharan, K. (2008).
Mycotoxigenic fungi, mycotoxins, and management of rice grains. Toxin Reviews, 27(3-
4), 287-317.
53. Reddy, K.R.N., Reddy, C.S., & Muralidharan, K. (2005). Characterization of aflatoxin
B1 produced by Aspergillus flavus isolated from discolored rice grains. Journal of
mycology and plant pathology, 35(3), 470–474.
54. Ring, E. F. J. (2000). The discovery of infrared radiation in 1800, The Imaging Science
Journal, 48(1), 1-8.
55. Rosenthal, I., Rosen, B., & Bernstein, S. (1996). Surface pasteurization of cottage cheese.
Milchwissenschaft, 51(4), 198-201.
56. Rowan-Robinson, M. (2013). Night vision exploring the infrared universe. Cambridge:
Cambridge University Press.
57. Sadhasivam, S., Britzi, M., Zakin, V., Kostyukovsky, M., Trostanetsky, A., Quinn, E., &
Sionov, E. (2017). Rapid detection and identification of mycotoxigenic fungi and
mycotoxins in stored wheat grain. Toxins, 9(10), 302.
58. Sakai, N., & Hanzawa, T. (1994). Applications and advances in far-infrared heating in
Japan. Trends in Food Science & Technology, 5(11), 357-362.
59. Salehi, F., Kashaninejad, M., Asadi, F., & Najafi, A. (2016). Improvement of quality
attributes of sponge cake using infrared dried button mushroom. Journal of Food Science
& Technology, 53 (3), 1418-1423.
60. Sawai, J., Fujisawa, M., Igarashi, H., Hashimoto, A., Kokugan, T., Shimizu, M., &
Kojima, H. (1997). Pasteurization of bacterial spores in liquid medium by far-infrared
irradiation. Journal of chemical engineering of Japan, 30(1), 170-172.
61. Schoch C. L., Seifert K. A., Huhndorf S., Robert V., Spouge J. L., Levesque C. A., Chen
W & Fungal Barcoding Consortium. (2012). Nuclear ribosomal internal transcribed
spacer (ITS) region as a universal DNA barcode marker for fungi. Proceedings of the
National Academy of Sciences.109 (16), 6241–6246.
62. Shih, C., Pan, Z., McHugh, T. H., Wood, D., & Hirschberg, E. (2008). Sequential
infrared radiation and freeze-drying method for producing crispy strawberries.
Transactions of the ASABE, 51(1), 205-216.

26
63. Shikha, D., & Awasthi, R. (2015). Application of I.R. spectroscopy & mass spectrometry
in structural elucidation of drugs. International Journal of Advanced Research in
Chemical Science, 2(8), 38-45.
64. Smith, M. C., Madec, S., Coton, E., & Hymery, N. (2016). Natural co-occurrence of
mycotoxins in foods and feeds and their in vitro combined toxicological
Effects. Toxins, 8(4), 94.
65. Staack & Ahrné, Lilia & Borch, Elisabeth & Knorr, E. (2008). Effect on infrared heating
on quality and microbial decontamination in paprika powder. Journal of Food
Engineering, 86(1), 17-24.
66. Suttajit, M. (1989). Prevention and control of mycotoxins. In R. L., Frio, A. S., Hicks, P.
A., & J. V. Lozare (Eds.), Mycotoxin Prevention and Control in Foodgrains. UNDP/FAO
Regional Network Intercountry Cooperation on Preharvest Technology and Quality
Control of Foodgrains, Bankok, Tailand,
67. Tanaka, F., Verboven, P., Scheerlinck, N., Morita, K., Iwasaki, K., & Nicolaï, B. (2007).
Investigation of far infrared radiation heating as an alternative technique for surface
decontamination of strawberry. Journal of Food Engineering, 79(2), 445-452.
68. Uchino, T., Inoue, A., Kawasaki, K., Hamanaka, D. &Tanaka, S. (2004). The possibility
of applying the infrared radiation to disinfection of fresh citrus fruit. Journal of the
Japanese Society of Agricultural Machinery, 53(1), 7-10.
69. Ukwuru, M.U., Ohaegbu, C.G., & Muritala, A. (2018). An Overview of mycotoxin
contamination of foods and feeds. Journal of Biochemical and Microbial Toxicology,
1(1), 101.
70. Varga, J., Frisvad, J.C. & Samson, R.A. (2011). Two new aflatoxin producing species,
and an overview of Aspergillus section Flavi. Studies in Mycology, 69(1), 57-80.
71. Villers, P. (2014). Aflatoxins and safe storage. Frontiers in microbiology, 10(5), 158.
72. Williams, J. H., Phillips, T. D., Jolly, P. E., Stiles, J. K., Jolly, C. M., & Aggarwal, D.
(2004). Human aflatoxicosis in developing countries: a review of toxicology, exposure,
potential health consequences, and interventions. American Journal of Clinical Nutrition
80(5), 1106–1122.
73. Wilson, S., Atungulu, G., Couch, A., & Sadaka, S. (2015). Radiant heating and tempering
treatments for improving rate of moisture removal during drying of shelled corn. Applied
Engineering in Agriculture, 31(5), 799–808.
74. Wilson, S.A., Okeyo, A.A., Olatunde, G.A. & Atungulu, G.G. (2017). Radiant heat
treatments for corn drying and decontamination. Journal of Food Processing and
Preservation, 41(5), e13193.

27
75. Zhu, Y., & Pan, Z. (2009). Processing and quality characteristics of apple slices under
simultaneous infrared dry-blanching and dehydration with continuous heating. Journal of
Food Engineering, 90 (4), 441-452.
28
Chapter 3: Selectivity of Infrared Wavelengths on Inactivation of
Microbes on Shelled Corn
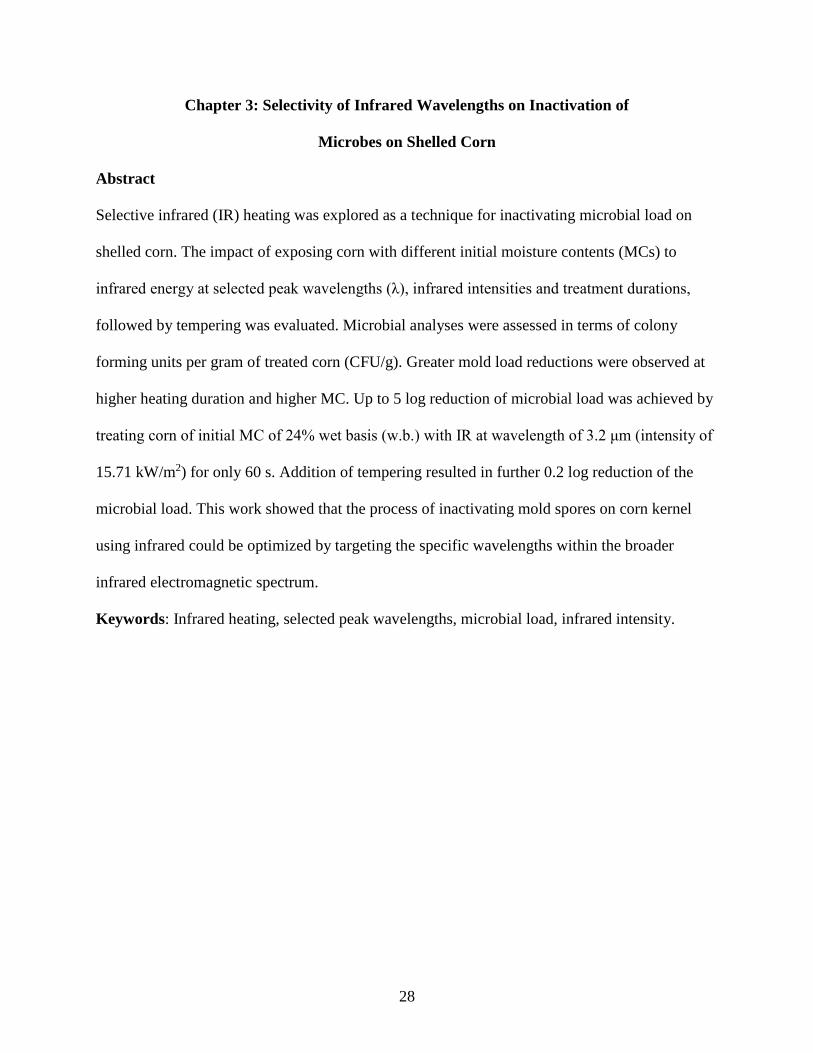
Abstract
Selective infrared (IR) heating was explored as a technique for inactivating microbial load on
shelled corn. The impact of exposing corn with different initial moisture contents (MCs) to
infrared energy at selected peak wavelengths (λ), infrared intensities and treatment durations,
followed by tempering was evaluated. Microbial analyses were assessed in terms of colony
forming units per gram of treated corn (CFU/g). Greater mold load reductions were observed at
higher heating duration and higher MC. Up to 5 log reduction of microbial load was achieved by
treating corn of initial MC of 24% wet basis (w.b.) with IR at wavelength of 3.2 μm (intensity of
15.71 kW/m2) for only 60 s. Addition of tempering resulted in further 0.2 log reduction of the
microbial load. This work showed that the process of inactivating mold spores on corn kernel
using infrared could be optimized by targeting the specific wavelengths within the broader
infrared electromagnetic spectrum.
Keywords: Infrared heating, selected peak wavelengths, microbial load, infrared intensity.
29
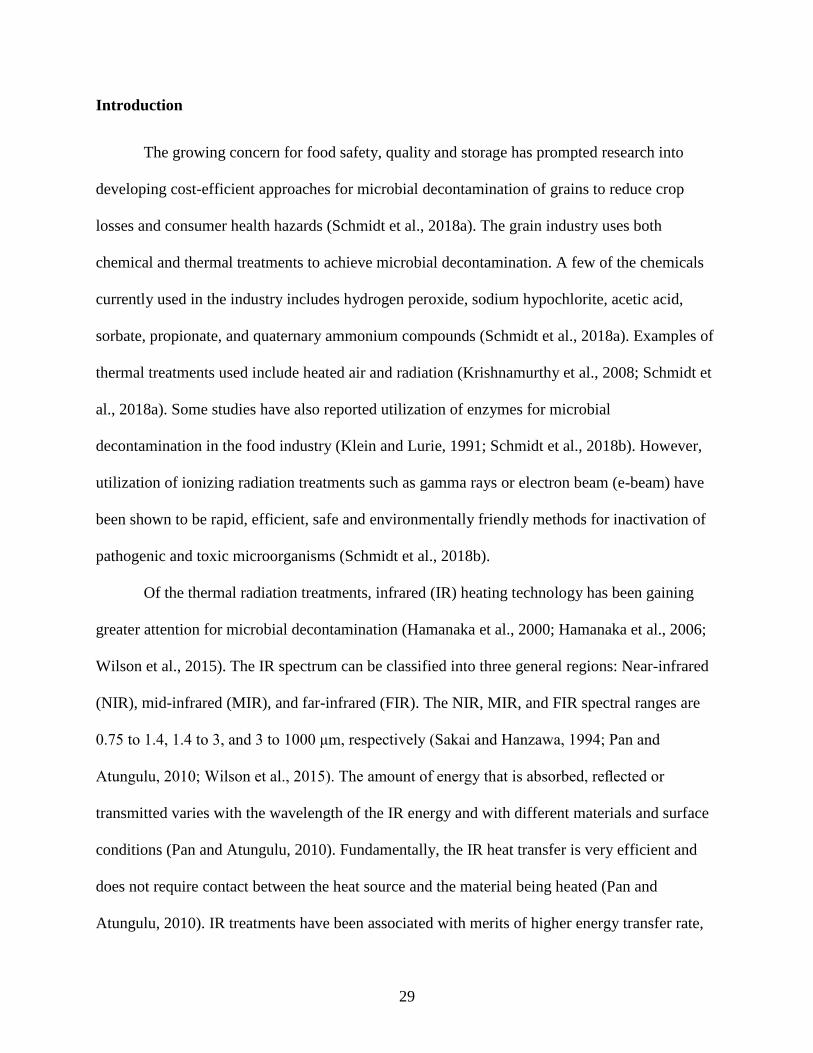
Introduction
The growing concern for food safety, quality and storage has prompted research into
developing cost-efficient approaches for microbial decontamination of grains to reduce crop
losses and consumer health hazards (Schmidt et al., 2018a). The grain industry uses both
chemical and thermal treatments to achieve microbial decontamination. A few of the chemicals
currently used in the industry includes hydrogen peroxide, sodium hypochlorite, acetic acid,
sorbate, propionate, and quaternary ammonium compounds (Schmidt et al., 2018a). Examples of
thermal treatments used include heated air and radiation (Krishnamurthy et al., 2008; Schmidt et
al., 2018a). Some studies have also reported utilization of enzymes for microbial
decontamination in the food industry (Klein and Lurie, 1991; Schmidt et al., 2018b). However,
utilization of ionizing radiation treatments such as gamma rays or electron beam (e-beam) have
been shown to be rapid, efficient, safe and environmentally friendly methods for inactivation of
pathogenic and toxic microorganisms (Schmidt et al., 2018b).
Of the thermal radiation treatments, infrared (IR) heating technology has been gaining
greater attention for microbial decontamination (Hamanaka et al., 2000; Hamanaka et al., 2006;
Wilson et al., 2015). The IR spectrum can be classified into three general regions: Near-infrared
(NIR), mid-infrared (MIR), and far-infrared (FIR). The NIR, MIR, and FIR spectral ranges are
0.75 to 1.4, 1.4 to 3, and 3 to 1000 μm, respectively (Sakai and Hanzawa, 1994; Pan and
Atungulu, 2010; Wilson et al., 2015). The amount of energy that is absorbed, reflected or
transmitted varies with the wavelength of the IR energy and with different materials and surface
conditions (Pan and Atungulu, 2010). Fundamentally, the IR heat transfer is very efficient and
does not require contact between the heat source and the material being heated (Pan and
Atungulu, 2010). IR treatments have been associated with merits of higher energy transfer rate,

30
shorter drying duration, smaller environmental footprints, and better or comparable product
quality compared to conventional heating techniques (Krishnamurthy et al., 2008). However, IR
heating can cause high heat flux on the surface of the heated product, leading to case-hardening
(Wilson et al., 2017). Therefore, it is important to incorporate a tempering step to allow the
redistribution of moisture in the IR heated material and eliminate development of large moisture
gradients within the kernel (Li, et al., 1998; Nishiyama et al., 2006). During the tempering
process, the heated material is allowed to rest at a constant temperature for a while under
hermetic conditions before the next cycle of heating. IR heating followed by a tempering process
may allow further decontamination of mold on the heated material.
Research has examined the use of IR energy supplied by broadband wavelength to
decontaminate surface microorganisms on food such as corn flour, grains, cottage cheese, mung
bean, paprika and many other products (Rosenthal et al., 1996; Maninder et al., 2001; Jun &
Irudayaraj, 2003; Hamanaka et al., 2006; Staack stack et al., 2008; Wilson et al., 2017).
Although many studies have observed significant reduction in microbial load after treatment of
products with IR energy, most of the reported studies used energy from broadband emitters. The
emitters used in those studies supplied the energy from a wide range of wavelengths. It is evident
from those studies that complete decontamination of microbes was not achieved. Based on type,
chemistry and cellular DNA sensitivity, microbes may respond or interact with IR wavelengths
differently. Therefore, the concept of selectivity of IR wavelength on decontamination of
microbes needs to be explored exhaustively. Within the IR band some selected wavelengths may
have unique interactions with microbes resulting in improved decontamination and overall
energy efficiency of the treatment.

31
The objective of this study was to investigate the impact of exposing corn to infrared
energy at selected peak wavelengths, infrared intensities and treatment durations, followed by
tempering on inactivation of microbes.
Materials and methods
Corn samples
Freshly-harvested corn at initial MCs of 16%, 20%, and 24% wet basis (w.b.) was
procured from the University of Arkansas, Division of Agriculture Experiment Station for use in
the experiments. The samples were cleaned by sorting and removing any material other than
grain and stored in a laboratory cold room set at 4oC until use. Before conducting any
experiments, the samples were retrieved and allowed to equilibrate with room conditions. The
MCs of the samples were determined by using an AM 5200 Grain Moisture Tester (PERTEN
Instruments, Hagerstown, Sweden). A 100 g of corn was massed out and used for each treatment.
Infrared heating device
The lab-assembled IR dryer is equipped with ceramic infrared (CIR) emitters ((Tempco
Electric Heater Corporation, Wood Dale, IL). The CIR emitters contain high temperature
insulation blankets in the wiring compartment and is housed in a low profile 20 gauge
Aluminized steel or stainless steel box that make the system resistant to thermal cracking. The
emitter has a metamorphic yellow color (cold) and changes to orange when hot. The standard
operational voltage includes 220 – 240 V with watt density range from 17 to 54.3 kW/m2; the
temperature generated can be as high as 740oC. The construction and schematic of the equipment
that was used is shown in Figure 1.

32
Fig. 1. A laboratory assembled infrared dryer equipped with ceramic infrared emitters (a);
Schematic diagram showing different views of the infrared equipment (b).
Measurement of Radiant Energy Transfer
A radiometer (Ophir-Spiricon, LLC, North Logan, UT) was used to determine energy
transfer (IR intensity) from IR energy source to the product. The radiometer measures power
emitted in kW; the IR intensity was calculated by dividing the supplied power by area of heated
black body (equation 1).
𝐸𝑛𝑒𝑟𝑔𝑦 𝑡𝑟𝑎𝑛𝑠𝑓𝑒𝑟 (𝐼𝑅 ℎ𝑒𝑎𝑡𝑖𝑛𝑔 𝑖𝑛𝑡𝑒𝑛𝑠𝑖𝑡𝑦) =𝑀𝑒𝑎𝑠𝑢𝑟𝑒𝑑 𝑝𝑜𝑤𝑒𝑟 (𝑘𝑊)
𝐻𝑒𝑎𝑡𝑒𝑑 𝑏𝑙𝑎𝑐𝑘 𝑏𝑜𝑑𝑦 𝑎𝑟𝑒𝑎 (𝑚2) (1)
Infrared treatments
Catalytic IR emitters were used to generate IR energy. The wavelength and total emitted
energy was controlled by varying the temperature of IR emitter. Selected peak wavelengths were
within the mid and far IR heating region of the electromagnetic spectrum (3.1 μm, 4.5 μm, and
5.8 μm). The IR intensity at the selected product-to-emitter-gap sizes (110, 275, and 440 mm)
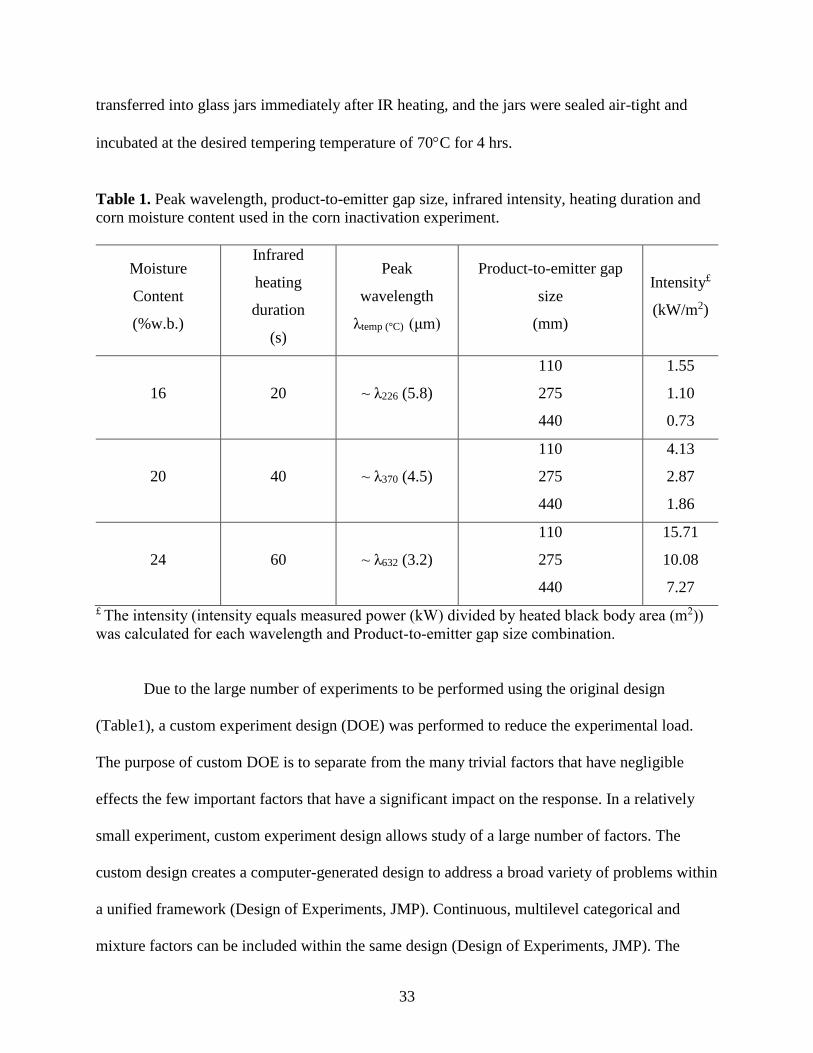
were determined using a radiometer. The different treatment combinations are shown in table 1.
After IR treatments the samples were tempered. In case of tempering treatments, samples were
33
transferred into glass jars immediately after IR heating, and the jars were sealed air-tight and
incubated at the desired tempering temperature of 70C for 4 hrs.
Table 1. Peak wavelength, product-to-emitter gap size, infrared intensity, heating duration and
corn moisture content used in the corn inactivation experiment.
Moisture
Content
(%w.b.)
Infrared
heating
duration
(s)
Peak
wavelength
λtemp (°C) (μm)
Product-to-emitter gap
size
(mm)
Intensity£
(kW/m2)
16 20 ~ λ226 (5.8)
110
275
440
1.55
1.10
0.73
20 40 ~ λ370 (4.5)
110
275
440
4.13
2.87
1.86
24 60 ~ λ632 (3.2)
110
275
440
15.71
10.08
7.27
£ The intensity (intensity equals measured power (kW) divided by heated black body area (m2))
was calculated for each wavelength and Product-to-emitter gap size combination.
Due to the large number of experiments to be performed using the original design
(Table1), a custom experiment design (DOE) was performed to reduce the experimental load.
The purpose of custom DOE is to separate from the many trivial factors that have negligible
effects the few important factors that have a significant impact on the response. In a relatively
small experiment, custom experiment design allows study of a large number of factors. The
custom design creates a computer-generated design to address a broad variety of problems within
a unified framework (Design of Experiments, JMP). Continuous, multilevel categorical and
mixture factors can be included within the same design (Design of Experiments, JMP). The
34
custom DOE also allow the specification of hard and very hard-to-change factors for automatic
creation of the appropriate designs and has the capability to define factor constraints, model
effects and interactions, as well as include center points and/or replicate runs as the design is
built (Design of Experiments, JMP).
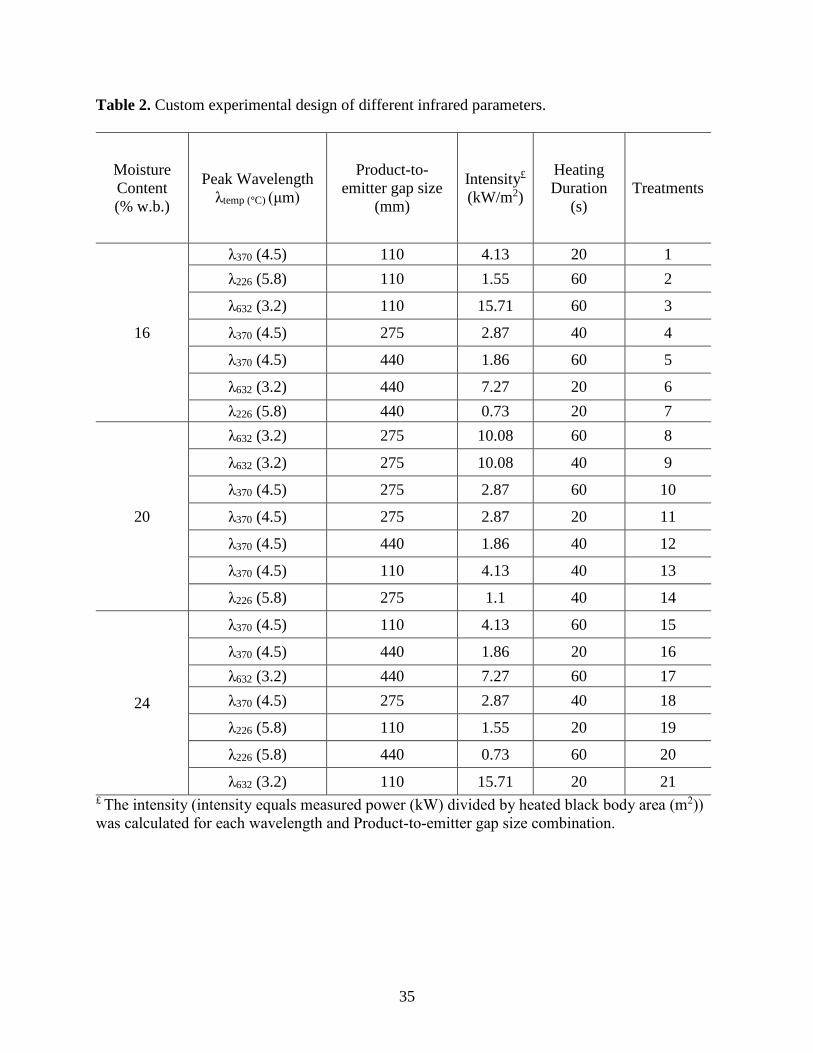
For this experiment, a custom DOE with response surface model (RSM) was used to
obtain a more cost-effective design. A 21 run design was created by the custom design (Table 2).
This design was used to generate data and perform analyses reported in the results section.
35
Table 2. Custom experimental design of different infrared parameters.
Moisture
Content
(% w.b.)
Peak Wavelength
λtemp (°C) (μm)
Product-to-
emitter gap size
(mm)
Intensity£
(kW/m2)
Heating
Duration
(s)
Treatments
16
λ370 (4.5) 110 4.13 20 1
λ226 (5.8) 110 1.55 60 2
λ632 (3.2) 110 15.71 60 3
λ370 (4.5) 275 2.87 40 4
λ370 (4.5) 440 1.86 60 5
λ632 (3.2) 440 7.27 20 6
λ226 (5.8) 440 0.73 20 7
20
λ632 (3.2) 275 10.08 60 8
λ632 (3.2) 275 10.08 40 9
λ370 (4.5) 275 2.87 60 10
λ370 (4.5) 275 2.87 20 11
λ370 (4.5) 440 1.86 40 12
λ370 (4.5) 110 4.13 40 13
λ226 (5.8) 275 1.1 40 14
24
λ370 (4.5) 110 4.13 60 15
λ370 (4.5) 440 1.86 20 16
λ632 (3.2) 440 7.27 60 17
λ370 (4.5) 275 2.87 40 18
λ226 (5.8) 110 1.55 20 19
λ226 (5.8) 440 0.73 60 20
λ632 (3.2) 110 15.71 20 21 £ The intensity (intensity equals measured power (kW) divided by heated black body area (m2))
was calculated for each wavelength and Product-to-emitter gap size combination.

36
Mold count determination
Standard procedures for microbial isolation, plating and counting were used (AOAC
method 997.02) to determine the corn total mold counts. Phosphate-buffered dilution water (0.5
M, pH = 7.2) were used and sterilized by autoclaving at 121C (AOAC method 997.02). To
determine total mold counts on corn, the samples were masticated using a lab stomacher (Silver
Panoramic, iUL, S.A., Barcelona, Spain) to dislodge the microorganisms. A 10 g sample of corn
was mixed with 90 mL phosphate-buffered dilution water in a sterile stomacher bag and
masticated. The stomacher was set at 240 s and 0.7 stroke/s. This process resulted in corn
samples that was pulverized into powder for total microbial load analysis. Serial ten-fold
dilutions of the samples were prepared in phosphate-buffered dilution water. The 3M Petrifilm
Mold Count Plates (3M Microbiology Product, Minneapolis, MN) were used to enumerate mold
counts per manufacturer recommendations. The inoculated plates were stacked to a maximum of
20 units and incubated. Mold Count Plates were incubated at 25C for 120 h. After incubation,
the colony forming units (CFU) on each plate were counted. The appropriate dilution factor,
volume, and sample weight were taken into account to obtain the total CFU/g of each sample:
𝑇𝑐𝑓𝑢 =𝑃𝑐𝑓𝑢
𝐷𝑟 (2)
where, Tcfu is total colony forming units per gram of corn (CFU/g), Pcfu is colony forming units
counted on plate per gram of corn (CFU/g), and Dr is dilution factor (10-1 to 10-5 times).
Statistical analysis
Analysis of variance (ANOVA) and response surface methodology (RSM) were
performed with a statistical software (JMP version 14.0.0, SAS Institute) to determine significant

37
differences within and among samples. The RSM was used to describe the response-factor
relationship. All tests were considered to be significant when p < 0.05.
Results and discussion
Implications of selective infrared heat treatment on microbial load
Mold colonies appeared blue, black, yellow, or green in color on the Mold Count Plate.
The average mold load on the control samples were 5.95 ± 0.13, 5.85 ± 0.34, and 5.92 ± 0.11
Log (CFU/g) for corn at MC 16, 20 and 24%, respectively. Figure 2 and Figure 3 indicate the
contour plots of mold counts in terms of colony forming units (log CFU/g) for IR treatments
only. The mean values of the different MC were not significantly different.
Decreasing the PEG resulted in a decrease in mold load on corn kernels (Fig. 2a and Fig.
2b). Figures 2a and 2b also showed that there was higher mold load reduction at a wavelength of
3.2 μm (15.7 kW/m2, 10.08 kW/m2, 7.27 kW/m2) than at a wavelength of 4.5 μm (4.13 kW/m2,
2.87 kW/m2, 1.86 kW/m2) and 5.8 μm (1.55 kW/m2, 1.10 kW/m2, 0.73 kW/m2). Similar results
were reported by Sorour, (2006), where microorganism growth on the surfaces of rice and wheat
grain decreased with increasing radiation intensity. Also, Hamanaka et al., (2006) and Bingol et
al., (2011) reported increasing the power of the IR heating source increases temperature and total
energy absorbed by microorganisms in a short duration leading to rapid microbial inactivation.
It was also observed from Figures 2 and 3 that higher heating duration resulted in greater
mold load reduction. The tempering step resulted in further reduction of the mold load (Fig. 2b
and Fig. 3b) at all of the three wavelengths. Treatments at higher heating durations, lower
wavelength and lower PEG were more effective to inactivation of mold.

38
Fig. 2. Contour plots of mold counts (log CFU/g) as influenced by the interaction between
heating duration (s), wavelength (μm) and product-to-emitter gap size for infrared heating only
(a) and infrared and tempering treatments (b), respectively; CFU means colony forming units; λ
signifies wavelength in µm.
The corn kernel MC was an important factor that influenced reduction of the mold load in
the samples (Fig. 3). A direct relationship between mold counts and MC was observed; as the
MC level increased, the mold counts decreased. The spores on samples with low water activity
displayed increased resistance to decontamination (Staack et al., 2008).

39
Fig. 3. Contour plots of mold counts (log CFU/g) as influenced by the interaction between
heating duration (s), wavelength (μm) and corn moisture content (% w.b.) for infrared heating
only (a) and infrared and tempering treatments (b), respectively; CFU means colony forming
units; λ signifies wavelength in µm.
Analysis were performed to investigate the correlation between the selected peak
wavelength, heating duration, MC, and PEG on the microbial load reduction after IR and
tempering treatments. After IR treatment, the effects of selected peak wavelength, heating
duration, MC, and PEG had a statistically significant effect on the microbial load response
(p < 0.0001) (Table 3). The effect of IR treatment combined with tempering also had statistically
significant effects on reducing microbial load on the samples (Table 4). The model explained
95% of the variation for IR treatments only and 89% of the variation for IR combined with
tempering.

40
Table 3. Effect test table showing the effects of selective infrared heat treatment on the microbial
population of corn.
Source DF Sum of Squares Mean Square F Ratio
Model 7 39.202018 5.60029 37.4975
Error 13 1.941560 0.14935 Prob >F
Corrected Total 20 41.143578 <0001
Table 4. Effect test table showing the effects of selective infrared heating followed by tempering
treatment on the microbial population of corn.
Source DF Sum of Squares Mean Square F Ratio
Model 7 24.189338 3.45562 15.1240
Error 13 2.970313 0.22849 Prob >F
Corrected Total 20 27.159652 <0001
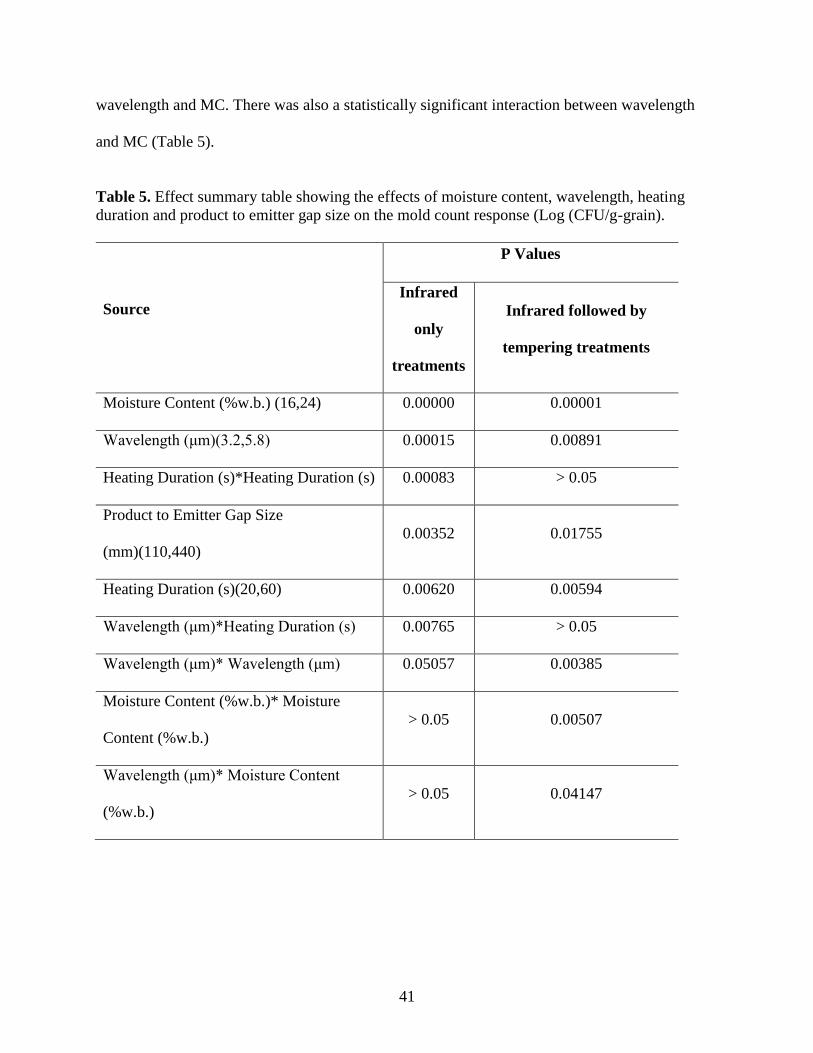
Table 5 shows the effect summary table for the mold count response. The table list the
model effects. Smaller p-values indicate higher significance to the model. The effect summary
table for the microbial load response indicates high statistical significance (p<0.05) for the main
effects (MC, heating duration, product to emitter gap and wavelength). There were also quadratic
effects in the model. This means that if the relationship between responses and heating duration
were represented by a graph, the optimal responses will not be at the extremes of the
experimental region but inside it. There was a statistically significant interaction between the
wavelength and the heating duration (p = 0.0076) for IR treatments without tempering. This
means that wavelength and the heating duration aided in the reduction of the mold count. After
infrared and tempering the main effects were still significant, there was quadratic effect between
41
wavelength and MC. There was also a statistically significant interaction between wavelength
and MC (Table 5).
Table 5. Effect summary table showing the effects of moisture content, wavelength, heating
duration and product to emitter gap size on the mold count response (Log (CFU/g-grain).
Source
P Values
Infrared
only
treatments
Infrared followed by
tempering treatments
Moisture Content (%w.b.) (16,24) 0.00000 0.00001
Wavelength (μm)(3.2,5.8) 0.00015 0.00891
Heating Duration (s)*Heating Duration (s) 0.00083 > 0.05
Product to Emitter Gap Size
(mm)(110,440)
0.00352 0.01755
Heating Duration (s)(20,60) 0.00620 0.00594
Wavelength (μm)*Heating Duration (s) 0.00765 > 0.05
Wavelength (μm)* Wavelength (μm) 0.05057 0.00385
Moisture Content (%w.b.)* Moisture
Content (%w.b.)
> 0.05 0.00507
Wavelength (μm)* Moisture Content
(%w.b.)
> 0.05 0.04147

42
Optimization of microbial load reduction after IR and tempering treatments
The factors in this experiment have combinatorial nature because within each factor there
are different levels. Therefore, the process must be optimized to determine the best combinations
of wavelength, MC, heating duration, and product-to-emitter gap size needed to achieve the
greatest responses in terms of lowest mold load. According to the prediction profiles it was
determined that minimum levels of microbial load could be obtained at factor settings shown in
Figure 4 and Figure 5 for IR treatments only and IR followed by tempering treatments,
respectively. Of the possible wavelengths (3.2, 4.5, and 5.8 μm), heating durations (20 s, 40 s,
and 60 s), PEGs (110, 275, and 440 mm) and MCs (16, 20, and 24%) it was determined that a
wavelength of 3.2 μm, PEG of 110 cm, heating duration of 60 s and MC of 24% w.b. are
preferred for optimum inactivation of mold load on corn. The same results were also observed
for IR followed by tempering treatments (Fig. 5). It should be noted that a wavelength of 3.2 μm
and PEG of 110 mm corresponds to an intensity of 15.71 kW/m2. At these settings, optimized
responses of mold count for IR treatment only and IR followed by tempering treatment should be
0.499 (5.5 log reduction) and 0.229 (5.7 log reduction) Log (CFU/g), respectively. Wilson et al.
(2017) reported that increasing the energy (2.39 to 5.55 kW/m2) of broadband emitters resulted
in an average reduction of 2.6 and 2.9 log CFU / g, respectively, at 180 and 30 s of intermittent
IR heating. This implies that complete inactivation was not possible with broad band emitters.
In addition to the determination of the optimal factor levels, the prediction profiler also
gives insight into the significance of how a factor impact the performance parameter in question.
A steep slope indicates that an operational parameter has a significant impact on the given
performance parameter, whereas a shallow slope indicates little or no effect on a performance
parameter. For mold count response, the operational parameter of MC was determined to be the

43
most significant for both tempering and tempering combined with IR treatment. This indicates
that the effects of increasing the MC contributed the most change to the microbial response.
The last row of plots indicates the desirability trace for each factor (Fig. 4 and Fig. 5).
The vertical axis shows both the current desirability and the trace of desirability that result from
changing one factor at a time. For IR heat treatment only and IR combined with tempering (Fig.
4 and Fig. 5), a desirability of 0.99 indicates that approximately 99% of the goals to minimize
corn mold count were achieved.
Figure 4: Prediction profile for mold count (Log (CFU/g-grain)) responses with parameter
settings product-to-emitter gap size (mm), wavelength (µm), heating duration (s), and corn
moisture content (%w.b.) for infrared heat treatments.
44
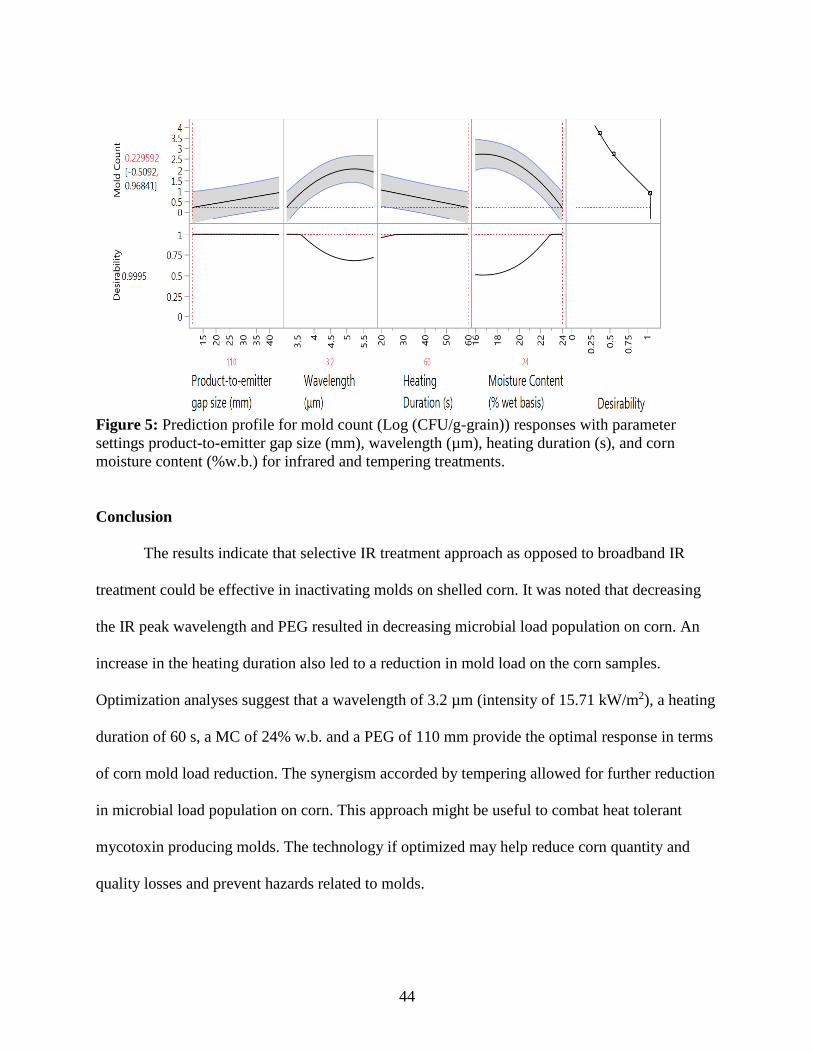
Figure 5: Prediction profile for mold count (Log (CFU/g-grain)) responses with parameter
settings product-to-emitter gap size (mm), wavelength (µm), heating duration (s), and corn
moisture content (%w.b.) for infrared and tempering treatments.
Conclusion
The results indicate that selective IR treatment approach as opposed to broadband IR
treatment could be effective in inactivating molds on shelled corn. It was noted that decreasing
the IR peak wavelength and PEG resulted in decreasing microbial load population on corn. An
increase in the heating duration also led to a reduction in mold load on the corn samples.
Optimization analyses suggest that a wavelength of 3.2 µm (intensity of 15.71 kW/m2), a heating
duration of 60 s, a MC of 24% w.b. and a PEG of 110 mm provide the optimal response in terms
of corn mold load reduction. The synergism accorded by tempering allowed for further reduction
in microbial load population on corn. This approach might be useful to combat heat tolerant
mycotoxin producing molds. The technology if optimized may help reduce corn quantity and
quality losses and prevent hazards related to molds.

45
Acknowledgement
This study was based on work supported in part by the United States Department of
Agriculture National Institute of Food and Agriculture Hatch Act Funding. The authors also wish
to acknowledge research support from the Arkansas Biosciences Institute and Arkansas Corn and
Grain Sorghum Research and Promotion Board.

46
References
AOAC. Official Methods of Analysis 997.02. (2002). Yeast and Mold Counts in Foods. AOAC.
Intl.
Bingol, G., Yang, J., Brandl, M.T., Pan, Z., Wang, H., & McHugh, T.H. (2011). Infrared
pasteurization of raw almonds. Journal of Food Engineering, 104(3), 387-393.
Bankole, S.A. (1996). Effect of ethylene oxide and methyl formate fumigation on seeds
mycoflora and germination of some stored oil seeds in Nigeria. Crop Res, 11(1), 224-
227.
“Design of Experiments.” JMP, www.jmp.com/en_ch/applications/design-of-
experiments.html#Custom-Designs.
Hamanaka, D., Dokan, S., Yasunaga, E., Kuroki, S., Uchino, T., & Akimoto, K. (2000). The
sterilization effects of infrared ray on the agricultural products spoilage microorganisms.
ASAE Annual International Meeting, Technical Papers: Engineering Solutions for a New
Century, 2(Pt 1), 971-979.
Hamanaka, D., Uchino, T., Furuse, N., Han, W., & Tanaka, S. (2006). Effect of wavelength of
infrared heaters on the inactivation of bacterial spores at various water activities.
International Journal of Food Microbiology, 108(2), 281-285.
Jun, S., & Irudayaraj, J., (2003). Selective far infrared heating system—Design and evaluation.
Drying Technology, 21(1), 51-67.
Kavita, W., & Reddy, M. U. (2000) Effect of chemicals on aflatoxin B1 production, germination
and viability in maize and groundnuts. Journal of Research ANGRAU, 28(1), 57-64.
Klein, J.D., & Lurie, S. (1991). Postharvest heat treatment and fruit quality. Postharvest News
and Information, 2(1), 15–19.
Krishnamurthy, K., Khurana, H.K., Soojin, J., Irudayaraj, J., & Demirci, A. (2008). Infrared
heating in food processing: an overview. Comprehensive Reviews in Food Science and
Food Safety, 7(1), 2-13.
Li, Y., Cao, C., Yu, Q., & Zhong, Q. (1998). Study on rough rice fissuring during intermittent
drying. Drying Technology, 17(9), 1779-1793.
Meenu, M., Guha P., & Mishra, S. (2017). Impact of infrared treatment on quality and fungal
decontamination of mung bean (Vigna radiata L.) inoculated with Aspergillus spp.
Journal of the Science of Food and Agriculture, 98(7), 2770-2776.
Nishiyama, Y., Cao, W., & Li, B. (2006). Grain intermittent drying characteristics analyzed by a
simplified model. Journal of Food Engineering, 76(3), 272-279.

47
Pan, Z. & Atungulu, G. G. (2010). Infrared heating for food and agricultural processing. London:
CRC Press.
Rosenthal, I., Rosen, B., & Bernstein, S. (1996). Surface pasteurization of cottage cheese.
Milchwissenschaft, 51(4), 198-201.
Sakai, N. & Hanzawa, T. (1994). Applications and advances in far-infrared heating in Japan.
Trends in Food Science & Technology, 5(11), 357-362.
Schmidt, M., Zannini, E., & Arendt, E.K. (2018a). Screening of post-harvest decontamination
methods for cereal grains and their impact on grain quality and technological
performance. European Food Research and Technology, 245(5), 1061–1074.
Schmidt, M., Zannini, E., & Arendt, E. K. (2018b). Recent advances in physical post-harvest
treatments for shelf-life extension of cereal crops. Foods (Basel, Switzerland), 7(4), 45.
Sorour, H. M. (2006) Effects of sterilization by using infrared radiation on microorganisms
growth on rice and wheat grain. Misr Journal of Agricultural Engineering, 23(3), 593-
610.
Staack, N., Ahrné, L., Borch, E., & Knorr, E. (2008). Effect on infrared heating on quality and
microbial decontamination in paprika powder. Journal of Food Engineering, 86(1), 17-
24.
Wilson, S., Atungulu, G., Couch, A., & Sadaka, S. (2015). Radiant heating and tempering
treatments for improving rate of moisture removal during drying of shelled corn. Applied
Engineering in Agriculture, 31(5), 799–808.
Wilson, S.A., Okeyo, A.A., Olatunde, G.A., & Atungulu, G.G. (2017). Radiant heat treatments
for corn drying and decontamination. Journal of Food Processing and Preservation,
41(5), e13193. doi.org/10.1111/jfpp.13193.

48
Chapter 4: Fungal community compositions of shelled corn after selective infrared heat
treatments revealed by Illumina high-throughput sequencing
Abstract
Fungi are associated with enormous diversity of habitats which include grains. Once occurring
on grains, the spores easily proliferate on high moisture content grains, increasing the risk of
toxin production, and potentially contaminate the grain thereby posing important risk to the
public. The objective of this study was to characterize effects of using selected peak wavelengths
of infrared (IR) heat emission, at various intensities regulated by the product-to-emitter-gap
(PEG) (110 mm, 275 mm and 440 mm) and for varied durations, followed by tempering on
inactivation responses of fungi that colonize corn kernels. Metagenomics techniques were used
to identify and quantify the magnitudes of surviving fungi following treatments at IR peak
wavelengths that fall in the mid and far IR heating region of the electromagnetic spectrum (3.2
μm, 4.5 μm and 5.8 μm). Internal transcribed spacer 2 (ITS 2) sequencing was used to
characterize the corn microbiome after IR treatments. After IR treatment, Ascomycota was the
most abundant phylum for non-tempered and tempered samples. Moisture content (MC) was the
most effective variable for reducing the mycotoxigenic fungi of Aspergillus and Penicillin. The
IR heating process shows potential benefits of fungal inactivation which may help the industry
prevent potential toxin development on corn.
Keywords: Selective infrared heating, selected peak wavelengths, fungi, product-to-emitter-gap
sizes, high-throughput sequencing

49
Introduction
Fungi growth in food systems is a concern all over the world, not only due to quality and
economic losses, but also because of the possibility of mycotoxins synthesis. Mycotoxigenic
fungi infecting agricultural crops will produce mycotoxins which are mainly carcinogenic
substances (Atungulu and Mohammadi-Shad, 2019). Mycotoxins in grains such as corn pose a
severe risk to animal and human health when consumed (Atungulu et al., 2018). Fungi growth
and mycotoxins production are more likely in warmer temperature, like U.S. further south
(Mohammadi-Shad and Atungulu, 2019). In U.S., high levels of mycotoxins contamination in
corn harvested in Mississippi was thought to be related to high temperature conditions
(Windham et al., 1999).
The major producers of mycotoxins include species of Aspergillus, Fusarium, and
Penicillium (Reddy et al., 2008). Corn grown in United States (U.S.) usually get contaminated
with aflatoxins, fumonisins, and deoxynivalenol (DON) (Marasas et al., 1981; Marín et al., 1998;
Abbas et al., 2002; Robens and Cardwell, 2003; Wu et al., 2011). Chauhan et al. (2016)
conducted a study on fungal infection and aflatoxin contamination in maize collected from
Gedeo zone in Ethiopia and found that Aspergillus species (75 %), Fusarium (11 %), Penicillium
(8 %) and Trichoderma (6 %) were the most abundant genera in the maize. Another study found
Aflatoxins which is produced by Aspergillus or Penicillium and fumonisins produced by
Fusarium in most locally grown maize in 18 African nations during 2007 and 2008 (Probsr et al.,
2014). Lane et al. (2018) also found that Fusarium was the most abundant genus after exploring
the fungal microbiome of corn during hermetic storage the United States and Kenya.
Several techniques have been applied to decontaminate food crops from fungi and
associated mycotoxins. Infrared (IR) heating has gained popularity over decades for its versatile

50
applications including baking, drying, thawing, blanching, and microbial decontamination (Pan
and Atungulu, 2010). IR heating leads to thermal denaturation of proteins and nucleic acids in
microorganisms and thereby inactivate the microbes (Ramaswamy et al., 2012). In 2014, IR
heating was used to decontaminate A. flavus on rice grains in a shorter heating duration than
convective methods (Wang et al., 2014). Wilson et al. (2017) achieved a 4.03 log (CFU/g) and
4.27 log (CFU/g) fungal load reduction in high MC corn (24% wet basis) after one-pass IR
heating plus tempering at 50°C for 4h and two passes IR hating plus tempering at 70°C for 2h,
respectively . Researches have shown that the total load of fungi decreased significantly by
exposing the corn samples to IR heating. However, there is limited information on diversity of
fungi that are susceptible to the processing (Wilson et al., 2016 & 2017). It was reported that the
degree of sensitivity varied among different isolates of fungi; meaning that some species may be
more resistant to inactivation and some may not (Pereira et al., 2013).
To evaluate efficiency of decontamination methods, there are several methods used to
analyze microbial communities. The conventional methods that have been used for years are
time consuming, labor intensive, and complex. Also, the traditional methods are not able to
identify all the fungi species present in a food system (Espy et al., 2006). The advanced
identification methods such as molecular techniques are able to identify different type of fungi.
The molecular methods identifies fungi based on ribosomal DNA (rDNA) sequences (Iwen et al.,
2002). The information obtained from DNA sequences is translated and analyzed into taxonomic
groups of fungi. The important molecular target for identification of fungal taxonomy has been
introduced as intervening internal transcribed spacer (ITS) regions (Iwen et al., 2002). Currently,
high-throughput sequencing and metagenomics studies have been used as a powerful tool to
study fungi communities in food (Ercolini, 2013). The Illumina MiSeq is a platform of high-

51
throughput sequencing that provides sequences information at greater depth compared to other
techniques. Illumina was recognized as a fully feasible and promising approach to characterize
soil fungal community and recover fungal richness (Schmidt et al., 2013). The Illumina Miseq
has the possibility of detecting dead fungi but due to the high temperature associated with IR and
tempering process it likely that the dead fungi cell was completely destroyed. By saying so,
identification of fungal sensitivity to selective IR-heating wavelength necessitates the use of
modern techniques such as Illumina MiSeq.
The objectives of the current study are 1) identification of how fungal communities
respond to IR heating; 2) the feasibility of IR heating to inactivate mycotoxigenic fungi, such as
Aspergillus.
Materials and methods
The Corn samples, infrared heating device, measurement of radiant energy transfer, and
experimental design that was used in this study is outlined in chapter 3 (pp.30 - pp.33).
Genomic DNA extraction
A 10 g sample of corn was mixed with 90 mL phosphate-buffered dilution water in a
sterile stomacher bag and masticated. The solution was centrifuged at 10,000 × g for 10 mins at
4C. After centrifuging the solution was thrown away leaving a pellet in the bottom of the tube.
Genomic DNA was extracted from the corn pellet using DNeasy Plant Pro kit (Geneaid, USA).

52
Polymerase Chain Reaction (PCR)
PCR is based on using the ability of DNA polymerase to synthesize new strand of DNA
complementary to the offered template strand (Maddocks and Jenkins, 2017). PCR reactions (25
µL) contained 2.5 µL of Buffer II, 0.1 µL of AccuPrime™ Taq DNA Polymerase High Fidelity
(Invitrogen, Carlsbad, CA, United States), 3 µL of DNA, and 1 μL of each dual-index primer
combination. Each primer (ITS1 and ITS2) consisted of the appropriate Illumina adapter
(AATGATACGGCGACCACCGAGATCTACAC for ITS1 and
CAAGCAGAAGACGGCATACGAGAT for ITS2), an 8-nt index sequence (each index being
different from each other), a 10-nt pad sequence (TGTGGTGGCC for ITS1 and ACTGCGTCAT
for ITS2), a 2-nt linker (GT for ITS1 and AT for ITS2) and the gene-specific primer
(CTTGGTCATTTAGAGGAAGTAA and GCTGCGTTCTTCATCGATGC for ITS1 and for
ITS2, respectively). The PCR was performed at 94°C for 2 min; 30 cycles of 94°C for 30 s, 55°C
for 30 s, and 68°C for 1 min; and a final extension at 72°C for 5min
Sequencing
The PCR products were normalized and pooled using the SequalPrep Normalization Plate
Kit (Applied Biosystems™, Waltham, MA, USA). After constructing the DNA library, the
Illumina Miseq at the Biomass Research Center (BIOR), University of Arkansas was used to
sequence the amplified ITS region using a Miseq v2 500 cycle kit (Illumina Inc., San Deigo, CA,
USA). A total of 1,328,549 reads were obtained after sequencing.

53
Bioinformatics
The data generated from Illumina MiSeq sequencing was analyzed for its fungal
biodiversity using PIPITS (Gweon et al., 2015). PIPITS is a user-friendly computational tool for
automated processing of large sequence data sets from quality filtering to generation of species
abundance table of fungal ITS sequences (Gweon et al., 2015). There are three elements of the
PIPITS pipeline, namely PIPITS PREP, which prepares raw reads for the extraction of ITS (ITS1
or ITS 2), PIPITS FUNITS, which extracts fungal ITS subregion from the reads, and PIPITS
PROCESS, which analyzes reads for the production of operational taxonomic unit (OTU) tables
(Gweon et al., 2015). The pipeline process is shown in Figure 1.
Fig. 1. Outline of PIPITS for Illumina Internal transcribed spacer sequences

54
Statistical analysis
Analysis of variance (ANOVA), RSM, and principle component analysis (PCA) were
performed with a statistical software (JMP version 14.0.0, SAS Institute) to determine significant
differences within and among samples. The RSM was used to describe the response-factor
relationship. Level of significance (α) was set at 5% for comparing means.
Results and discussion
Fungal community structure analysis after selective infrared (IR) treatments
The major phyla for IR treated samples without tempering (non-tempered) are shown in
Figure 2. The most abundant phylum for the non-treated corn samples (control) with MC of
16%, 20%, and 24% w.b. was Ascomycota followed by unclassified and then Basidiomycota,
respectively (Figure 2). The most abundant phylum for non-tempered samples was Ascomycota
with 95.6% of the sequences on average followed by Basidiomycota which represented 0.6%
(Figure 2). There was a percentage of 3.8 as a not classified at the phylum level. For IR treated
samples followed by a tempering step (Figure 3), the most abundant phylum was Ascomycota
with 93.2% of the sequences on average followed by not classified ones (5.9%), and then
Basidiomycota (0.84%). Similar results were reported by Abe et al. (2015), where fungi isolated
from maize (Zea mays L.) grains were explored. Abe et al. (2015) found that 91.31% of the
isolates were Ascomycota, Zygomycota (4.34%) and Basidiomycota (4.34%).

55
Fig. 2. Percentages of the major fungal phyla on corn after selective infrared heat treatments; C16,
C20, and C24 signifies the relative abundance of non-treated (control) corn samples with moisture
content of 16%, 20%, and 24% wet basis, respectively.
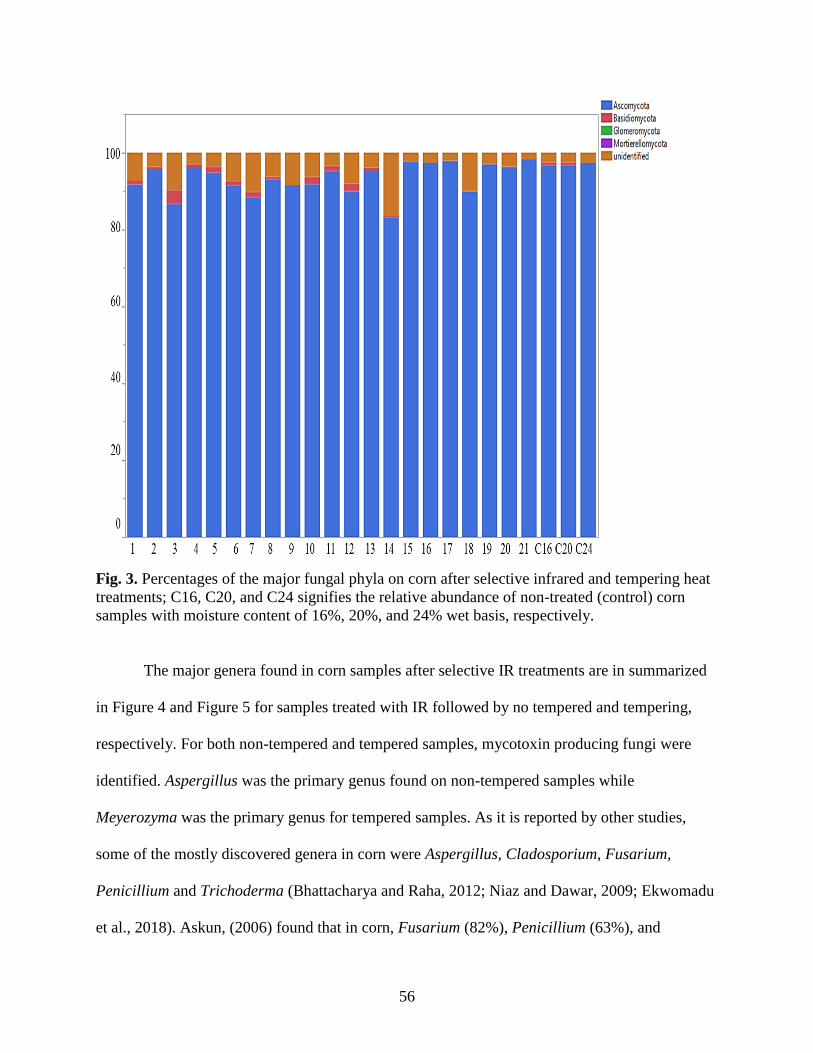
56
Fig. 3. Percentages of the major fungal phyla on corn after selective infrared and tempering heat
treatments; C16, C20, and C24 signifies the relative abundance of non-treated (control) corn
samples with moisture content of 16%, 20%, and 24% wet basis, respectively.
The major genera found in corn samples after selective IR treatments are in summarized
in Figure 4 and Figure 5 for samples treated with IR followed by no tempered and tempering,
respectively. For both non-tempered and tempered samples, mycotoxin producing fungi were
identified. Aspergillus was the primary genus found on non-tempered samples while
Meyerozyma was the primary genus for tempered samples. As it is reported by other studies,
some of the mostly discovered genera in corn were Aspergillus, Cladosporium, Fusarium,
Penicillium and Trichoderma (Bhattacharya and Raha, 2012; Niaz and Dawar, 2009; Ekwomadu
et al., 2018). Askun, (2006) found that in corn, Fusarium (82%), Penicillium (63%), and

57
Aspergillus species (33%) were most predominant compared to the other genera. Askun, (2006)
also discovered that Aspergillus (19%) was one of the most common genera isolated from
disinfected and non-disinfected corn kernels.
Fig. 4. Percentages of the major fungal genera on corn after selective infrared heat treatments.
C16 signifies the relative abundance of non-treated (control) corn samples with moisture content
of 16% wet basis; C20 signifies the relative abundance of non-treated (control) corn samples
with moisture content of 20% wet basis; C24 signifies the relative abundance of non-treated
(control) corn samples with moisture content of 24% wet basis.

58
Fig. 5. Percentages of the major fungal genera on corn after selective infrared and tempering heat
treatments; C16, C20, and C24 signifies the relative abundance of non-treated (control) corn
samples with moisture content of 16%, 20%, and 24% wet basis, respectively.
Niaz and Dawar (2009) reported that corn in Pakistan was contaminated with a variety of
fungi; Aspergillus flavus, A. niger, A. wentii and Penicillium spp were the most predominant
ones found in 70% of the examined corn samples (Niaz and Dawar, 2009). In some other studies,
different species of Fusarium spp (Desjardins et al., 2000; Macdonald et al., 2005). Also, it was
confirmed by Ghiasian at al. (2004) that corn was infected mainly by Fusarium spp (38.5%)
followed by Aspergillus (8.7%), Rhizopus (4.8%), Penicillium (4.5%), Mucor (1.1%), and other
fungal genera (Ghiasian at al., 2004). Mycotoxigenic fungi prevalence on corn is a global
problem.
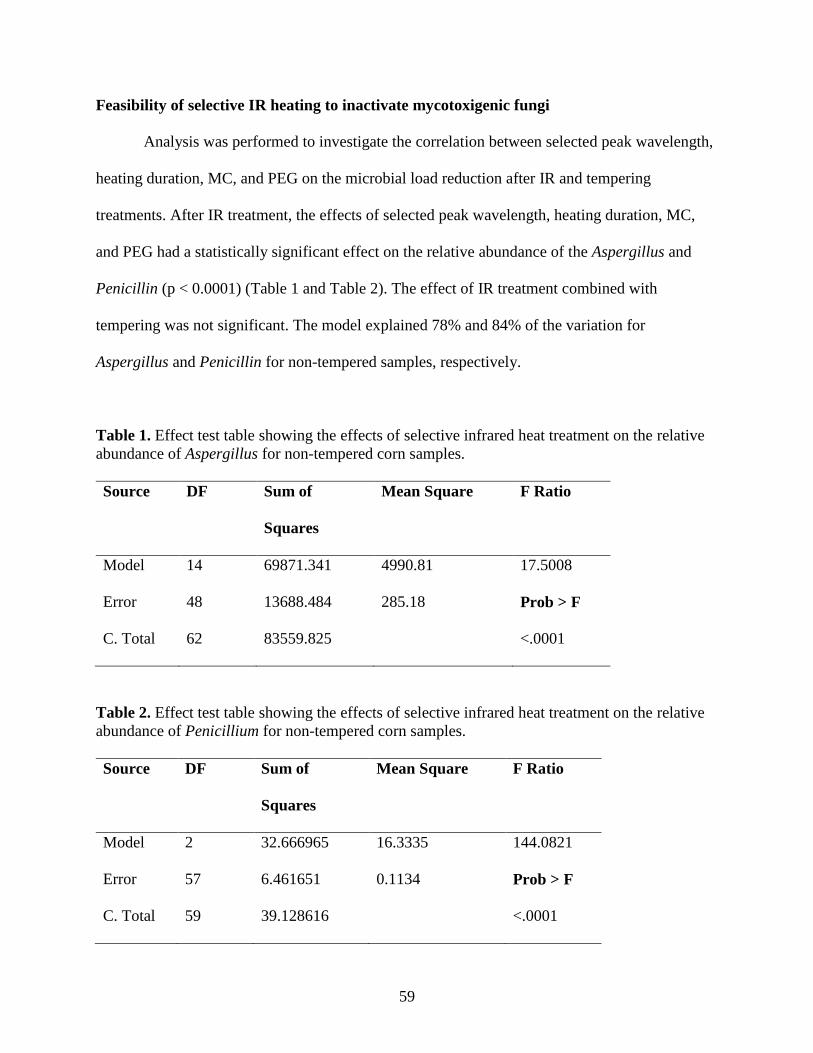
59
Feasibility of selective IR heating to inactivate mycotoxigenic fungi
Analysis was performed to investigate the correlation between selected peak wavelength,
heating duration, MC, and PEG on the microbial load reduction after IR and tempering
treatments. After IR treatment, the effects of selected peak wavelength, heating duration, MC,
and PEG had a statistically significant effect on the relative abundance of the Aspergillus and
Penicillin (p < 0.0001) (Table 1 and Table 2). The effect of IR treatment combined with
tempering was not significant. The model explained 78% and 84% of the variation for
Aspergillus and Penicillin for non-tempered samples, respectively.
Table 1. Effect test table showing the effects of selective infrared heat treatment on the relative
abundance of Aspergillus for non-tempered corn samples.
Source DF Sum of
Squares
Mean Square F Ratio
Model 14 69871.341 4990.81 17.5008
Error 48 13688.484 285.18 Prob > F
C. Total 62 83559.825 <.0001
Table 2. Effect test table showing the effects of selective infrared heat treatment on the relative
abundance of Penicillium for non-tempered corn samples.
Source DF Sum of
Squares
Mean Square F Ratio
Model 2 32.666965 16.3335 144.0821
Error 57 6.461651 0.1134 Prob > F
C. Total 59 39.128616 <.0001
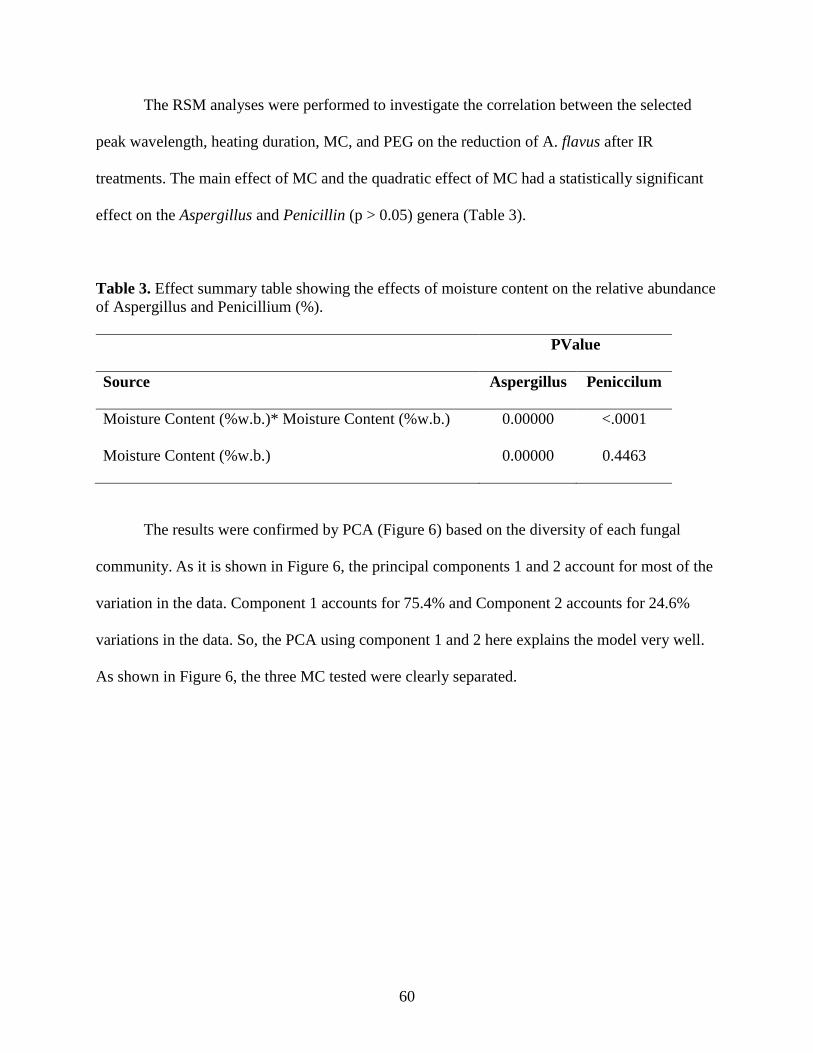
60
The RSM analyses were performed to investigate the correlation between the selected
peak wavelength, heating duration, MC, and PEG on the reduction of A. flavus after IR
treatments. The main effect of MC and the quadratic effect of MC had a statistically significant
effect on the Aspergillus and Penicillin (p > 0.05) genera (Table 3).
Table 3. Effect summary table showing the effects of moisture content on the relative abundance
of Aspergillus and Penicillium (%).
PValue
Source Aspergillus Peniccilum
Moisture Content (%w.b.)* Moisture Content (%w.b.) 0.00000 <.0001
Moisture Content (%w.b.) 0.00000 0.4463
The results were confirmed by PCA (Figure 6) based on the diversity of each fungal
community. As it is shown in Figure 6, the principal components 1 and 2 account for most of the
variation in the data. Component 1 accounts for 75.4% and Component 2 accounts for 24.6%
variations in the data. So, the PCA using component 1 and 2 here explains the model very well.
As shown in Figure 6, the three MC tested were clearly separated.
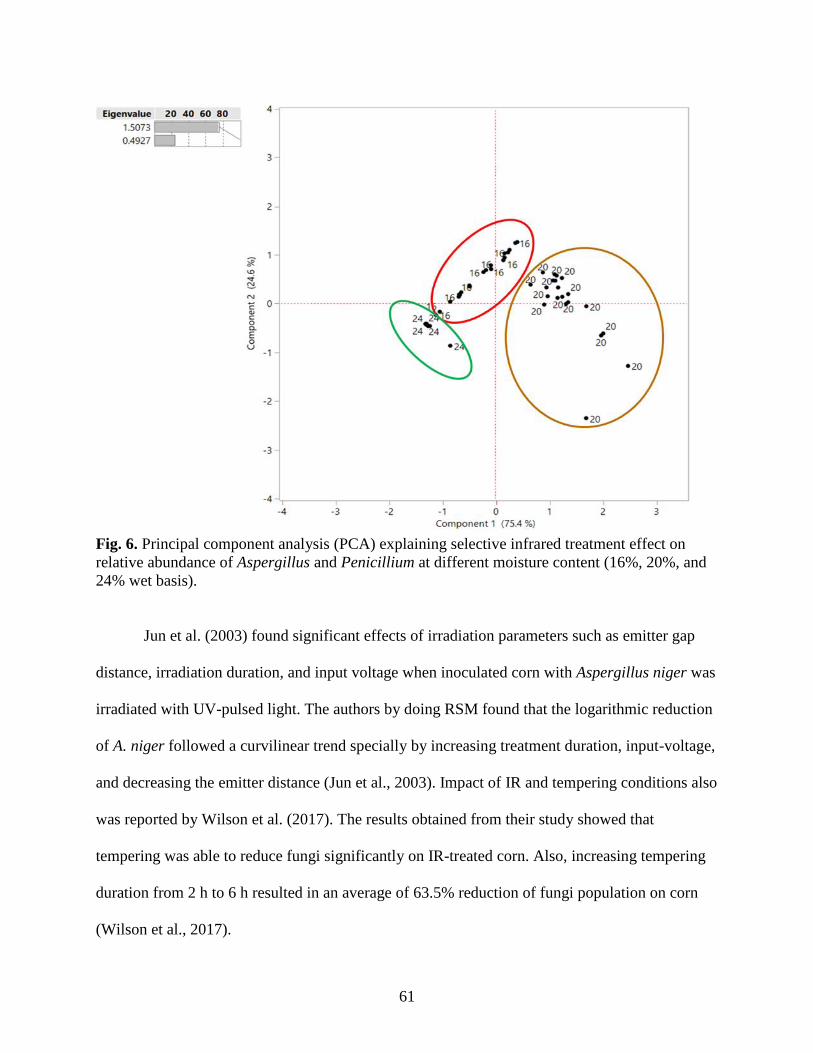
61
Fig. 6. Principal component analysis (PCA) explaining selective infrared treatment effect on
relative abundance of Aspergillus and Penicillium at different moisture content (16%, 20%, and
24% wet basis).
Jun et al. (2003) found significant effects of irradiation parameters such as emitter gap
distance, irradiation duration, and input voltage when inoculated corn with Aspergillus niger was
irradiated with UV-pulsed light. The authors by doing RSM found that the logarithmic reduction
of A. niger followed a curvilinear trend specially by increasing treatment duration, input-voltage,
and decreasing the emitter distance (Jun et al., 2003). Impact of IR and tempering conditions also
was reported by Wilson et al. (2017). The results obtained from their study showed that
tempering was able to reduce fungi significantly on IR-treated corn. Also, increasing tempering
duration from 2 h to 6 h resulted in an average of 63.5% reduction of fungi population on corn
(Wilson et al., 2017).
62
Conclusion
This study examined the use of IR treatments followed by tempering to decontaminate
fungal community on the grain. The findings showed that after treating corn samples at different
selective wavelengths, heating duration, PEG and MC, Ascomycota was the most dominant
phylum for non-tempered and tempered treatments. Some treatment combinations were able to
reduce the abundance of mycotoxin producing fungi such as Aspergillus and Penicillium. For
example, a sample with MC of 16% w.b. that was treated at PEG of 275 mm and wavelength of
4.5µm for 60 s was able to reduce the relative abundance of Aspergillus from 72.8% to 42.5%.
After the IR treatments it was noted that the fungal community was separated by the different
corn MCs. Selective IR treatments showed promise as an approach to improve inactivation of
fungi such as of Aspergillus genus which are known to produce toxins on grains.
Acknowledgement
This study was based on work supported in part by the United States Department of
Agriculture National Institute of Food and Agriculture Hatch Act Funding. The authors also wish
to acknowledge research fund support from the Arkansas Biosciences Institute and Arkansas
Corn and Grain Sorghum Research and Promotion Board.
63
References
Abbas, H. K., Williams, W. P., Windham, G. L., Pringle, H. C., Xie, W., & Shier, W. T. (2002).
Aflatoxin and fumonisin contamination of commercial corn (Zea mays) hybrids in
Mississippi. Journal of Agricultural and Food Chemistry, 50(18), 5246-5254.
Abe, C. A. L., Faria, C. B., de Castro, F. F., de Souza, S. R., dos Santos, F. C., da Silva, C. N., et
al. (2015). Fungi isolated from Maize (Zea mays L.) grains and production of associated
enzyme activities. Int. J. Mol. Sci. 16, 15328–15346. doi: 10.3390/ijms160715328 and
Wheat. Jouranl of AOAC International, 88(6): 1733-1740.
Askun, T., (2006). Investigation of Fungal Species Diversity of Maize Kernels. Journal of
Biological Sciences, 6: 275-281.
Atungulu, G. G., Mohammadi-Shad, Z., & Wilson, S. (2018). Mycotoxin Issues in Pet Food. In
Food and Feed Safety Systems and Analysis (pp. 25-44). Academic Press.
Atungulu, G., & Mohammadi-Shad, Z. (2019). Reference on Mycotoxins Occurrence,
Prevalence, and Risk Assessment in Food Systems. In Novel Technologies and Systems
for Food Preservation (pp. 294-343). IGI Global.
Bhattacharya, K. & Raha, S. (2002). Deteriorative changes of maize, groundnut and soybean
seeds by fungi in storage. Mycopathologia, 155, 135–141.
Chauhan, N. M., Washe, A. P., & Minota, T. (2016). Fungal infection and aflatoxin
contamination in maize collected from Gedeo zone, Ethiopia. SpringerPlus, 5(1), 753.
Desjardins, A.E., Manandhar, G., Plattner, R.D., Maragos, C.M., Shrestha, K.C., & McCormick,
S.P. (2000). Occurrence of Fusarium species and mycotoxins in nepalese maize and
wheat and the effect of traditional processing methods on mycotoxin levels. Journal of
Agricultural and Food Chemistry, 48(4), 1377-1383.
Ekwomadu, T. I., Gopane, R. E., & Mwanza, M. (2018). Occurrence of filamentous fungi in
maize destined for human consumption in South Africa. Food science & nutrition, 6(4),
884–890. doi:10.1002/fsn3.561.
Ercolini, D. (2013). High-throughput sequencing and metagenomics: moving forward in the
culture-independent analysis of food microbial ecology. Appl. Environ. Microbiol.,
79(10), 3148-3155.
Ghiasian, S. A., Kord-Bacheh, P., Rezayat, S. M., Maghsood, A. H., & Taherkhani, H. (2004).
Mycoflora of Iranian maize harvested in the main production areas in 2000.
Mycopathologia, 158(1), 113-121.
Gweon, H. S., Oliver, A., Taylor, J., Booth, T., Gibbs, M., Read, D. S. & Schonrogge, K. (2015).
PIPITS: an automated pipeline for analyses of fungal internal transcribed spacer

64
sequences from the Illumina sequencing platform. Methods in ecology and evolution,
6(8), 973–980.
Iwen, P. C., Hinrichs, S. H., & Rupp, M. E. (2002). Utilization of the internal transcribed spacer
regions as molecular targets to detect and identify human fungal pathogens. Medical
mycology, 40(1), 87-109.
Jun, S., Irudayaraj, J., Demirci, A. & Geiser, D. (2003) Pulsed UV‐light treatment of corn meal
for inactivation of Aspergillus niger spores. Int J Food Sci Technol 38, 883– 888.
Lane, B., Sharma, S., Niu, C., Maina, A. W., Wagacha, J. M., Bluhm, B. H., & Woloshuk, C. P.
(2018). Changes in the Fungal Microbiome of Maize during Hermetic Storage in the
United States and Kenya. Frontiers in Microbiology, 9, 2336.
Macdonald, S., Anderson, S., Brereton, P.F., Wood, R., & Damant, A.P. (2005). Determination
of zearalenone in barley, maize and wheat flour, polenta, and maize-based baby food by
immunoaffinity column cleanup with liquid chromatography: interlaboratory study.
Journal of AOAC International, 88(6), 1733-1740.
Maddocks, S. & Jenkins, R. (2017). Understanding PCR: A Practical Bench-Top Guide.
Elsevier Academic Press.
Marasas, W. F. O., Wehner, F. C., Van Rensburg, S. J., & Van Schalkwyk, D. J. (1981).
Mycoflora of corn produced in human esophageal cancer areas in Transkei, southern
Africa. Phytopathology, 71(8), 792-796.
Marín, S., Sanchis, V., Sáenz, R., Ramos, A. J., Vinas, I., & Magan, N. (1998). Ecological
determinants for germination and growth of some Aspergillus and Penicillium spp. from
maize grain. Journal of Applied Microbiology, 84(1), 25-36.
Mohammadi Shad, Z., & Atungulu, G. G. (2019). Post-harvest kernel discoloration and fungi
activity in long-grain hybrid, pureline and medium-grain rice cultivars as influenced by
storage environment and antifungal treatment. Journal of Stored Products Research, 81,
91-99.
Mohammadi-Shad, Z., & Atungulu, G. G. (2017). Evaluation of Feeds for Occurrence of
Aflatoxin and Safety. In 2017 ASABE Annual International Meeting (p. 1). American
Society of Agricultural and Biological Engineers.
Niaz, I. & Dawar, S. Detection of seed borne mycoflora in maize (Zea mays L.). Pak. J. Bot.
2009, 41, 443–45.
Pan, Z., & Atungulu, G. G. (2010). Infrared heating for food and agricultural processing. CRC
Press.
Pereira, V. J., Marques, R., Marques, M., Benoliel, M. J., & Crespo, M. B. (2013). Free chlorine
inactivation of fungi in drinking water sources. Water research, 47(2), 517-523.
65
Probst, C., Bandyopadhyay, R., & Cotty, P.J. (2014), Diversity of aflatoxin-producing fungi and
their impact on food safety in sub-Saharan Africa, International Journal of Food
Microbiology, 17, 113-122.
Ramaswamy, R., Krishnamurthy, K., & Jun, S. (2012). Microbial decontamination of food by
infrared (IR) heating. In Microbial Decontamination in the Food Industry (pp. 450-471).
Woodhead Publishing.
Reddy, K. R. N., Reddy, C. S., Abbas, H. K., Abel, C. A., & Muralidharan, K. (2008).
Mycotoxigenic fungi, mycotoxins, and management of rice grains. Toxin reviews, 27(3-
4), 287-317.
Robens, J., & Cardwell, K. (2003). The costs of mycotoxin management to the USA:
management of aflatoxins in the United States. Journal of Toxicology: Toxin Reviews,
22(2-3), 139-152.
Schmidt, P. A., Bálint, M., Greshake, B., Bandow, C., Römbke, J., & Schmitt, I. (2013). Illumina
metabarcoding of a soil fungal community. Soil Biology and Biochemistry, 65, 128-132.
Wilson, S. (2016). Development of Infrared Heating Technology for Corn Drying and
Decontamination to Maintain Quality and Prevent Mycotoxins.
Wilson, S. A., Atungulu, G. G., & Olatunde, G. (2016). Drying and decontamination of corn
using a pilot-scale continuous-flow radiant heating system. In 2016 ASABE Annual
International Meeting (p. 1). American Society of Agricultural and Biological Engineers.
Wilson, S. A., Atungulu, G. G., & Olatunde, G. (2017). Quality, Decontamination, and Energy
Use Considerations during Radiant‐Heat and Tempering Treatments of Shelled Corn.
Cereal chemistry, 94(4), 705-711.
Windham, G. L., Williams, W. P., & Davis, F. M. (1999). Effects of the southwestern corn borer
on Aspergillus flavus kernel infection and aflatoxin accumulation in maize hybrids. Plant
disease, 83(6), 535-540.
Wu, F., Bhatnagar, D., Bui-Klimke, T., Carbone, I., Hellmich, R., Munkvold, G., & Takle, E.
(2011). Climate change impacts on mycotoxin risks in US maize. World Mycotoxin
Journal, 4(1), 79-93.

66
Chapter 5: Impact of selective infrared wavelengths on fungal decontamination of
shelled corn inoculated with Aspergillus flavus
Abstract
Selective infrared (IR) heating was explored as technique for decontaminating Aspergillus flavus
(A. flavus) mold spores on shelled corn. The objective of this study was to determine the suitable
combinations of IR heating duration, intensity, wavelengths, and moisture content (MC),
followed by tempering treatments to maximize decontamination of A. flavus mold spores. Corn
samples were inoculated with spore suspension of A. flavus and incubated to allow microbial
attachment on the kernel. Corn samples were then heated using IR energy then tempered at 70ºC
for 4 h. Treatments at wavelength of 3.2 µm, product-to-emitter-gap sizes (PEG) of 110 mm and
corn MC of 24% wet basis (w.b.) for non-tempered and tempered samples resulted in the greatest
A. flavus load reduction of 4 Log CFU/g. The higher the corn MC, IR intensity and heating
duration the less fungal regrowth was observed after IR and tempering treatments. From the
results of the present study, IR treatments could improve corn quality and safety, thereby
improving returns to producers and processors.
Keywords: Selective infrared heating, selected peak wavelengths, fungi, product-to-emitter-gap
sizes, Aspergillus flavus

67
Introduction
Corn production plays a major role in the U.S. economy (Prasad et al., 2018). With
96,000,000 acres (39,000,000 ha) of land reserved for maize production; the US is the world's
largest maize producer. The United States grew more than 14.6 billion bushels (385 million
metric tons) of maize in the 2016/2017 crop marketing year and approximately 17% of
production has been exported to over 80 countries (U.S. GRAINS COUNCIL, 2019). Corn is
also processed into different food and industrial products including starch, sweeteners, corn oil,
beverage and industrial alcohol, and fuel ethanol (USDA, 2018).
Recently, priority has been given to food storage and preservation to enhance global food
security. During storage, qualitative and quantitative losses are mainly caused by microbial
infection and infestation of pests (Pande et al., 2012). Contamination of grain with mold spores
has always been a challenging issue in the food industry. Aspergillus flavus, Fusarium spp., and
Penicillium spp. are common pathogenic fungi associated with stored corn kernel (Pechanova
and Pechan, 2015). A. flavus is known to produce aflatoxin and have received the most attention
due to potent carcinogenic and acute toxicological effects in humans (Williams et al., 2004;
Khlangwiset et al., 2011; Faulkner, 2014). If aflatoxin is consumed by humans and animals, it
can lead to suppressed immune response, malnutrition, bile duct proliferation, centrilobular
necrosis, liver infiltration, hepatic lesions, impairment of growth, feed refusal, emesis and even
hepatomas (Williams et al., 2004; Khlangwiset et al., 2011; Bbosa et al., 2013; Hussein and
Brasel, 2001).
Some post-harvest strategies for prevention of harmful fungi include improved drying
methods, good storage conditions, irradiation, the use of natural and chemical agents, limiting
physical damage of grains during harvesting, and avoiding insect infestation (Mohapatra et al.,

68
2017; Ukwuru et al., 2018). For safe storage of grains, chemical treatments such as fumigation
with ethylene oxide, propylene oxide and ethyl and methyl formate are being used. The
deficiencies with these methods include high costs, the development of resistant strains and the
problem of chemical residues, which can affect humans (Gulati and Mathur, 1995). Thus,
researchers are paying considerable attention to alternative treatments for safe storage of grains.
IR radiation has also been used as a non‐chemical method for decontamination of food
grains. IR is a part of the electromagnetic spectrum and can be classified as Near-infrared (NIR),
mid-infrared (MIR), and far-infrared (FIR) and ranges 0.75 to 1.4, 1.4 to 3, and 3 to 1000 μm,
respectively (Krishnamurthy et al., 2008). Compared to conventional methods, IR treatment has
greater advantages such as high degree of process control parameters, improved energy
efficiency and uniform product temperature, resulting in better‐quality finished products
(Krishnamurthy et al., 2008; Rastogi, 2012).
IR treatment was used to inactivate pathogenic fungi A. niger in corn meal, resulting in a
reduction of 2.3 log10 CFU/mL in 6 minutes (Jun and Irudayaraj, 2003; Krishnamurthy et al.,
2008). Researchers also investigated the decontamination of foods such as strawberry, wheat,
corn flour, grains, cottage cheese using IR radiation (Rosenthal et al., 1996; Jun and Irudayaraj,
2003; Hamanaka et al., 2006; Rastogi, 2012; Wilson et al., 2017). Based on these facts, the
current work focuses on exploring the effect of selective IR treatment on decontamination of
corn inoculated with A. flavus spores.

69
Materials and methods
The Corn samples, infrared heating device, measurement of radiant energy transfer, and
experimental design that was used in this study is outlined in chapter 3 (pp.30 - pp.33).
Inoculation of shelled corn
A. flavus strain ATCC 28539TM (American Type Culture Collection, Manassas, VA)
were procured in vials. The contents of each vial were mixed with 1.0 mL of sterile water; then
transferred to a test tube containing 6 mL of sterile water. A. flavus was allowed to rehydrate for
3 h and cultured on potato dextrose agar (PDA). After 7 days of incubation at 25oC, spores were
detached by flooding the culture plates with 0.03% Tween 80. Initial volume with detached
spores was designated the original inoculum concentration. Samples were inoculated with the
original inoculum of A. flavus spore suspension in a sterilized Erlenmeyer flask. The flasks were
then covered with aluminum foil and kept in an incubator for 5 days at 35oC. To achieve uniform
fungal attachment, the flask containing corn kernels were manually shook every 12 h.
Aspergillus flavus enumeration
Rose Bengal Agar (RBA) supplemented with dichloran and a stock solution of
streptomycin and chlortetracycline plates were used to enumerate A. flavus counts. RBA is a
selective medium used to detect and enumerate yeasts and molds in food samples. After medium
is cooled, 0.1 mL aliquots of sample solution were spread on the Petri plates using glass hockey
sticks. The RBA plates were incubated (Thelco Model 4, Precision Scientific Instruments, Inc.,
Chicago, IL) at 25°C for 120 h before counting. After incubation, the colony forming units (CFU)
on each plate were counted.

70
Fungal regrowth
To examine the potential for mold regrowth after IR treatments, treated corn was placed
in favorable conditions for mold growth (33oC, and 90% RH). This regrowth environment was
created using saturated Potassium chloride (KCl) solution. Treated corn was placed in a cheese
cloth then suspended in a jar above a salt solution of 80 g KCl and 100 mL H2O. Corn samples
were incubated at 33oC for 5 days.
Statistical analysis
Analysis of variance (ANOVA) and RSM were performed with a statistical software
(JMP version 14.0.0, SAS Institute) to determine significant differences within and among
samples. The RSM was used to describe the response-factor relationship. All tests were
considered to be significant when p < 0.05.
Results and discussion
Implications of selective infrared heating and tempering treatments on Aspergillus flavus
The least square mean of the A. flavus concentration of control samples were 5.0 ± 0.5,
5.2 ± 0.3, 5.1 ± 0.6 Log CFU/g for corn with initial MC of 16%, 20%, and 24% w.b.,
respectively. The effect of wavelengths, treatment durations, IR intensities, and corn MC on
inactivation of A. flavus for non-tempered and tempered corn samples are presented in Figure 1
and Figure 2. Treatments at higher heating duration, lower PEG and lower wavelength lead to
greater reduction of A. flavus spores (Figure 1). Similar trends were observed for tempered
samples. When the tempering step was added, A. flavus concentration was < 2.5 Log CFU/g for
all treatments. Hamanaka, et al. (2010) suggest that the decontamination provided by IR

71
treatments may be caused by the denaturation of essential proteins and damage to nucleic acids,
cell walls, and cell membranes of fungi.
As the corn MC level increased, the A. flavus concentration decreased (Figure 2).
Research has shown that the thermal destruction of fungal colonies provided by IR treatments is
greater in agricultural commodities with high MCs (>22%) than in those with lower MCs
(Sandeep, 2011; McCann et al., 2009). McCann et al. (2009) and Staack et al. (2008) also found
that high water activity can substantially enhance the decontamination of spores after heat
treatments.
Fig. 1. Contour plots of Aspergillus flavus concentration (log CFU/g) as influenced by the
interaction between heating duration (s), wavelength (μm) and product-to-emitter gap size (mm)
for non-tempered (a) and tempered treatments (b), respectively; CFU means colony forming
units; λ signifies wavelength in µm.

72
Fig. 2. Contour plots of Aspergillus flavus concentration (log CFU/g) as influenced by the
interaction between heating duration (s), wavelength (μm) and corn moisture content (% w.b.)
for non-tempered (a) and tempered treatments (b), respectively; CFU means colony forming
units; λ signifies wavelength in µm.
Generalized regression analyses were performed to investigate the correlation between
the selected peak wavelength, heating duration, MC, and PEG on the reduction of A. flavus after
IR and tempering treatments. After IR treatment, the effects of selected peak wavelength, heating
duration, MC, and PEG had a statistically significant effect on the A. flavus concentration (p <
0.05). The model explained 78 % of the variation for non-tempered samples. After tempering
treatments, the A. flavus concentration reduced significantly compared to the control but no
statistical difference was observed between the treatment combinations (p > 0.05).

73
Table 1 shows the effect summary table for the A. flavus concentration response for non-
tempered samples. The effect summary table for the A. flavus response indicates high statistical
significance (p<0.05). The supplied wavelength (p<0.0001), PEG (p<0.0001) and corn MC
(p<0.0001) significantly impacted the A. flavus concentration as indicated by the effect test
(Table 1). There was a statistically significant interaction between the wavelength and the PEG
(p = 0.0008). There was also a quadratic statistically significant effect between MC (p<0.0001)
for non-tempered treatments.
Table 1. Effect summary table showing the effects of moisture content, wavelength and product-
to-emitter gap on Aspergillus flavus concentration (Log (CFU/g-grain)
Term Prob >
ChiSquare
Moisture Content (% w.b.)(16,24) <.0001*
Moisture Content (% w.b.)*Moisture Content (% w.b.) <.0001*
Product-to-emitter gap (mm)(110,440) <.0001*
Product-to-emitter gap (mm)*Wavelength (μm) 0.0008*
Wavelength (μm)(3.2,5.8) <.0001*
Optimization of Aspergillus flavus load reduction
The factors in this experiment have combinatorial nature because within each factor there
are different levels. Therefore, the process must be optimized to determine the best combinations
of wavelength, MC, heating duration, and product-to-emitter gap size needed to achieve the
greatest responses in terms of lowest mold load. According to the prediction profiles, it was
determined that minimum levels of microbial load could be obtained at factor settings shown in
Figure 3 for IR treatments. A wavelength of 3.2 μm, PEG of 110 cm and MC of 24% w.b. are

74
preferred for optimum inactivation of mold load on corn. Figure 3 also provided a desirability of
0.90 which implies that approximately 90% of the goals to minimize corn mold count were
achieved.
Fig. 3. Prediction profile for Aspergillus flavus concentration (Log (CFU/g-grain)) responses
with parameter settings product-to-emitter gap size (mm), wavelength (µm) and corn moisture
content (% w.b.) for non-tempered treatments.
Effect of selective infrared heating and tempering treatments on the regrowth of
Aspergillus flavus spores
The implications of increasing IR treatment duration and adding a tempering step on A.
flavus concentration after being subjected to conditions favorable for regrowth for non-tempered
(a) and tempered (b) corn samples can be seen in Figure 4. The concentration of A. flavus
decreased with increasing doses of IR treatment. Decreasing IR wavelength and increasing
treatment duration supplied for both the tempered and non-tempered corn samples resulted in
statistically significant decreases in A. flavus concentration as indicated by the effect test (Figure

75
4). It was noted that at higher corn MC there was an increase in A. flavus regrowth. Also, as the
heating duration increased, the A. flavus count decreased. There was an increase in the A. flavus
concentration after the regrowth for the non-tempered treatments.
The decontamination is further improved when a tempering step is added as the high RH
associated with the step contributes to increased decontamination. Although, there was apparent
decontamination of A. flavus mold spores, there was apparent mold regrowth at treatments with
the lower IR intensity and higher MC. This is probably due to the survival of dormant mold
spores on the corn after IR and tempering treatments. When placed in regrowth conditions, these
dormant mold spores begin to germinate again. This is further corroborated by Dettori et al.
(1996) who found that hot water dips at 50-53°C was proven to be ineffective in killing dormant
spores. However, the hot water treatments did cause a delay in conidia germination, growth and
sporulation.
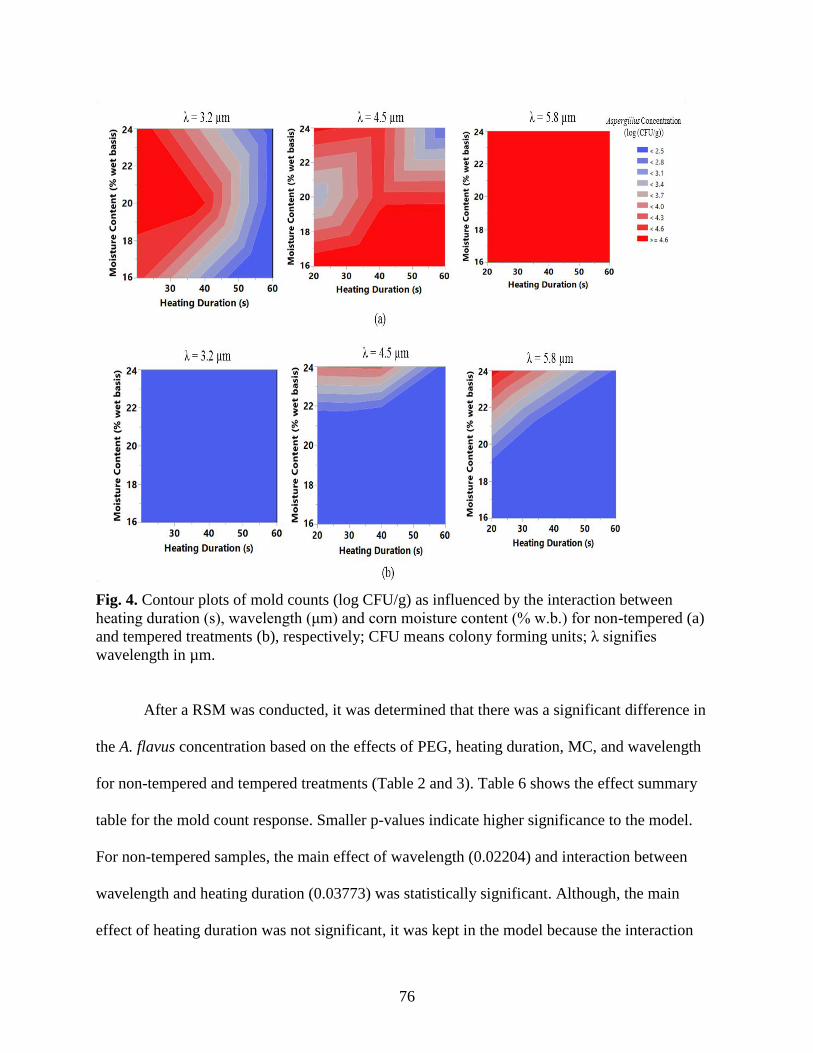
76
Fig. 4. Contour plots of mold counts (log CFU/g) as influenced by the interaction between
heating duration (s), wavelength (μm) and corn moisture content (% w.b.) for non-tempered (a)
and tempered treatments (b), respectively; CFU means colony forming units; λ signifies
wavelength in µm.
After a RSM was conducted, it was determined that there was a significant difference in
the A. flavus concentration based on the effects of PEG, heating duration, MC, and wavelength
for non-tempered and tempered treatments (Table 2 and 3). Table 6 shows the effect summary
table for the mold count response. Smaller p-values indicate higher significance to the model.
For non-tempered samples, the main effect of wavelength (0.02204) and interaction between
wavelength and heating duration (0.03773) was statistically significant. Although, the main
effect of heating duration was not significant, it was kept in the model because the interaction

77
with wavelength was significant. For tempered samples only, the main and quadratic effect of
moisture content was significant (Table 4).
Table 2. Effect test table showing the effects of selective infrared heat treatment on the
Aspergillus flavus for non-tempered samples.
Source DF Sum of
Squares
Mean
Square F Ratio Prob > F
Model 2 13.302130 6.65107 8.5425 0.0025*
Error 18 14.014467 0.77858
C. Total 20 27.316597
Table 3. Effect test table showing the effects of selective infrared heat treatment on the
Aspergillus flavus for tempered samples.
Source DF Sum of
Squares
Mean
Square F Ratio Prob > F
Model 3 14.090253 4.69675 5.8709 0.0061*
Error 17 13.600151 0.80001
C. Total 20 27.316597

78
Table 4. Effect summary table showing the effects of wavelength, heating duration and moisture
content on the Aspergillus flavus concentration (Log (CFU/g-grain).
Source
P Values
Non-Tempered Tempered
Wavelength (μm)(3.2,5.8) 0.02204 > 0.05
Wavelength (μm)*Heating Duration (s) 0.03773 > 0.05
Heating Duration (s)(20,60) 0.08001 > 0.05
Moisture Content (% w.b.)(16,24) > 0.05 0.00428
Moisture Content (% w.b.)*Moisture Content (% w.b.) > 0.05 0.02088
Conclusion
This study examined the use of IR treatments followed by tempering to decontaminate
corn and limit the regeneration of A. flavus spores on the grain. The A. flavus concentration of
the control sample was significantly higher than the A. flavus concentration of samples treated
with selective IR. It was also noted that increasing IR intensity and treatment durations supplied
to the corn resulted in decreasing A. flavus mold concentrations. The optimal condition for
reduction in A. flavus concentration was at wavelength of 3.2 µm (intensity of 15.71 kW/m2),
corn MC of 24% w.b. and PEG of 110 mm. The addition of a tempering step resulted in a
significant reduction in A. flavus concentration. Corn with lower MC showed less potential for A.
flavus regrowth after 5 days of incubation in favorable conditions for mold growth (33o C, and
90% RH). The treatments studied provide an avenue for implementing a non-chemical approach
to corn decontamination. If optimized, the technology can help prevent mold-related hazards and
improve corn quality.

79
Acknowledgement
This study was based on work supported in part by the United States Department of
Agriculture National Institute of Food and Agriculture Hatch Act Funding. The authors also wish
to acknowledge research fund support from the Arkansas Biosciences Institute and Arkansas
Corn and Grain Sorghum Research and Promotion Board.

80
References
Bbosa G. S., Kitya D., Lubega A., Ogwal-Okeng J., Anokbonggo W. W. & Kyegombe D. B.
(2013). Review of the biological and health effects of aflatoxins on body organs and body
systems. In M. Razzaghi-Abyaneh (Ed.), Aflatoxins – Recent Advances and Future
Prospects (pp. 239–265). Rijeka: InTech.
Dettori, A., D’hallewin, G., Agabbio, M., Marceddu, S. & Schirra, M. (1996). SEM. studies on
Penicillium italicum–‘Star Ruby’grapefruit interactions as affected by fruit hot water
dipping. In Proc. VIII Int. Citrus Congress (pp. 12-17).
Gulati, R. & Mathur, S. (1995). Effect of Eucalyptus and Mentha leaves and Curcuma rhizomes
on Tyrophagus putrescentiae (Schrank) (Acarina: Acaridae) in wheat. Experimental and
Applied Acarology, 19(9), 511– 518.
Hamanaka, D., Atungulu, G. G., Tanaka, F., & Uchino, T. (2010). Effect of combining infrared
heating with ultraviolet irradiation on inactivation of mold spores. Food science and
technology research, 16(4), 279-284.
Hamanaka, D., Uchino, T., Furuse, N., Han, W. & Tanaka, S. (2006). Effect of wavelength of
infrared heaters on the inactivation of bacterial spores at various water activities.
International Journal of Food Microbiology, 108(2), 281-285.
Hussein, H.S. & Brasel, J. M. (2001). Toxicity, metabolism, and impact of mycotoxins on
humans and animals. Toxicology, 167(2):101–134.
Jun, S., & Irudayaraj, J. (2003). Selective Far Infrared Heating System—Design and Evaluation.
Drying Technology, 21(1), 51-67.
Khlangwiset, P., Shephard, GS. & Wu, F (2011). Aflatoxins and growth impairment: A review.
Critical Reviews in Toxicology, 41(9), 740-755
Krishnamurthy, K., Khurana, H.K., Soojin, J., Irudayaraj, J. & Demirci A. (2008). Infrared
heating in food processing: an overview. Comprehensive Reviews in Food Science and
Food Safety, 7(1), 2-13.
McCann, M. S., McDowell, D. A., & Sheridan, J. J. (2009). Effects of reduction in beef surface
water activity on the survival of Salmonella Typhimurium DT104 during heating. Journal
of applied microbiology, 106(6), 1901-1907.
Meenu, M., Guha P., & Mishra, S. (2017). Impact of infrared treatment on quality and
fungal decontamination of mung bean (Vigna radiata L.) inoculated with Aspergillus spp.
Journal of the Science of Food and Agriculture, 98(7), 2770-2776.
Mohapatra, D., Kumar, S., Kotwaliwale, N. & Singh, K.K. (2017). Critical factors responsible
for fungi growth in stored food grains and non-chemical approaches for their control.
Industrial Crops and Products, 108(1), 162-182.

81
Pande, R., Mishra, H.N. & Singh, M.N. (2012). Microwave drying for safe storage and improved
nutritional quality of green gram seed (Vigna radiata). Journal of Agricultural and Food
Chemistry, 60(14), 3809– 3816.
Pechanova, O. & Pechan, T. (2015). Maize-Pathogen Interactions: An Ongoing Combat from a
Proteomics Perspective. International journal of molecular sciences, 16(12), 28429–
28448.
Prasad, R., Gunn, S. K., Rotz, C. A., Karsten, H., Roth, G., Buda, A. & Stoner, A. (2018).
Projected climate and agronomic implications for corn production in the Northeastern
United States. PloS one, 13(6), e0198623.
Rastogi, N.K. (2012). Recent trends and developments in infrared heating in food processing.
Critical Reviews in Food Science and Nutrition, 52(9), 737– 760.
Rosenthal, I., Rosen, B., & Bernstein, S. (1996). Surface pasteurization of cottage cheese.
Milchwissenschaft, 51(4), 198-201.
Sandeep, K. P. (2011). Thermal processing of foods: control and automation. Wiley-Blackwell,
Hoboken, NJ.
Staack, N., Ahrné, L., Borch, E. & Knorr, E. (2008). Effect on infrared heating on quality and
microbial decontamination in paprika powder. Journal of Food Engineering, 86(1), 17-
24.
U.S. GRAINS COUNCIL (2019). Corn. https://grains.org/buying-selling/corn/
Ukwuru, M.U., Ohaegbu, C.G., & Muritala, A. (2018). An Overview of mycotoxin
contamination of foods and feeds. Journal of Biochemical and Microbial Toxicology,
1(1), 101.
United States Department of Agriculture (UDSA) Economic Research Service (2018).
Feedgrains Sector at a Glance. https://www.ers.usda.gov/topics/crops/corn-and-other-
feedgrains/feedgrains-sector-at-a-glance/
Williams, J. H., Phillips, T. D., Jolly, P. E., Stiles, J. K., Jolly, C. M. & Aggarwal, D. (2004).
Human aflatoxicosis in developing countries: a review of toxicology, exposure, potential
health consequences, and interventions. American Journal of Clinical Nutrition, 80(5),
1106–1122.
Wilson, S.A., Okeyo, A.A., Olatunde, G.A. & Atungulu, G.G. (2017). Radiant heat treatments
for corn drying and decontamination. Journal of Food Processing and Preservation,
41(5), e13193. doi.org/10.1111/jfpp.13193.

82
Chapter 6: Conclusions
This study evaluated the impact of exposing corn to infrared energy at selected peak
wavelengths (λ), infrared intensities and treatment durations, followed by tempering for further
inactivation of microbes on the grain. The study also examined the potential to limit the
regeneration of A. flavus spores on the grain. The selective infrared treatment reduced the
microbial load on the corn. There was a decrease in microbial load with an increase in MC and
heating duration. The lower wavelength and product-to-emitter gap the greater the reduction in
mold count. It was also noted that increasing IR intensity and treatment durations supplied to the
corn resulted in decreasing A. flavus mold concentrations. After 5 days of incubation, corn with
lower MC showed less potential for A. flavus development under favorable circumstances for
mold growth
Optimization analyses suggest that a wavelength of 3.2 µm (intensity of 15.71 kW/m2), a
heating duration of 60 s, corn MC of 24% w.b., and a PEG of 110 mm provide the optimal
response in terms of corn mold load reduction and A. flavus concentration. Tempering created a
synergistic effect which allowed for further reduction in microbial load population and A. flavus
concentration on corn.
Metagenomics analysis found that Ascomycota was the most dominant phylum for non-
tempered and tempered treatments. After the IR treatments it was noted that the fungal
community was separated by the different corn MCs.
In summary, selective IR treatment approach as opposed to broadband IR treatment could
be effective in inactivating molds, especially those responsible for mycotoxin production on
shelled corn. When fully optimized, the newly developed selective IR heating process has

83
potential to maximize inactivation of mycotoxigenic fungi and contribute significantly to
knowledge and science.