selenium, fluorine, and arsenic in surficial materials of ... · selenium, fluorine, and arsenic in...
TRANSCRIPT
GEOLOGICAL SURVEY CIRCULAR 692
Selenium, Fluorine, and
Arsenic in Surficial Materials
of the Conterminous United
States

Selenium, Fluorine, and
Arsenic in Surfic"ial Materials
of the Conterminous United
States
By Hansford T. Shacklette, Josephine G. Boerngen, and
John R. Keith
GEOLOGICAL SURVEY CIRCULAR 692
Washingto(l 1974

United States Department of the Interior ROGERS C. B. MORTON, Secretary
Geological Survey V. E. McKelvey, Director
Free on application to the U.S. Geological Survey, National Center, Reston, Va. 22092

Abstract .......................................... . Introduction ...................................... . Selenium ......................................... .
Analytical method ............................. . Results of analyses ............................ . Discussion .................................... .
Fluorine .......................................... . Analytical method ............................. .
CONTENTS
1 1 2 2 2 2 3 3
Fluorine-Continued Results of analyses ............................ . Discussion .................................... .
Arsenic ........................................... . Analytical method ............................. . Results of analyses ............................ . Discussion .................................... .
References cited ................................... .
ILLUSTRATIONS
Page
6 6
10 10 10 10 11
Page
FIGURE 1. Map showing selenium concentrations in surficial materials of the conterminous United States . . . . . . . . . . . 4 2. Map showing physiographic regions of the conterminous United States . . . . . . . . . . . . . . . . . . . . . . . . . . . . . . . . . 6 3. Map showing fluorine concentrations in surficial materials of the conterminous United States . . . . . . . . . . . . 8 4. Map showing arsenic concentrations in surficial materials of the conterminous United States ............. 12
TABLES
TABLE~ 1-3 · Concentrations of elements in samples of soils and other surficial materials from the conterminous United States: Page
1. Selenium..................................................................................... 2 2. Fluorine . . . . . . . . . . . . . . . . . . . . . . . . . . . . . . . . . . . . . . . . . . . . . . . . . . . . . . . . . . . . . . . . . . . . . . . . . . . . . . . . . . . . . 6 3. Arsenic . . . . . . . . . . . . . . . . . . . . . . . . . . . . . . . . . . . . . . . . . . . . . . . . . . . . . . . . . . . . . . . . . . . . . . . . . . . . . . . . . . . . . . 10
III


Selenium, Fluorine, and Arsenic in Surficial Materials of the Conterminous
United States
By Hansford T. Shacklette, Josephine G. Boerngen, and John R. Keith
ABSTRACT
Concentrations of selenium, fluorine, and arsenic in 912, 911, and 910 samples, respectively, of soils and other regoliths from sites approximately 50 miles (80 km) apart throughout the United States are represented on maps by symbols showing five ranges of values. Histograms of the concentrations of these elements are also given. The geometric-mean concentrations (ppm) in the samples, grouped by area, are as follows:
Selenium- Entire United States, 0.31; Western United States, 0.25; and Eastern United States, 0.39.
Fluorine- Entire United States, 180; Western United States, 250; and Eastern United States, 115.
Arsenic- Entire United States, 5.8; Western United States, 6.1; and Eastern United States, 5.4.
INTRODUCTION
The concentrations of 38 elements in samples of soils and other regoliths from sites about 50 miles (80 km) apart on travel routes throughout the conterminous United States were given by Shacklette, Hamilton, Boerngen, and Bowles (1971), Shacklette, Boerngen, and Turner (1971), and Shacklette, Boerngen, Cahill, and Rahill (1973). After these reports were prepared, analytical methods became available for determining selenium, fluorine, and arsenic in surficial materials in concentrations as low as 0.1 ppm (part per million), 10 ppm, and 1 ppm, respectively.
The samples were collected and prepared for analysis in the same manner as reported earlier (Shacklette, Hamilton, and others, 1971) and were analyzed in sequence that was completely random with respect to sampling locality. Selenium concentrations were determined by J. S. Wahlberg and M. W. Solt, and fluorine and arsenic concen-
1
trations were determined by J. W. Budinsky, B. A. McCall, and Roosevelt Moore.
We measured the precision of the analytical methods used for these elements by analyzing 48 randomly selected samples in duplicate. The 48 duplicates were randomly interspersed among the other 912 samples and were unknown to the analysts. The precision of each method was estimated by
48
~(log x ·-logy ·) 2 . 1 £ t sJ= z=
96 0.00040,
where s& is the precisiOn, and xi and Yi are, respectively, the determinations of each element for the ith sample and its corresponding duplicate. The analytical reproducibility, as well as the logarithmic variance, for each of the three elements is given later in this report.
Analytical values for the three elements were transformed to a logarithmic form because the frequency distributions are more nearly symmetrical on a logarithmic scale than on an arithmetic scale. The best measure of central tendency in a lognormal distribution is the geometric mean, which is the antilogarithm of the mean logarithm. The most convenient measure of variation is the geometric deviation, which is the antilogarithm of the standard deviation of the logarithms. Estimates of the arithmetic mean (tables 1-3) were derived by the use of Sichel's (1952) technique. These methods of statistical evaluation are the same as those used for evaluating other elements in the samples, as reported by Shacklette, Hamilton, Boerngen, and Bowles (1971).

Although most of the samples studied were collected along roads, the specific sampling sites were selected to obtain surficial materials that were as representative as possible of their natural condition. Some samples, of necessity, were collected in cultivated fields; the degree of contamination, if any, of these samples or of a few samples collected near road shoulders cannot be evaluated from the data at hand. Most surficial materials analyzed were sampled at a depth of about 8 inches (20 em). We believe that soils and other regoliths from this depth are influenced very little by the surficial contamination associated with roadways.
Many geologists and other workers of the U.S. Geological Survey assisted in this study by collecting samples along travel routes to their own fieldstudy areas. This assistance, and that of computer specialists, was acknowledged in the earlier reports of this sampling program (Shacklette, Hamilton, and others, 1971; Shacklette, Boerngen, and Turner, 1971.)
SELENIUM
ANALYTICAL METHOD
Selenium concentrations in the samples were determined by a chemical-X-ray fluorescence method. A 2-g (gram) soil sample is fused with 15-g sodium carbonate and 5-g sodium peroxide. The fusion cake is then dissolved in 200 ml (milliliters) of water, and the solution is filtered. The filtrate is acidified, a tellurium carrier added, and the selenium along with the carrier is precipitated by an iodide sulfite reduction reaction. The precipitate of selenium and tellurium is collected on a filter disk and dried, and the quantity of selenium is then determined by X-ray fluorescence.
The logarithmic variance of the analytical method was measured as 0.042729. This means that the analyses are reproducible within a factor of 1.61, computed as the antilog of sa at the 68-percent level of confidence, or within a factor of 2.59, computed as the square of the antilog sa at the 95-percent level. The logarithmic variance of selenium measured in all 912 samples is 0.1476, indicating that the analytical-error variance contributed less than 29 percent to the total variance in the data.
RESULTS OF ANALYSES
Statistics for the selenium concentration of all samples, as well as of samples from both east and
2
west of the 97th meridian, are given in table 1. Figure 1 shows the distribution of the sample sites throughout the conterminous United States and the selenium concentrations of the samples, expressed in terms of five geometric ranges of concentration.
TABLE !.-Concentrations of selenium, in pa-rts per million, in sa.mples of soils and other surficial materials from the conterminous United States
[Number of samples is given in parentheses after area]
... = ... ·;:::: ·E·~ ... -
Area ~ ~ ~ 8 -~ e ; = g e 0 .., ~8 .s ..,., ~ C,!) C,!)
Entire conterminous United States (912) 0.1-4.32 0.31 2.42 0.45
Western United States, west of the 97th meridian (492) ............. .1-4.32 .25 2.53 .38
Eastern United States, east of the 97th meridian (420) ............. .1-3.88 .39 2.17 .52
'Estimated by method of Sichel (1952).
DISCUSSION
The concentrations of selenium in natural materials, including soils, have been extensively investigated because of the long-known toxicity of this element to domestic animals and man and, more recently, because the essentiality of selenium in animal metabolism has been established. The dual metabolic role of this element was discussed by Frost (1972). The relationships of selenium chemistry and agricultural practices were discussed in an agriculture handbook by Anderson, Lakin, Beeson, Smith, and Thacker (1961), and more than 200 literature references to the subject were given. More recently, reports were published of .selenium accumulation in soils, plants, and animals to levels that are toxic (Lakin, 1972) and cf effects of selenium deficiency in soils on animal health (Muth and Allaway, 1963; Allaway, 1969; and Oldfield, 1972). Selenium is generally considered to be nonessential in plant metabolism. Low concentrations of this element, however, have been shown to stimulate plant growth (Ganje, 1966, p. 394).
Lakin (1961, p. 27) outlined the sources of selenium in soils . as follows: "The selenium in soils may be derived (1) from parent material weathered from the underlying rock; (2) from wind- or water-deposited seleniferous materials; (3) from ground or surface water, by precipitation; ( 4) from volcanic emanations brought down by rain;

and (5) from sediments derived from mining operations. All these types are known."
In general, seleniferous soils of dry regions are alkaline, contain free calcium carbonate, and may support seleniferous plants that are toxic to livestock. In the United States most soils of this type are west of the 97th meridian. Soils of more humid regions are generally acidic and, even if seleniferous, are not known to support seleniferous plants. The differences in toxic properties of selenium in arid and humid regions were explained by Lakin (1961, p. 30): "Although many -factors govern the selenium uptake by plants, a partial measure of selenium's availability to plants is its solubility in water. Toxic soils contain watersoluble selenium; the others do not. From the physical chemistry of selenium one finds that it may be oxidized to selenates in a moist alkaline environment; the formation of selenates in an acid environment is not likely. One may conclude that in regions of low rainfall, the alkaline seleniferous soils will contain CaSe04, which is soluble in water and available to plants; in regions of high rainfall, the acid seleniferous soils will not contain selenic acid, which, if formed, would be leached out of the soil." In addition to water-soluble selenates, watersoluble organic selenium also occurs in some soils, and micro-organisms are thought to be important in its formation (Lakin, 1972, p. 183-184).
Goldschmidt (1954, p. 532) stated that the abundance of selenium in magmatic rocks of the earth's crust is 0.09 ppm. This element is greatly enriched in certain geologic materials, such as phosphate rocks that may contain as much as 55 ppm and black shales that may contain up to 675 ppm (Lakin,1972,p.181). Vinogradov(1959,p.183)gave the selenium content of soils as 0.01 ppm, and Swaine (1955, p. 91) stated that most soils contain 0.1-2 ppm selenium. In discussing geochemical prospecting by analyzing soils for selenium, Hawkes and Webb (1962, p. 372) stated that, because of the association of this element with epigenetic sulfides, the abundance of this element may be used as an indication of base-metal deposits.
Studies of the distribution of selenium-indicator plants have led to the discovery of selenium-rich uranium deposits in the Western United States (Cannon, 1960). Some of the indicator plants concentrate selenium in their tissues by extracting it from selenium minerals that are relatively insoluble; when the plants die and decompose, the selenium is released in a chemical form that can be
3
absorbed by native nonseleniferous plants and by cultivated crop plants. These seleniumconcentrating plants were designated "seleniumconverter" plants by Beeson (1961, p. 37).
The difference in geometric-mean concentrations of selenium in samples of surficial materials from the Eastern and Western United States, as given in table 1, is statistically significant at the 99-percent confidence level. Some patterns in the distribution of selenium concentrations are apparent at a smaller scale. The generally low concentrations in samples from the northern part of the Cordilleran Mountain region (fig. 2) and the high values in the northwestern part of the Great Plains region are thought to reflect concentrations in the bedrock that largely constituted the soil-parent material. The generally low concentrations in samples from the southeastern part of the Atlantic Coastal Plain region and the high values in samples from the deltas of major streams in the central part of the Gulf of Mexico coast probably reflect the chemical composition of the sediments from which the soils were formed. The absence of a clearly defined pattern of high values that correspond to the socalled seleniferous soils of the northern and western parts of the Great Plains region and the adjacent parts of the Rocky Mountains is probably a reflection of the fact that total, rather than available, concentrations of selenium were determined in this study; or, the absence may be due to insufficient sampling density, or it may reflect both factors. Nevertheless, the range in reported selenium values and the means that were computed are believed to be useful indicators of the concentrations of total selenium than can be expected to occur in surficial materials of the conterminous United States, although these values are higher than those given for soils by Hawkes and Webb (1962, p. 372) and Vinogradov (1959, p. 183).
FLUORINE
ANALYTICAL METHOD
Fluorine was determined potentiometrically by using a fluoride specific-ion electrode, according to the procedure described by Ingram (1970). We found the logarithmic variance of the analytical method to be 0.11. This means that the analyses are reproducible within a factor of 2.17, computed as the antilog of sa at the 68-percent level of confidence, or within a factor of 4.72, computed as the square of the antilog of sn at the 95-percent level.

[B!J!J.ms u! suon-e.r~uaauoa wn!uaras-·r :1111nm~
J.~' ~
v ', ee o ~
e e e ' - vee e .,. ;6"-. ~-....,./-',
t
NOilliW ll:ld S..i.IIVd NI'Wn1N313S 1\
·WN---coOCOOOOQO b~·=·~~~~·WN~~~~ cn ....... No-~cac.n-
I I I I I
I Ul I
~
001
e e v l ev \ •
I 1 I I 1e1el V IOLo!H
eoe e v'' e v :\.
e v v I e o v f> v e ;eT!f),-~~--JTj):::-o-...... e e e e v o eP evv o
1 v ........._
e e e eev
w ~ ~ ~ ;; S31dWVS 1\f!Ol :JO
39\f1N3:1113d ON\f 108WAS
~ ' e oh 0
......... "'-""vw-.,9 v f) v e (.) e IV
0 0 '
-.."-e b v I e .......... v v v e e~ v • v e. e e v f • o v .L
• I v v v ~ v o e I .. o o~ --~ v o v t e ~ v t-' v v 0 /
0 ~v ~ v~ o , () 0 V I t) • e ,.I {)
o 1 v e e e v 1 v ' c v ~ • • .... _ ---e v• vI v e e -e-e--o-o--e--r~~-!_ v v0 • e I e v ,\c o o e ~a. • e e e ----' _ ee 1 OJ ' e
e e e e e v .Le e ---~.2_ r ..... o ' c , e • / -----~ Je \ e
I e • 1 "lJ-~ o e. e 'e o 1 0 ' e
• e e e I e v / • / O\ .. -------'-e e e e e e e o. v ' --l e I I \ ::-'!• e e e ., " e., 1 e 1 ., ., ~ e \ e e!...~e e v Oev o•~ v ot'>. ~ • '
\ e o v T------I:>L Q / oo~ , o e e 0 ~ v e -__ e='eev 0 ~ 0 ov e)
.,_ o p" e e " e I e o" e o I ee > ..._...... I v E> f> v veee ee ' o
-~ • ---------f e e o o f-e~~ 1_1 Vf) o / f> e eo o 1 -.. e
e e • • • f> v --"" A e I e I I 0 ---'t-' 0
I e ee e e/ e • It> • 8 e e ' o---_fJ e e e e • I e eve e / --o
t e Ia_ e • e e I v o ' o ..o... __ ' e ~e· ---:e.... d. • v 1 fe!£L______ je -----J'J.JI~,
0 • ~ o o "
0
\f) -e 1 e e f) ( 1 • 0 f)
~~," • " e e I "e e e o ~ o ;' e o le a• v o ? teo o
e~e o • e ~ o/ v, e o •• J • o e v _..e 1 e•• tt"\ €)---Q_..Q..o v .l ~ L 0 I ... __
-------, e o Oi' --------,0 e
1 v e --\ /t:> -----I 0 V
-----I : v o e ---1--L_ o e
---..o ------
oll
oVl
o9l
o8l
oO£
ol£
oV£
o9£
o8£
oOV
olV
oV'V
o9V
~~--~----_.----~----~----~----._----~----~----~----~----~----._----~----~-----L----~~~oBv o96 o86 o001 ol01 oVOI o901 o901 o01t olt1 oVt1 o91t o81t oOlt oll1 oVll o9l1 o8l1

oll
<]
·sa~'B~S pa~JU fi SUOUJW.IalUOJ aq1 JO S{'BJ.Ia~'BW
o98
I S3lllr'tl 000
SH3.l31r't1011>1 000 1
o'176
0
r" t 0
e .,. e e 1
) • I
:\._...-----c. Cl ._J -I ._._-e:-\ ~ ,v u • ~ --I ec.· )e o ' u e I o e e / e •\. o e e
0 eUUC)uU , e I
u eu<, 1 ~ Jo eu ··\.._e .,., \ e e.{) r Cl Cl. ~-~e--.,~ Cl e
o o• .... 0 e ' 1 \ • 1" ... ---" ... , '--ef) • e' 1 ~ •" eeu o u u e ~~ \s e ., ele_~.-£-~ • e • .~ e • €> '-U -.l----~ f I
' ..... -\ "" -~J'C I {) "'-'"-{" \
e • e ~ .... u u e e u ~/e e e e • le v 0
{) ee e • _,.r Cl e -c ---~e---' e ---.rc u e e • v ~ _!'---,....,....-~ .,~ e ... e e Iii--------r .. r~ ' e ,...., e e
--~ .1 e •e u e ~ \ e e 111 e e u e .... .r...-v( e •../'A ~ .... u e B e ' •
e e I \ • ee • }" / L e e I J • ~ ...... \.,_...-,,.rJ e ~ e ~~ e !...
..,\~f.-fj/fl: ee ., fo'"' e ., ., \ e e 4 ., .,., • "'e.., • • • • ~-L- "'\~-~.,rue e l 1 e f\ " )};-----e e uV • lf e u • • { ------""j.
_ _.~.ee ~ • le.,u., 1 e\ ...__ u 1 e le t• e e • e "
~· e e e oc~-.9 o e~e \ I . Cl ~ ~ ., -~ e ~~~~ e ---eu t--., e~ > ...
o ~ ~ \ .... _.--fJ ' e ...~,, e e e 0 e \.,_fL------~ ~c-~ e e v • e
~ ........ -~ o ., ., 1> ., e ;-,, e !" 1 ·\u e e "' • I u\ e'"' o e .., ., u ~ i o
,u ( \ ~ \ I ( {)/ • .. €> 'I €> L( e \ e / .g. ~ ~ ' o
e~ e_:F---e e c,--t. f) -{' e v
', f-
y-~@!~~., \ ., €>'
e ' \ .I (
·e l \ I
\CI I . ._.,"\)
olL
~ ....... """.,--"'""-_ j 1,.- \j
o98 o88 o06 ol6 o'176 o96

FIGURE 2.-Physiographic regions of the conterminous United States.
The logarithmic variance of fluorine concentrations in all 911 samples is 0.305, indicating that the analytical-error variance contributes less than 37 percent to the total variance in the data.
RESULTS OF ANALYSES
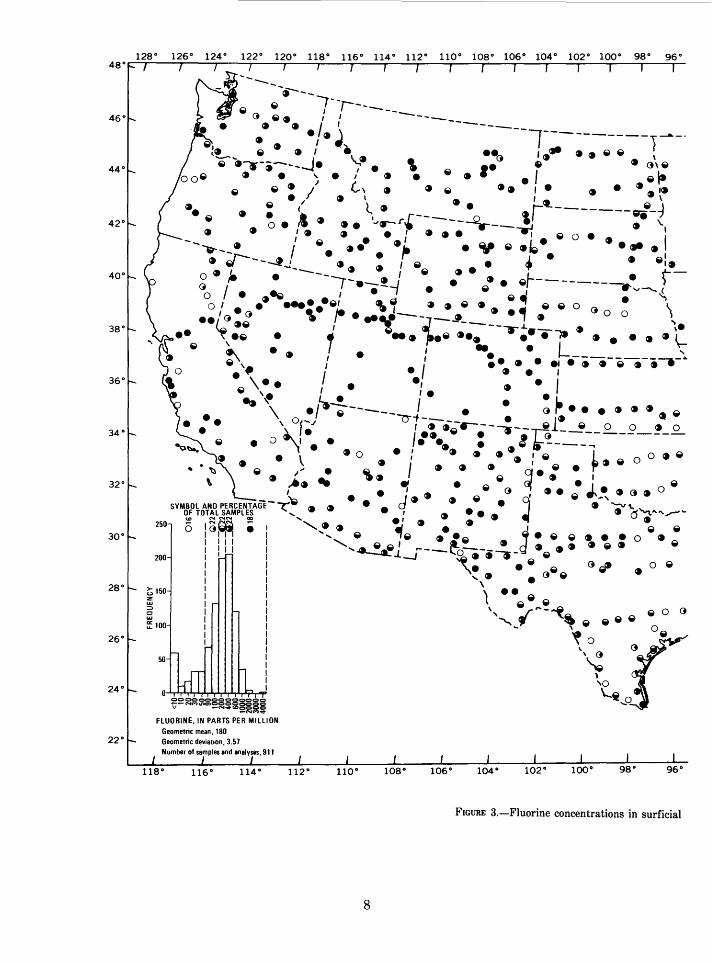
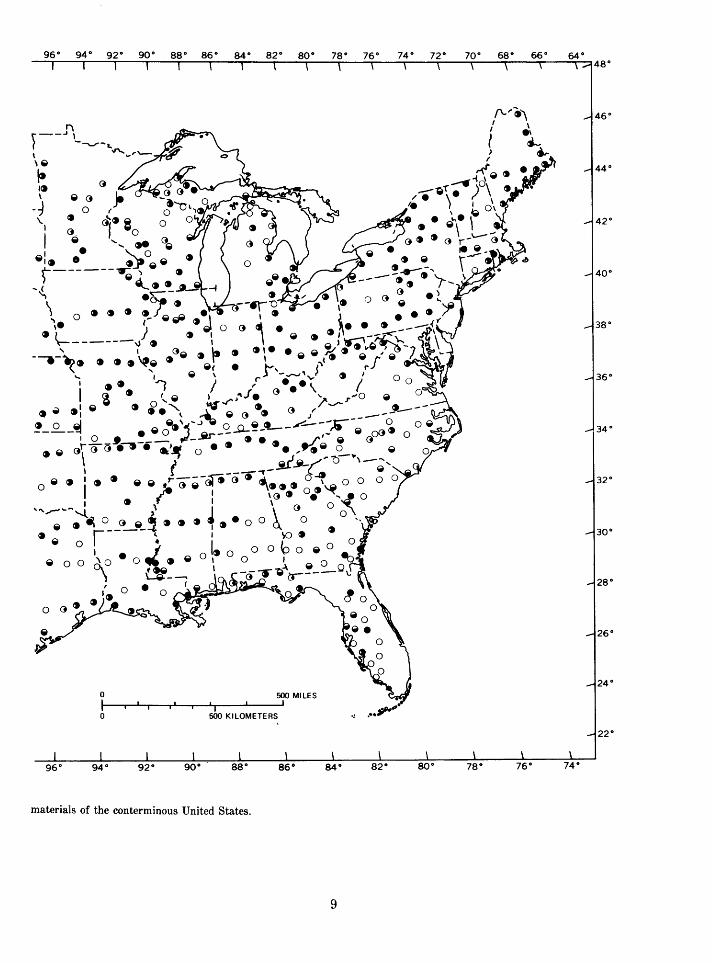
Statistics for the fluorine concentration of all samples, as well as of samples from both east and west of the 97th meridian, are given in table 2. Figure 3 shows the distribution of the sample sites throughout the conterminous United States and
TABLE 2.-Concentrations of fluor-ine, in parts per million, in samples of soils and other surficial materials from the conterminous United States
[Number of samples is given in parentheses after area]
Area
Entire conterminous United States (911) ........ 10-3,680 180 3.57 400
Western United States, west of the 97th meridian (491) ............. 10-1,900 250 2.66 410
Eastern United States, east of the 97th meridian (420) ............. 10-3,680 115 4.38 340
'Estimated by method of Sichel (1952).
6
the fluorine concentrations of the samples, expressed in terms of five geometric ranges of concentration.
DISCUSSION
Fluorine is widely distributed in nature, and is a common constituent of most soils and rocks. Most of the fluorine in soils is thought to be derived from the geologic parent materials. Hawkes and Webb (1962, p. 365) gave the average fluorine content (ppm) of rocks as follows: Ultramafic, 100; mafic, 370; felsic, 800; limestone, 51; sandstone, 290; and shale, 590. Kokuba (1956) reported the following ranges in fluorine content (ppm): 100-800 in 99 samples of volcanic rocks; 160-2,900 in 5 volcanic ashes; and 120-2,400 in 28 samples of plutonic rocks. This element is added to soils in many regions by atmospheric fallout from industrial activity, by volcanic ejecta, or by the application of phosphate fertilizers and other fertilizers containing slag.
The increasing importance of fluorine contamination of agricultural areas by industrial processes was emphasized in a report by the German Research Society (Deutsche Forschungsgemeinschaft, 1968, p. 1) as follows [translated]:

Fluorine damage has been known and examined for almost 100 years. While earlier it was mostly single occurrences, today, because of heavy industrialization of numerous districts, the areas have become very small where one can safely suspect no fluorine emissions. Meanwhile, we have learned that the source of these emissions is by no means limited to the use of fluorinecontaining raw materials (fluorspar) but also includes metalworking factories, hydrofluoric acid production, and enamelware factories, and that fluorine emissions also originate from electric power plants, brickworks, and so forth. One must further bear in mind that the emissions can be widely distributed by the wind and, also, that in nature soils with high fluorine contents occur, so that in a district with elevated fluorine levels in forage plants, for example, far-reaching sources must be considered if the emissions are not always present in an easily recognizable form. The fluorine problem in the German Republic is truly a general problem and not an occasional local condition.
The high levels of fluorine in some soils may be attributed to volcanic activity. No soil sample reported in this study is thought to have been influenced by historic volcanism, although fluorine from ancient eruptions may remain in some of the soils that were sampled. The effects of a recent volcanic eruption on the fluorine content of surficial materials are illustrated by Thorarinsson's (1970) report of the Mount Hekla, Iceland, eruption of May 5-July 15, 1970, as follows: "The tephra production was considerable, totalling approximately 30 million m3
• * * * The area on land receiving more than 100 tons/km2 was about 9,500 km 2
, or nearly one-tenth of the country. * * * The tephra proved unusually rich in fluorine (up to at least 1,500 ppm) and caused lethal fluorine poisoning in the grazing livestock, especially sheep. The situation is really very serious, especially in some districts on the north coast where the tephra is very fine grained and washes out more slowly than expected. The new grass growing through this ash is also poisonous."
Fluorine concentrations in some samples of the present study exceed that of the Iceland tephra, but for the most part, this fluorine is probably fixed in relatively insoluble compounds. Soluble fluorine compounds are almost completely fixed in a soil of pH 6.5 or greater in the presence of adequate amounts of calcium carbonate (CaC03) through the formation of relatively insoluble calcium fluoride (CaF2) (Brewer, 1966, p. 195). In the absence of adequate calcium, the formation of aluminum silicofluoride, (Al2SiF6h, accounts for the observed fixation of the fluoride (Brewer, 1966, p. 183).
Although most of the samples of surficial materials collected for this study were from sites
7
where sources of possible contamination were not obvious, fluorine contamination may have occurred at some locations. For most elements considered in this study, particularly those that form compounds of low solubility, we believe that the depth at which the samples were collected precluded gross contamination. Robinson and Edgington (1946) reported that virgin soils contain more fluoride with depth, but that with regular fertilization soils had the greater fluoride concentrations near the surface. This observation agrees with the known low mobility of most fluorine compounds in soils.
Fluorine, like selenium, plays a dual role in animal nutrition-small amounts are essential, but larger amounts may be deleterious (Underwood, 1971, p. 369-388). Animals may be adversely affected by eating forage plants that contain 50 ppm (dry-weight basis) or even less of fluoride, although the plants may exhibit normal growth (Brewer, 1966, p. 180). The importance of adequate fluorine in food or water for bone and tooth development in humans is well known, and problems of excessive fluorine in drinking water causing mottled teeth occur in local areas.
Although low concentrations of fluorine have been reported by Nikolic (1956) and others to stimulate growth in plants, this element is not considered to be essential for plant growth (Brewer, 1966, p. 180), and high concentrations in the air or soil are toxic to plants. Fluorine levels in soils that are injurious to plants are controlled more by soil type, calcium and phosphorus content, and soil pH than by total fluorine that is present because only the soluble fluorine is absorbed. Sandy acid soils low in phosphorus favor the development of soluble forms of fluorine.
The differences in fluorine concentrations in samples of surficial materials from Western, compared with Eastern, United States (table 2) are significant at the 99-percent level of confidence. The high levels in samples from the central and north-central parts of the Cordilleran Mountain region (figs. 2, 3), probably reflect the higher fluorine concentrations in the rock types from which the soils were derived. Samples from the Appalachian Highland region and the Ozark region of Eastern United States (figs. 2, 3) tend to contain fluorine in concentrations that are greater than average, which probably also resulted from the higher fluorine content of the parent rocks. In con-· trast, the surficial materials from the Atlantic
8
fUP!JJns u! suo!l'BJluaauoa au!Jonu-·s ~anm.!J
olll oVH o9n
L!n: 'uo11e!AaP l!Jlawoa9 -1 0 ll 081 'ueaw l!Jlawoa9
NOilliW 1:13d Sll:l'lfd Nl '3NII:IOnl:l
)o"~\
0\. l
~ () \
eo o. e e \ ...
v o e e e ~~-... .J "'--,, e e e l .. \
e ev • e ', e• ·~ e e e e e e e., p-L-.!_!_Q"-r-r~ ,
e o e cf'Jv
~wN-
gggggggg~~Ci~
0!1
001
0!11
ooz .. ., .. 0 •• ., ..... !. ., .. -, ., --I.. .. ,, I HI I e e/a e ' I I I I
~-"""~p e b e • e e e I • e .,................ I • ~vi o "" ,._,_ e • 1 , , ;; ~ ... ~ c;; Lo!lz e ,_f e • e p • e e , S3ldwvs w1o1 :~o e 0 () CJ • • CJ 1
() e CJ CJ • • ~ -~'lflN3::11:13d ON'If 108WAS
• ~ e I • 1 I e • b e • • e ._ e.-
ee oo ee~ • e I e e e e / ' • ,.1 e e l el e e I e \ ~----..tl ~ e • e., 1 • o e •
o_i_o_c;--e--r~--L • .. •.,:/ • • ,"-. o • e ~ e --__._ ~ e 1 • I ~ e e e • • • J v • • --4-..o.___ e r •• Jo '
, • • I ----el• \ I
e ., ., ~lie e I e I ' e
e ., ' • e 1• I • • \ .... -L---~-!_! • I• • e • • • ..... • ' -l e I I .-,
].,.. •• • .. I • I •• ~ ·~ e e!..~.• .._ e•e e•~ e• • ' e T --e • ee ~ o o e ---1 \ v o e e ~ • e €" __ ... .,. • ~' \ ee f> ••
~ • A. e e e e 1flL ., • f>e 1 > ......__,......__ ~ e f' ~ 'e• .... • 1 o
--S • -------~e • .,e • • /--!_• .L_' ee., • I o .,, .tl • e e 1 e ---• w f>
,e e • T • e I e ., e ---, e o I e -. e • ere e A • ~ • e • t' ~---I: ., I e 0 e I I Cl •• e CJ -...e.._ ' e i-!L-_.___ • e ., , • e e I --
f-~-jl -a----•J.....e,. • e e;
1
• 0 e e e --------J • ., •
'e -., 1 • e e ( ' • e e1 e , e t~e 11 • •
1 • • • e • • ~ ....
11
I • I le • ~ ( .,e e \v e 8 • e e • ,' • " • e
.\_ e e I> I> fiiJI> I "ee \ .,, eJ---!_L.tt~ ·------L ~· 1 e .. e .,, ----/1 I ., I
--------\ .,,. e \.e ----I Cl Cl
----1 : e e v ----L~L_ e e
--~ ...
e
o96 o86 oOOI ol01 oVOI o90I o80I o011 olll oVll o911 o811 oOli olli oVli o9li o8li
oVl
o9l
o8l
oO£
ol£
oV£
o9£
o8£
oOv
olV
oVV
oZZ
6
·sawlS pal!Ufl snou!w.Iawoo aql JO S{'B!.Ial'BW
SH313W01DI OOS I
I I I S311W 009
0 r I 0
.... ~ e•e ~_'1\Ni"\"fll". 0 e 0 I ) I
..._-~ ~
0
1 ee" ,'o 0 ej o e e j'-o • o \.1 o o e
e -~· 1 ~ J o e •,'; 0 \> 0 0 • e rl e e e ~-e-v--o !e e e e
0 v \ ( !::""""' o ... ~ e• o e v' I l e I ......... -""'
o o o , e e e~ 1
e! 1 , e c-~ _l-~!>-!1'-~~)-'
1 e e e e 1 e e
0
· '--\ 0 /~TJii"" I o e "'---,~ o eC..-6"' • o L. \
0 cVOV e e _,./-e e e e e -c•r!__t_c_e f2..J2_~V e e eo
0 ~---/--c--o-__ ..,.re-0 • ~ o , ____ e o @t.«:' e.e e ti.---
---C" f v c v e -~-' F o i e o,J....-./... ~ ,..,.;,\ \.._ ·~ e e :e ~ ~
o I \ • v f"' c e 'J e I o • • " 1 , e v , e /'-\.,_,.. ....fJ """ e e J
.J I -, \ e I I
~ e e ., •' • >e ' ~ -I< ,: "'· ., ,.C> ?e e e • • \ ., ., ..1 ., e ., e._ ., ., ., ., )_ a ""\~ ~( ,., f) I ~-~-\.(1"' -...>----' e e ~ 1 e " ' _,.y---c • e'V e • 1 e ( ---------\
/e•• ? vo~ le e--. ' e I \_ e ~ e -' •'
( • ~ ., o ., ., • c~-• ., /.,., ., ., ., o \
., -..L... c e -e -~• ·-:-u I -~-ii--;re-C> .,., '>-- -~..\ e ., ., , e_ ( e • e e are--------,\ ~____,-~ <> ., o -"-• .,
1
e
\ le ~ .., ~ • 1
·•'"' • o 'J e I \0 '-1" \ @I) v 1
1 1 e; ee><> 1
C> \i • '.~-!./ 7 0 C> f'-C> e' ~--f <> e
1
~ f) Cl
( ~ e\ \
~ ... --"'V''1_........__ i ,. I \ I
\~_,-J
o06
I r-\..i
o V6 o96

Coastal Plain (fig. 2) that largely originated from old highly weathered marine deposits tend to contain fluorine in low concentrations. Individual sampling sites within this region where the soils contain exceptionally high fluorine concentrations may reflect industrial contamination. One site in central Florida that had high fluorine levels was associated with phosphate deposits, and the one site in western Kentucky having a high fluorine value was near a fluorspar mine.
ARSENIC
ANALYTICAL METHOD
Arsenic concentrations in the samples were determined by an arsine evolutionspectrophotometric-isotope dilution method (Claude Huffman and J. I. Dinnin, U.S. Geological Survey, unpub. data, 1973). The logarithmic variance of this method was found to be 0.033. This means that the analyses are reproducible within a factor of 1.52, computed as the antilog of sa at the 65-percent level of confidence, or within a factor of 2.30, computed as the square of the antilog sa at the 95-percent level. The logarithmic variance of arsenic concentrations in all 910 samples is 0.093, indicating that the analytical-error variance contributes less than 36 percent to the total variance in the data.
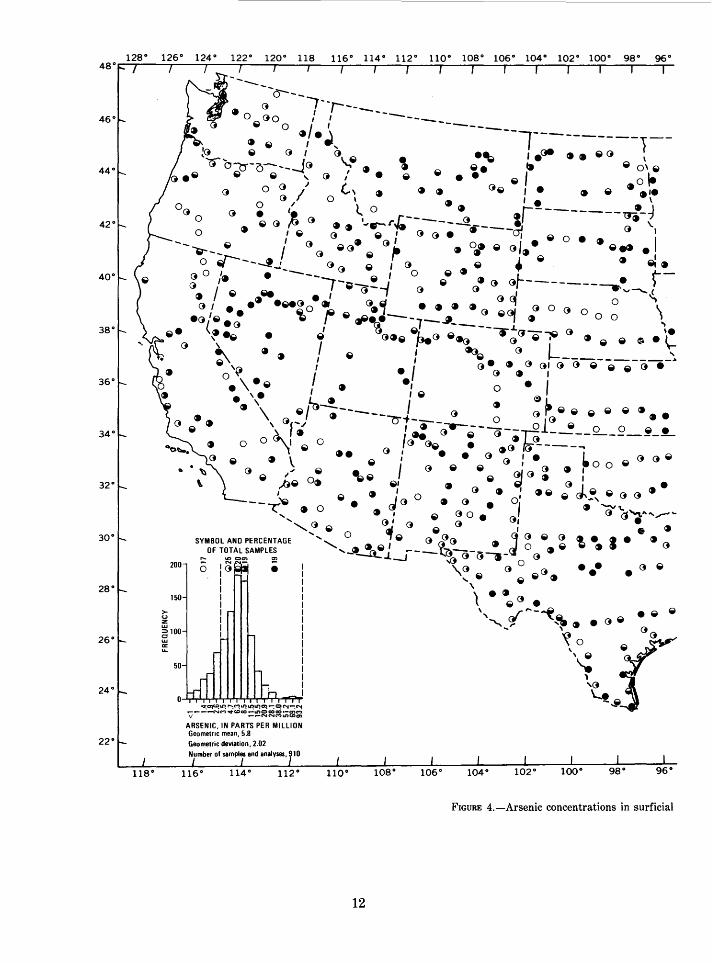
RESULTS OF ANALYSES
Statistics for the arsenic concentration of all samples, as well as of samples from both east and west of the 97th meridian, are given in table 3. Shown in figure 4 are the distribution of the sample sites throughout the conterminous United States and the arsenic concentrations of the samples, expressed in terms of five geometric ranges of concentration.
DISCUSSION
Arsenic in measurable concentrations is a common constituent of rocks, soils, waters, and plants. This element is not considered to be essential for either plants or animals, and some arsenic compounds are extremely toxic to both. Relatively small amounts of arsenic are absorbed by most plants from soils that have natural arsenic concentrations. However, the arsenic levels in Douglas-fir stems have been used successfully in prospecting for ore deposits (Warren, Delavault, and Barakso, 1968), and arsenic solubilization in the humus layer of some soils was attributed to plant action by Hawkes and Webb (1962, p. 360). Arsenic that
10
occurs as a soil contaminant resulting from agricultural practices may be absorbed by plants. Liebig (1966, p. 14) stated, "Crops grown on arsenic-contaminated soils contain more arsenic in the tops and roots than crops grown on unsprayed soils, but large amounts of these crops would have had to be consumed before toxicity to humans or animals resulted."
Arsenic enrichment of the upper horizons of soil by means of plant transport and deposition of arsenic obtained from lower horizons probably is insignificant. Williams and Whetstone (1940, p. 12) reported that arsenic concentrations in native plants that grew on uncontaminated soils did not exceed 10 ppm in dry plant material and that most samples contained less than 1 to 2 ppm. Liebig (1966, p. 13) stated, "Apparently, the effect of arsenic toxicity is such that plant growth is limited before large amounts of arsenic are absorbed and translocated to the top."
TABLE 3.-Concentrations of arsenic, in parts per million, in samples of soils and other surficial materialsfrorn the conter·minous United States
[Number of samples is given in parentheses after area]
Area
Entire conterminous United States (910) 1-97
Western United States, west of the 97th meridian ( 490) . . . . . . . . . . . . . 1.2-97
Eastern United States, east of the 97th meridian (420)............. 1-73
1Estimated by method of Sichel (1952).
5.8 2.02
6.1 1.82
5.4 2.24
7.4
7.2
7.5
Although the beneficial effects of certain organic arsenical compounds on the growth, health, and feed efficiency of poultry and pigs have been well established (Underwood, 1971, p. 427), most inorganic compounds are highly toxic to animals.
Average arsenic concentrations (ppm) in rocks were given by Hawkes and Webb (1962, p. 360) as follows: Ultramafic, 2.8; mafic, 2; felsic, 1.5; shale, 4; and black shale, 75-225. Arsenic concentrations in samples of soil from 12 great soil groups, as reported by Williams and Whetstone (1940, p. 6-10), ranged from 0.2 to 41 ppm, with podzol soils having the lower range of values and the prairie and chestnut soils tending to fall in the upper range. Headden (1910, p. 349), in an early report on arsenic in · virgin prairie soils from Kansas and Colorado, stated, "I have examined virgin soils, all

of them marly, from localities many miles apart, and have found them to contain arsenic, calculated as arsenic acid, as follows: 2.51, 2. 76, 2.8, 3.8, 3.99, 4.2, 4.7, and 5.0 parts per million of soil [range, expressed as arsenic, 1.3-2.5 ppm]. These quantities cannot be considered as mere traces, but are quite small compared with the arsenic found to have accumulated in our orchard soils, which show an average of 47.7 parts arsenic acid per million."
Arsenic contamination resulting from agricultural practices and industrial operations is widespread. Lead arsenate and paris green (arsenic trioxide and copper acetate) were widely used as insecticides on vegetables, fruits, and field crops from early in this century until they were almost completely replaced by chlorinated hydrocarbon insecticides around 1945-50. Apple orchards commonly received lead arsenate at the rate of 2 pounds per acre (2.2 kg/ ha) in each spraying, and the trees were sprayed 7-8 times per year (Dr. N. R. Benson, oral commun., May 12, 1971). Benson (1953, p. 215) wrote, "Almost all land that has been used for the commercial production of apples or pears in eastern Washington contains enough residual lead arsenate from insecticidal sprays to interfere with the growth of most plants. Keaton (1937) has shown that the unproductiveness of these soils is associated with arsenic residue and not with the lead residue." Arsenical compounds (principally sodium arsenite and arsenic trioxide) were widely used as herbicides until replaced by synthetic auxins at about the same time that the use of arsenical insecticides was discontinued.
Hawkes and Webb (1962, p. 360) reported, "The As content of coal ash is extremely high. As a result, burning of coal releases As to the air and causes contamination of surficial material throughout the surrounding country." The concentrations of arsenic in soils that were attributed to smelter pollution in the Helena Valley, Mont., area where reported by Miesch and Huffman (1972, p. 74) to decrease with distance of the sampling site from the smelter stack and with the depth at which the samples were collected. Expected concentrations of arsenic in the surface layer (0-1 inch; 0-2.5 em) of soil ranged from 140 ppm at a distance of 1 mile (1.6 km) to 4 ppm at a distance of 4 miles (6.4 km). Soil from a depth of 6-10 inches (15-25 em) ranged from 13 ppm arsenic content 1 mile (1.6 km) from the stack to 5 ppm 4 miles (6.4 km) from the stack.
11
Mobility of arsenic in soils is generally low because of coprecipitation as As03;) with limonite and as FeAs04 (scorodite) (Hawkes and Webb, 1962, p. 360); nevertheless, arsenic from surficial contamination has been reported to move down to depths of 2-3 feet (60-90 em) in irrigated orchards, although most of the arsenic remains in the upper 12 inches (30 em) of soil (Dr. N. R. Benson, oral commun., May 12, 1971). The loss of arsenic from soils is thought to result from leaching and through conversion of arsenical compounds to· arsine (AsH3) by the action of soil fungi (Williams and Whetstone, 1940, p. 3-4).
We do not know the extent of arsenic contamination of the soil samples used in this study. The selection of rural sites, the avoidance of cultivated soils where possible, and the depth at which the soils were sampled probably prevented a significant amount of contamination of the soil samples. The estimated arithmetic mean of these samples, 7.4 ppm (table 3), is somewhat greater than the mean of 5 ppm given by Hawkes and Webb (1962, p. 360) and is more than twice the highest value found by Headden (1910, p. 349) in virgin prairie soils. The range in values in this report is considerably greater than is commonly reported for soils that are presumed to be uncontaminated; the highest values approach those of total arsenic at the lowest level classified as toxic by Benson (1953, p. 221). However, the toxicity of soils to plants depends on the available arsenic (commonly expressed as soluble or extractable arsenic), and we have no measure of the arsenic present in this form.
The mean arsenic concentrations in soils from the Eastern and Western United States are similar (table 3). The most pronounced pattern in concentration (fig. 4) is that of low concentrations in many samples from the eastern and southern parts of the Atlantic Coastal Plain region (fig. 2). Clusters of high values appear in the central part of the Cordilleran Mountain region, the Ozark region, and parts of the Appalachian Highland region that may reflect the arsenic content of the parent geologic materials.
REFERENCES CITED Allaway, W. H., 1969, Control of the environmental levels of
selenium, in Hemphill, D. D., ed., Trace substances in environmental health-II: Missouri Univ. Proc. 2d Ann. Conf. on Trace Substances in Environmental Health, p. 181-206.
Anderson, M.S., Lakin, H. W., Beeson, K. C., Smith, F. F., and Thacker, Edward, 1961, Selenium in agriculture: U.S. Dept. Agriculture, Agriculture Handb. no. 200, 65 p.
61
J'B!J!JJnS U! SUO!l'BJlUa;moJ J!UaSJV-"f' :rn:nDI.tJ
)~~
zo·z "UO!li!!I\8P 3!Jl8W08!)
8"5 'ueaw JUlaWDa!) NOilliW 1!3d Sli!Vd Nl ':JIN3SI!V =~~~NN--A WCO-•OOCOQU'1-COa.I~W......,_. __ _ N:-Nc:...eau.u,u,w:.....u,a,u,:,:..
05
{)' ~I l I I .._, I I e ', I I
e o ~ _ I I ' ~ '-I I
(] C ' ' I
., e ., • '!;~-~~ \ 1 ~., 1 9 Looz e • • v .. • \. I ~ cac ~
0
"""'
e -• 101' e e '\. """",.
1
oaoAs c e ., ., ~ r-r:-u-o,,....._ '"""''"" ••• ., o -L..tl_!<_fZl---I e c o '-
DOL
05L
e v • ••• v b v v v e L.. e v .........._, c 0 • ., ~ '
e e e e e ., e ., ' ., o e a.L-- cec., ' ., e •c ~ ., c • ,., • o ., f • e '
• ':. I • ., • o ", c eo er e ., .--~."'t>~ ~ c ,o e ., e
1.e e e. e \ .. e -,_.., e e c • , -
flflee1
.,. ~ e e., e •• e~0
o C I • fl!fl e ' I
• I e ., ' ., ., • • !' v o eJ e o o, • .,
1
.,e • e., .. ., r-., '\ e v v ._ ___ ;fj_!_!L_~~-...!.-L.Q.. _____ !__•,je e\ •. -------To o v / e 1 \ • --e-0
o e ., 1 e •
0
• e e e .I ., c e I e / V, • e c e e 1 ., I• I '! I. 0 I· I • • \ (] I c ., ., I e I e, e)
e e
~ .,
1
., ., c • ...__ I e • ., • e, ve e ~-l ~ ad eev 1 !._~-----fl flee fl·"'e ~ I .. e e I fl
.. -v ~ L • ·~ e 8 o ~ • / e ' ,. e e • ., e:...~vT.zc. ___ "'¥"_ --, e "'• ., .... ee• e .,
~ • e f.,e ., e e e • ,. "., 1 •/ o .,
' o o o ., o ., "'., ., 1---e-L.. ____ ~ • .. o
1 F ., e , .-----...r a ' o ~ e o I e ., ., / --~-- ., ve e 1 e 'i'-.....~----------1 e • ., • e ., e ., ., 1 o
~ • e t c e I "e e ., e I ., e e -; 'e ., .,,., e eo ., ., , _.~ e e ., f • ., I e e ... J o I 0 I• .,. e e • o e l£l ___ , ______ J
0
'1 ' ., v
• ., , o 1 o •., 1 v J• e e e '? , fl e '" ' -------• ' .. 0 ,.-,~ 0 "'
f
-""'----e I • ' (] ~-----'""'-.... ~, e I e., e •e• fl f>, 'e e e • I e • • e e ....... ., I ., e : ., e •e • , 1
ej o II '"ioe ~ •f• 0
e .. 10 .. • c elf). I I I 0(] 0 • ' ve l I ' v I -----------------1 L_ __ .\._________ -------.Q ____ _
o96 o86 oOO! olO! oVO'I o90! o80! oOH olH oVH o9H 8H oOl! oll! oVl'I o9l! o8l!
oll
oVl
o9l
o8l
oOE
olE
oPE
o9£
o8E
oOv
olV
oVV
o9V

f!l
·sa~\1~8 pa~JUfi SOOUJW.Ia~UO;> aq~ JO Sll1J.Ia~\1W
oV6 o96
I S311V11 oog
S~3.L3V1101Dt oog I, r'
~~{) 01
0
f 0
e
-~~~~r -~-Af ~
0 u ... '1 .., ~ o e) e e • / v c • \.1 o o e
0 O~ I t J 0 ·-\() ') {) \ o 0 ~ o v e 0 le e • e 1-e___ c -.e v \ 1 'r Co~ee
ev--o \ \ ...,...._ ~ 0 0 0 V\ I ~ e I ...... _.,..,"
COV, oe I , ., o-)o ~..!..-.,-~o _ _!~_. • e • ~ • e
..... -\ {) /-i'\1'""U 1 e I e e
0 -4---'-t' ( , e ... o..-• \ o e c.-1' v e _?J • e e c • v ~?• c ~ c • • e v
., o ~---_!( ___ ,..,..--oo;--e--e~-c.e .-.-;; o-e~ ---e / c o e..r--\ v r..--.-- o ....-...; • o c -~ ' ev ,_, v v
1,.r "\ e •1..:..""'~ ~ .... v o v v :e • e
v o e o• " • I J o o I ./ • ~--..\.,.._,.._ J !..,. ee ~ J 1 ._r \ {) I I
... ~t e e e•' --< e ,., , ~ \ ...... ~~./'~e,~e e • e\., • e\ e e•e eo_e • e •~•-• ~\ ::----->""'--l e • • \ ' v ~ .... , -- .~->-• • • • t • ( ------~ <
ve• llle v ,. C e {) I e ee C I .,
I • • e ., • .__\!>-e [.I> • • e e ' -1 • e o <>.fl \
.. " • • --____..:..e I --~--.,e ,.--e..,. "- ., ..\ -e e r ,_ e -. e ,e ( Cl oe ~---~
!....-.-~ o e • e ., o ~ .,-. "' \ \ o o 00 oe ~ • 1
, o '~ 0', ., ., ~..... • v I 1 I 'I> 0 I
• \ ( e\ ~ o' o ' ~~---J 0 f c~>-.o-·r - • r o o I / 0 .I ( ~ • / _ e
1
I I ~'...... I \c -J' -._,...__ J .,, I )
\.[--
o96

Beeson, K. C., 1961, Occurrence and significance of selenium in plants, in Anderson, M. S., Lakin, H. W., Beeson, K. C., Smith, F. F., and Thacker, Edward, Selenium in agriculture: U.S. Dept. Agriculture, Agriculture Handb. no. 200, p. 34-40.
Benson, N. R., 1953, Effects of season, phosphate, and acidity on plant growth in arsenic-toxic soils: Soil Sci., v. 76, no. 3, p. 215-224.
Brewer, R. F., 1966, Fluorine, chap. 12, in Chapman, H. D., ed., Diagnostic criteria for plants and soils: Riverside, California Univ., Div. Agric. Sci., p. 180-196.
Cannon, H. L., 1960, The development of botanical methods of prospecting for uranium deposits on the Colorado Plateau: U.S. Geol. Survey Bull. 1030-M, p. 399-516.
Deutsche Forschungsgemeinschaft, 1968, Fluor-Wirkungen: Forschungsergebnisse bei Pflanze und Tier [Effects of fluorine: Results of research with plants and animals]: Wiesbaden, Forschungsberichte 14, Franz Steiner Verlag, 149 p.
Frost, D. V., 1972, The two faces of selenium-Can selenophobia be cured?: Critical Reviews in Toxicology, v. 1, no. 4, p. 467-514 (published by The Chemical Rubber Co.).
Ganje, T. J., 1966, Selenium, chap. 25, in Chapman, H. D., ed., Diagnostic criteria for plants and soils: Riverside, California Univ., Div. Agric. Sci., p. 394-404.
Goldschmidt, V. M., 1954, Geochemistry: Oxford, Clarendon Press, 730 p.
Hawkes, H. E., and Webb, J. S., 1962, Geochemistry in mineral exploration: New York, N.Y., and Evanston, Ill., Harper & Row, Publishers, 415 p.
Headden, W. P., 1910, The occurrence of arsenic in soils, plants, fruits and animals: Colorado Sci. Soc. Proc., v. 9, p. 345-360.
Ingram, B. L., 1970, Determination of fluoride in silicate rocks without separation of aluminum, using a specific ion electrode: Anal. Chem., v. 42, no. 14, p. 1825-1827.
Keaton, C. M.,1937, Influence of lead compounds on the growth of barley: Soil Sci., v. 43, p. 401-411.
Kokuba, N., 1956, Fluorine in rocks: Faculty Sci. Kyushu Univ. Memoirs, ser. C, v. 2, p. 95-149.
Lakin, H. W., 1961, Geochemstry of selenium in relation to agriculture, in Anderson, M. S., Lakin, H. W., Beeson, K. C., Smith, F. F., and Thacker, Edward, Selenium in agriculture: U.S. Dept. Agriculture, Agriculture Handb. No. 200, 65 p.
___ 1972, Selenium accumulation in soils and its absorption by plants and animals: Geol. Soc. America Bull., v. 83, p. 181-190.
Liebig, G. F., Jr., 1966, Arsenic, chap. 2, in Chapman, H. D., ed., Diagnostic criteria for plants and soils: Riverside, California Univ., Div. Agric. Sci., p. 13-23.
Miesch, A. T., and Huffman, Claude, Jr., 1972, Abundance and distribution of lead, zinc, cadmium, and arsenic in soils, in
14
Helena Valley, Montana, area environmental pollution study: U.S. Environmental Protection Agency, Office of Air Programs Pub. AP-91, p. 65-80.
Muth, 0. H., and Allaway, W. H., 1963, The relationship of white muscle disease to the distribution of naturally occurring selenium: Jour. Veterinary Med. Assoc., v. 142, no. 12, p. 1379-1384.
Nikolic, S., 1956, Contribution a l'etude de l'action du nickel, du cobalt et du fluor dans Ia nutrition des plantes et dans la fertilisation [Contribution to the study of the action of nickel, cobalt, and fluorine in the nutrition and fertilization of plants], in Centre Internat. Engrais Chim., 5eme Assemblee Gen., 1956 (Beograd) Rappt.: v. 1, p. 195-218.
Oldfield, J. E., 1972, Selenium deficiency in soils and its effect on animal health: Geol. Soc. America Bull., v. 83, p. 173-180.
Robinson, W. 0., and Edgington, G. 1946, Fluorine in soils: Soil Sci., v. 61, p. 341-353.
Shacklette, H. T., Boerngen, J. G., Cahill, J. R., and Rahill, R. L., 1973, Lithium in surficial materials of the conterminous United States and partial data on cadmium: U.S. Geol. Survey Circular 673, 8 p.
Shacklette, H. T., Boerngen, J. G., and Turner, R. L., 1971, Mercury in the environment-Surficial materials of the conterminous United States: U.S. Geol. Survey Circular 644, 5 p.
Shacklette, H. T., Hamilton, J. C., Boerngen, J. G., and Bowles, J. M., 1971, Elemental composition of surficial materials in the conterminous United States: U.S. Geol. Survey Prof. Paper 574-D, 71 p.
Sichel, H. S., 1952, New methods in the statistical evaluation of mine sampling data: London, Inst. Mining and Metallurgy Trans., v. 61, p. 261-288.
Swaine, D. J., 1955, The trace-element content of soils: England, Commonwealth Agric. Bur., Commonwealth Bur. Soil Sci. Tech. Commun. 48, 157 p.
Thorarinsson, Sigurdur, 1970, The "Hekla Fires''-A preliminary report of the 1970 Mt. Hekla volcanic eruption: Washington, Smithsonian Institution Center for Shortlived Phenomena, 2 p.
Underwood, E. J., 1971, Trace elements in human and animal nutrition [3d ed.]: New York and London, Academic Press, 543 p.
Vinogradov, A. P.,1959, The geochemistry of rare and dispersed chemical elements in soils [2d ed.]: New York, Consultants Bur. Enterprises, 209 p.
Warren, H. V., Delavault, R. E., and Barakso, J., 1968, The arsenic content of Douglas-fir as a guide to some gold, silver, and base metal deposits: Canadian Mining and Metallurgical Bull., July, 1968, p. 860-866.
Williams, K. T., and Whetstone, R. R., 1940, Arsenic distribution in soils and its presence in certain plants: U.S. Dept. Agriculture Tech. Bull. 732, 20 p.
:, u.s. GOVERNMENT PRINTING OFFICE: 1974-543-583/ 11'2