self archive crack
TRANSCRIPT
8/16/2019 Self Archive Crack
http://slidepdf.com/reader/full/self-archive-crack 1/17
See discussions, stats, and author profiles for this publication at: https://www.researchgate.net/publication/226913751
Identification of Transverse Crack Position andDepth in Rotor Systems
Article in Meccanica · October 2000
Impact Factor: 1.95 · DOI: 10.1023/A:1010562205385
CITATIONS
48
READS
12
4 authors, including:
N. Bachschmid
Politecnico di Milano
103 PUBLICATIONS 719 CITATIONS
SEE PROFILE
Paolo Pennacchi
Politecnico di Milano
268 PUBLICATIONS 1,467 CITATIONS
SEE PROFILE
A. Vania
Politecnico di Milano
116 PUBLICATIONS 642 CITATIONS
SEE PROFILE
All in-text references underlined in blue are linked to publications on ResearchGate,
letting you access and read them immediately.
Available from: Paolo Pennacchi
Retrieved on: 12 May 2016

8/16/2019 Self Archive Crack
http://slidepdf.com/reader/full/self-archive-crack 2/17
1
COPY
The final publication is available at Springer via http://dx.doi.org/10.1023/A:1010562205385
Bachschmid N., Pennacchi P., Tanzi E. e Vania A.,
“Identification of Transverse Crack Position and Depth in Rotor Systems”, Meccanica, International Journal of the
Italian Association of Theoretical and Applied Mechanics, Vol. 35, n. 6, 2000, CODEN MECCB9 ISSN 0025-6455, pp.
563-582.

8/16/2019 Self Archive Crack
http://slidepdf.com/reader/full/self-archive-crack 3/17
2
COPY
IDENTIFICATION OF TRANSVERSE CRACK POSITION AND DEPTH
IN ROTOR SYSTEMS
N. BACHSCHMID, P. PENNACCHI, E. TANZI, A. VANIA
Dipartimento di Meccanica – Politecnico di MilanoVia La Masa, 34 - I-20158 Milano, Italy
Fax +39-02.23998492 e-mail [email protected]
SOMMARIO
Il presente lavoro illustra un metodo per l’identificazione della posizione e della profondità di una
cricca trasversale in un rotore a partire da misure di vibrazione. Come noto da misure in campo e
dalla letteratura, la presenza di una cricca trasversale altera il comportamento dinamico del rotore
generando in un albero ad asse orizzontale vibrazioni periodiche con componenti 1x, 2x e 3x giro.
Un approccio diagnostico basato sul modello del sistema ed un metodo di identificazione mediante
il metodo dei minimi quadrati nel dominio delle frequenze vengono utilizzati per la localizzazione
della cricca. La profondità della stessa viene invece determinata mediante il confronto tra il
momento flettente statico dovuto al peso del rotore ed alle condizioni di allineamento dei cuscinetti
ed il momento flettente periodico “equivalente” identificato che simula la presenza della cricca. La
validazione del metodo proposto viene quindi effettuata sia staticamente sia dinamicamente
mediante risultati sperimentali ottenuti su un test-rig.
ABSTRACT
This paper introduces a method for the identification of the position and the depth of a transverse
crack in a rotor system, by using vibration measurements. As it is reported in literature and from
field experience, a transverse crack modifies the dynamic behaviour of the rotor, generating in a
horizontal axis shaft periodical vibrations with 1x, 2x and 3x rev. components. A model based
diagnostic approach and a least squares identification method in the frequency domain are used for
the crack localisation along the rotor. The crack depth is calculated by comparing the static bending
moment, due to the rotor weight and to the bearing alignment conditions, to the identified
“equivalent” periodical bending moment, which simulates the crack. Finally, the validation of the
proposed method is carried out statically and dynamically by means of experimental results
obtained on a test-rig.
Keywords: Cracks, Identification, Rotating shafts, Vibrations.
INTRODUCTION
Propagating transverse cracks have been discovered in the last 20 years [1] in several rotors of
steam turbines or generators of European power plants. Fortunately, as far as the authors know, they
have been detected before the crack had propagated to a critical depth, that means before the
occurrence of a catastrophic failure. The cracked rotors have then been removed and inspected and
spare rotors could generally be installed, limiting this way the damage to the cost of the rotor and of
the loss of production only during overhaul.In many cases however the crack had propagated to a depth of 50% of the diameter, in some cases
up to 75%. In these situations only 50% or about 20% respectively of the cross sectional area was

8/16/2019 Self Archive Crack
http://slidepdf.com/reader/full/self-archive-crack 4/17
3
COPY
left for transmitting forces and moments. Due to the rapidly increasing crack propagating rate,
probably a catastrophic failure with a possible total damage of the plant would have occurred,
within only few hours or days of operation at full speed.
The importance of early detection of cracks, possibly by means of an automatic diagnostic
methodology instead of a vibration specialist’s expertise, appears obvious from these
considerations.Many authors have studied the dynamic behaviour of rotors with transverse crack (an extensive
survey is given in [2] and a recent contribution is in [3]) and therefore the symptoms of a cracked
rotor are well known: a change in 1x rev., 2x rev. and 3x rev vibration vector (amplitude and phase)
is suspect. In fact the presence of a crack and its propagation determine a local reduction of the
rotor stiffness along with a change in the rotor natural frequencies. A change in natural frequency
depending on the angular position of the rotor is a symptom of a crack, but this change is generally
small and difficult to detect. Actually this phenomenon is rather complicate, since during the
rotation the crack “breaths”, i.e. the mechanism of opening and closing of the crack is ruled by the
stress acting on the cracked section due to the external loads; in a rotor the stress are time depending
with a period equal to the period of rotation, thus the crack “periodically breaths”. However, 1x rev.
components can be caused by many other faults (e.g. unbalance, bow, coupling misalignments) and2x rev. components can be due also to polar stiffness asymmetries (in generators), to surface
geometry errors (journal ovalization) and to non-linear effects in oil film bearings. These two last
causes can also generate 3x rev. components.
Therefore, it is not easy to attribute these symptoms with certainty to a developing crack.
Furthermore when the developing crack is in an early stage, the changes in vibration are generally
so small and masked by noise that they are difficult to be detected from the bearing measurements.
Finally, it is worth noting that also the position of the crack strongly influences the change of the
vibration. Only for cracks in positions along the shaft line in which high static bending moments act
(due to weight and bearing reaction forces), the generated vibrations in the bearings are consistent.
When the bending moment in correspondence of the crack is small, also the resulting vibrations are
small and might be unrecognisable.
Fortunately another symptom helps to identify a crack: that is the thermal behaviour. During a
heating transient of the surrounding fluid (e.g. steam in a steam turbine or cooling gas in a
generator) the outer surface, the “skin”, of the rotor has a higher temperature, with respect to the
mean temperature; this causes elongation and compressive stresses which force the crack to close:
the crack is prevented from breathing or the breathing is reduced. As a consequence, the crack
induced 1x rev. and 2x rev. components are reduced.
A cooling transient effects tensile stresses in the skin, which force the crack to open: the rotor bows,
a change in 1x rev. component appears due to the bow, and an increase in 2x rev. component
appears due to the crack, which could be held completely open by the tensile stresses. Also in this
case the crack is prevented from breathing or the breathing is anyhow reduced. These symptomsduring thermal transients allow the identification of the transverse crack with certainty. In two
different turbogenerator groups in Italian power plants, the transverse crack in a HP steam turbine
and in a 320 MW generator could be detected thanks to this particular thermal sensitivity.
Once the type of fault has been identified in a shaft line, also its most probable position and its
depth should be identified. The first task can be accomplished by means of the least square
approach in the frequency domain, which is described in the next paragraph, while the proposed
method for the depth identification is introduced in the following. Finally, dynamic and static tests
are used to validate the proposed method.
8/16/2019 Self Archive Crack
http://slidepdf.com/reader/full/self-archive-crack 5/17
4
COPY
THE IDENTIFICATION METHOD
The identification procedure can be performed as usual by means of causality correlations of
measurable symptoms to the faults. Two main approaches can be used, as described in [4]. In the
first approach, the symptoms can be defined using qualitative informations, based on human
operators’ experience, which creates a knowledge base. An expert system can then be built up inwhich different diagnostic reasoning strategies can be applied. Fault-symptom matrices,
fault-symptom trees, if-then rules or fuzzy logic classifications can be used to indicate in a
probabilistic approach the type, and sometimes also the size and the location of the most possible
fault. Also artificial neural networks (ANN) can be used for creating the symptom-fault correlation.
This qualitative diagnostic approach is widely used both in industrial environments and in advanced
research work.
A different approach is the so-called model based fault detection method. In this case a reliable
model of the system or of the process, is used for creating the symptom-fault correlation, or the
input-output relation. The fault detection can then be performed by means of different approaches,
according to the nature of the system under observation:
• parameter estimation, when the characteristic constant parameters of the process, or of thecomponents are affected by the fault.
• state estimation , when the constant parameters are unaffected by possible faults, and only the
state of the system, which is represented by a set of generally unmeasurable state variables
(function of time), is affected by the faults; in this case the model acts as a state observer.
• parity equations, when the faults affect some of the unmeasurable input variables, the
parameters are constant, and only output variables are measured and compared with calculated
model output variables.
Therefore, the fault can be identified from parameter or state estimation or from parity equations.
This last approach is used in the model based identification procedure described in this paper in
which the input variables are the exciting forces and the output variables are the vibrations; the
procedure requires the model definition of the elements (rotors, bearings, supporting structure) that
compose the rotor system. A finite beam element model is assumed for the rotor, the bearings are
represented by means of their stiffness and damping matrices (therefore non-linear oil film effects
are neglected), while several representation can be given for the foundation, such as modal,
elasto-dynamic matrix or lumped springs and dampers.
Also the effect of the faults has to be modelled and this is done by introducing an equivalent system
of external forces and moments. In fact, in the parameter estimation approach, the identification of
the changes in the system parameters (such as the stiffness of the rotor system in the case of the
crack) seems to be a more difficult task than the identification of the equivalent external forces,
because the system parameters influence generally the complete mass, stiffness and damping
matrices of the system. In other words, with reference to the standard matrix equation of the system)(t
t t t FxKxDxM =++ (1)
it seems difficult to identify the changes in the matrices M , D , and K from measurement of
vibration xt , in only few measuring points along the shaft, such as occurs in real machines. Let’s
indicate by d M, d D and d K the changes in mass, damping and stiffness matrices due to system
parameter changes caused by the developing fault. Eq. (1) yields:
( ) ( ) ( ) ( ) t i
ut t t e M U d d d Ω++=+++++ WxKKxDDxMM (2)
in which the r.h.s. external forces F(t ) are generally unknown, because they are composed by the
weight (which is known) and by the original unbalance and bow (which are unknown). Despite the
fact that the crack behaviour is influenced also by the vibrations experienced by the rotor, which
make the system non-linear, in horizontal heavy rotors the crack behaviour is dominated by the
static deflection due to the weight, so that the non-linearity can be neglected. If the system is

8/16/2019 Self Archive Crack
http://slidepdf.com/reader/full/self-archive-crack 6/17
5
COPY
considered to be linear, then the vibration xt can be considered to be split in two parts which can be
simply superposed:
xxx += 1t (3)
The first vibration vector (x1) is due to the weight W and the unknown unbalance force U eiΩt and
unbalance moment M u eiΩt , and the second (x) is due to the developing fault. The component x may be obtained by calculating the vector differences of the actual vibrations (due to weight, original
unbalance and fault) minus the original vibrations measured, in the same operating conditions
(rotation speed, flow rate, power, temperature, etc.) before the fault was developing. Recalling the
definition of x1, the pre-fault vibration, the following equation holds:
( ) t i
ue M U Ω++=++ WxKxDxM 111
(4)
which substituted in eq. (2) gives:
t t t d d d xKxDxMxKxDxM −−−=++ (5)
The r.h.s. of eq. (5) can be considered as a system of equivalent external forces which force thefault-free system to have the change in vibration defined by x that is due to the developing fault
only:
)(t f FxKxDxM =++ (6)
Using this last approach, the problem of fault identification is then reduced to a force identification
procedure with known system parameters. Keeping in mind that the final goal is the identification
of faults, this approach is preferred since only few elements of the unknown fault forcing vector are
in reality different from zero, which reduces sensibly the number of unknowns to be identified.
Infact the fault forces are considered to be applied in not more than two different nodes along the
rotor. If we consider a steady-state situation, assuming linearity of the system and applying the
harmonic balance criteria from eq. (6), we get, for each harmonic component, the equations
n f nnin FXKDM =+Ω+Ω− 2)( (7)
where the force vectorn f F , has to be identified. Few spectral components in the frequency domain
(generally not more than 3) Xn measured in correspondence of the bearings, represent completely
the periodical vibration time history. Moreover, the fault acts on few d.o.f. of the system, so the
vectorn f F is not a full-element vector which is convenient to be represented by means of a complex
value A and a localisation vector [F L]: e.g. the complex vector, which models the unbalance hasonly the 1x rev. component and the following representation:
[ ] Aemr i L
i
f ][00010 2T
1FF =Ω⋅= ϕ
(8)
where the only elements different from zero are the ones relative to the horizontal and vertical d.o.f.
of the node j, where the unbalance is supposed to be applied. Further details about the model of the
faults are reported in [5].
In the case of a transverse crack the approach according eq. (5) is convenient, where only d K is
different from zero. It has been shown [6] that a crack can be modelled by a suitable system of
external forces or couples, which depend on the depth of the crack and of the bending moment
which is applied to the rotor in the cracked section. Due to the “breathing” mechanism of the crack
during the rotation, the stiffness matrix is periodic and its Fourier expansion can be truncated at the
third harmonic component.

8/16/2019 Self Archive Crack
http://slidepdf.com/reader/full/self-archive-crack 7/17
6
COPY
t it it i
meeet ΩΩΩ ∆+∆+∆+=Ω 3
3
2
21)( KKKKK (9)
The average term Km then appears at the l.h.s. of eq. (7), while the other terms generate 1x rev.,2x rev. and 3x rev. forces on the r.h.s. of eq. (7), which can be rewritten in the following form,
using an harmonic balance approach:
( ) 3,2,1)( 2 =+∆−=+Ω+Ω− ΩΩΩ neeenin t in
nst
t in
n
t in
nm XXKXKDM (10)
The equivalent force system (on the r.h.s. of eq. (10)) is applied to the two nodes of the element
which contains the crack and is therefore composed by a vector of eight generalized forces (in case
of 4 d.o.f. per node model). Among these forces it results from energy considerations that the most
important are the bending moments which are rotating and roughly equal and opposite on the two
nodes. Therefore the unknowns are reduced to one bending moment M n only for each harmonic
component. The localisation vector [F L] and A have the following expressions:
[ ] [ ] 3,2,1,)(01001000T
==−−= ne M n Aii in
n L
ϕ F (11)
Now eq. (7) can be rewritten, for each harmonic component, in the following way:
( )[ ]n f n
n FXE =Ω (12)
where ( )[ ]ΩnE is the system dynamic stiffness matrix for the speed Ω and for the nth harmonic
component. This matrix can be inverted and eq. (12) becomes
( )[ ]nn f n f n
n FFEX ⋅=⋅Ω= −
1 (13)
where n is the inverse of ( )[ ]ΩnE . Reordering in a opportune way the lines in eq. (13), by
partitioning the inverse of the system dynamic stiffness matrix, we obtain:
⋅=
⋅=
nnn
nnn
f A A
f B B
FX
FX
(14)
wheren BX is the complex amplitude vector representing the measured absolute vibrations in
correspondence of the bearings andn AX is the vector of the remaining d.o.f. of the rotor system
model.
Using the first set of Eqs. (14), the differences n, between calculated vibrationsn BX and measured
vibrationsn BmX can be defined, for each harmonic component, as:
nnnnn Bm f B Bm Bn XFXX −⋅=−= (15)
The number of equations n E (number of measured d.o.f.) is lower than the number nF (number of
d.o.f. of the complete system model) which is also the number of elements ofn f F . But, as said
before,n f F becomes a vector with many null-elements so that the number of unknown elements of
n f F is smaller than the number of equations. The system therefore has not a single solution for all
the equations and we have to use the least square approach in order to find the solution (identified
fault) that minimise the differences which are calculated for all the different rotating speeds which
are taken into consideration.
A scalar relative residual may be defined by the root of the ratio of the squared n, divided by the
sum of the squared measured vibration amplitudesn BmX :

8/16/2019 Self Archive Crack
http://slidepdf.com/reader/full/self-archive-crack 8/17
7
COPY
[ ] [ ]
−⋅−⋅=
nn
nnnnnn
n
Bm Bm
Bm f B Bm f B
r XX
XFXF
T
T
δ (16)
By means of the hypothesis of localisation of the fault, the residual is calculated for each possible
node of application of the defect.Where the residual reaches its minimum, there is the most probable position of the fault. The
relative residual gives also an estimate of the quality of the identification, since it results the closer
to zero the better the identified fault corresponds to the actual one; this follows easily from the
analysis of the numerator of eq. (16).
In the case of the crack, it is worth noting that the 1x rev. vibration components are due both to the
breathing mechanism of the crack and to a local bow that generally has developed during the crack
propagation. Therefore, when no other sources of bow are present, the 1x rev. component is useful
for the localisation of the crack, but not for the identification of its depth.
The 3x rev. component is rather small and generally masked by some noise. Often this component
can be recognised only when approaching the resonant condition at a rotating speed equal to 1/3 the
rotor’s critical speed. This may be an interesting symptom of the presence of a crack, but isgenerally insufficient for identfying its position and depth.
The 2x rev. component is therefore the most suitable symptom for detecting position and depth of
the crack; the highest values are obviously reached during a run-down transient when approaching
the resonant condition at 1/2 critical speed.
IDENTIFICATION OF THE CRACK DEPTH
Let’s consider now the beam element in which the presence of a crack has been identified as most
probable (with the lowest relative residual): the least square approach provides also the values of
the equivalent bending moments M 1, M 2 and M 3 from corresponding 1x, 2x and 3x rev. measured
vibration components.Then the static bending moment M in correspondence of the same element, due to the weight and to
bearing alignment conditions, is calculated from model data. Defining p the relative depth of the
crack with rectilinear tip, according to Figure 1, in [4,5] it has been shown that the ratio of the
nx rev. equivalent bending moment M n to the static bending moment M is a function of the relative
depth p only.
This is represented in Figure 2 for the 1x, 2x and 3x rev. component and expressed by the
relationship in eq. (17).
)( p f M
M n =
(17)
In Figure 2 also the ratio for the 2x rev. component in the case of a always open (non “breathing”)
crack, which can be considered a slot, is shown.
This relationship has been obtained by analysing the breathing behaviour of cracks with rectilinear
tips, as that one shown in Figure 1, in rotors in steady state thermal conditions. Different shapes will
cause slightly different behaviours. The presence of a thermal transient that influences the
“breathing” mechanism, will also cause different behaviours.
D p=d/D
d
Figure 1 Crack with rectilinear tip.

8/16/2019 Self Archive Crack
http://slidepdf.com/reader/full/self-archive-crack 9/17
8
COPY
Eq. (17) can then be used for determining the crack depth, under the assumption that the crack has a
rectilinear tip and that the rotor is in steady state thermal condition. But, as shown in [5], the length
lc of the “equivalent”, reduced stiffness, beam element that simulates the behaviour of the cracked
beam, is also depending on the relative crack depth p:
)( pg D
lc
= (18)
The function g( p) is represented in Figure 4.
0
0.5
1
1.5
2
2.5
3
M M / M M /
M M /
M M /
1
2
3
2 slot
0% 5% 10% 15% 20% 25% 30% 35% 40% 45% 50%
Crack relative depth
M
/ M n
Figure 2 Ratio of the bending moments on the
equivalent cracked beam, as a function of
crack relative depth.
M
M
x
x
st
n
n
Figure 3. Typical bending moments and
deflections for a symmetrical rotor on 2
bearings, with a crack at mid span.
0
0.1
0.2
0.3
0.4
0.5
0.6
0% 5% 10% 15% 20% 25% 30% 35% 40% 45% 50%
Crack relative depth
l
D
/
c
Figure 4. Relationship between the crack
relative depth p, the diameter D and the
length l c of “equivalent” beam.
0
0.2
0.4
0.6
0.8
1
1.2
1.4
1.6
f p g p( ) ( ) 1x rev. f p g p( ) ( ) 2x rev. f p g p( ) ( ) 3x rev.
0% 5% 10% 15% 20% 25% 30% 35% 40% 45% 50%
Crack relative depth
f p g p
(
)
(
)
Figure 5. Function for the calculation of the
crack depth.
Now we have the equivalent bending moments M n which are applied to an element with a wrong
length: l instead of lc. It is worth noting that the nx rev. measured displacements are due to the
relative rotation of the cracked element extremity nodes, which is proportional to the product M n⋅l
of the identified nx rev. bending moment component applied to one element of the f.e. model of the
rotor, multiplied by its length.
The equivalent bending moment component M ′n, applied to an equivalent cracked beam element of
length lc, can therefore be calculated by imposing some relative rotation, as:
l M l M ncn ⋅=⋅′ (19)
By assuming that the static bending moment M applied to the original element of length l does not
change much along the element (see e.g. Figure 3 in which typical bending moments and related

8/16/2019 Self Archive Crack
http://slidepdf.com/reader/full/self-archive-crack 10/17
9
COPY
deflections are represented), the same M can be considered applied to the element with equivalent
length lc.
Recalling eq. (17) we can derive:
)( p f
l M
l M
M
M
c
nn =⋅
⋅=
′
(20)
and using eq. (18) we get:
)()( pg p f D M
l M n ⋅=⋅
⋅
(21)
Eq. (21), shown in Figure 5 for the 1x, 2x and 3x rev. components and the 2x rev. slot, can then be
used for determining, from the known left hand side, the relative depth of the crack.
EXPERIMENTAL TESTS
Test rig descriptionThe MODIAROT test rig, shown in Figure 6, is composed by two rigidly coupled rotors, supported
on four lemon shaped oil film bearings, driven through a flexible coupling by a variable speed
inverter controlled electric motor. The shaft diameter is 25 mm and the total length of the two rigid
coupled shafts is about 2 m, the total mass is less than 100 kg. The critical speeds are around
1200 rpm (1st) and 3400 rpm (2nd ). The supporting structure is flexible and has several natural
frequencies in the operating speed range (a resonance is around 2000 rpm). The vibrations in each
bearing are measured by 2 eddy-current proximity probes fixed to the bearing housing in ±45°
directions with respect to the vertical, measuring the shaft relative displacements. Each bearing
housing is equipped with 2 accelerometers measuring the absolute vibrations of the bearing
housing. By rotating the reference frame and adding the absolute displacement of the bearinghousing, the absolute vibrations of the shaft in correspondence of the bearing can be obtained and
compared with calculated results. All signals during a run-down transient were analyzed by a 8
channel spectrum analyzer in tracking filter modality. This heavy processing of the experimental
data introduced significant errors in the experimental data, as will be shown later.
Figure 6. 4-bearing 2-shaft MODIAROT test rig on flexible foundation with fully
instrumented bearing housing.
A crack with estimated depth ranging from 25% to 30% of the shaft diameter has been generated by
means of fatigue bending solicitation in the middle of the longer shaft, starting from a very small
slot (Figure 7). The tests have been carried out on both the quasi-static and the dynamic behaviour.In the first case, the longer shaft has been disassembled and positioned on supports or on a lathe.

8/16/2019 Self Archive Crack
http://slidepdf.com/reader/full/self-archive-crack 11/17
10
COPY
x
y
Cracked area
Slot
Figure 7. Supposed crack profile.
Natural frequencies
Different values of natural frequencies should be found in cracked rotors, depending on its angular
position and therefore on the “open” or “closed” situation of the crack.The frequencies corresponding to a complete open crack and to a complete closed crack have been
calculated, assuming a stiff supporting structure and measuring its natural frequencies with impact
tests, in the configuration shown in Figure 8 and Figure 9.
Figure 8 Experimental simulation of the
ideal support (particular of an extreme of
the shaft).
Accelerometer 1 Accelerometer 2
Figure 9 Shaft position on the two supports and
location of the accelerometers.
Table 1 summarises the comparison between the experimental results and the frequencies calculated
with the model proposed in [6]. The agreement is rather good, giving a first confirmation to the
validity of the proposed model.
CrackExperimental Calculated (25%) Calculated (30%)
1st 2nd 1st 2nd 1st 2nd
Closed 12.725 59 12.30 59.04 12.30 59.04
Open 12.425 59 12.14 59.04 12.06 59.04
Table 1 - Natural frequencies (in Hz) of the 1st and 2nd modes.
The experimental values, which were measured with a resolution of ±0.025 Hz, show a variation in
natural frequencies of roughly 2.3%. The calculated values instead have a variation of 1.30% for25% depth and 1.93% for 30% depth. No variation at all has been found for the 2 nd mode since the

8/16/2019 Self Archive Crack
http://slidepdf.com/reader/full/self-archive-crack 12/17
11
COPY
crack, located in correspondence of the node of the mode shape, does not affect its bending stiffness
(or modal stiffness).
Quasi-static Behaviour
The cracked shaft, equipped with its massive disks, was mounted on a lathe and 4 proximity probes
have been installed according to Figure 10 on a movable frame. The sensor signals have beenrecorded during slow rotation in 11 positions along the shaft and analysed.
Figure 10. Proximitor arrangement on the
PdM test rig.
B C
Ovalization effect
B C
Crack effect
Figure 11. 2x rev. components.
The sensors in opposite positions allow to separate 2x rev. component geometric errors (shaft
ovalization) from 2x rev. component due to the crack: the sum indicates twice the ovalization, the
difference twice the 2x rev. displacement (Figure 11).
The vertical and horizontal 2x rev. should be equal, according to the results of the model as exposed
in [6]. The measured displacements have been compared with those calculated with the simplified
model, for a depth of 24%: these comparisons are shown in Figure 12 and Figure 13 for the
horizontal and vertical components. The 2x rev. measured deflection is rather linear, except for the
small cracked element, and fits very well with the calculated deflection.
mandrel tailstock
0
10
M o d u l e
[ m ]
µ
P h a s e [ d e g r e e s ]
20
0 200 400 600 800 1000 1200
crack
-180
-90
0
90
180
Exper.Sim. 24%
Rotor length [mm]
Horizontal displacements
Figure 12 2x rev. component in horizontal
direction due to the crack. Comparison
between experimental and calculated results.
mandrel tailstock
crack
Exper.Sim. 24%
0 200 400 600 800 1000 1200
0
10
M o d u l e
[ m ]
µ
P h a s e [ d e g r e e s ]
Rotor length [mm]
20
-180
-90
0
90
180
Vertical displacements
Figure 13 2x rev. component in vertical
direction due to the crack. Comparison
between experimental and calculated results.
These results validate the model of the “breathing” mechanism, the model of the equivalent beam
and the calculation procedure proposed in [6].

8/16/2019 Self Archive Crack
http://slidepdf.com/reader/full/self-archive-crack 13/17
12
COPY
With regard to the other harmonic components, the 1x rev. component is masked by a high static
bow, while the 3x rev. component is so small that its presence is masked by geometric surface
errors and by the measuring errors.
The displacement values of the 2x rev. components, for all the 11 measuring points, have been used
for the identification procedure. The results obtained are shown in Figure 14.
The location of the suspected crack is identified with good accuracy, and also its depth is identified.The high quality of the identification is measured by the low value of the residual ( δ = 0.182). The
good identification results are probably due to the high number of measuring stations (11), which
allows to define very well the deflection shape.
0.2
0.4
0.6
0.8
1
Crack residual (2 x rev. comp.)
Resid ual: 0.182 Mo dul us: 3.56e+000
Phase: 2.8 (+180)Element: 18
Crack depth: 24.2 %
crack
Figure 14 Crack identification in quasi-static case.
Dynamic Behaviour
The same cracked shaft, installed in the test rig, shows at low speed vanishing small 2x rev.
components in the bearings, which are completely masked by 2x rev. ovalization errors in the shaft
journals.The experimental results obtained in the bearings (e.g. in bearing 3) are shown in Figure 15 for the
1x rev. component, where a high bow is recognisable, in Figure 16 for the 2x rev. component,where a high ovalization error is recognisable and in Figure 17 for the 3x rev. component, where the
amplitude of 2 µ m is exceeded only when passing through a resonance.
400 600 800 1000 1200 1400 1600 1800 20000
20
40
60
80or zon a an ver ca sp acemens, ear ng , x rev. comp.
[rpm]
400 600 800 1000 1200 1400 1600 1800 2000
-100
0
100
[rpm]
[ m ]
µ
[ d e g r e e s ]
HorizontalVertical
Figure 15 Experimental displacements at
bearing 3, 1x rev. component of cracked shaft.
400 600 800 1000 1200 1400 1600 1800 20000
10
20
30
40Horizontal and vertical displacements, bearing 3, 2 x rev. comp.
[rpm]
400 600 800 1000 1200 1400 1600 1800 2000
-100
0
100
[rpm]
m µ
e g r e e s
HorizontalVertical
Figure 16 Experimental displacements at
bearing 3, 2x rev. component of cracked shaft.
The previously stored 2x rev. components of the uncracked rotor have been subtracted from the
actual vibrations and the 2x rev. vibration differences are represented in Figure 18. It can be seenthat the crack induced 2x rev. components in the bearings are affected by errors due to the heavy
processing of the experimental data. Also the data below 550 rpm were lost.
8/16/2019 Self Archive Crack
http://slidepdf.com/reader/full/self-archive-crack 14/17
13
COPY
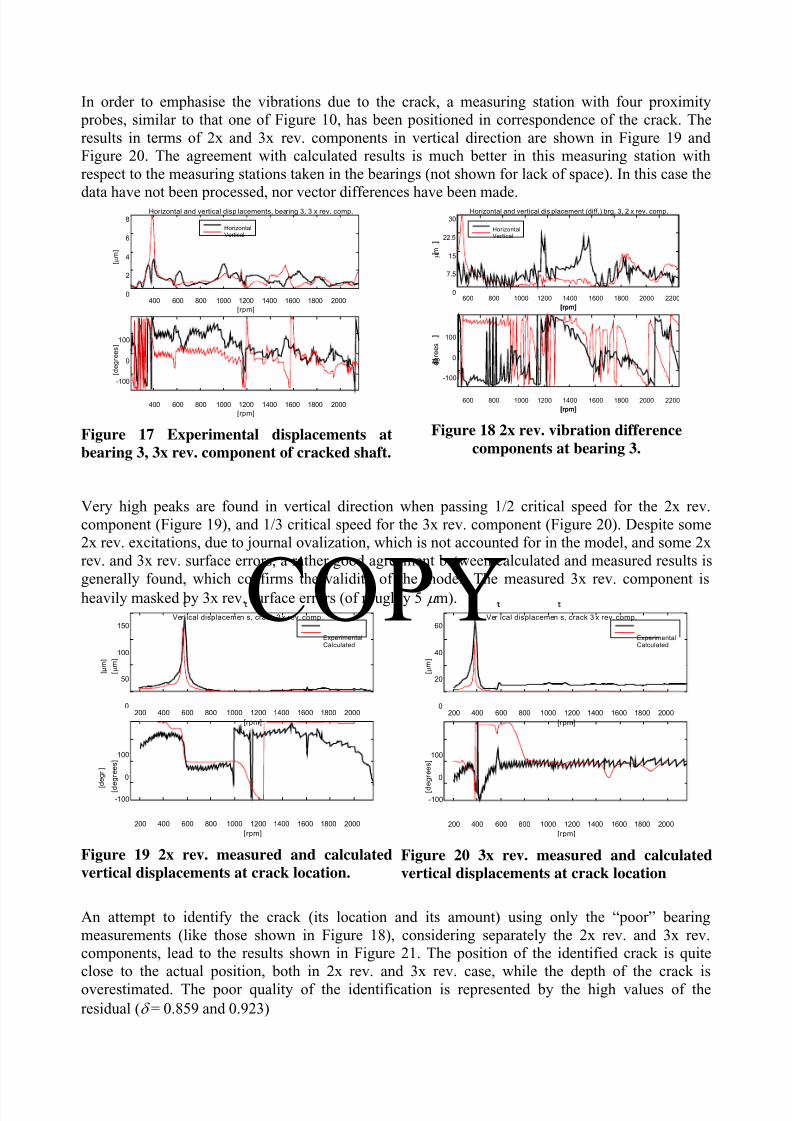
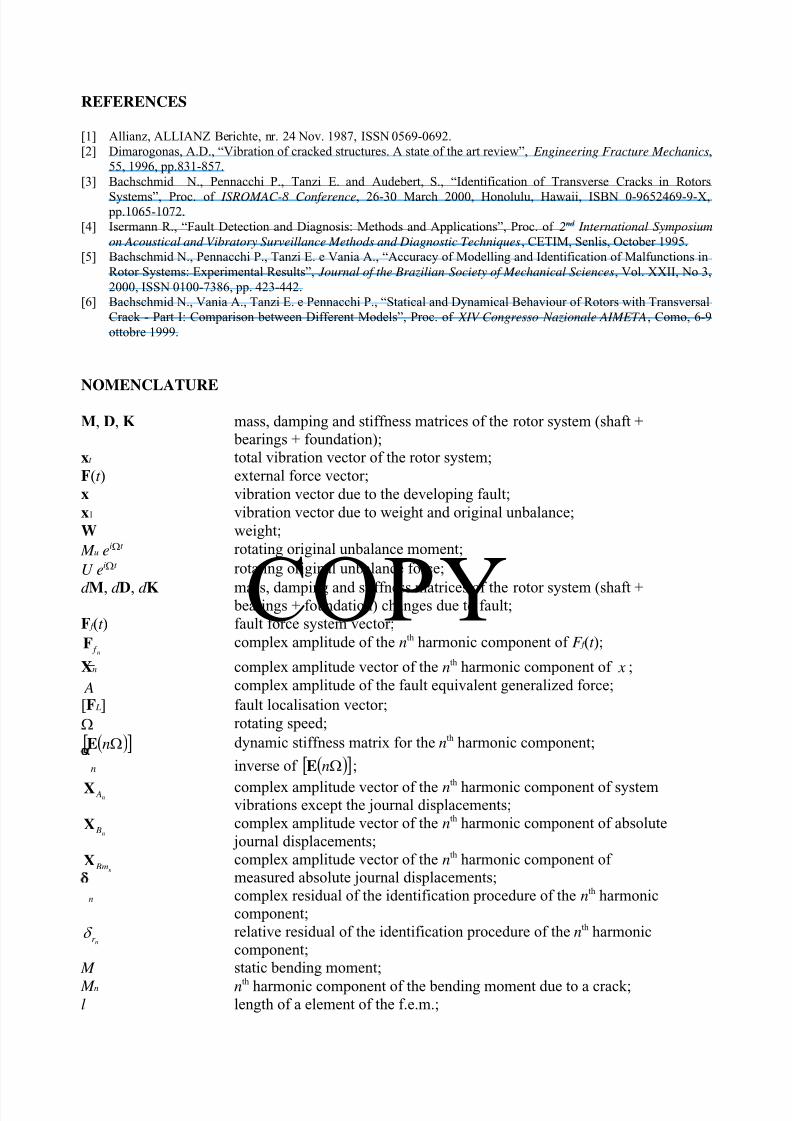
In order to emphasise the vibrations due to the crack, a measuring station with four proximity
probes, similar to that one of Figure 10, has been positioned in correspondence of the crack. The
results in terms of 2x and 3x rev. components in vertical direction are shown in Figure 19 and
Figure 20. The agreement with calculated results is much better in this measuring station with
respect to the measuring stations taken in the bearings (not shown for lack of space). In this case the
data have not been processed, nor vector differences have been made.
400 600 800 1000 1200 1400 1600 1800 20000
2
4
6
8Horizontal and vertical disp lacements, bearing 3, 3 x rev. comp.
[rpm]
400 600 800 1000 1200 1400 1600 1800 2000
-100
0
100
[rpm]
[ m ]
µ
[ d e g r e e s ]
HorizontalVertical
Figure 17 Experimental displacements at
bearing 3, 3x rev. component of cracked shaft.
0
7.5
15
22.5
30Horizontal and vertical dis placement (diff.) brg. 3, 2 x rev. comp.
[rpm]
-100
0
100
[rpm]
HorizontalVertical
600
600
800
800
1000
1000
1200
1200
1400
1400
1600
1600
1800
1800
2000
2000
2200
2200
[rpm]
m µ
e g r e e s
[rpm]
Figure 18 2x rev. vibration difference
components at bearing 3.
Very high peaks are found in vertical direction when passing 1/2 critical speed for the 2x rev.
component (Figure 19), and 1/3 critical speed for the 3x rev. component (Figure 20). Despite some
2x rev. excitations, due to journal ovalization, which is not accounted for in the model, and some 2x
rev. and 3x rev. surface errors, a rather good agreement between calculated and measured results is
generally found, which confirms the validity of the model. The measured 3x rev. component isheavily masked by 3x rev. surface errors (of roughly 5 µ m).
200 400 600 800 1000 1200 1400 1600 1800 20000
50
100
150Ver ical displacemen s, crack 2 x rev. comp.
[ µ m ]
[rpm]
200 400 600 800 1000 1200 1400 1600 1800 2000
-100
0
100
[ d e g r . ]
[rpm]
[ m ]
µ
[ d e g r e e s ]
ExperimentalCalculated
Figure 19 2x rev. measured and calculated
vertical displacements at crack location.
200 400 600 800 1000 1200 1400 1600 1800 20000
20
40
60Ver ical displacemen s, crack 3 x rev. comp.
[rpm]
200 400 600 800 1000 1200 1400 1600 1800 2000
-100
0
100
[rpm]
[ m ]
µ
[ d e g r e e s ]
ExperimentalCalculated
Figure 20 3x rev. measured and calculated
vertical displacements at crack location
An attempt to identify the crack (its location and its amount) using only the “poor” bearing
measurements (like those shown in Figure 18), considering separately the 2x rev. and 3x rev.
components, lead to the results shown in Figure 21. The position of the identified crack is quite
close to the actual position, both in 2x rev. and 3x rev. case, while the depth of the crack isoverestimated. The poor quality of the identification is represented by the high values of the
residual (δ = 0.859 and 0.923)

8/16/2019 Self Archive Crack
http://slidepdf.com/reader/full/self-archive-crack 15/17
14
COPY
Neverthless this result can be deemed as good, considering the poor agreement between
experimental and theoretical results, due to errors in processing the experimental data, and to the
lack of experimental data in the lower speed range, where the 2x rev. and 3x rev. resonances
amplify the corresponding vibration components. By considering also the measurements taken at
crack location, which is unrealistic in plant operating machines, higher accuracy in location and
depth is expected as shown for the 2x rev. component in Figure 22.
0.8
0.85
0.9
0.95
1
Crack residual (2 x rev. and 3 x rev. comp.)
Residual: 0.8592 x rev.:
2 x rev.3 x rev.
Modulus: 3.69e+000Phase: -107.3 (+180)Element: 33
Crack depth: 39.9 %
Residual: 0.9233 x rev.: Modulus: 6.35e-001
Phase: 100.0 (+180)Element: 33
crac
Crack depth: 31.5 %
Figure 21 Identification of the crack with 2x rev. and 3x rev. components.
Crack residual (2 x r ev. comp.)
Res id ual : 0.599 Mo du lus : 4.53e+000Phase: 153.4 (+180)Element: 36
Crack depth: 35.9 %
Crac
Figure 22 Identification of the crack with 2x rev. using also the measurements in the crack
position.
CONCLUSIONS
In this paper, a model for the identification of both the location and the depth of a crack in a rotor
has been presented. The least square identification method in the frequency domain has been used
to determine the position of the crack and the equivalent bending moments due to the crack. Theratio of these bending moments to the static bending moment, in correspondence of the same
element, due to the weight and to bearing alignment conditions, allows to determine the crack
relative depth. The experimental data relative to both the static and dynamic behaviour of cracked
rotor in a test-rig have been used to validate the proposed method.
ACKNOWLEDGEMENTS
This work is partially funded by the MURST (Italian Ministry for the University and Scientific
Research) Cofinanziamento “IDENTIFICAZIONE DI MALFUNZIONAMENTI IN SISTEMI MECCANICI” for
the year 1999.
8/16/2019 Self Archive Crack
http://slidepdf.com/reader/full/self-archive-crack 16/17
15
COPY
REFERENCES
[1] Allianz, ALLIANZ Berichte, nr. 24 Nov. 1987, ISSN 0569-0692.
[2] Dimarogonas, A.D., “Vibration of cracked structures. A state of the art review”, Engineering Fracture Mechanics,
55, 1996, pp.831-857.
[3] Bachschmid N., Pennacchi P., Tanzi E. and Audebert, S., “Identification of Transverse Cracks in Rotors
Systems”, Proc. of ISROMAC-8 Conference, 26-30 March 2000, Honolulu, Hawaii, ISBN 0-9652469-9-X, pp.1065-1072.
[4] Isermann R., “Fault Detection and Diagnosis: Methods and Applications”, Proc. of 2nd International Symposium
on Acoustical and Vibratory Surveillance Methods and Diagnostic Techniques, CETIM, Senlis, October 1995.
[5] Bachschmid N., Pennacchi P., Tanzi E. e Vania A., “Accuracy of Modelling and Identification of Malfunctions in
Rotor Systems: Experimental Results”, Journal of the Brazilian Society of Mechanical Sciences, Vol. XXII, No 3,
2000, ISSN 0100-7386, pp. 423-442. [6] Bachschmid N., Vania A., Tanzi E. e Pennacchi P., “Statical and Dynamical Behaviour of Rotors with Transversal
Crack - Part I: Comparison between Different Models”, Proc. of XIV Congresso Nazionale AIMETA, Como, 6-9
ottobre 1999.
NOMENCLATURE
M, D, K mass, damping and stiffness matrices of the rotor system (shaft +
bearings + foundation);
xt total vibration vector of the rotor system;
F(t ) external force vector;
x vibration vector due to the developing fault;
x1 vibration vector due to weight and original unbalance;
W weight;
M u eiΩt rotating original unbalance moment;
U eiΩt rotating original unbalance force;
d M, d D, d K mass, damping and stiffness matrices of the rotor system (shaft + bearings + foundation) changes due to fault;
F f (t ) fault force system vector;
n f F complex amplitude of the nth harmonic component of F f (t );
Xn complex amplitude vector of the nth harmonic component of x ;
A complex amplitude of the fault equivalent generalized force;
[F L] fault localisation vector;
Ω rotating speed;
( )[ ]ΩnE dynamic stiffness matrix for the nth harmonic component;
n inverse of ( )[ ]ΩnE ;
n AX complex amplitude vector of the nth harmonic component of system
vibrations except the journal displacements;
n BX complex amplitude vector of the nth harmonic component of absolute
journal displacements;
n BmX complex amplitude vector of the nth harmonic component of
measured absolute journal displacements;
n complex residual of the identification procedure of the nth harmonic
component;
nr δ relative residual of the identification procedure of the nth harmonic
component;
M static bending moment; M n nth harmonic component of the bending moment due to a crack;
l length of a element of the f.e.m.;

8/16/2019 Self Archive Crack
http://slidepdf.com/reader/full/self-archive-crack 17/17
16
COPY
xst mean static deflection;
xn nth harmonic component of the deflection;
lc length of the “equivalent” reduced stiffness element;
D shaft diameter;
p crack relative depth;