self-assembly of 1-d organic semiconductor...
TRANSCRIPT

Self-assembly of 1-D organic semiconductor nanostructures
Thuc-Quyen Nguyen,*aRichard Martel,
bMark Bushey,
cPhaedon Avouris,
d
Autumn Carlsen,eColin Nuckolls
fand Louis Brus
f
Received 13th July 2006, Accepted 29th November 2006
First published as an Advance Article on the web 4th January 2007
DOI: 10.1039/b609956d
This review focuses on the molecular design and self-assembly of a new class of crowded
aromatics that form 1-D nanostructures via hydrogen bonding and p–p interactions. These
molecules have a permanent dipole moment that sums as the subunits self assemble into
molecular stacks. The assembly of these molecular stacks can be directed with electric fields.
Depending on the nature of the side-chains, molecules can obtain the face-on or edge-on
orientation upon the deposition onto a surface via spin cast technique. Site-selective steady state
fluorescence, time-resolved fluorescence, and various types of scanning probe microscopy
measurements detail the intermolecular interactions that drive the aromatic molecules to self-
assemble in solution to form well-ordered columnar stacks. These nanostructures, formed in
solution, vary in their number, size, and structure depending on the functional groups, solvent,
and concentration used. Thus, the substituents/side-groups and the proper choice of the solvent
can be used to tune the intermolecular interactions. The 1-D stacks and their aggregates can be
easily transferred by solution casting, thus allowing a simple preparation of molecular
nanostructures on different surfaces.
1. Introduction
The self-organization of small molecules into larger functional
nanostructures is a cornerstone of biological systems and is a
powerful tool to create novel materials with emergent or
amplified properties.1 Recently, there is increasing interest in
using elementary building blocks such as atoms and molecules
to form molecular wires or 1-D nanostructures in a controlled
and predictable fashion.2 Discotic liquid crystals,3 discovered
in 1977 by Chandrasekar and coworkers,4 are examples of
such systems. This class of materials self-assembles to form
arrays of columnar stacks. Individual stacks have been com-
pared to molecular wires because the column’s interior con-
sists of co-facially aromatic cores (conducting cores) while its
exterior is surrounded by a hydrocarbon chain (an insulating
layer).5 This arrangement of the aromatic cores yields useful
and interesting electronic and optic properties.6 For tradi-
tional discotics, the intermolecular interactions between the
subunits are weak due to the poor electrostatic attraction
between the electron rich p-surfaces.7 Several approaches havebeen used to increase the affinity between the molecules within
the columnar stack including metal–ligand interactions,8 re-
cognition of polymer strands,9 electrostatic complimentarity
between p-faces,10 and hydrogen bonds.11
Understanding self-assembly processes and the preferred
molecular arrangement of functional aromatic compounds
are prerequisites for achieving predictive models that take into
consideration the composition of the molecular components.
As an example, organic and polymeric semiconductors having
better order and packing density usually exhibit better elec-
trical conduction.12 A systematic investigation on the local
order properties of a given molecular design is therefore
important for making and improving organic semiconducting
assemblies, but a detailed investigation of the resulting struc-
ture of ordered assemblies remains challenging experimentally.
Scanning probe microscopy is now among the most powerful
techniques to probe the arrangement at a surface with sub-
nanometer resolution. Scanning tunneling spectroscopy
(STM) has been used widely to study the self-assembled
processes of aromatic molecules and alkyl thiols on metal
surfaces13 and molecules at the solid-liquid interface on highly
oriented pyrolytic graphite (HOPG) substrates.14 Atomic
force microscopy (AFM) is commonly used to probe surface
topography. Electrostatic force microscopy (EFM) is another
form of scanning probe microscopy that allows the simulta-
neous mapping of surface topography and electrostatic field
gradients. EFM has been employed to study trapped charge in
SiO2 layers15 and surface charge in semiconductors16 and
organic materials.17 A combination of proximal probe techni-
ques is however required in order to gain insights on the local
structure of the assembly and on the specific interactions
driving the assembly process.
This review discusses the assembly characteristics in solu-
tion and thin film of a new class of columnar discotic liquid
crystal materials that is held together with hydrogen bonds
and p–p interactions.18 These aromatic molecules are com-
posed of a 1-D stack of an aromatic core surrounded by a
hydrocarbon sheet. The core is a hexa-substituted aromatic (1
and 2 in Fig. 1) consisting of three meta-disposed amides that
aDepartment of Chemistry and Biochemistry, University of California,Santa Barbara, CA 93106. E-mail: [email protected]
bDepartement de Chimie, Universite de Montreal, Montreal, Quebec,Canada
c Scripps Research Institute, La Jolla, CA, USAd IBM Watson Research Center, Yorktown Heights, NY, USAePhysics Department, Albany University, Albany, NY, USAfChemistry Department, Columbia University, New York, NY, USA
This journal is �c the Owner Societies 2007 Phys. Chem. Chem. Phys., 2007, 9, 1515–1532 | 1515
INVITED ARTICLE www.rsc.org/pccp | Physical Chemistry Chemical Physics

are flanked by substituents other than hydrogen at each of the
remaining positions. Unlike traditional discotics, these mole-
cules stack to form molecular fibers due to a synergy between
p-stacking and hydrogen bonding to produce a relatively
strong association (molecule-to–molecule cohesion) in the
stacking direction but a comparatively weaker interaction
between fibers (Fig. 1A).18 The substituent, R0 (R00 for 2a), is
a long alkyl chain to ensure the solubility in common organic
solvents whereas R0 contains an amide group, which provides
a dipole moment and hydrogen bonding that contributes to
enhance the molecular cohesion in the stacking direction (Fig.
1). The substituents in the side groups (R0 and R00) can be used
to tailor the orientation of molecules on a surface and the
intermolecular distance within a fiber through steric interac-
tions.18c Monitoring the assembly of these mesogens in mono-
layer films by scanning probe microscopy has yielded films
with two orientations. In one surface conformation a two-
dimensional sheet results that is macroscopically polar (face-
on orientation, Fig. 2A). In the other orientation on the
surface, 1-D p-stacks result that are only a few molecules wide
but microns in length (edge-on orientation, Fig. 2B). The
length of the fibers formed on surfaces depends on the solvent,
the concentration as well as the underlying substrate. In the
bulk, these materials form highly regular and well-organized
columnar assemblies.18g In solution, fluorescence spectroscopy
gave clear indication that the underlying self-assembly process
produces 1-D stacks. The length of the fibers and their number
can be varied dramatically using different solvent and con-
centration. In ultra-thin films, 1b, 1c, 2a, and 2b assembles into
dipolar columns that have their long axes and dipole moments
parallel to the surface19 that can be directed with the electric
field. The self-assembly of molecules 1 and 2 on graphite was
examined by AFM, EFM, and ultrahigh vacuum (UHV)-
STM. There are six sections below describing the self-assembly
characteristics of 1 and 2: (1) the molecular design of this new
class of discotic crystals, (2) controlling the self-assembly by
functional groups, (3) the self-assembly in solution, (4) the
effects of solvents on the aggregation/self-assembly, (5) the
effects of concentration and temperature on the self-assembly,
and (6) the effects of the surface type on the self-assembly.
2. Molecular design
Although there are other examples of benzene rings that are
held cofacially by hydrogen bonds,20 the highly substituted
nature of these subunits gives rise to new nanostructures,
Fig. 1 Crowded aromatics and their energy minimized molecular models. Side-chains and hydrogens have been removed to clarify the view (in the
model: the R0 and R00 have been removed and red = oxygen; blue = nitrogen; grey = carbon).
Fig. 2 Schematic drawings of the face-on top view (A) and edge-on side view (B) orientation of hexa-substituted aromatics on graphite substrates.
Reprinted with permission from ref. 18c. Copyright 2004 American Chemical Society.
1516 | Phys. Chem. Chem. Phys., 2007, 9, 1515–1532 This journal is �c the Owner Societies 2007

unique polar properties, and unusual phase behavior. For the
molecules in Fig. 1, the design principle explored was how to
use the flanking alkoxy groups for 1 and alkynyl substituents
for 2 to force the amides out of the plane of the central
aromatic ring and into a conformation that is predisposed to
form three intermolecular hydrogen bonds.
Fig. 1 shows the energy-minimized dimeric models for both
1 and 2.18 The flanking alkoxyl groups for 1 and alkynl groups
for 2 force the amides out the plane of the central aromatic
ring and into a conformation that allows the formation of
three intermolecular hydrogen bonds. The size of the func-
tional groups determines the angle of twist for the amide out
of the aromatic ring plane and consequently modulates the
distance between adjacent benzene rings. From models, the
center-to-center distance between the benzene rings is ca. 3.8 A
for 1 and ca. 3.6 A for 2 reflecting the relative size of the
alkoxyl and the alkynyl groups. Additionally, each of the
subunits has a permanent dipole moment that is perpendicular
to the aromatic ring plane. The dipoles could sum as the
molecules stack yielding columns that have a macroscopic
dipole moment, similar to the moment that is seen for some
metallomesogens and conical liquid crystals.21 These polar
columns could be used as model systems to understanding
how polar properties emerge on the nanoscale as well as how
charges transport in 1-D nanostructures.
Because this class of discotic molecules was unknown before
the studies below were initiated, a large number of derivatives
were synthesized to establish the structure/property relation-
ships. The synthetic procedures were developed by the Nuck-
olls group. Bulk self-assemblies of 1 and 2 were studied by
X-ray diffraction. X-Ray diffraction studies of 1a show two
crystalline phases below 85 1C. Above 85 1C, a fluid phase
develops and at 120 1C, the diffraction pattern has reflections
that index to a rectangular lattice with parameters a = 38 A
and b = 22 A. Rectangular packing has been observed in
other columnar liquid crystals and results from a distortion of
the lattice. This distortion could arise because the side groups
are mismatched in size, which frustrates hexagonal packing, or
are bulky, which tilts or offsets the subunits.18a The diffraction
pattern of 1b at 200 1C is dominated by a single sharp peak at
low angle, signature of columnar assemblies. Up to fifth order
diffraction peak is seen that can be indexed to a hexagonal
lattice. The lateral core-to-core separation is 21 A as expected
for columns with noninterdigitating, extended side chains.18a
There is no X-ray diffraction data available for 1c.
Besides X-ray diffraction experiments, the assembly in bulk
of 1 is deduced from a combination of experiments including
polarized light microscopy, infrared spectroscopy, and differ-
ential scanning calorimetry.18 The results from these experi-
ments show that the assembly process is dominated by the size
and polarity of the amide side groups. Solution and thin film
studies via steady state and time-resolved spectroscopy and
scanning probe microscopy also support this conclusion. For
example when the amide substituents are relatively small and
flat, such as the phenyl substituents of 1b, the material
assembles into regular cylinders that are hexagonally-packed
into millimeter-scale domains. When the phenethyl side-chain
is exchanged for the t-butylester of glycine (1a), the material is
no longer able to stack into perfect cylinders and compensates
by positioning the subunits either canted or offset. These
misalignments produce a distorted hexagonal lattice for 1a.
Further magnifying this trend, when the amide substituent is
now changed to the t-butylester of D-alanine (now made even
bulkier!), there is no discernable mesomorphism in bulk
samples.
Although there is less data, it appears that the substituents
on the side-chains of 2 have less of an influence on the
mesomorphism. The X-ray diffraction patterns for bulk sam-
ples of 2a and 2b show a columnar assembly whose primary
reflection is 18.1 and 18.7 A, and the core-to-core distances are
2.14 and 2.09 A, respectively. For both cases, higher-order
reflections allow the lattices to be indexed to a 2-D hexagonal
arrangement of columns.18e The difference in stacking pro-
pensity between 1 and 2 is likely the result of the gear-like
arrangement of side-chains in 1 that is lacking in 2 due to the
linearity of the alkynl groups. Compounds 1, 2 and other
derivatives are soluble in common organic solvents such as
methylene chloride and chloroform. Typically, thin films are
formed by spin-coating a solution between 1000–1500 rpm
onto graphite substrates.
3. Controlling the self-assembly by functional
groups
The general hypothesis about the molecular design in discotic
systems is the following: larger p-core and more compact side
groups enhance p-stacking and reduce steric interactions,
thereby reducing the intermolecular distance between mole-
cules within the stack. The studies in this section test this
assumption using a series of different molecule design (Fig. 1)
and show that the packing order and the spacing between
molecules within a columnar stack depend strongly on the
functional groups. In principle, a better molecular control on
the assembly could favorably influence charge transport along
the columnar stack. Charge transport along the columnar
stack depends strongly on the degree of p-orbital overlap,
which is influenced by the intermolecular distance and the size
of the conducting core. The former is supported by recent
simulations, which show that a molecule-to–molecule distance
of less than 4 A could lead to band-like transport as oppose to
thermal activated hopping.22 The latter has been shown
experimentally by measuring the bulk charge mobilities of
six different discotic liquid crystalline materials as a function
of the core size.23
When these molecules self-assemble on a surface, they can
either adopt a face-on or edge-on orientations depending on
the functional groups. Fig. 2 shows the schematic drawing of
the two orientations. The face-on orientation leads to the
formation of patches or islands on surface (Fig. 2A) whereas
the edge-on orientation results in the formation of columnar
stacks (Fig. 2B).18 If the molecules obtain the edge-on orienta-
tion on the surface, the height of these fibers/stacks should be
the same or within the range of the molecules’ diameters. One
feature of the assembly of derivatives of 1 and 2 that is
potentially useful has to do with their polar properties and
how they develop on the nanoscale. To investigate the assem-
bly and polarity of 1 and 2 on these length scales, conditions
were found to produce films that have less than a monolayer of
This journal is �c the Owner Societies 2007 Phys. Chem. Chem. Phys., 2007, 9, 1515–1532 | 1517
coverage on highly ordered pyrolitic graphite (HOPG) sub-
strates through spin casting. The topography, polarity/mole-
cular orientation, and molecular packing of these films can be
measured using AFM, EFM, and STM, respectively.
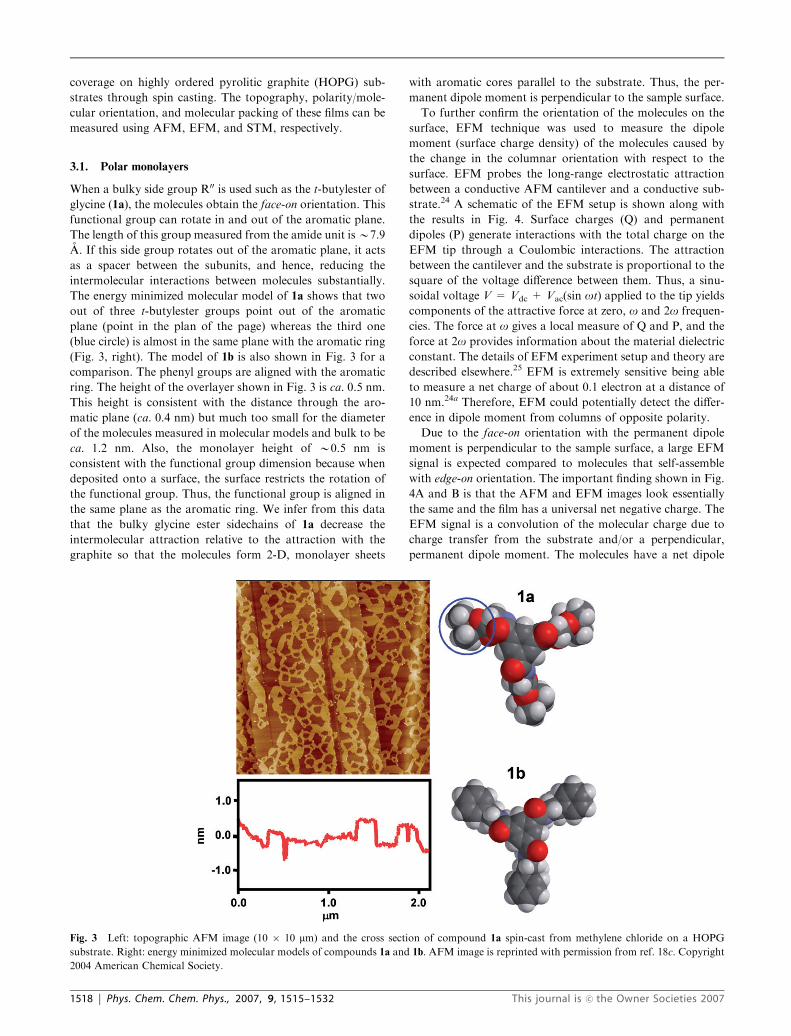
3.1. Polar monolayers
When a bulky side group R00 is used such as the t-butylester of
glycine (1a), the molecules obtain the face-on orientation. This
functional group can rotate in and out of the aromatic plane.
The length of this group measured from the amide unit isB7.9
A. If this side group rotates out of the aromatic plane, it acts
as a spacer between the subunits, and hence, reducing the
intermolecular interactions between molecules substantially.
The energy minimized molecular model of 1a shows that two
out of three t-butylester groups point out of the aromatic
plane (point in the plan of the page) whereas the third one
(blue circle) is almost in the same plane with the aromatic ring
(Fig. 3, right). The model of 1b is also shown in Fig. 3 for a
comparison. The phenyl groups are aligned with the aromatic
ring. The height of the overlayer shown in Fig. 3 is ca. 0.5 nm.
This height is consistent with the distance through the aro-
matic plane (ca. 0.4 nm) but much too small for the diameter
of the molecules measured in molecular models and bulk to be
ca. 1.2 nm. Also, the monolayer height of B0.5 nm is
consistent with the functional group dimension because when
deposited onto a surface, the surface restricts the rotation of
the functional group. Thus, the functional group is aligned in
the same plane as the aromatic ring. We infer from this data
that the bulky glycine ester sidechains of 1a decrease the
intermolecular attraction relative to the attraction with the
graphite so that the molecules form 2-D, monolayer sheets
with aromatic cores parallel to the substrate. Thus, the per-
manent dipole moment is perpendicular to the sample surface.
To further confirm the orientation of the molecules on the
surface, EFM technique was used to measure the dipole
moment (surface charge density) of the molecules caused by
the change in the columnar orientation with respect to the
surface. EFM probes the long-range electrostatic attraction
between a conductive AFM cantilever and a conductive sub-
strate.24 A schematic of the EFM setup is shown along with
the results in Fig. 4. Surface charges (Q) and permanent
dipoles (P) generate interactions with the total charge on the
EFM tip through a Coulombic interactions. The attraction
between the cantilever and the substrate is proportional to the
square of the voltage difference between them. Thus, a sinu-
soidal voltage V = Vdc + Vac(sin ot) applied to the tip yields
components of the attractive force at zero, o and 2o frequen-
cies. The force at o gives a local measure of Q and P, and the
force at 2o provides information about the material dielectric
constant. The details of EFM experiment setup and theory are
described elsewhere.25 EFM is extremely sensitive being able
to measure a net charge of about 0.1 electron at a distance of
10 nm.24a Therefore, EFM could potentially detect the differ-
ence in dipole moment from columns of opposite polarity.
Due to the face-on orientation with the permanent dipole
moment is perpendicular to the sample surface, a large EFM
signal is expected compared to molecules that self-assemble
with edge-on orientation. The important finding shown in Fig.
4A and B is that the AFM and EFM images look essentially
the same and the film has a universal net negative charge. The
EFM signal is a convolution of the molecular charge due to
charge transfer from the substrate and/or a perpendicular,
permanent dipole moment. The molecules have a net dipole
Fig. 3 Left: topographic AFM image (10 � 10 mm) and the cross section of compound 1a spin-cast from methylene chloride on a HOPG
substrate. Right: energy minimized molecular models of compounds 1a and 1b. AFM image is reprinted with permission from ref. 18c. Copyright
2004 American Chemical Society.
1518 | Phys. Chem. Chem. Phys., 2007, 9, 1515–1532 This journal is �c the Owner Societies 2007

perpendicular to the surface when the amides are forced out of
the aromatic plane. Because of the partial positive charged on
the amide N–H coupled with its out of plane conformation, a
N–H/p interaction with the graphite substrate as shown in Fig.
4C could result. Also, the reason that 1a does not adsorb with
the dipole pointed toward the surface due to electron repulsion
between the electron rich surface (graphite surface) and the
partial negative charged on the amide CQO. It is more stable
for the partial positive charged on the amide N–H pointed
toward the graphite substrate. In fact, similar interactions
have already been observed between amines and carbon
nanotube surfaces.26 Effectively, the surface could serve to
orient the amide substituents and thereby direct the molecular
dipoles.27 Electron transfer from the graphite to the mono-
layers could also be a contributor to the EFM signal.
3.2. Isolated stacks
Remarkably, the opposite surface orientation, where the
columns align parallel to the surface (edge-on orientation,
Fig. 2B), is adopted for molecules 1b, 1c, 2a, and 2b shown
in Fig. 1 and others tested that form hexagonal arrangements
in bulk. Fig. 5 shows the topography AFM images and the
cross sections of 1b, 1c, 2a, and 2b films spin-cast from
methylene chloride solution. The four molecules form long
molecular fibers on graphite at low concentration. The length
Fig. 4 (A) 2.2 � 2.2 mm AFM image (data scale: 0–3 nm), (B) 1o EFM image of the same film (data scale: 0–400 Hz), (C) Dipole and electron
transfer in thin films of 1a, and (D) EFM set-up for measuring surface charges and permanent dipoles in self-assembled columnar films. Reprinted
with permission from ref. 18c. Copyright 2004 American Chemical Society.
This journal is �c the Owner Societies 2007 Phys. Chem. Chem. Phys., 2007, 9, 1515–1532 | 1519
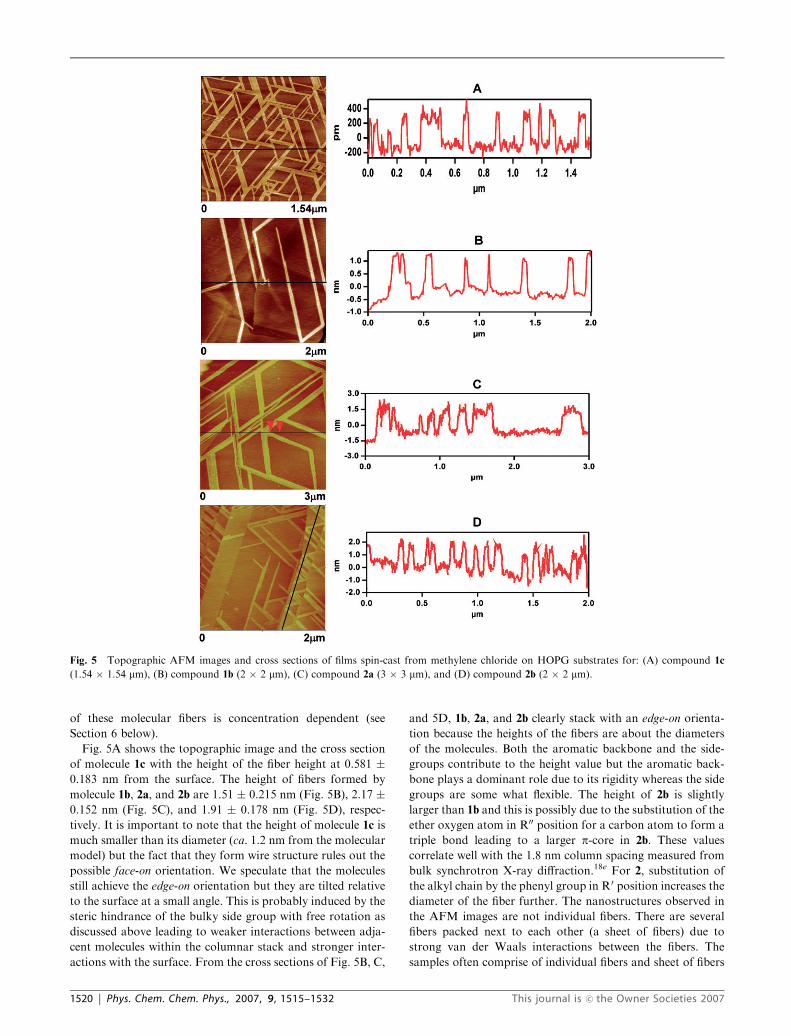
of these molecular fibers is concentration dependent (see
Section 6 below).
Fig. 5A shows the topographic image and the cross section
of molecule 1c with the height of the fiber height at 0.581 �0.183 nm from the surface. The height of fibers formed by
molecule 1b, 2a, and 2b are 1.51 � 0.215 nm (Fig. 5B), 2.17 �0.152 nm (Fig. 5C), and 1.91 � 0.178 nm (Fig. 5D), respec-
tively. It is important to note that the height of molecule 1c is
much smaller than its diameter (ca. 1.2 nm from the molecular
model) but the fact that they form wire structure rules out the
possible face-on orientation. We speculate that the molecules
still achieve the edge-on orientation but they are tilted relative
to the surface at a small angle. This is probably induced by the
steric hindrance of the bulky side group with free rotation as
discussed above leading to weaker interactions between adja-
cent molecules within the columnar stack and stronger inter-
actions with the surface. From the cross sections of Fig. 5B, C,
and 5D, 1b, 2a, and 2b clearly stack with an edge-on orienta-
tion because the heights of the fibers are about the diameters
of the molecules. Both the aromatic backbone and the side-
groups contribute to the height value but the aromatic back-
bone plays a dominant role due to its rigidity whereas the side
groups are some what flexible. The height of 2b is slightly
larger than 1b and this is possibly due to the substitution of the
ether oxygen atom in R00 position for a carbon atom to form a
triple bond leading to a larger p-core in 2b. These values
correlate well with the 1.8 nm column spacing measured from
bulk synchrotron X-ray diffraction.18e For 2, substitution of
the alkyl chain by the phenyl group in R0 position increases the
diameter of the fiber further. The nanostructures observed in
the AFM images are not individual fibers. There are several
fibers packed next to each other (a sheet of fibers) due to
strong van der Waals interactions between the fibers. The
samples often comprise of individual fibers and sheet of fibers
Fig. 5 Topographic AFM images and cross sections of films spin-cast from methylene chloride on HOPG substrates for: (A) compound 1c
(1.54 � 1.54 mm), (B) compound 1b (2 � 2 mm), (C) compound 2a (3 � 3 mm), and (D) compound 2b (2 � 2 mm).
1520 | Phys. Chem. Chem. Phys., 2007, 9, 1515–1532 This journal is �c the Owner Societies 2007

with various widths. The width of the nanostructures depends
on the spin-speed and the molecule concentration: the higher
the spin-speed and concentration, the thinner the width.
The EFM images of compounds 1b and 1c shown in Fig. 6
(bottom) at sub-monolayer coverage on graphite trace the
same morphology as the topographic image (top). Similar to
molecule 1a, these films have a universal net negative charge.
Electron transfer from the graphite to the molecular column
can also contribute to the EFM signal in compound 1c (shown
in Fig. 6A), but it is unlikely the main contribution to the
signal because the hydrocarbon exterior chains minimize
charge transfer with the substrate. Overall, this EFM result
together with the AFM data confirms the orientation of
compound 1c on the surface: the molecules achieve the edge-
on orientation but they are tilted at a small angle relative to the
surface. This tilt results in a significant dipole moment per-
pendicular to the stacking direction and also efficient charge
transfer can take place. EFM measurements performed on
columnar stacks of compound 1b reveals that they have
essentially very weak or no measurable dipole or charge, which
is consistent with the column axial dipole moment being
parallel to the surface (Fig. 1B). Moreover, the hydrocarbon
exterior insulates these stacks against charge transfer from the
substrate. This is quite different compared to typically discotic
liquid crystals, which do not form isolated 1-D structures but
rather 2-D sheets with face-on orientation because molecular
cohesion from the weak p-stacking forces holding the column
together are nearly equal to the van der Waals intermolecular
forces between alkyl side chains. For 1b, 2b, and 2a, the self-
association in the stacking direction outweighs these van der
Waals interactions leading to isolated stacks with edge-on
orientation.
From the topographic AFM images, all three molecules self-
assemble to form fibers on graphite. However, we cannot
determine exactly how the molecules pack together at mole-
cular level. To investigate further the molecular packing in
these fibers, we use high-resolution UHV scanning tunneling
microscopy (STM) images such as those in Fig. 7. STM images
of molecule 1c (Fig. 7A), molecule 1b (Fig. 7B), and molecule
2b (Fig. 7C) have been acquired with atomic and molecular
resolution. These images clearly show that the three molecules
self-assemble to form very different structures at the molecular
level. The different structures result from a subtle change in
molecule–molecule and molecule–surface interactions due to
the functional groups.
STM images of molecule 1c are shown in Fig. 7A. The
images of the assembly are consistent with a packing of
molecules bonded together through hydrogen bonding to form
long molecular wires with the long alkyl chains (R00) anchored
down to the graphite lattice. The orientation of the alkyl
chains is clearly visible in Fig. 7A. The affinity of the molecules
toward the graphite surface imposes a preferential orientation
Fig. 6 Topographic (top) and 1 o EFM (bottom) images of compound 1c (A) (AFM data scale: 0–4 nm and EFM data scale: 0–15 Hz) and
compound 1b (B) (data scale: 0–2 nm for AFM and 0–200 Hz for EFM). All images are 2 � 2 mm. AFM and EFM images are reprinted with
permission from ref. 18c. Copyright 2004 American Chemical Society.
This journal is �c the Owner Societies 2007 Phys. Chem. Chem. Phys., 2007, 9, 1515–1532 | 1521

of the wire relative to the lattice direction of graphite. The
detailed structure of the wires is somewhat intriguing. The
long fiber is composed of a periodic pattern made of large
bright spots alternated by small dark regions. Although these
images clearly resolve the lattice of the graphite and the
molecular arrangement of the molecules, they do not provide
enough contrast to provide an unambiguous structure to the
molecular packing. Details from the STM images allow us
however to add important observations about the packing
structure of molecule 1c. By counting the number of alkyl
chains in these images, we note that there are about 108 side
chains for twelve bright features (or clusters) in the left image
(Fig. 7A). Therefore, each cluster has a total of 9 alkyl chains
located on both sides from their center. Since each molecule
has three alkyl chains, each cluster units has therefore to be
composed of three molecules. Due to bulky side-groups, the
molecules cannot stack closely to each other as a result of a
steric hindrance; thus, they pack as a group of three with a
dislocation in between the groups of three molecules.
By changing the side groups with a compact unit (molecule
1b and 2b), we expect that the interactions among molecules
will be enhanced, thereby reducing the spacing between mole-
cules within the stack. Fig. 7B shows the STM images of
molecule 1b. Surprisingly, all the fibers show kinks in the same
direction and no alkyl chain perpendicular to the stacking
direction. The width of the fiber is too large (B4 nm) to be a
diameter of a single molecule. Therefore, it is possible that
three fibers bundle to form helix, and the kinks are helical
pitches. If this is the case, molecule 1b would form a sheet-like
conformation similar to b-sheet. The actual molecular packing
Fig. 7 STM images of: (A) compound 1c (left image: 25� 25 nm, right image: 10� 10 nm) (B) compound 1b (left image: 70� 70 nm, right image:
10 � 10 nm), and (C) compound 2b (left image: 15 � 15 nm, right image: 5 � 5 nm). Individual bright spots are monomers.
1522 | Phys. Chem. Chem. Phys., 2007, 9, 1515–1532 This journal is �c the Owner Societies 2007

motif is rather compact and seems too complicated to interpret
from the STM image. It is clear that modeling will be needed
in this case.
For molecule 2b, we substitute the oxygen atom in R00 by an
alkyne to create a larger p-core with the expectation that the
larger p-core would strengthen p–p interactions within a
columnar stack. Inspection of Fig. 7C shows that molecule
2b attains straight individual fibers with similar intermolecular
distances. This result supports our hypothesis that the larger
p-core enhances p–p interactions and reduces the spacing
between molecules. Using the graphite lattice as a reference,28
we estimate the spacing between molecules is ca. 4.3 A.
Although most molecules stack to form fibers, there are still
some individual molecules (monomers) present on the surface.
The monomers appear as isolated bright spots as seen in some
areas of the film. The diameter of a molecule is ca. 2.0 nm in
agreement with the value obtained by AFM studies. Although
the exact mechanisms of the molecular packing motifs are not
conclusive, the STM results reveal that functional groups
influence the molecular packing motif and the self-assembly
process.
The results in this section show that it is possible to use the
functional side groups of the molecules as a tool to control the
molecular packing, orientation, and intermolecular spacing of
overcrowded aromatics in thin films. By further tuning the
property of this class of material, these nanostructures could
be used as model systems to study electronic transport proper-
ties in 1-D organic semiconductors.
4. Evidence of self-assembly in solution
This section focuses on the self-assembly characteristics of
hydrogen-bond enforced, crowded aromatics into 1-D
p-stacks in solution. It is not only important to master the
intermolecular assembly but also to understand how to form
and interface these assemblies with useful substrates.8,29 The
question asked is do whether the molecules self-assemble in
solution prior to deposition onto a surface. The assembly can
be monitored with optical spectroscopy due to ground and
excited states being electronically delocalized upon assembly.
In this work we utilize site-selective wavelength dependent
fluorescence spectroscopy––a valuable technique to under-
stand the self-organization in solution for molecular systems
such as proteins, peptides, and membrane-bound probes30—to
determine whether 2a and 2b self-assemble into columnar
structures in solution. Our approach is based on the different
fluorescence response from individual molecules, which we call
‘‘monomers,’’ compared to molecules stacked to form col-
umns, which we refer to ‘‘aggregates’’ (see Fig. 8B for the
schematic drawing). The terms ‘‘fibers’’ or ‘‘aggregates’’ will
be used interchangeably to refer to the 1-D nanostructures
when visualized by microscopy. Furthermore, these fibers/
aggregates form species with ground and excited electronic
properties distinct from that of the monomer. We selectively
excite the monomers or the aggregates to obtain information
about the assembly processes in solution. The excited state of
the aggregate is significantly longer lived than from the
isolated molecules and easily observed in time-resolved photo-
luminescence experiments. Aggregates for both 2a and 2b
could be detected in methylene chloride solutions as low as
10�7 M. Spectroscopy and microscopy of films cast from
solutions of 2a and 2b provide strong evidence that the
structural integrity of the aggregates in solution is preserved
during the transfer process onto the substrate.31 Thus, we can
use the solvent and concentration to control the film morphol-
ogy. Further organization of these aggregates into films with
higher order structures is determined by whether the surface is
hydrophilic or hydrophobic.
In these discotic materials, a balance must be met between
the subunits affinity for itself and for its solvent medium in a
solution and for its substrate in a film. On the one hand, when
the stacking forces between molecules are great the assemblies
grow too large to be effectively solvated and precipitate into
ill-defined superstructures. On the other hand, if the associa-
tion between the subunits is too slight (i.e. due to the steric of
the bulky side group), the p–p overlap between conjugated
cores will be diminish and interactions with the surface will
dominate resulting in a face-on orientation on the surface. The
steric bulk of the side-chains on this crowded core is one of the
determining factors of how well these molecules self-assemble.
Besides the side group and its interplay with the core size, the
solvent is also a crucial factor in the self-assembly process.
This process can be an entropy driven process when the
solvent molecules are released upon the self-assembly forma-
tion,32 but, if the solvent has very strong interaction with the
molecules, the aggregate cannot be formed. Below we monitor
the assembly of 2a and 2b, that have different groups on the
alkynes flanking their amides (either hydrocarbon for 2b or
phenyl for 2a), and probe how this assembly is crucially
affected by its environment (solvent, temperature, and con-
centration). These solution-phase aggregates pre-determine
Fig. 8 Schematic representation of possible molecular arrangements
of compound 2: (A) monomer; (B) aggregates/fibers of different sizes;
(C) a bundle of aggregates/fibers; (D) a complex, ill-defined packing
structure. Reprinted with permission from ref. 18g. Copyright 2004
American Chemical Society.
This journal is �c the Owner Societies 2007 Phys. Chem. Chem. Phys., 2007, 9, 1515–1532 | 1523

(both in terms of quality and quantity) the type of nanostruc-
tured morphology manifest in thin films.
Here we show that the self-assembly process exists in
solution prior to the deposition of the supramolecular assem-
bly on the surface. Fig. 9 shows the normalized absorption and
photoluminescence (PL) of 2a and 2b in methylene chloride.
Several observations can be made from this simple compar-
ison. First, for 2a, the substitution of central ring with the
phenylethynyl groups at R00 substituent causes a red shifting of
ca. 40 nm in the absorption and ca. 20 nm in the emission
compared to 2b with an alkyl group substituting the alkyne on
the central aromatic ring at the R00 position. The red shifting is
due to the larger conjugated core of compound 2a compared
to 2b. Second, for two compounds, the PL spectra have a
bifurcated peak structure. As explained below, one peak is
from the monomers and the peak appeared at a longer
wavelength is from the aggregates. Third, the ratio of the
monomer/aggregate peak of 2a is larger, meaning that the
concentration of monomers in the solution is higher in 2a than
in 2b. Last, while the monomer emission is similarly shifted
compared to that of the absorption spectra, the aggregate
emission from compound 2a is blue shifted relative to that
from the aggregate peak of 2b. One explanation for this blue-
shift in the aggregates with the larger aromatic core is that the
freely rotating phenyl group on the ethynl-substituents causes
problems in the packing.
The PL spectrum of 1c is also included for a comparison.
Similar to 2, the PL spectrum of 1c shows two peaks but both
peaks are blue-shifted compared to 2. The monomer peak is
blue-shiftedB50 nm from the monomer peak of 2b, a result of
having smaller conjugated core. The aggregate peak is also
blue-shifted B25 nm compared to 2b. Additionally, this peak
does not shift to longer wavelength with increasing the excita-
tion wavelength as in the case of 2. Therefore, we conclude
that 1c could form dimmer and trimer in solution. Compound
1c does not form large aggregates as in 2a and 2b because of
the weak intermolecular interactions, a result of bulky func-
tional groups as discussed in the previous section.
The emission spectra can be understood by considering the
fact that the molecules 2a and 2b stack in solution into
columnar aggregates. These supramolecular structures form
helical stacks with an intermolecular distance for the co-
facially arranged aromatic rings to be within their van der
Waals radii. In PL, the excited state of the monomers is
localized on a single molecule and the emission wavelength
depends mostly on the size of the conjugated core. In contrast,
the emission of the columnar structure is red-shifted relative to
the monomer, because it has an excited state that is delocalized
over several subunits/molecules within the stack. The deloca-
lization of the excited state wave function across several
molecules lowers the energy relative to the localized excited
state wave function of a monomer resulting in a red-shifted
luminescence from the aggregate. Of course, if the aggregate
has poor overlap between the molecular subunits, the excita-
tion will be more localized and therefore at a wavelength closer
to the monomer emission. Thus, the position of the emission
peak provides a good characterization of the intermolecular
interaction in the aggregates; i.e., aggregates with stronger
interactions present emission spectra that are red shifted
compared to weakly interacting aggregates.33 The monomer
peak at about 370–390 nm is clearly resolved from the broad
structure in the emission at wavelengths between 400 nm and
600 nm, which originates from the aggregates. The broad
emission spectrum of the aggregates suggests a wide distribu-
tion of sizes or the presence of different forms of aggregates.
This point will be discussed further below.
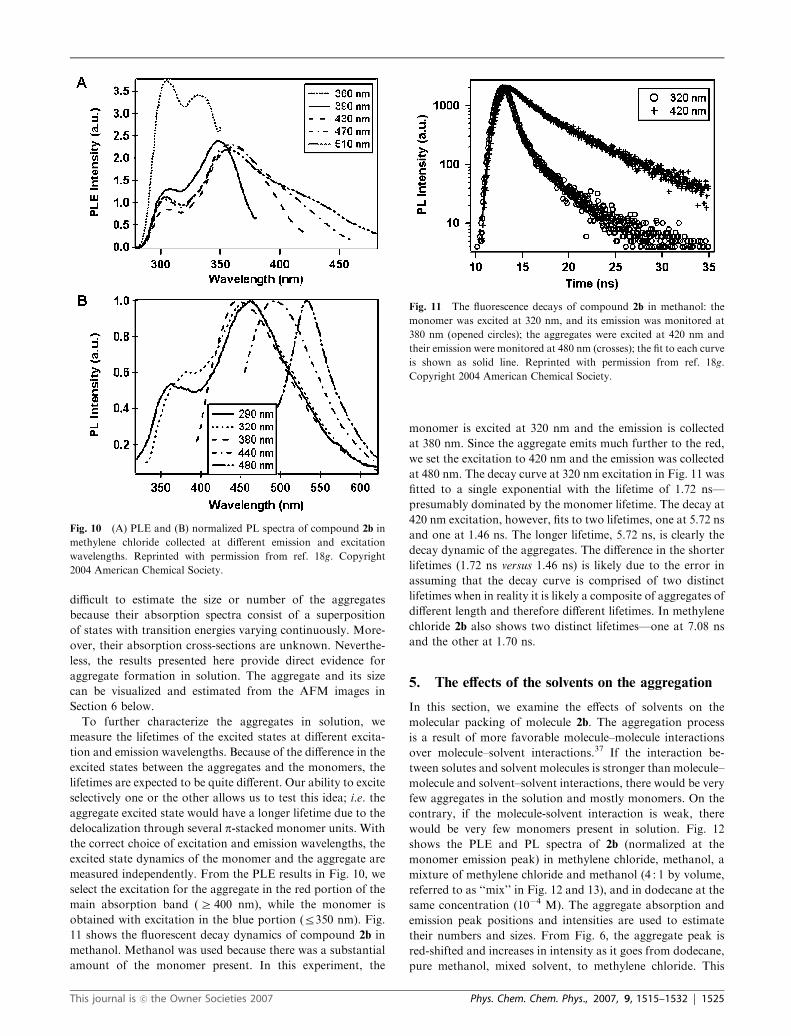
Fig. 10 shows the PLE (Fig. 10A) and PL (Fig. 10B) spectra
of 2b in methylene chloride collected as the excitation and
emission are moved to longer wavelengths. Because both 2a
and 2b show similar results, only the results of 2b are presented
below. A large red shift is observed in both PLE and PL
spectra as the emission and excitation wavelengths increase.
Generally, this red shift is either due to the strong electronic
interactions among the chromophores or to the motion of
chromophores in a restricted condensed media such as in a
very viscous solution, in a membrane or in a micelle. 34 For the
experiments performed here, the solvents used, i.e. methylene
chloride and methanol, have similar viscosity (0.413 vs. 0.544
centipoice at 25 1C) while the viscosity of dodecane is three
times larger (1.383 centipoice at 25 1C). However, there is no
shift in the PL spectra for dodecane with increased excitation
wavelength (see Section 5 for the effect of solvent).35 We can
rule out the contribution of the red-shifted PL due to the
increase in the solution viscosity. In addition, there are many
cofacially stacked p-systems that show red-shifted absorbance
and emission upon aggregation.36
PLE spectroscopy has no interfering background so it is
very sensitive at low concentration. This is why the red-shifted
absorption/aggregate bands in Fig. 10A at low concentration
are observed only in the PLE spectra and not in the UV-visible
absorption spectra. As seen in Fig. 10, the emission from the
aggregates can be enhanced by preferentially exciting toward
longer wavelengths (400 nm–500 nm) of PLE band maxima.
Fig. 10B plots the normalized PL spectra of 2b excited at
290 nm (the peak of monomer exciton absorption) and at
longer wavelength, 360 nm–480 nm, (aggregate band). The
fluorescence spectra show that the aggregate emission shifts
continuously to the red with the excitation wavelength. This
can be explained in terms of a wide distribution in the
aggregate length and number. From the PL spectra, it is
Fig. 9 Normalized (at the monomer peak) absorption and PL spectra
of 2a and 2b in methylene chloride (concentration = 10�5 M, l =
(excitation) = 290 nm for 2b and 320 nm for 2a). Reprinted with
permission from ref. 18g. Copyright 2004 American Chemical Society.
1524 | Phys. Chem. Chem. Phys., 2007, 9, 1515–1532 This journal is �c the Owner Societies 2007
difficult to estimate the size or number of the aggregates
because their absorption spectra consist of a superposition
of states with transition energies varying continuously. More-
over, their absorption cross-sections are unknown. Neverthe-
less, the results presented here provide direct evidence for
aggregate formation in solution. The aggregate and its size
can be visualized and estimated from the AFM images in
Section 6 below.
To further characterize the aggregates in solution, we
measure the lifetimes of the excited states at different excita-
tion and emission wavelengths. Because of the difference in the
excited states between the aggregates and the monomers, the
lifetimes are expected to be quite different. Our ability to excite
selectively one or the other allows us to test this idea; i.e. the
aggregate excited state would have a longer lifetime due to the
delocalization through several p-stacked monomer units. With
the correct choice of excitation and emission wavelengths, the
excited state dynamics of the monomer and the aggregate are
measured independently. From the PLE results in Fig. 10, we
select the excitation for the aggregate in the red portion of the
main absorption band (Z 400 nm), while the monomer is
obtained with excitation in the blue portion (r350 nm). Fig.
11 shows the fluorescent decay dynamics of compound 2b in
methanol. Methanol was used because there was a substantial
amount of the monomer present. In this experiment, the
monomer is excited at 320 nm and the emission is collected
at 380 nm. Since the aggregate emits much further to the red,
we set the excitation to 420 nm and the emission was collected
at 480 nm. The decay curve at 320 nm excitation in Fig. 11 was
fitted to a single exponential with the lifetime of 1.72 ns—
presumably dominated by the monomer lifetime. The decay at
420 nm excitation, however, fits to two lifetimes, one at 5.72 ns
and one at 1.46 ns. The longer lifetime, 5.72 ns, is clearly the
decay dynamic of the aggregates. The difference in the shorter
lifetimes (1.72 ns versus 1.46 ns) is likely due to the error in
assuming that the decay curve is comprised of two distinct
lifetimes when in reality it is likely a composite of aggregates of
different length and therefore different lifetimes. In methylene
chloride 2b also shows two distinct lifetimes—one at 7.08 ns
and the other at 1.70 ns.
5. The effects of the solvents on the aggregation
In this section, we examine the effects of solvents on the
molecular packing of molecule 2b. The aggregation process
is a result of more favorable molecule–molecule interactions
over molecule–solvent interactions.37 If the interaction be-
tween solutes and solvent molecules is stronger than molecule–
molecule and solvent–solvent interactions, there would be very
few aggregates in the solution and mostly monomers. On the
contrary, if the molecule-solvent interaction is weak, there
would be very few monomers present in solution. Fig. 12
shows the PLE and PL spectra of 2b (normalized at the
monomer emission peak) in methylene chloride, methanol, a
mixture of methylene chloride and methanol (4 : 1 by volume,
referred to as ‘‘mix’’ in Fig. 12 and 13), and in dodecane at the
same concentration (10�4 M). The aggregate absorption and
emission peak positions and intensities are used to estimate
their numbers and sizes. From Fig. 6, the aggregate peak is
red-shifted and increases in intensity as it goes from dodecane,
pure methanol, mixed solvent, to methylene chloride. This
Fig. 10 (A) PLE and (B) normalized PL spectra of compound 2b in
methylene chloride collected at different emission and excitation
wavelengths. Reprinted with permission from ref. 18g. Copyright
2004 American Chemical Society.
Fig. 11 The fluorescence decays of compound 2b in methanol: the
monomer was excited at 320 nm, and its emission was monitored at
380 nm (opened circles); the aggregates were excited at 420 nm and
their emission were monitored at 480 nm (crosses); the fit to each curve
is shown as solid line. Reprinted with permission from ref. 18g.
Copyright 2004 American Chemical Society.
This journal is �c the Owner Societies 2007 Phys. Chem. Chem. Phys., 2007, 9, 1515–1532 | 1525

implies that there is a higher degree of aggregation in pure
methylene chloride than in the other solvents tested. In
methanol, however, the number of monomers increases due
to the additional competition for the hydrogen bonds between
the solvent and the molecules.
As we go from methylene chloride to mixed solvents and
then to pure methanol, the monomer emission increases
smoothly with the methanol concentration probably due to
the competition for the hydrogen bonding with the solvent.
This effect is clearly seen from the spectra of the mixed solvent.
However, there is still a measurable number of aggregates in
these two solutions indicating that hydrogen bonding is not
the only force that holds the molecules together in the aggre-
gates. For example, p–p interactions and solvophobic effects
between the aromatic cores can also play an important role in
holding molecules together. As discussed below, methanol
takes an active part in the formation of a new complex
aggregate structure for 1.
Surprisingly, the aggregate emission in dodecane is very
weak and most, if not all, of the PL emission is from the
monomer. This effect is likely due to the strong solvophobic
interactions between the solvent and the long alkyl chains
attached to the monomer. The solvent stabilizes the monomer
in the solution and therefore interferes with the packing
process. This result is unexpected and coupled with the results
from the studies with methanol indicate that not only hydro-
gen bonds but also solvophobic forces from the sidechains and
the core facilitate the assembly.
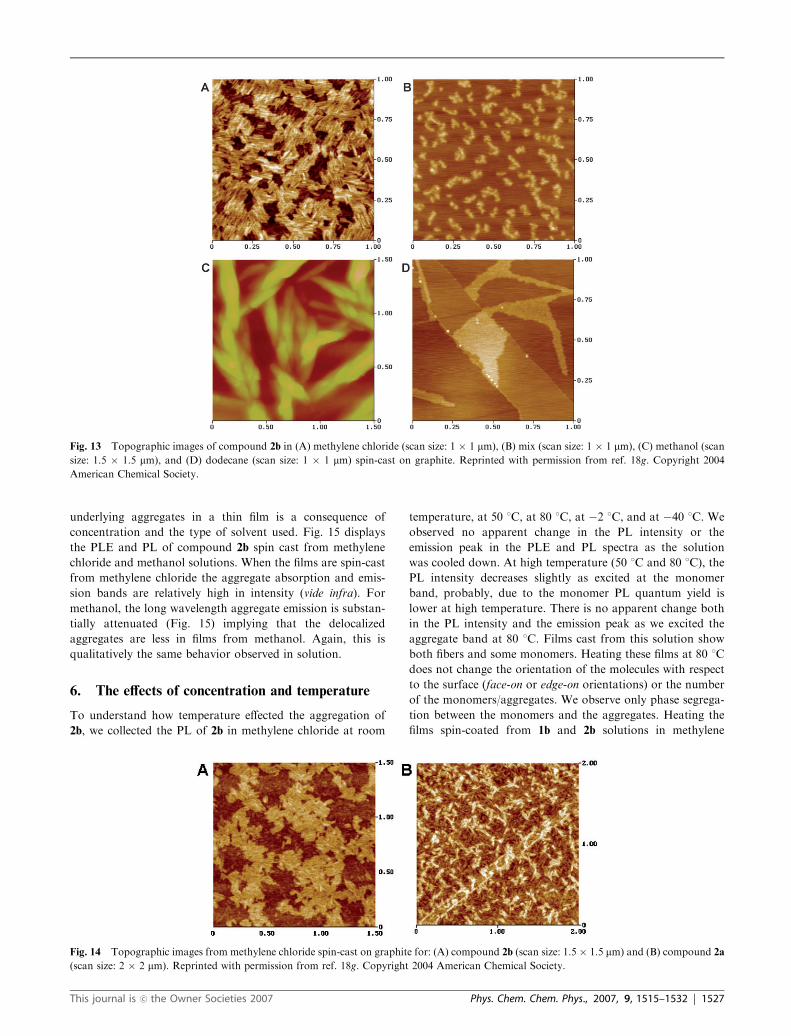
Fig. 13 presents the AFM topology of films made with
compound 2b (B10�4 M) on graphite obtained by spin casting
from methylene chloride, methanol, a mixture of methylene
chloride/methanol, and dodecane at room temperature. The
film in Fig. 13A from methylene chloride is composed of short
fibers arranged in a multi-layered film ordered over small
domains of about 0.1 � 0.1 mm. In the same conditions, the
film cast obtained with the mixed solvent (methylene chloride/
methanol) in Fig. 13B has a much lower number of fibers.
Thus, the AFM results agree very well with our interpretation
of the PL data for both solutions. The electronic structure of
the films evidenced by the long wavelength emission survives
the casting process. The films obtained from the methanol
solution contain large, tangled bundles with complex packing
structures (Fig. 13C). For this solution, the PL spectra show a
lower concentration of aggregates relative to the monomer,
probably resulting from the strong competition for hydrogen
bonding with the solvent. This competitive action prevents the
formation of fibers with isolated columns (with a diameter of
1 B 1.9 nm) in favor of larger physical aggregates (with the
diameter of ca. 30–50 nm) that have no influence on the optical
properties of 2b in methanol. Presumably, the aggregate size in
this bundle is smaller and there are fewer numbers of aggre-
gates in methanol-cast film than for methylene chloride-cast
film. This is in agreement with the blue shifted peaks of the
aggregate emission in the PL emission when compared to the
fibers emission observed in methylene chloride. These obser-
vations are consistent with poor molecular packing of units
that interact weakly with each other. Thus, it is likely that the
solvent participates in this packing structure by competing for
hydrogen bonding.
The case of the dodecane solution is rather simple. It forms
a film on graphite (see Fig. 13D) with only a few aggregates/
fibers. The material deposited is mostly embedded in a fea-
tureless layer. In dodecane, although hydrogen bonds can be
formed, this system does not favor the assembly and yields
poor results. This is again consistent with the PL results
described above.
As we spin cast the solutions of 2a and 2b in methylene
chloride onto graphite (B10�4 M), high-aspect ratio aggre-
gates can be seen in the film morphology shown in Fig. 14. The
topographic images of 2b (Fig. 14A) and 2a (Fig. 14B) are of
short fibers packed closely together in random directions. The
fibers of 2b are straight and packed closely to from ordered
sheets/layers. However, this is not the case for 2a. The fibers of
compound 2a have the tendency to tangle together and form
poorly defined layers. We speculate that this disorder is related
to the freely rotating phenyl groups on the triple bonds that
introduce steric interaction in the assembled structure.
The emission spectra of these fibrous films can be correlated
with the type of solvent that is used for the casting. The
important point is not that the exact morphology of a film is
present in solution, but rather that the size and number of the
Fig. 12 (A) PLE and (B) PL spectra of compound 2b in different
solvents: methylene chloride (MeCl2, solid curve), mixture of methy-
lene chloride and methanol (4 : 1 by volume) (Mix, dashed curve),
methanol (MeOH, dashed-dot curve), and dodecane (long and two
short dashed curve). They are normalized at the monomer peak
(310 nm for PLE and 360 nm for PL). The excitation was at 320 nm
and the emission was collected at 360 nm. Reprinted with permission
from ref. 18g. Copyright 2004 American Chemical Society.
1526 | Phys. Chem. Chem. Phys., 2007, 9, 1515–1532 This journal is �c the Owner Societies 2007
underlying aggregates in a thin film is a consequence of
concentration and the type of solvent used. Fig. 15 displays
the PLE and PL of compound 2b spin cast from methylene
chloride and methanol solutions. When the films are spin-cast
from methylene chloride the aggregate absorption and emis-
sion bands are relatively high in intensity (vide infra). For
methanol, the long wavelength aggregate emission is substan-
tially attenuated (Fig. 15) implying that the delocalized
aggregates are less in films from methanol. Again, this is
qualitatively the same behavior observed in solution.
6. The effects of concentration and temperature
To understand how temperature effected the aggregation of
2b, we collected the PL of 2b in methylene chloride at room
temperature, at 50 1C, at 80 1C, at �2 1C, and at �40 1C. We
observed no apparent change in the PL intensity or the
emission peak in the PLE and PL spectra as the solution
was cooled down. At high temperature (50 1C and 80 1C), the
PL intensity decreases slightly as excited at the monomer
band, probably, due to the monomer PL quantum yield is
lower at high temperature. There is no apparent change both
in the PL intensity and the emission peak as we excited the
aggregate band at 80 1C. Films cast from this solution show
both fibers and some monomers. Heating these films at 80 1C
does not change the orientation of the molecules with respect
to the surface (face-on or edge-on orientations) or the number
of the monomers/aggregates. We observe only phase segrega-
tion between the monomers and the aggregates. Heating the
films spin-coated from 1b and 2b solutions in methylene
Fig. 13 Topographic images of compound 2b in (A) methylene chloride (scan size: 1 � 1 mm), (B) mix (scan size: 1 � 1 mm), (C) methanol (scan
size: 1.5 � 1.5 mm), and (D) dodecane (scan size: 1 � 1 mm) spin-cast on graphite. Reprinted with permission from ref. 18g. Copyright 2004
American Chemical Society.
Fig. 14 Topographic images from methylene chloride spin-cast on graphite for: (A) compound 2b (scan size: 1.5 � 1.5 mm) and (B) compound 2a
(scan size: 2 � 2 mm). Reprinted with permission from ref. 18g. Copyright 2004 American Chemical Society.
This journal is �c the Owner Societies 2007 Phys. Chem. Chem. Phys., 2007, 9, 1515–1532 | 1527
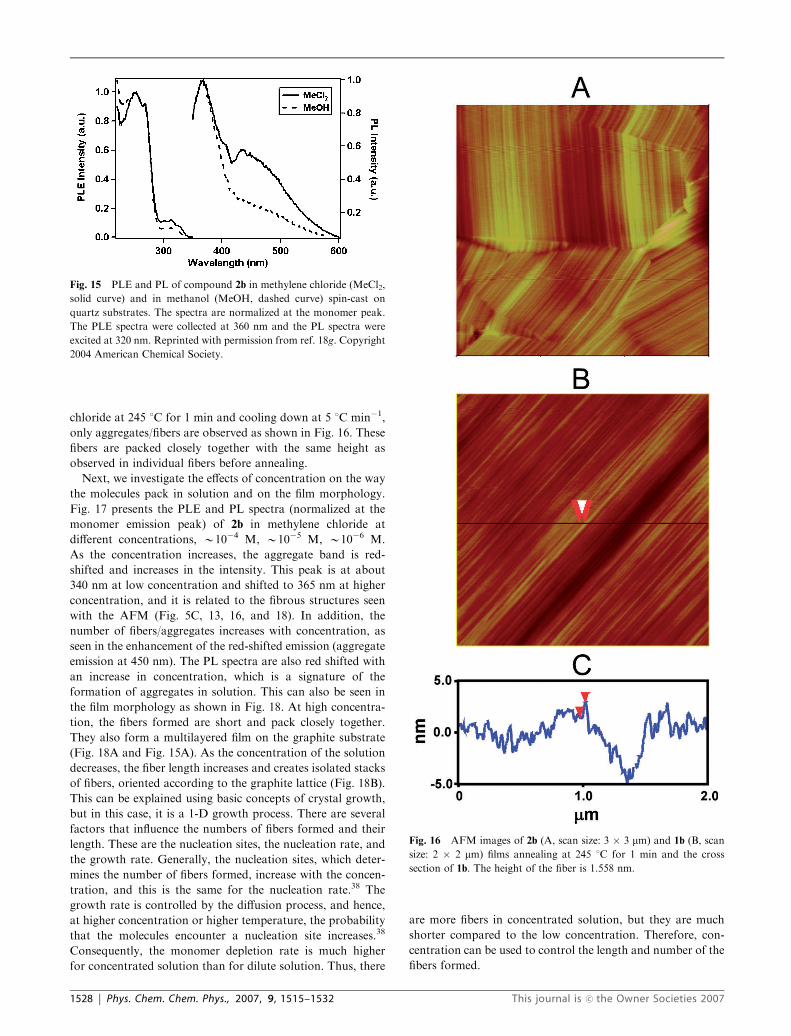
chloride at 245 1C for 1 min and cooling down at 5 1C min�1,
only aggregates/fibers are observed as shown in Fig. 16. These
fibers are packed closely together with the same height as
observed in individual fibers before annealing.
Next, we investigate the effects of concentration on the way
the molecules pack in solution and on the film morphology.
Fig. 17 presents the PLE and PL spectra (normalized at the
monomer emission peak) of 2b in methylene chloride at
different concentrations, B10�4 M, B10�5 M, B10�6 M.
As the concentration increases, the aggregate band is red-
shifted and increases in the intensity. This peak is at about
340 nm at low concentration and shifted to 365 nm at higher
concentration, and it is related to the fibrous structures seen
with the AFM (Fig. 5C, 13, 16, and 18). In addition, the
number of fibers/aggregates increases with concentration, as
seen in the enhancement of the red-shifted emission (aggregate
emission at 450 nm). The PL spectra are also red shifted with
an increase in concentration, which is a signature of the
formation of aggregates in solution. This can also be seen in
the film morphology as shown in Fig. 18. At high concentra-
tion, the fibers formed are short and pack closely together.
They also form a multilayered film on the graphite substrate
(Fig. 18A and Fig. 15A). As the concentration of the solution
decreases, the fiber length increases and creates isolated stacks
of fibers, oriented according to the graphite lattice (Fig. 18B).
This can be explained using basic concepts of crystal growth,
but in this case, it is a 1-D growth process. There are several
factors that influence the numbers of fibers formed and their
length. These are the nucleation sites, the nucleation rate, and
the growth rate. Generally, the nucleation sites, which deter-
mines the number of fibers formed, increase with the concen-
tration, and this is the same for the nucleation rate.38 The
growth rate is controlled by the diffusion process, and hence,
at higher concentration or higher temperature, the probability
that the molecules encounter a nucleation site increases.38
Consequently, the monomer depletion rate is much higher
for concentrated solution than for dilute solution. Thus, there
are more fibers in concentrated solution, but they are much
shorter compared to the low concentration. Therefore, con-
centration can be used to control the length and number of the
fibers formed.
Fig. 15 PLE and PL of compound 2b in methylene chloride (MeCl2,
solid curve) and in methanol (MeOH, dashed curve) spin-cast on
quartz substrates. The spectra are normalized at the monomer peak.
The PLE spectra were collected at 360 nm and the PL spectra were
excited at 320 nm. Reprinted with permission from ref. 18g. Copyright
2004 American Chemical Society.
Fig. 16 AFM images of 2b (A, scan size: 3 � 3 mm) and 1b (B, scan
size: 2 � 2 mm) films annealing at 245 1C for 1 min and the cross
section of 1b. The height of the fiber is 1.558 nm.
1528 | Phys. Chem. Chem. Phys., 2007, 9, 1515–1532 This journal is �c the Owner Societies 2007

7. The effects of the surface type on the
self-assembly
In this section, we examine how the surface polarity influences
the self-assembled nanostructures.
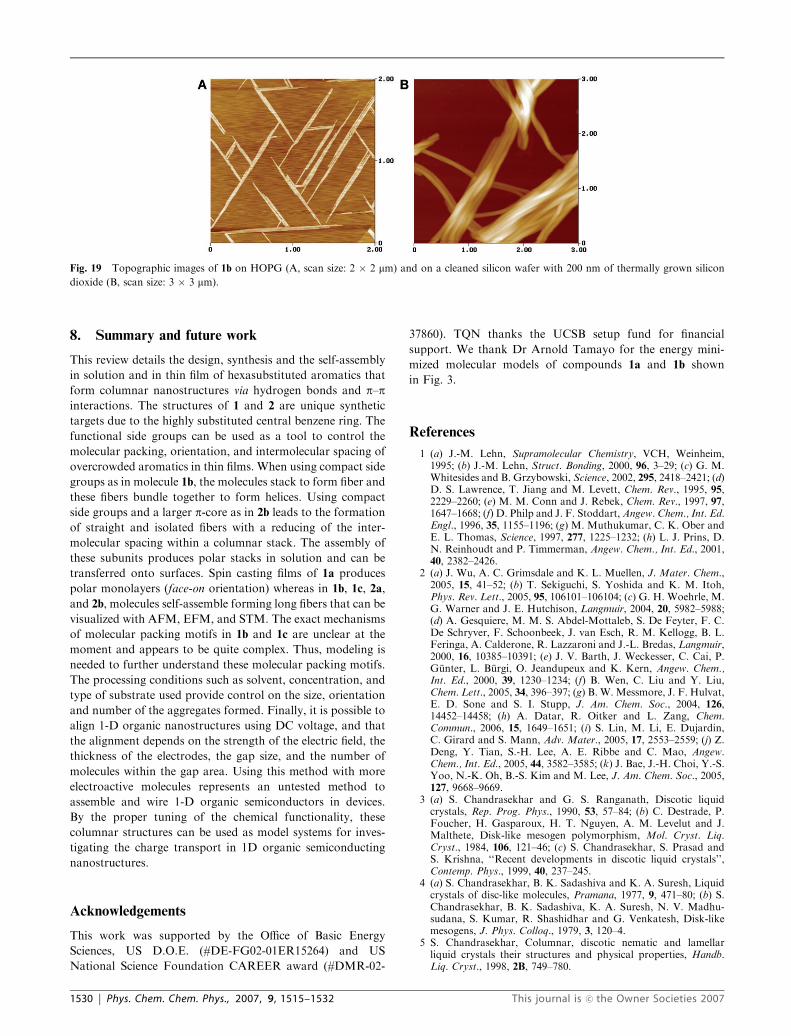
Spin-casting 1b from CH2Cl2 solution (B10�6 M) onto the
basal plane of highly ordered pyrolytic graphite (HOPG) or
onto a silicon wafer having a 200 nm thermally grown silicon
oxide layer produces very thin, elongated nanostructures. A
typical atomic force micrograph (AFM) is shown in Fig. 19A
on HOPG. The fibers are only one-molecule high, a few
molecules in width, but microns in length. On graphite, the
molecules form straight fibers in registry with the graphite
lattice. When using a cleaned silicon wafer (200 nm silicon
oxide) as the substrate, the fibers were much longer and tended
to bundle together to form ropes. This aggregation may arise
from the mismatch between the polar and hydrophilic silicon
oxide and the hydrophobic columns trying to minimize con-
tact. Nonetheless, we found conditions to form very long ropes
of columns that are about 50 nm in diameter. They are shown
in the micrograph Fig. 19B where each fiber is about 25
molecules wide. In contrast to the regular arrangement of
fibers on HOPG that arrange along the graphite lattice, on
silicon oxide these ropes orient randomly on the glassy,
amorphous silicon oxide layer.
The interaction between the molecule and the surface is
important for guiding the patterns formed by the film, such as
the orientation of the fibers and their size or number on
the surface. For example, compound 1b deposited on graphite
at low concentration (B10�6 M) gives fibers that are
spread out to form a monolayer on graphite, due to the strong
van der Waals interaction between graphite and the molecules.
The fibers are straight, packed parallel and in registry with
the graphite lattice at either 601 or 1201 angles. On Si/SiO2
(see Fig. 19B), the fibers have the tendency to form
bundles (7–50 nm in diameter) and orient randomly. This is
a result of a less favorable interaction between this hydrophilic
substrate and the hydrophobic aggregates. Thus, the fibers
bundle up together to minimize the interactions with the
surface and optimize the van der Waals interaction among
the fibers.
It is possible to use the electric field between vertical
(between two ITO-coated glass plates) and lateral electrodes
(between two gold electrodes patterned on silicon wafers) to
direct the self-assembly of these 1-D nanostructures. For the
lateral electrodes, there are several physical parameters influ-
enced the alignment of the molecules under an external electric
field: the width of the electrodes, the height/thickness of the
electrode, the gap size, the strength of the electric field, and the
number of molecules between the gap area.
Fig. 17 (A) PLE and (B) PL spectra of compound 2b in methylene
chloride at different concentration: 9.45 � 10�4 M (dot-dashed curve),
9.45 � 10�5 M (dashed curve), 4.74 � 10�5 M (dot curve), and 4.74 �10�6 M (solid curve). The PLE (collected at 420 nm) and PL (excited at
270 nm) spectra are normalized at the monomer peak. Reprinted with
permission from ref. 18g. Copyright 2004 American Chemical Society.
Fig. 18 AFM images of compound 2b in methylene chloride at different concentration spin-cast on graphite: (A) 9.45 � 10�5 M (scan size: 1.5 �1.5 mm) and (B) 9.45 � 10�6 M (scan size: 3 � 3 mm). Reprinted with permission from ref. 18g. Copyright 2004 American Chemical Society.
This journal is �c the Owner Societies 2007 Phys. Chem. Chem. Phys., 2007, 9, 1515–1532 | 1529
8. Summary and future work
This review details the design, synthesis and the self-assembly
in solution and in thin film of hexasubstituted aromatics that
form columnar nanostructures via hydrogen bonds and p–pinteractions. The structures of 1 and 2 are unique synthetic
targets due to the highly substituted central benzene ring. The
functional side groups can be used as a tool to control the
molecular packing, orientation, and intermolecular spacing of
overcrowded aromatics in thin films. When using compact side
groups as in molecule 1b, the molecules stack to form fiber and
these fibers bundle together to form helices. Using compact
side groups and a larger p-core as in 2b leads to the formation
of straight and isolated fibers with a reducing of the inter-
molecular spacing within a columnar stack. The assembly of
these subunits produces polar stacks in solution and can be
transferred onto surfaces. Spin casting films of 1a produces
polar monolayers (face-on orientation) whereas in 1b, 1c, 2a,
and 2b, molecules self-assemble forming long fibers that can be
visualized with AFM, EFM, and STM. The exact mechanisms
of molecular packing motifs in 1b and 1c are unclear at the
moment and appears to be quite complex. Thus, modeling is
needed to further understand these molecular packing motifs.
The processing conditions such as solvent, concentration, and
type of substrate used provide control on the size, orientation
and number of the aggregates formed. Finally, it is possible to
align 1-D organic nanostructures using DC voltage, and that
the alignment depends on the strength of the electric field, the
thickness of the electrodes, the gap size, and the number of
molecules within the gap area. Using this method with more
electroactive molecules represents an untested method to
assemble and wire 1-D organic semiconductors in devices.
By the proper tuning of the chemical functionality, these
columnar structures can be used as model systems for inves-
tigating the charge transport in 1D organic semiconducting
nanostructures.
Acknowledgements
This work was supported by the Office of Basic Energy
Sciences, US D.O.E. (#DE-FG02-01ER15264) and US
National Science Foundation CAREER award (#DMR-02-
37860). TQN thanks the UCSB setup fund for financial
support. We thank Dr Arnold Tamayo for the energy mini-
mized molecular models of compounds 1a and 1b shown
in Fig. 3.
References
1 (a) J.-M. Lehn, Supramolecular Chemistry, VCH, Weinheim,1995; (b) J.-M. Lehn, Struct. Bonding, 2000, 96, 3–29; (c) G. M.Whitesides and B. Grzybowski, Science, 2002, 295, 2418–2421; (d)D. S. Lawrence, T. Jiang and M. Levett, Chem. Rev., 1995, 95,2229–2260; (e) M. M. Conn and J. Rebek, Chem. Rev., 1997, 97,1647–1668; (f) D. Philp and J. F. Stoddart,Angew. Chem., Int. Ed.Engl., 1996, 35, 1155–1196; (g) M. Muthukumar, C. K. Ober andE. L. Thomas, Science, 1997, 277, 1225–1232; (h) L. J. Prins, D.N. Reinhoudt and P. Timmerman, Angew. Chem., Int. Ed., 2001,40, 2382–2426.
2 (a) J. Wu, A. C. Grimsdale and K. L. Muellen, J. Mater. Chem.,2005, 15, 41–52; (b) T. Sekiguchi, S. Yoshida and K. M. Itoh,Phys. Rev. Lett., 2005, 95, 106101–106104; (c) G. H. Woehrle, M.G. Warner and J. E. Hutchison, Langmuir, 2004, 20, 5982–5988;(d) A. Gesquiere, M. M. S. Abdel-Mottaleb, S. De Feyter, F. C.De Schryver, F. Schoonbeek, J. van Esch, R. M. Kellogg, B. L.Feringa, A. Calderone, R. Lazzaroni and J.-L. Bredas, Langmuir,2000, 16, 10385–10391; (e) J. V. Barth, J. Weckesser, C. Cai, P.Gunter, L. Burgi, O. Jeandupeux and K. Kern, Angew. Chem.,Int. Ed., 2000, 39, 1230–1234; (f) B. Wen, C. Liu and Y. Liu,Chem. Lett., 2005, 34, 396–397; (g) B. W. Messmore, J. F. Hulvat,E. D. Sone and S. I. Stupp, J. Am. Chem. Soc., 2004, 126,14452–14458; (h) A. Datar, R. Oitker and L. Zang, Chem.Commun., 2006, 15, 1649–1651; (i) S. Lin, M. Li, E. Dujardin,C. Girard and S. Mann, Adv. Mater., 2005, 17, 2553–2559; (j) Z.Deng, Y. Tian, S.-H. Lee, A. E. Ribbe and C. Mao, Angew.Chem., Int. Ed., 2005, 44, 3582–3585; (k) J. Bae, J.-H. Choi, Y.-S.Yoo, N.-K. Oh, B.-S. Kim and M. Lee, J. Am. Chem. Soc., 2005,127, 9668–9669.
3 (a) S. Chandrasekhar and G. S. Ranganath, Discotic liquidcrystals, Rep. Prog. Phys., 1990, 53, 57–84; (b) C. Destrade, P.Foucher, H. Gasparoux, H. T. Nguyen, A. M. Levelut and J.Malthete, Disk-like mesogen polymorphism, Mol. Cryst. Liq.Cryst., 1984, 106, 121–46; (c) S. Chandrasekhar, S. Prasad andS. Krishna, ‘‘Recent developments in discotic liquid crystals’’,Contemp. Phys., 1999, 40, 237–245.
4 (a) S. Chandrasekhar, B. K. Sadashiva and K. A. Suresh, Liquidcrystals of disc-like molecules, Pramana, 1977, 9, 471–80; (b) S.Chandrasekhar, B. K. Sadashiva, K. A. Suresh, N. V. Madhu-sudana, S. Kumar, R. Shashidhar and G. Venkatesh, Disk-likemesogens, J. Phys. Colloq., 1979, 3, 120–4.
5 S. Chandrasekhar, Columnar, discotic nematic and lamellarliquid crystals their structures and physical properties, Handb.Liq. Cryst., 1998, 2B, 749–780.
Fig. 19 Topographic images of 1b on HOPG (A, scan size: 2 � 2 mm) and on a cleaned silicon wafer with 200 nm of thermally grown silicon
dioxide (B, scan size: 3 � 3 mm).
1530 | Phys. Chem. Chem. Phys., 2007, 9, 1515–1532 This journal is �c the Owner Societies 2007

6 (a) N. Boden and B. Movaghar, Handb. Liq. Cryst. Res., 1998,2B, 781–798; (b) N. Boden, R. J. Bushby, J. Clements and B.Movaghar, J. Mater. Chem., 1999, 9, 2081–2086; (c) A. M. Van deCraats, J. M. Warman, A. FechtenkKtter, J. D. Brand, M. A.Harbison and K. Mullen, Adv. Mater., 1999, 11, 1469–1472; (d)V. Percec, M. Glodde, T. K. Bera, Y. Miura, I. Shiyanovskaya,K. D. Singer, V. S. Balagurusamy, P. A. Heiney, I. Schnell, A.Rapp, H.-W. Spiess, S. D. Hudson and H. Duan, Nature, 2002,419, 384–387; (e) V. Percec, G. Johansson, J. Heck, G. Ungar andS. V. Batty, J. Chem. Soc., Perkin Trans. 1, 1993, 1411–1420; (f) J.Simon and C. Sirlin, Pure Appl. Chem., 1989, 61, 1625–1629; (g)O. E. Sielcken, L. A. van de Kuil, W. Drenth, J. Schoonman andR. J. M. Nolte, J. Am. Chem. Soc., 1990, 112, 3086–3093; (h) T.Christ, B. Gluesen, A. Greiner, A. Kettner, R. Sander, V.Stuempflen, V. Tsukruk and J. H. Wendorff, Adv. Mater., 1997,9, 48–52; (i) D. Adam, P. Schuhmacher, J. Simmerer, L.HNnssling, K. Siemensmeyer, K. H. Etzbach, H. Ringsdorf andD. Haarer, Nature, 1994, 371, 141–143; (j) L. Schmidt-Mende, A.FechtenkKtter, K. Mullen, E. Moons, R. H. Friend and J. D.MacKenzie, Science, 2001, 293, 1119–1122.
7 C. A. Hunter and J. K. M. Sanders, J. Am. Chem. Soc., 1990, 112,5525–5534.
8 (a) Metallomesogens, ed. J. L. Serrano, VCH, New York, 1996;(b) J. Simon, P. Bassoul, in Phthalocyanines Properties andApplications, Vol. 2, ed. C. C. Leznoff and A. B. P. Lever,VCH, New York, 1989, ch. 6; (c) A. G. Serrette, C. K. Lai andT. M. Swager, Chem. Mater., 1994, 6, 2252–2268.
9 V. Percec, Handb. Liq. Cryst. Res., 1997, 2B, 259–346.10 (a) M. Muller, C. Kubel and K. Mullen, Chem.–Eur. J., 1998, 4,
2099–2109; (b) H. Bengs, M. Ebert, O. Karthaus, B. Kohne, K.Praefcke, H. Ringsdorf, J. H. Wendorff and R. Wuestefeld, Adv.Mater., 1990, 2, 141–144; (c) M. Weck, A. R. Dunn, K. Matsu-moto, G. W. Coates, E. B. Lobkovsky and R. H. Grubbs, Angew.Chem., Int. Ed., 1999, 38, 2741–2745.
11 Hydrogen bonds used to stabilize p stacks: (a) Y. Matsunaga, N.Miyajima, Y. Nakayasu, S. Sakai and M. Yonenaga, Bull.Chem.Soc. Jpn., 1988, 61, 207–210; (b) L. Brunsveld, H. Zhang, M.Glasbeek, J. A. J. M. Vekemans and E. W. Meijer, J. Am. Chem.Soc., 2000, 122, 6175–6182, and references therein; (c) Y. Yasuda,E. Iishi, H. Inada and Y. Shirota, Chem. Lett., 1996, 7, 575–576;(d) M. P. Lightfoot, F. S. Mair, R. G. Pritchard and J. E. Warren,Chem. Commun., 1999, 19, 1945–1946; (e) E. Fan, J. Yang, S. J.Geib, T. C. Stoner, M. D. Hopkins and A. D. Hamilton, J. Chem.Soc., Chem. Commun., 1995, 12, 1251–1252; (f) D. Ranganathan,S. Kurur, R. Gilardi and I. L. Karle, Biopolymers, 2000, 54,289–295; (g) C. M. Paleos and D. Tsiourvas, Angew. Chem., Int.Ed. Engl., 1995, 34, 1696–1711, and references therein; (h) M. J.Brienne, J. Gabard, J.-M. Lehn and I. Stibor, J. Chem. Soc.,Chem. Commun., 1989, 24, 1868–1870; (i) D. Goldmann, R.Dietel, D. Janietz, C. Schmidt and J. H. Wendorff, Liq. Cryst.,1998, 24, 407–411; (j) G. Ungar, D. Abramic, V. Percec and J. A.Heck, Liq. Cryst., 1996, 21, 73–86; (k) V. Percec, C.-H. Ahn, T.K. Bera, G. Ungar and D. J. P. Yeardley, Chem.–Eur. J., 1999, 5,1070–1083; (l) J. Malthete, A. M. Levelut and L. Liebert, Adv.Mater., 1992, 4, 37–41; (m) D. Pucci, M. Veber and J. Malthete,Liq. Cryst., 1996, 21, 153–155.
12 (a) T.-Q. Nguyen, J. Wu, V. Doan, S. H. Tolbert and B. J.Schwartz, Science, 2000, 288, 652–656; (b) M. Funahashi and J.-I.Hanna, Phys. Rev. Lett., 1997, 78, 2184–2187. Polymer assembly;(c) L. Schmidt-Mende, A. Fechtenkotter, K. Mullen, E. Moons,R. H. Friend and J. D. MacKenzie, Science, 2001, 293,1119–1122; (d) H. Sirringhaus, P. J. Brown, R. H. Friend, M.M. Nielsen, K. Bechgaard, B. M. W. Langeveld-Voss, A. J. H.Spiering, R. A. J. Janssen, E. W. Meijer, P. Herwig and D. M. deLeeuw, Nature, 1999, 401, 685–688. Discotic assembly; (e) V.Percec, M. Glodde, T. K. Bera, Y. Miura, I. Shiyanovskaya, K.D. Singer, V. S. K. Balagurusamy, P. A. Heiney, I. Schnell, A.Rapp, H. W. Spiess, S. D. Hudson and H. Duan, Nature, 2002,419, 384–387.
13 (a) L. Mueller-Meskamp, B. Luessem, S. Karthaeuser, S. Prikho-dovski, M. Homberger, U. Simon and R. Waser, Phys. StatusSolidi A, 2006, 203, 1448–1452; (b) A. Ogunrinde, K. W. Hippsand L. Scudiero, Langmuir, 2006, 22, 5697–5701; (c) H. Inoue, G.Yoshikawa and K. Saiki, Jpn. J. Appl. Phys. P. 1, 2006, 45,1794–1796; (d) B. Luessem, L. Mueller-Meskamp, S. Karthaeu-
ser, R. Waser, M. Homberger and U. Simon, Langmuir, 2006, 22,3021–3027; (e) A. A. Dameron, L. F. Charles and P. S. Weiss, J.Am. Chem. Soc., 2005, 127, 8697–8704; (f) G. M. Florio, T. L.Werblowsky, T. Mueller, B. J. Berne and G. W. Flynn, J. Phys.Chem. B, 2005, 109, 4520–4532; (g) V. Arima, E. Fabiano, R. I. R.Blyth, F. Della Sala, F. Matino, J. Thompson, R. Cingolani andR. Rinaldi, J. Am. Chem. Soc., 2004, 126, 16951–16958; (h) E.Marx, K. Walzer, R. J. Less, P. R. Raithby, K. Stokbro and N. C.Greenham,Org. Electronics, 2004, 5, 315–320; (i) A. A. Dameron,J. W. Ciszek, J. M. Tour and P. S. Weiss, J. Phys. Chem. B, 2004,108, 16761–16767; (j) G. V. Nazin, S. W. Wu and W. Ho, Proc.Natl. Acad. Sci. U. S. A., 2005, 102, 8832–8837.
14 (a) W. Mamdouh, H. Uji-i, J. S. Ladislaw, A. E. Dulcey, V.Percec, F. C. De Schryver and S. De Feyter, J. Am. Chem. Soc.,2006, 128, 317–325; (b) H. Fukumura, H. D. I-i, H. Uji-I, S.Nishio, H. Sakai and A. Ohuchi, ChemPhysChem, 2005, 6,2383–2388; (c) S. De Feyter and F. C. De Schryver, J. Phys.Chem. B, 2005, 109, 4290–4302; (d) J. A. A. W. Elemans, M. C.Lensen, J. W. Gerritsen, H. van Kempen, S. Speller, R. J. M.Nolte and A. E. Rowan, Adv. Mater., 2003, 15, 2070–2073; (e) M.D. Watson, F. Jaeckel, N. Severin, J. P. Rabe and K. Muellen, J.Am. Chem. Soc., 2004, 126, 1402–1407; (f) D. G. Yablon, H.Fang, L. C. Giancarlo and G. W. Flynn, ACS Symp. Ser., 2002,810, 205–224.
15 (a) G. H. Buh, H. J. Chung and Y. Kuk, Appl. Phys. Lett., 2001,79, 2010; (b) C. Y. Ng, T. P. Chen, H. W. Lau, Y. Liu, M. S. Tse,O. K. Tan and V. S. W. Lim, Appl. Phys. Lett., 2004, 85, 2941; (c)H. Dongmoa, J. F. Carlottia, G. Bruguierb, C. Guascha, J.Bonneta and J. Gasiot, Appl. Surf. Sci., 2003, 212–213, 607.
16 (a) T. Uchihashi, T. Okusako, T. Tsuyuguchi, Y. Sugawara, M.Igarashi, R. Kaneko and S. Morita, J. Appl. Phys. Pt. I, 1994, 33,5573–5576; (b) T. D. Krauss and L. E. Brus, Phys. Rev. Lett.,1999, 83, 4840–4843; (c) T. D. Krauss, S. O’Brien and L. E. Brus,J. Phys. Chem. B, 2001, 105, 1725; (d) O. Cherniavskaya, L. Chenand L. Brus, J. Phys. Chem. B, 2004, 108, 4946; (e) P. M. Bridger,Z. Z. Bandic, E. C. Piquette and T. C. McGill, Appl. Phys. Lett.,1999, 74, 3522.
17 (a) H. Yamada, T. Fukuma, K. Umeda, K. Kobayashi and K.Matsushige, Appl. Surf. Sci., 2002, 188, 391–398; (b) J. N. Barisci,R. Stella, G. M. Spinks and G. G. Wallace, Electrochim. Acta,2000, 46, 519; (c) H. Takano and M. D. Porter, J. Am. Chem.Soc., 2001, 123, 8412; (d) S. Howell, D. Kuila, B. Kasibhatla, C.P. Kubiak, D. Janes and R. Reifenberger, Langmuir, 2002, 18,5120; (e) J. W. Hong, Sang-il Park and Z. G. Khim, Rev. Sci.Instrum., 1999, 70, 1375.
18 (a) M. L. Bushey, A. Hwang, P. W. Stephens and C. Nuckolls, J.Am. Chem. Soc., 2001, 123, 8157–8158; (b) M. L. Bushey, A.Hwang, P. W. Stephens and C. Nuckolls, Angew. Chem., Int. Ed.,2002, 41, 2828–2831; (c) T.-Q. Nguyen, M. L. Bushey, L. E. Brusand C. Nuckolls, J. Am. Chem. Soc., 2002, 124, 15051–15054; (d)W. Zhang, D. Horoszewski, J. Decatur and C. Nuckolls, J. Am.Chem. Soc., 2003, 125, 4870–4873; (e) M. L. Bushey, T.-Q.Nguyen and C. Nuckolls, J. Am. Chem. Soc., 2003, 125,8264–8269; (f) M. L. Bushey, T.-Q. Nguyen, W. Zhang, D.Horoszewski and C. Nuckolls, Angew. Chem., Int. Ed., 2004,43, 5446–5453; (g) T.-Q. Nguyen, R. Martel, P. Avouris, M.Bushey, C. Nuckolls and L. E. Brus, J. Am. Chem. Soc., 2004,126, 5234–5242.
19 T.-Q. Nguyen, R. Martel, A. Carlsen, P. Avouris, M. Bushey andC. Nuckolls, Nano. Lett., unpublished work.
20 Hydrogen bonds used to stabilize p stacks: (a) Y. Matsunaga, N.Miyajima, Y. Nakayasu, S. Sakai and M. Yonenaga, Bull. Chem.Soc. Jpn., 1988, 61, 207–210; (b) L. Brunsveld, H. Zhang, M.Glasbeek, J. A. J. M. Vekemans and E. W. Meijer, J. Am. Chem.Soc., 2000, 122, 6175–6182, and references therein; (c) Y. Yasuda,E. Iishi, H. Inada and Y. Shirota, Chem. Lett., 1996, 7, 575–576;(d) M. P. Lightfoot, F. S. Mair, R. G. Pritchard and J. E. Warren,Chem. Commun., 1999, 19, 1945–1946; (e) E. Fan, J. Yang, S. J.Geib, T. C. Stoner, M. D. Hopkins and A. D. Hamilton, J. Chem.Soc., Chem. Commun., 1995, 12, 1251–1252; (f) D. Ranganathan,S. Kurur, R. Gilardi and I. L. Karle, Biopolymers, 2000, 54,289–295; (g) C. M. Paleos and D. Tsiourvas, Angew. Chem., Int.Ed. Engl., 1995, 34, 1696–1711, and references therein; (h) M. J.Brienne, J. Gabard, J.-M. Lehn and I. Stibor, J. Chem. Soc.,Chem. Commun., 1989, 24, 1868–1870; (i) D. Goldmann,
This journal is �c the Owner Societies 2007 Phys. Chem. Chem. Phys., 2007, 9, 1515–1532 | 1531
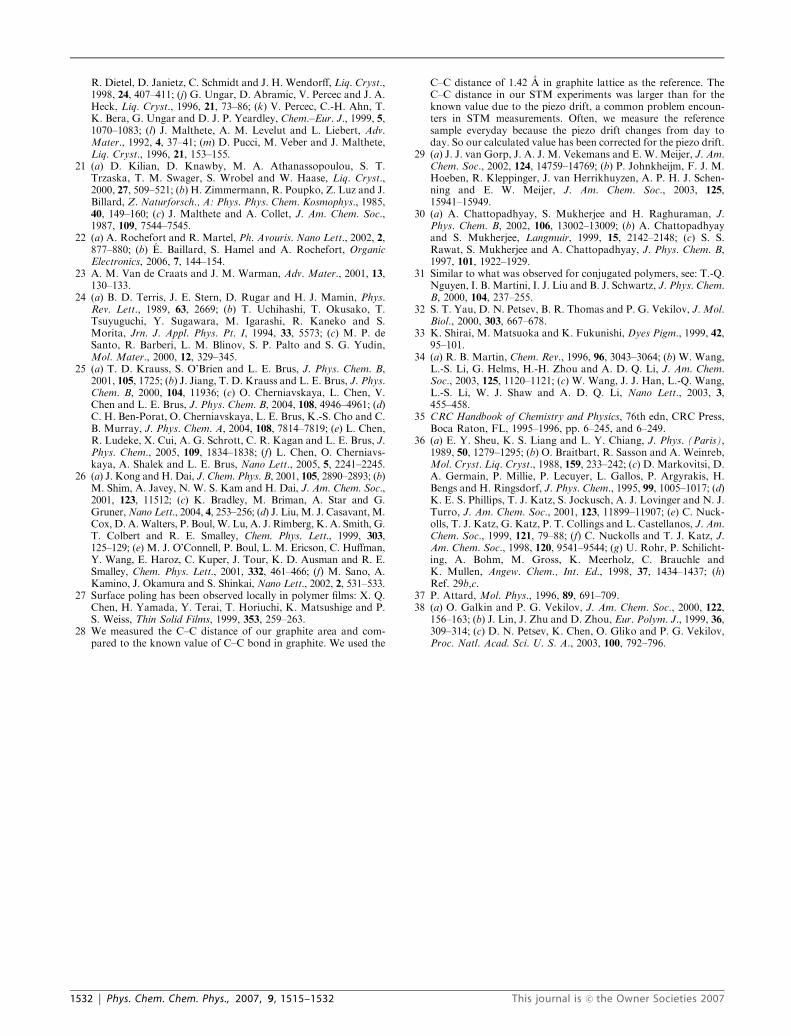
R. Dietel, D. Janietz, C. Schmidt and J. H. Wendorff, Liq. Cryst.,1998, 24, 407–411; (j) G. Ungar, D. Abramic, V. Percec and J. A.Heck, Liq. Cryst., 1996, 21, 73–86; (k) V. Percec, C.-H. Ahn, T.K. Bera, G. Ungar and D. J. P. Yeardley, Chem.–Eur. J., 1999, 5,1070–1083; (l) J. Malthete, A. M. Levelut and L. Liebert, Adv.Mater., 1992, 4, 37–41; (m) D. Pucci, M. Veber and J. Malthete,Liq. Cryst., 1996, 21, 153–155.
21 (a) D. Kilian, D. Knawby, M. A. Athanassopoulou, S. T.Trzaska, T. M. Swager, S. Wrobel and W. Haase, Liq. Cryst.,2000, 27, 509–521; (b) H. Zimmermann, R. Poupko, Z. Luz and J.Billard, Z. Naturforsch., A: Phys. Phys. Chem. Kosmophys., 1985,40, 149–160; (c) J. Malthete and A. Collet, J. Am. Chem. Soc.,1987, 109, 7544–7545.
22 (a) A. Rochefort and R. Martel, Ph. Avouris. Nano Lett., 2002, 2,877–880; (b) E. Baillard, S. Hamel and A. Rochefort, OrganicElectronics, 2006, 7, 144–154.
23 A. M. Van de Craats and J. M. Warman, Adv. Mater., 2001, 13,130–133.
24 (a) B. D. Terris, J. E. Stern, D. Rugar and H. J. Mamin, Phys.Rev. Lett., 1989, 63, 2669; (b) T. Uchihashi, T. Okusako, T.Tsuyuguchi, Y. Sugawara, M. Igarashi, R. Kaneko and S.Morita, Jrn. J. Appl. Phys. Pt. I, 1994, 33, 5573; (c) M. P. deSanto, R. Barberi, L. M. Blinov, S. P. Palto and S. G. Yudin,Mol. Mater., 2000, 12, 329–345.
25 (a) T. D. Krauss, S. O’Brien and L. E. Brus, J. Phys. Chem. B,2001, 105, 1725; (b) J. Jiang, T. D. Krauss and L. E. Brus, J. Phys.Chem. B, 2000, 104, 11936; (c) O. Cherniavskaya, L. Chen, V.Chen and L. E. Brus, J. Phys. Chem. B, 2004, 108, 4946–4961; (d)C. H. Ben-Porat, O. Cherniavskaya, L. E. Brus, K.-S. Cho and C.B. Murray, J. Phys. Chem. A, 2004, 108, 7814–7819; (e) L. Chen,R. Ludeke, X. Cui, A. G. Schrott, C. R. Kagan and L. E. Brus, J.Phys. Chem., 2005, 109, 1834–1838; (f) L. Chen, O. Cherniavs-kaya, A. Shalek and L. E. Brus, Nano Lett., 2005, 5, 2241–2245.
26 (a) J. Kong and H. Dai, J. Chem. Phys. B, 2001, 105, 2890–2893; (b)M. Shim, A. Javey, N. W. S. Kam and H. Dai, J. Am. Chem. Soc.,2001, 123, 11512; (c) K. Bradley, M. Briman, A. Star and G.Gruner,Nano Lett., 2004, 4, 253–256; (d) J. Liu, M. J. Casavant, M.Cox, D. A.Walters, P. Boul, W. Lu, A. J. Rimberg, K. A. Smith, G.T. Colbert and R. E. Smalley, Chem. Phys. Lett., 1999, 303,125–129; (e) M. J. O’Connell, P. Boul, L. M. Ericson, C. Huffman,Y. Wang, E. Haroz, C. Kuper, J. Tour, K. D. Ausman and R. E.Smalley, Chem. Phys. Lett., 2001, 332, 461–466; (f) M. Sano, A.Kamino, J. Okamura and S. Shinkai, Nano Lett., 2002, 2, 531–533.
27 Surface poling has been observed locally in polymer films: X. Q.Chen, H. Yamada, Y. Terai, T. Horiuchi, K. Matsushige and P.S. Weiss, Thin Solid Films, 1999, 353, 259–263.
28 We measured the C–C distance of our graphite area and com-pared to the known value of C–C bond in graphite. We used the
C–C distance of 1.42 A in graphite lattice as the reference. TheC–C distance in our STM experiments was larger than for theknown value due to the piezo drift, a common problem encoun-ters in STM measurements. Often, we measure the referencesample everyday because the piezo drift changes from day today. So our calculated value has been corrected for the piezo drift.
29 (a) J. J. van Gorp, J. A. J. M. Vekemans and E. W. Meijer, J. Am.Chem. Soc., 2002, 124, 14759–14769; (b) P. Johnkheijm, F. J. M.Hoeben, R. Kleppinger, J. van Herrikhuyzen, A. P. H. J. Schen-ning and E. W. Meijer, J. Am. Chem. Soc., 2003, 125,15941–15949.
30 (a) A. Chattopadhyay, S. Mukherjee and H. Raghuraman, J.Phys. Chem. B, 2002, 106, 13002–13009; (b) A. Chattopadhyayand S. Mukherjee, Langmuir, 1999, 15, 2142–2148; (c) S. S.Rawat, S. Mukherjee and A. Chattopadhyay, J. Phys. Chem. B,1997, 101, 1922–1929.
31 Similar to what was observed for conjugated polymers, see: T.-Q.Nguyen, I. B. Martini, I. J. Liu and B. J. Schwartz, J. Phys. Chem.B, 2000, 104, 237–255.
32 S. T. Yau, D. N. Petsev, B. R. Thomas and P. G. Vekilov, J. Mol.Biol., 2000, 303, 667–678.
33 K. Shirai, M. Matsuoka and K. Fukunishi, Dyes Pigm., 1999, 42,95–101.
34 (a) R. B. Martin, Chem. Rev., 1996, 96, 3043–3064; (b) W. Wang,L.-S. Li, G. Helms, H.-H. Zhou and A. D. Q. Li, J. Am. Chem.Soc., 2003, 125, 1120–1121; (c) W. Wang, J. J. Han, L.-Q. Wang,L.-S. Li, W. J. Shaw and A. D. Q. Li, Nano Lett., 2003, 3,455–458.
35 CRC Handbook of Chemistry and Physics, 76th edn, CRC Press,Boca Raton, FL, 1995–1996, pp. 6–245, and 6–249.
36 (a) E. Y. Sheu, K. S. Liang and L. Y. Chiang, J. Phys. (Paris),1989, 50, 1279–1295; (b) O. Braitbart, R. Sasson and A. Weinreb,Mol. Cryst. Liq. Cryst., 1988, 159, 233–242; (c) D. Markovitsi, D.A. Germain, P. Millie, P. Lecuyer, L. Gallos, P. Argyrakis, H.Bengs and H. Ringsdorf, J. Phys. Chem., 1995, 99, 1005–1017; (d)K. E. S. Phillips, T. J. Katz, S. Jockusch, A. J. Lovinger and N. J.Turro, J. Am. Chem. Soc., 2001, 123, 11899–11907; (e) C. Nuck-olls, T. J. Katz, G. Katz, P. T. Collings and L. Castellanos, J. Am.Chem. Soc., 1999, 121, 79–88; (f) C. Nuckolls and T. J. Katz, J.Am. Chem. Soc., 1998, 120, 9541–9544; (g) U. Rohr, P. Schilicht-ing, A. Bohm, M. Gross, K. Meerholz, C. Brauchle andK. Mullen, Angew. Chem., Int. Ed., 1998, 37, 1434–1437; (h)Ref. 29b,c.
37 P. Attard, Mol. Phys., 1996, 89, 691–709.38 (a) O. Galkin and P. G. Vekilov, J. Am. Chem. Soc., 2000, 122,
156–163; (b) J. Lin, J. Zhu and D. Zhou, Eur. Polym. J., 1999, 36,309–314; (c) D. N. Petsev, K. Chen, O. Gliko and P. G. Vekilov,Proc. Natl. Acad. Sci. U. S. A., 2003, 100, 792–796.
1532 | Phys. Chem. Chem. Phys., 2007, 9, 1515–1532 This journal is �c the Owner Societies 2007