self -compacting concrete at fire temperatures persson,...
TRANSCRIPT

LUND UNIVERSITY
PO Box 117221 00 Lund+46 46-222 00 00
Self -compacting concrete at fire temperatures
Persson, Bertil
Published: 2003-01-01
Link to publication
Citation for published version (APA):Persson, B. (2003). Self -compacting concrete at fire temperatures. (Report TVBM; Vol. 3110). Division ofBuilding Materials, LTH, Lund University.
General rightsCopyright and moral rights for the publications made accessible in the public portal are retained by the authorsand/or other copyright owners and it is a condition of accessing publications that users recognise and abide by thelegal requirements associated with these rights.
• Users may download and print one copy of any publication from the public portal for the purpose of privatestudy or research. • You may not further distribute the material or use it for any profit-making activity or commercial gain • You may freely distribute the URL identifying the publication in the public portalTake down policyIf you believe that this document breaches copyright please contact us providing details, and we will removeaccess to the work immediately and investigate your claim.

Download date: 30. May. 2018
SELF-COMPACTING CONCRETE AT FIRE TEMPERATURES Bertil Persson
LUND INSTITUTE OF TECHNOLOGY LUND UNIVERSITY Division of Building Materials
TVBM-3110 Lund 2003

ISRN LUTVDG/TVBM--03/3110--SE(1-200) ISSN 0348-7911 TVBM ISBN 91-631-3301-6 Revised September 2003 Lund Institute of Technology Telephone: 46-46-2227415 Division of Building Materials Telefax: 46-46-2224427 Box 118 www.byggnadsmaterial.lth.se SE-221 00 Lund, Sweden

PREFACEConcrete that does not require any energy for compacting in order to cover the reinforcement or fill out the mould has attracted a great deal of in-terest. Swedish experience now exists from 19 full-scale bridges and other full-scale projects with Self-Compacting Concrete, SCC. The tech-nique has also been introduced for dwelling hou-ses, tunnels and office buildings. A railway tunnel has been constructed with SCC and a double highway tunnel was recently made with SCC. SCC has also been introduced for the production of piles. Regarding concrete under severe circum-stances for construction of bridges, dams, tunnels and so forth, the requirements of durability call for a higher level of documentation than for con-crete that is used for dwelling houses or office buildings. The primary durability properties are chloride ingress, fire resistance, internal frost re-sistance, salt frost scaling and sulphate resistance for concrete in severe situations. All these proper-ties except for the fire resistance were recently studied at our department. Salt frost scaling, inter-nal frost resistance and sulphate resistance did not differ much from the corresponding properties of normal compacting concrete. The chloride ingress in a laboratory investigation showed larger chlo-ride migration coefficient in SCC than in normal concrete, NC. An investigation of concrete with somewhat lower water-cement ratio, w/c, cast in the field showed smaller chloride migration coef-ficient in SCC than in NC. It is known from the Great Belt railway tunnel and also from the Chan-nel railway tunnel that large-scale spalling of High-Performance Concrete, HPC, may occur during catastrophic fire, especially in concrete at low w/c. Such spalling is avoided by including polypropylene fibres in the concrete. However, a code of practice is lacking for how to use poly-propylene fibre in order to avoid spalling in case of fire. In this project the objectives were to inves-tigate mechanical performance under compressive loading at fire temperature conditions of SCC that contains different amount of polypropylene fibre, different types of cement and air content, precon-ditioned either in the air or in water. The objective was also to compare the result of performance un-der compressive loading at high temperature con-ditions with the corresponding properties of NC. The w/c of the concrete was either 0.40, 0.55 or 0.70. Finally the objectives were to give recom-mendations on how to produce a SCC that can
withstand fire spalling. The following persons in the coordination group of the project are grate-fully acknowledged: • Christer Dieden (head of the group) • Göran Fagerlund • Ulf Jönsson • Jens Oredsson The following persons in the reference group of the project are also gratefully acknowledged for their participation: • Patrik Groth • Tomas Hermodsson • Katarina Kieksi • Robert Ronnebrant Financial support from the following organisa-tions and companies is also gratefully acknowl-edged: • Brandforsk • Skanska Prefab AB, SPAB • The Development Fund of the Swedish Con-
struction Industry, SBUF • SP, Swedish Testing and Research Institute Finally, thanks are due to the following persons for finalizing the report and carrying out the labo-ratory experiments: • Britt Andersson • Stefan Backe • Peter Friberg • Göran Klevbo • Ingemar Larsson • Thord Lundgren • Martin Hansson • Bengt Nilsson • Sten Rodenstam • Lennart Thorsson Lars Boström was in charge of the full-scale tests. Lund, 13 March 2003 Bertil Persson

b

c
CONTENTS PAGE SYMBOLS e SUMMARY g SAMMANFATTNING OCH SLUTSATSER k 1. INTRODUCTION, LIMITATIONS AND OBJECTIVE 1 1.1 Introduction 1 1.2 Limitations 1 1.3 Objectives 1 2. PREVIOUS RESEARCH 2 2.1 Effect of stress and heating state on compressive strength 2 2.2 Effect of changes in cement paste 2 2.3 Effect of thermal movements between aggregate and cement paste on compressive strength 2 2.4 Tensile strength after heating 4 2.5 Creep at varying temperatures and temperature gradients 6 2.6 Steam pressure during heating 9 2.7 High Performance Concrete, HPC 9 2.7.1 Swedish recommendations 9 2.7.2 Swedish research on fire spalling 11 2.7.3 Research conditions for Swedish tests 11 2.7.4 Performance of columns in fire 14 2.7.5 Effect of high temperature on the permeability 15 2.7.6 Thermal stresses and water vapour pressure of HPC 16 2.7.7 Rapid heating 18 2.7.8 Relative strength 19 2.7.9 Comparison with European codes 19 2.8 SCC with steel fibres 20 2.9 German code for SCC 21 2.10 Explosive fire spalling 22 2.10.1 Conditions for fire spalling 22 2.10.2 Tests on Self Compacting concrete, SCC 23 3. MATERIAL AND METHODS 25 3.1 Material 25 3.2 Optimisation of SCC 25 3.3 Fabrication of specimen for spalling tests 25 3.4 Mechanical behaviour of concrete 25 4. RESULTS 27 4.1 Time schedule 27 4.2 Optimisation and strength 27 4.3 Pre-testing in oven at LTH 27 4.4 Stress/strain tests in oven 27 5. ANALYSIS 37 5.1 Optimisation 37 5.1.1 Optimisation at LTH 37 5.1.2 Re-optimisation at LTH 37 5.1.3 Differences of mixes 37 5.1.4 Conclusions on particle grading 39 5.2 Strength 39 5.2.1 Effect of fibres 39 5.2.1 Effect of filler 39 5.3 Unstressed properties 40 5.3.1 Residual properties at 20 °C 40 5.3.2 Hot properties 40 5.3.3 Formulas 45 5.3.4 Comparison with others 45 5.4 Elastic modulus 47 5.4.1 Dynamic elastic modulus 47 5.4.2 Evaluation of dynamic elastic modulus 47

d
5.4.3 Comparison between Edyn and Estat 48 5.4.4 Elastic moduli, Edyn and Estat 49 5.5 Moisture losses at heating 50 5.6 Comparison of RH in columns and cylinders 50 5.7 Spalling of cylinders at slow heating 50 6. TEST SIGNIFICANCES AND SOURCES OF ERROR 52 6.1 Sources of error 52 6.2 Test significance 52 7. SUPPLEMENTARY TESTS 53 7.1 General 53 7.2 Residual elastic modulus strength at 600 °C 53 7.2 Porosity at water suction 58 7.3 Resistance to water penetration at suction 59 7.4 Capillary water suction and porosity 61 8. DISCUSSION 62 8.1 General 62 8.2 Effect of high temperature on mechanical properties of concrete 63 8.3 Influence of mix proportions on fire spalling of concrete columns 63 8.4 Parameters affecting fire spalling 64 8.4.1 Concrete A with Portland cement type I 64 8.4.2 Concrete B with filler cement type II 65 8.4.3 Summary of parameter study on spalling 67 8.5 Outcome of cement content on fire spalling 67 8.6 Weight of curing, air entrainment and testing age on fire spalling 68 8.7 Consequence of amount and type of fibre 69 8.8 Effect of moisture and hydration losses 71 8.8.1 Moisture content 71 8.8.2 Isothermal behaviour 71 8.8.3 Hydration losses 71 8.9 Effect of porosity on fire spalling 72 8.10 Influence of resistance to water penetration at water suction 74 8.10.1 General 74 8.10.2 Conditions after heating to 105 °C 75 8.10.3 Conditions after heating to 200 °C 75 8.10.4 Conditions after heating to 400 °C 76 8.10.5 Conditions after heating to 600 °C 76 8.10.6 Summary of influence of resistance to water penetration at water suction 77 8.11 Amount of fibres to prevent fire spalling 78 8.12 Evaluation of equations 82 9. CONCLUSIONS 90 9.1 General 90 9.2 Mix proportions of concrete 90 9.3 Mechanical properties 90 9.4 Effect of properties on fire spalling 91 9.4.1 Moisture and isothermal behaviour 91 9.4.2 Effect of cement content, age and curing 91 9.4.3 Capillarity, water suction and fibres 91 9.5 Polypropylene fibres to prevent fire spalling 92 REFERENCES 94 APPENDICES 99-200

e
SYMBOLS a,b constants for particle distribution c cement content c,e,g constants for current and residual properties of concrete at and after elevated temperatures c/p cement-powder ratio d sieve size (0.1 < d < 10 mm) f filler content fc compressive cylinder strength (MPa) fct,T split tensile strength at elevated temperature (MPa) fct,20 tensile strength at 20 °C (MPa) fct,T20 split tensile strength at 20 °C after cooling from the elevated temperature (MPa) fc28f 28-day strength with filler (MPa) fc28ppf 28-day strength (fibre, MPa) fc280 28-day strength (no fibre, MPa) h relative weight after evaporated or hydrated water losses m resistance to water penetration after heating (s/m²·106) n FTF (Hz) o slope of the water suction between 0 and 4 min. versus square root of time p material passing p powder content (=cement + filler) ppf polypropylene fibre amount (kg/m³) q slope of the water suction between 1000 and 4000 min. versus square root of time r constant in order fully to describe suction between 1000 and 4000 min. (kg/m²) r residual and current relative properties of concrete at and after elevated temperatures s particle passing through t thickness of specimen (m t time (h) t concrete age (2 < t < 28 days) w/b water-binder ratio w/c water-cement ratio w/p water-powder ratio w/Pc the water-Portland cement ratio A concrete A with Anläggningscement (Degerhamn) and air-entrainment B concrete B with Byggcement and natural air content B sealed curing Cto torsional creep (rad/mm) D air curing (drying) D diameter of the specimen (in.) Edyn dynamic elastic modulus (obtained by FRF, GPa) Estat modulus of elasticity (at loading in the stress/strain tests, GPa) FRF fundamental resonance frequency (Hz) G Glass filler G weight (kg) HPC High Performance Concrete, K limestone powder K ratio of gyration (=d/4 for cylinder) L length (in.) NC normal compacting concrete O optimisation P testing Pc/p the Portland cement –powder ratio Pcap denotes the capillary porosity S square beam T manufacture of 20 cylinders T temperature (°C) T temperature at heating R reference

f
RH relative humidity SCC Self-Compacting Concrete Tsat temperature of saturation (°C). U executed testing V/A half the hydraulic radius, volume to area W weight of the specimen (lb.) W weight after fire spalling Wdry dry weight after heating 1 week at 105 °C and cooling in exsiccator at 20 °C Wwet wet weight before heating WA weight after fire spalling of water-cured concrete A with type I cement WT weight in exsiccator at 20 °C after heating to 105 °C, 200 °C, 400 °C or 600 °C. WU weight under water at 20 °C after heating to 105 °C, 200 °C, 400 °C or 600 °C. WV weight after water ingress in vacuum at 20 °C after heating to 105 °C, 200 °C, 400 °C or 600 °C. 0 amount of polypropylene fibres (kg /m³) 40 w/c (%) δfc/δt strength increase rate (MPa/day)

g
SUMMARY
1. General This report describes experimental studies of the mechanical performance of Self-Compacting Concrete, SCC, under compressive loading at fire temperatures. The SCC contains different amounts of polypropylene fibre, different types of cement and air content, preconditioned either in the air or in water. The result of the studies was compared with the corresponding properties of normal con-crete, with the same w/c and air content. Half a year’s or one year’s age applied at the time of test-ing. The strength development of the concrete was followed in parallel. Seven SCCs with w/c = 0.40, 0.55 or 0.70 and one normal concrete, NC, with w/c = 0.40 were studied for compressive strength in a fire temperature oven. The temperatures were 200 °C, 400 °C and 800 °C. Both testing at ele-vated temperature and after cooling took place. Elastic modulus, ultimate strain at maximum strength, dynamic modulus and relative humidity, RH, were studied in parallel. Supplementary tests of were performed, after cooling from 600 °C, of strength, elastic modulus, ultimate strain at maxi-mum strength. Supplementary tests were also per-formed on capillary suction, porosity and resistance to water penetration at water suction. The results of the laboratory tests were compared with results of full-scale tests on twelve SCCs with w/c = 0.40, 0.55 or 0.70 and 4 NCs with w/c = 0.40, 0.55 or 0.70 on fire spalling carried out in a high-temperature oven. The same concrete was studied in the laboratory and in full-scale tests. The concrete was air-cured at an ambient RH = 60%, or water-cured from demoulding until test-ing. The effects of increased amount of polypro-pylene fibres, age, different types of cement and air content, capillary suction, porosity, moisture content, hydration losses, preconditioning either in the air or in water, were studied.
2. Mix proportions obtained at LTH One fundamental point was the way to produce concrete with polypropylene fibre. Therefore the principles of the mix proportions are given even though it may seem too detailed. These results are based on concrete mix proportions defined by the grading curves of the fresh SCC. More fine mate-rials were required in SCC than in NC in order to incorporate 4 kg/m³ of fibres in the mixed propor-tions. With 2 kg/m³ more traditional mix propor-tions of SCC were used.
3. Mechanical properties obtained at LTH Glass or limestone filler additives increased strength substantially at normal temperature even though the cement content was somewhat lower in SCC than in NC. Probably a more efficient pack-ing of the particles was the reason for the enlarged strength. Strength was increased by 0.07 MPa per kg/m³ increasing amount of filler added. Additives of polypropylene fibres decreased strength by 2.3% per kg/m³ increasing amount of fibre added. Water-cured cylinders of SCC, 100 mm in diame-ter, without polypropylene fibres, exhibited spalling at 480 °C/h heating rate. At 240 °C/h heating rate cylinders of SCC, 100 mm in diame-ter, without polypropylene fibres, exhibited no spalling. Once spalling was avoided, SCC and NC behaved similarly at high temperature except at 800 °C at which temperature SCC with limestone powder did not show any residual strength at all after cooling down to 20 °C, Figure 1. Figure 2 shows the properties of SCC with limestone pow-der. Comparison with HPC shows greater strength between 100 °C and 200 °C of SCC than that of HPC, Figure 3. Greater loss of the elastic modulus was obtained than seen before, Figure 4.
0.00
0.50
1.00
1.50
2.00
2.50
3.00
0 200 400 600 800Temperature (°C)
Rel
ativ
e pr
oper
ty
Hot E-modulusHot strengthHot strainResidual E-modulusResidual strengthResidual strain
Figure 1 – Relative properties of concrete at/after elevated temperature except for residual property with limestone powder at 800 °C.

h
0.00
0.50
1.00
1.50
2.00
2.50
3.00
0 200 400 600 800
Temperature (°C)
Res
idua
l pro
pert
y
E-modulusStrengthStrain at maxiumum strength
Figure 2 - Relative residual properties of SCC with limestone powder versus temperature.
0.00
0.20
0.40
0.60
0.80
1.00
0 200 400 600 800Temperature (°C)
Rel
ativ
e st
reng
th
Hot strengthCEB [40]Eurocode Siliceous [40]RakMK HPC [40]
Figure 3 - Hot strength (64 specimens), CEB, Eurocode Siliceous and RakMP HPC code [40].
0.00
0.20
0.40
0.60
0.80
1.00
0 200 400 600 800Temperature (°C)
Rel
ativ
e el
astic
mod
ulus
Residual HPC [38]NC [38]
Figure 4 – E-modulus compared with [38].
4. Effect of properties of concrete on fire spalling tested at SP [94]
4.1 Moisture and isothermal behaviour About 3% moisture in normal concrete is critical for the fire spalling to take place [79]. Even though the concrete was dried out to about 75%RH, very moisture content was observed. Moisture content as follows was measured: • Previous research with HPC [40]: 2.2% • Air-cured specimen: 3.6% • Water-cured specimen: 5.9% In comparison about 3.1% moisture content is suf-ficient to cause fire spalling at the stress level used in the experiments, about 15 MPa. The moisture content of SCC was compared with the isotherm of normal concrete. SCC showed larger moisture content than NC when RH was held constant, es-pecially SCC with glass filler.
4.2 Effect of cement content, age and curing It was observed that the cement-powder ratio, c/p, of the concrete had a substantial effect on the fire spalling – the lower the c/p, the larger the fire spalling. At water-cement ratio, w/c = 0.40, fire spalling was avoided with c/p > 0.80 but became unacceptably large in concrete with c/p = 0.60. One way to avoid fire spalling seems to be to in-crease c/p. At half a year’s age the same fire spalling was observed for a concrete with 4 kg/m³ fibres as for a one-year-old concrete with 2 kg/m³ of fibres. With water curing only half the resis-tance of water penetration of SCC was acceptable compared with the resistance of water penetration for air-cured concrete, probably due to a better hydration conditions with water curing.
4.3 Capillarity, water suction and fibres At constant porosity both air and water-cured SCC showed greater resistance to water penetra-tion than normal concrete, NC, did, which may be an explanation for the increased sensitivity of SCC to fire spalling compared with NC observed on tests performed at SP [94]. The largest increase of relative porosity with increasing temperature was observed for NC; the lowest increase of rela-tive porosity was observed for SCC with low w/c without fibres. For SCC with fibres the increase of porosity was less than for NC, probably since lar-ger water pressure than available in a 20-mm-concrete was required for the increase of porosity with fibres to take place. The smallest relative re-sistance to water penetration was consequently observed for NC. The observations of differences between porosity and resistance to water penetra-tion of SCC and NC show that another structure

i
may be formed in SCC than in NC even though the isotherm performed similarly at normal tem-perature. At higher temperature the porosity in-creased more rapidly and the resistance to water penetration dropped more in NC than in SCC. For SCC with fibres increase of the relative resistance to water penetration was observed. For concrete with 2 kg/m³ polypropylene fibres larger resis-tance to water penetration at suction was observed at 105 °C than for the same concrete without fi-bres and than for concrete with 4 kg/m³ polypro-pylene fibres. For concrete with 4 kg/m³ polypropylene fibres larger resistance to water penetration at suction was observed at 200 °C than for the same concrete without fibres and for con-crete with 2 kg/m³ polypropylene fibres. The rea-son for the increasing resistance to water penetration was probably an expansion and melt-ing of the polypropylene fibres at 105-200 °C. These phenomena remained after the specimen has cooled to 20 °C and therefore decreased the water suction. As mentioned above, a much larger structure is required than 20 mm in thickness for the water pressure to form and to transport the melting, liquid polypropylene fibres out of the pores. During fire heating water transport will be prohibited inward in concrete with fibres. In this case the water pressure in concrete with fibres will increase more slowly than in concrete with no fi-bres as the water, instead of moving inward leaves the surface. This may explain the mechanism of polypropylene fibres in concrete at fire: • Possible increase of polypropylene fibre vol-
ume and melting at 105-200 °C. • Water movement inward concrete with fibre
is diminished at 105-200 °C due to an in-crease in the resistance to water penetration.
• Water instead moves to the surface of con-crete with fibres and fire spalling is avoided.
5. Polypropylene fibres to prevent spalling of 200-mm square reinforced columns
5.1 Calculation on cement and fibre content Estimation was done for the amount of fibres ver-sus w/c and c/p. According to a parameter study, the most important factor to prohibit fire spalling was a high cement-powder ratio, c/p. Figure 5 shows the amount of 32 µm fibres, ppfnormal, at constant moisture content and stress level in order to limit the fire spalling of SCC to that of normal concrete without fibres (kg/m³): ppfnormal=(28·(c/p)²-26·(c/p)-2.4)·ln(w/c)+ 45·(c/p)²- 68·(c/p)+23 > 0 (1)
0.400.500.600.70
0.60
0.70
0.80
0.90
0.0
2.0
4.0
6.0
Fibr
es (n
orm
al,k
g/m
³)
w/cc/p
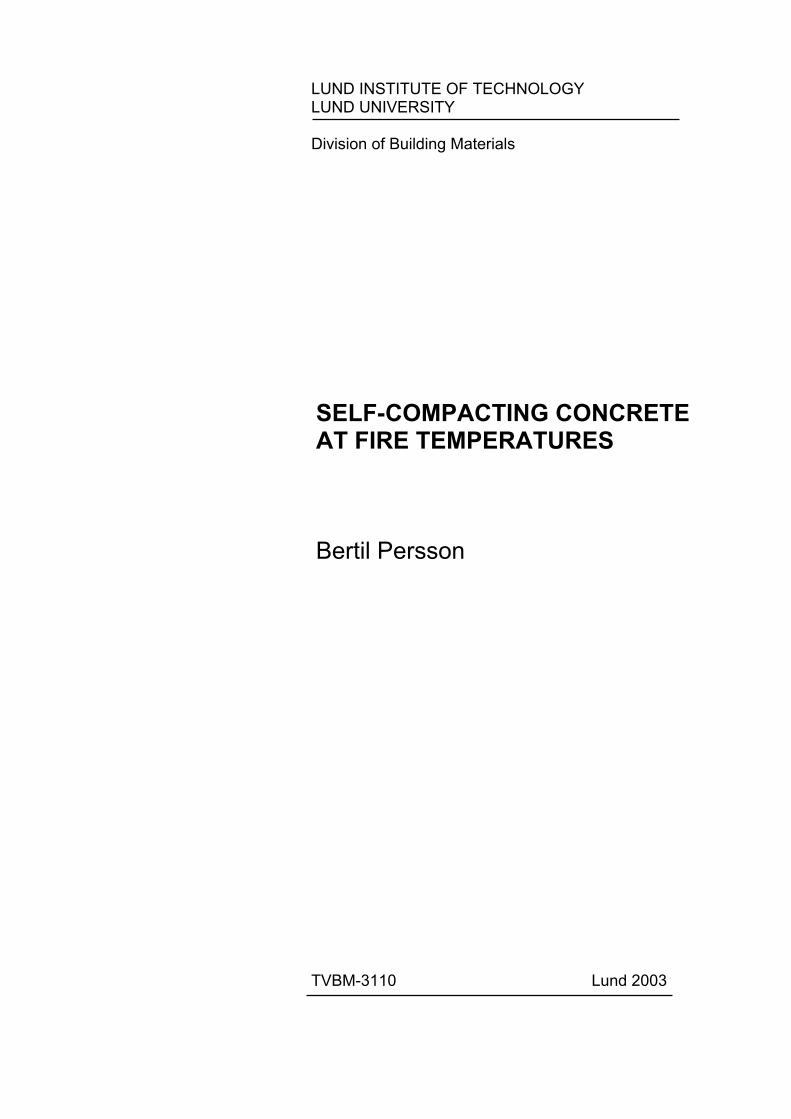
Figure 5 - Amount of fibres at constant moisture content and stress level in order to limit the fire spalling of SCC to that of normal concrete without fibres versus the cement-powder ratio, c/p, and the water-cement ratio, w/c. Figure 6 shows the fibre requirement in order to limit the fire spalling at 15% at half a year’s age. The following equation for the amount of poly-propylene fibre in order to limit the fire spalling at 15% at half a year’s age was obtained (32 µm fi-bres, kg/m³): ppf85%=(-35·(c/p)²+34.9·(c/p)-16.7)·ln(w/c)-25·(c/p)+11.7 > 0 (2) c/p denotes the cement-powder ratio {0.50 <
c/p < 1} p denotes cement and powder (glass or lime-
stone filler) ppf85% denotes the content of 32 µm polypropylene
fibres to limit the fire spalling to 15% at half a years’s age (32 µm fibres, kg/m³)
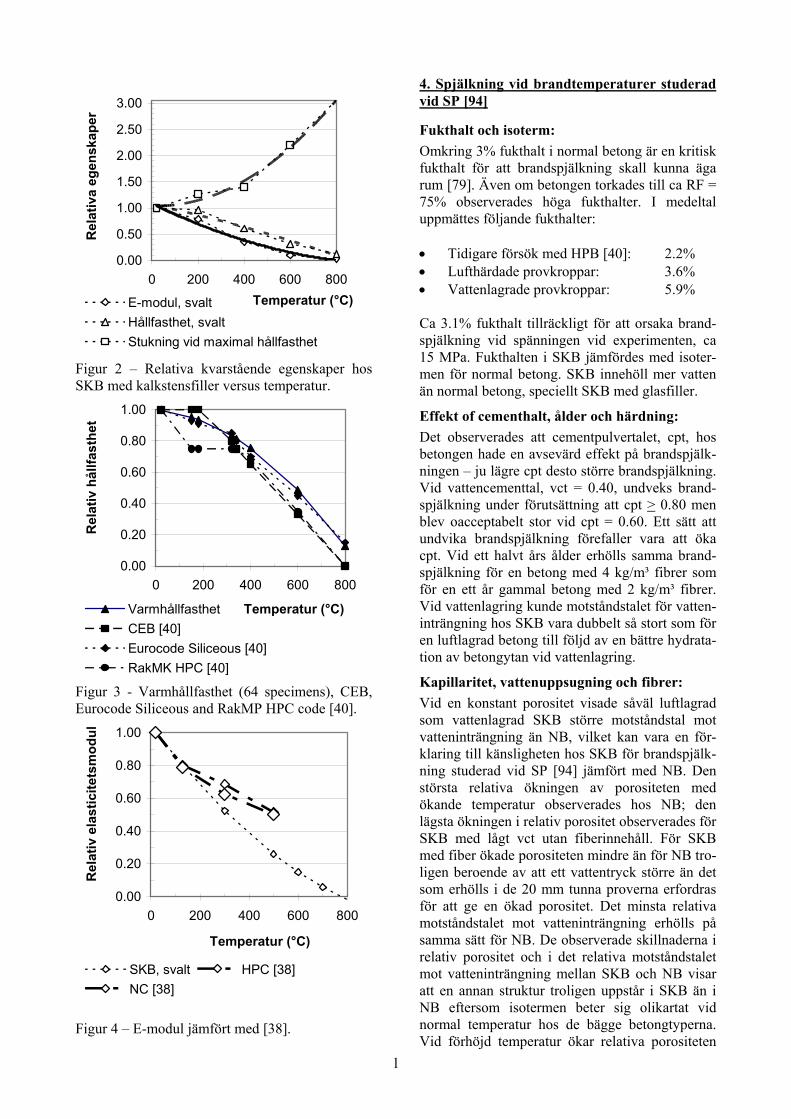
5.2 Calculation based on the fibre and Port-land cement content Another synthesis was required for the amount of fibres in concrete versus the water-Portland ce-ment ratio, w/Pc and the Portland cement-powder ratio, Pc/p. Figure 7 shows the amount of 32 µm fibre at constant moisture content and stress level required for the same fire spalling of SCC like for normal: ppfnormal =(13·(Pc/p)-12.3)·ln(w/Pc)-2.69·(Pc/p)² +2.65·(Pc/p) – 0.2 > 0 (3) ppfnormal 32 µm fibres to obtain the same weight
after fire of SCC like for normal w/Pc denotes the water-Portland cement ratio Pc/p denotes Portland cement-powder ratio
j
0.40
0.50
0.60
0.70
0.60
0.70
0.80
0.90
0.0
2.0
4.0
6.0
Fibr
es (1
5%
spal
ling,
kg/m
³)
w/cc/p
Figure 6 - Fibres based on 85% remaining weight after fire compared with the original one.
0.40
0.50
0.60
0.70
0.800.
500.
600.
700.
85
0.0
2.0
4.0
6.0
Fibr
e (n
orm
al,k
g/m
³)
w/PcPc/p
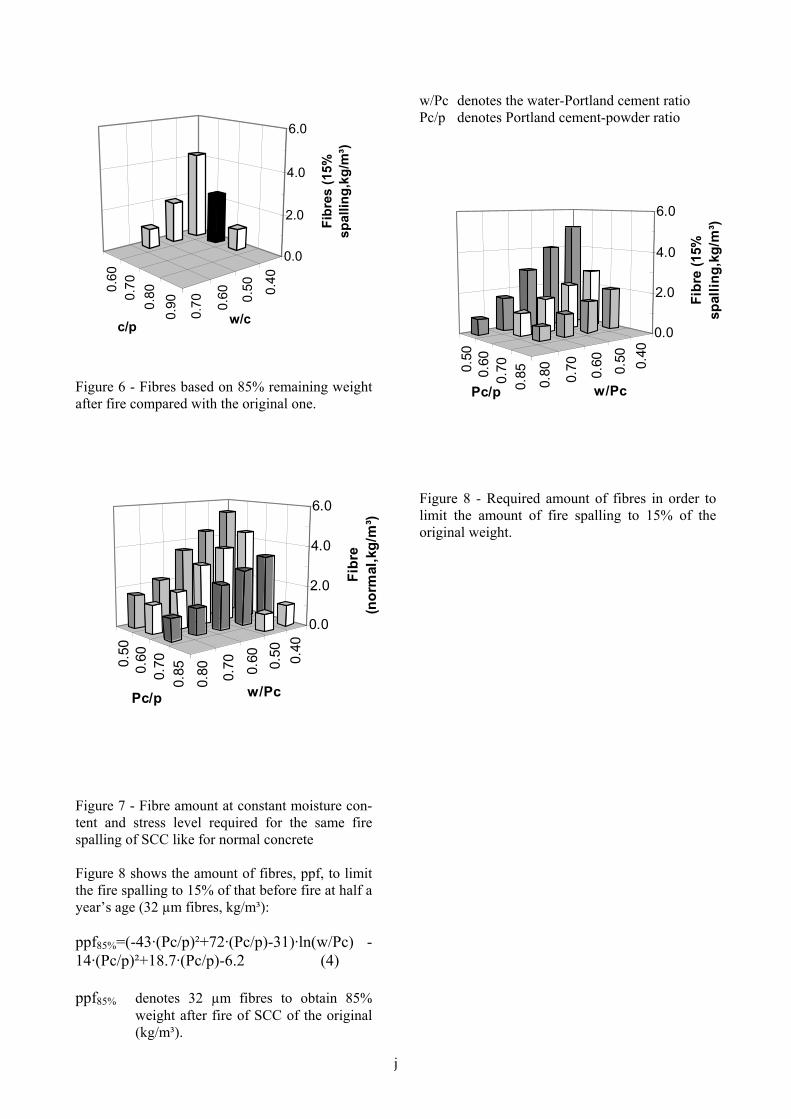
Figure 7 - Fibre amount at constant moisture con-tent and stress level required for the same fire spalling of SCC like for normal concrete Figure 8 shows the amount of fibres, ppf, to limit the fire spalling to 15% of that before fire at half a year’s age (32 µm fibres, kg/m³): ppf85%=(-43·(Pc/p)²+72·(Pc/p)-31)·ln(w/Pc) -14·(Pc/p)²+18.7·(Pc/p)-6.2 (4) ppf85% denotes 32 µm fibres to obtain 85%
weight after fire of SCC of the original (kg/m³).
w/Pc denotes the water-Portland cement ratio Pc/p denotes Portland cement-powder ratio
0.40
0.50
0.60
0.70
0.800.
500.
600.
700.
85
0.0
2.0
4.0
6.0
Fibr
e (1
5%
spal
ling,
kg/m
³)
w/PcPc/p
Figure 8 - Required amount of fibres in order to limit the amount of fire spalling to 15% of the original weight.

k
SAMMANFATTNING OCH SLUTSATSER
1. Allmänt Denna rapport beskriver experimentella studier av mekaniska egenskaper hos självkompakterande betong, SKB, under tryckspänning vid brandtem-peraturer. SKB innehåller olika mängder polypro-pylenfibrer, olika cement och lufthalt, förlagrad endera i luft eller i vatten. Resultaten av studierna jämförs med motsvarande egenskaper hos normal betong, NB, med samma vattencementtal, vct, och lufthalt. Ett halvt år eller ett års ålder används vid försöken. Hållfasthetsutvecklingen studerades pa-rallellt hos betongen. Sju SKB med vct = 0.40, 0.55 eller 0.70 och en NB med vct = 0.40 studera-des i fråga om hållfasthet vid temperaturförsök i ugn. Temperaturer var 200 °C, 400 °C och 800 °C. Försök utfördes såväl i varmt tillstånd som ef-ter avsvalning. Elasticitetsmodul, brottstukning vid maximal hållfasthet, dynamisk elasticitetsmo-dul och relativ fuktighet, RF, studerades parallellt. Kompletterande försök utfördes efter avsvalning från 600 °C av hållfasthet, elasticitetsmodul, brottstukning vid maximal hållfasthet. Komplette-rande försök utfördes även i fråga om mot-ståndstal mot vatteninträngning, kapillaritet och porositet. Laboratorieresultaten jämfördes med fullskaleförsök på tolv SKB med vct = 0.40, 0.55 eller 0.70 och 4 NB med vct = 0.40, 0.55 eller 0.70 beträffande brandspjälkning utförda i en hög-temperaturugn. Exakt samma betong studerades i laboratoriet som vid fullskaleförsöket. Betongen härdades endera i luft vid ca RF = 60% eller i vat-ten från tillverkning fram till fullskaleförsöken. Effekterna av ökad mängd polypropylenfibrer, ål-der, olika typer av cement och lufthalt, kapillari-tet, porositet, fukthalt, hydratationsförluster och härdningssätt, studerades.
2. Betongrecept framtagna vid LTH En fundamental förutsättning var att självkompak-terande betong, SKB, med polypropylenfibrer kunde produceras. Därför ges principer för be-tongproportionering även om detta kan verka att gå alltför djupt in i detalj. Resultaten bygger på betongrecept utförda med en ideal partikelfördel-ning i den färska betongen. Mer finmaterial er-fordrades i ett recept för SKB än i recept för normal betong, NB, i syfte att receptet även skulle kunna innehålla 4 kg/m³ fibrer. För 2 kg/m³ fibrer kan ett mer traditionellt recept för SKB användas. Det kan dock inte rekommenderas att använda 4 kg/m³ fibrer i SKB eftersom arbetbarheten i en så-dan betong minskar snabbt med tiden.
3. Mekaniska egenskaper erhållna vid LTH Mineraliska tillsatser av glas- eller kalkstensfiller ökade hållfastheten avsevärt vid normal tempera-tur även om cementhalten minskades något hos SKB jämfört med NB. Förmodligen var en mer ef-fektiv packning av partiklarna i den färska be-tongen orsaken till den ökande hållfastheten. Hållfastheten ökade med 0.07 MPa per kg/m³ ökad mängd filler. Tillsatser av polypropylenfib-rer minskade hållfastheten med 2.3% per kg/m³ ökande mängd fibrer. Vattenhärdade cylindrar med 100 mm i diameter utan polypropylenfibrer, uppvisade brandspjälkning vid 480 °C/h i upp-värmningshastighet. Med 240 °C/h i uppvärm-ningshastighet av SKB med 100 mm i diameter, utan polypropylenfibrer, erhölls ingen spjälkning alls. När väl spjälkning kunde undvikas uppvisade SKB och NB liknande egenskaper vid höga tem-peraturer utom efter en upphettning till 800 °C då SKB med kalkstensfiller förlorade all hållfasthet efter avsvalning till 20 °C, figur 1. Figur 2 visar egenskaper hos SKB med kalkstensfiller. En jäm-förelse med högpresterande betong, HPB, visar högre hållfasthet hos SKB mellan 100 °C och 200 °C än hos HPB, figur 3. Elasticitetsmodulen minskade mer vid hög temperatur än vad som ti-digare erfarits, figur 4.
0.00
0.50
1.00
1.50
2.00
2.50
3.00
0 200 400 600 800Temperatur (°C)
Rel
ativ
a eg
ensk
aper
E-modul, varmtVarmhållfasthetStukning, varmt E-modul, svalt Hållfasthet, svaltStukning, svalt
Figur 1 – Relativa egenskaper hos betong vid/efter förhöjd temperatur utom hos betong med kalk-stensfiller efter uppvärmning till 800 °C.
l
0.00
0.50
1.00
1.50
2.00
2.50
3.00
0 200 400 600 800Temperatur (°C)
Rel
ativ
a eg
ensk
aper
E-modul, svaltHållfasthet, svaltStukning vid maximal hållfasthet
Figur 2 – Relativa kvarstående egenskaper hos SKB med kalkstensfiller versus temperatur.
0.00
0.20
0.40
0.60
0.80
1.00
0 200 400 600 800
Temperatur (°C)
Rel
ativ
hål
lfast
het
VarmhållfasthetCEB [40]Eurocode Siliceous [40]RakMK HPC [40]
Figur 3 - Varmhållfasthet (64 specimens), CEB, Eurocode Siliceous and RakMP HPC code [40].
0.00
0.20
0.40
0.60
0.80
1.00
0 200 400 600 800
Temperatur (°C)
Rel
ativ
ela
stic
itets
mod
ul
SKB, svalt HPC [38]NC [38]
Figur 4 – E-modul jämfört med [38].
4. Spjälkning vid brandtemperaturer studerad vid SP [94]
Fukthalt och isoterm: Omkring 3% fukthalt i normal betong är en kritisk fukthalt för att brandspjälkning skall kunna äga rum [79]. Även om betongen torkades till ca RF = 75% observerades höga fukthalter. I medeltal uppmättes följande fukthalter: • Tidigare försök med HPB [40]: 2.2% • Lufthärdade provkroppar: 3.6% • Vattenlagrade provkroppar: 5.9% Ca 3.1% fukthalt tillräckligt för att orsaka brand-spjälkning vid spänningen vid experimenten, ca 15 MPa. Fukthalten i SKB jämfördes med isoter-men för normal betong. SKB innehöll mer vatten än normal betong, speciellt SKB med glasfiller.
Effekt of cementhalt, ålder och härdning: Det observerades att cementpulvertalet, cpt, hos betongen hade en avsevärd effekt på brandspjälk-ningen – ju lägre cpt desto större brandspjälkning. Vid vattencementtal, vct = 0.40, undveks brand-spjälkning under förutsättning att cpt > 0.80 men blev oacceptabelt stor vid cpt = 0.60. Ett sätt att undvika brandspjälkning förefaller vara att öka cpt. Vid ett halvt års ålder erhölls samma brand-spjälkning för en betong med 4 kg/m³ fibrer som för en ett år gammal betong med 2 kg/m³ fibrer. Vid vattenlagring kunde motståndstalet för vatten-inträngning hos SKB vara dubbelt så stort som för en luftlagrad betong till följd av en bättre hydrata-tion av betongytan vid vattenlagring.
Kapillaritet, vattenuppsugning och fibrer: Vid en konstant porositet visade såväl luftlagrad som vattenlagrad SKB större motståndstal mot vatteninträngning än NB, vilket kan vara en för-klaring till känsligheten hos SKB för brandspjälk-ning studerad vid SP [94] jämfört med NB. Den största relativa ökningen av porositeten med ökande temperatur observerades hos NB; den lägsta ökningen i relativ porositet observerades för SKB med lågt vct utan fiberinnehåll. För SKB med fiber ökade porositeten mindre än för NB tro-ligen beroende av att ett vattentryck större än det som erhölls i de 20 mm tunna proverna erfordras för att ge en ökad porositet. Det minsta relativa motståndstalet mot vatteninträngning erhölls på samma sätt för NB. De observerade skillnaderna i relativ porositet och i det relativa motståndstalet mot vatteninträngning mellan SKB och NB visar att en annan struktur troligen uppstår i SKB än i NB eftersom isotermen beter sig olikartat vid normal temperatur hos de bägge betongtyperna. Vid förhöjd temperatur ökar relativa porositeten

m
snabbare och minskar relativa motståndstalet mot vatteninträngning mer hos NB än hos SKB. För SKB med fibrer observerades ett ökande relativt motståndstal mot vatteninträngning. För betong med 2 kg/m³ polypropylenfibrer var det relativa motståndstalet mot vatteninträngning vid 105 °C större än hos samma betong utan fibrer och även större än hos betong med 4 kg/m³ polypropylen-fibrer. För betong med 4 kg/m³ polypropylenfibrer var motståndstalet mot vatteninträngning vid 200 °C större än för samma betong utan fibrer. Orsa-ken till det ökade motståndstalet mot vattenin-trängning vid 105-200 °C är troligen att fibrerna smälter och expanderar mer än betongen. Dessa iakttagelser kvarstod även efter avsvalning till 20 °C och minskade därför vatteninträngningen. Som nämnts ovan kan en större provkroppstjocklek än 20 mm krävas för att ett tillräckligt stort vatten-tryck skall uppstå i betongen under uppvärmning i syfte att ge en ökad porositet tillsammans med de smältande fibrerna. I samband med uppvärmning under brand förhindras transport av vatten inåt i betong med fibrer. I detta fall kommer vatten-trycket i betong med fibrer att öka långsammare än i betong utan fibrer eftersom vattnet rör sig mot betongytan. Detta är en förklaring till mekanismen för polypropylenfibrer i betong vid brand: • Ökande volym hos polypropylenfibrer och
smältning vid 105-200 °C. • Vattenrörelser förhindras inåt betongen vid
105-200 °C till följd av ett ökande mot-ståndstalet mot vatteninträngning.
• Vattnet rör sig i stället utåt mot betongytan varvid spjälkning undviks.
5. Polypropylenfibrer för att undvika brand-spjälkning
5.1 Beräkning byggd på cement- och fiberhalt En syntes för att beräkna mängden polypropylen-fibrer för att undvika brandspjälkning togs fram baserad på cementpulvertalet, cpt, och vattence-menttalet, vct, figur 5. Figur 5 visar mängden 32 µm fibrer, ppfnormal, för att vid konstant fuktkvot och påkänningsnivå begränsa mängden spjälkning till samma nivå som för normal betong (kg/m³): ppfnormal=(28·(c/p)²-26·(c/p)-2.4)·ln(w/c)+ 45·(c/p)²- 68·(c/p)+23 > 0 (1) Figur 6 visar kravet på fibrer vid en största brand-spjälkning om 15% vid ett halvt års ålder.
0.400.500.600.70
0.60
0.70
0.80
0.90
0.0
2.0
4.0
6.0
Fibr
er (n
orm
al,k
g/m
³)
VctCpt
Figur 5 - Mängden 32 µm fibrer, ppfnormal, för att vid konstant fuktkvot och påkänningsnivå begrän-sa mängden spjälkning till densamma som för normal betong (kg/m³). Fyra kg/m³ polypropylenfibrer kan emellertid inte rekommenderar från gjutbarhetssynpunkt. Följan-de ekvations erhölls för mängden polypropylen-fibrer i syfte att begränsa brandspjälkningen till ca 15% vid ett halvt års ålder (32 µm, kg/m³): ppf85%=(-35·(c/p)²+34.9·(c/p)-16.7)·ln(w/c)-25·(c/p)+11.7 > 0 (2) c/p betecknar cementpulvertalet, cpt {0.50 <
c/p < 1} p betecknar cement and pulverinnehåll
(glas- eller kalkstensfiller) ppf85% betecknar 32 µm polypropylenfibrer vid
15% brandspjälkning (ett halvt års ålder, kg/m³)
0.400.500.600.70
0.60
0.70
0.80
0.90
0.0
2.0
4.0
6.0
Fibr
er (1
5%
spjä
lkni
ng,k
g/m
³)
VctCpt
Figur 6 - Mängd 32 µm fibrer vid ca 15% brand-spjälkning vid ett halvt års ålder fibrer (kg/m³). Cpt = cementpulvertalet, vct = vattencementtalet.
n
5.2 Beräkning baserad på fiber- och Portland-cementhalt Ytterligare en syntes krävdes för att ta fram mängden fibrer i betong baserad på vattenport-landcementtalet, vPct, och Portlandcementpulver-talet, Pcpt. Figur 7 visar mängden 32 µm fibrer för att vid konstant fuktkvot och påkänningsnivå er-hålla samma spjälkning som för normal betong: ppfnormal =(13·(Pc/p)-12.3)·ln(w/Pc)-2.69·(Pc/p)² +2.65·(Pc/p) – 0.2 > 0 (3) ppfnormal 32 µm fibrer för att erhålla samma
spjälkning som för normal betong (kg/m³)
w/Pc betecknar vatten Portladcementtalet Pc/p betecknar Portland cementpulvertalet
0.40
0.60
0.800.
500.
600.
700.
85
0.0
2.0
4.0
6.0
Fibr
er
(nor
mal
,kg/
m³)
VpctPcpt
Figur 7 - Mängden 32 µm fibrer för att vid kon-stant fuktkvot och påkänningsnivå erhålla samma spjälkning som för normal betong. Figur 8 visar mängd 32 µm fibrer för att erhålla 15% brandspjälkning vid ett halvt års ålder. Föl-jande mängd fibrer, ppf, erhölls för att begränsa brandspjälkningen till 15% vid ett halvt års ålder (32 µm fibrer, kg/m³): ppf85%=(-35·(Pc/p)²+34.9·(Pc/p)-16.7)·ln(w/Pc)-25·(Pc/p)+11.7 > 0 (4) p betecknar innehåll av cement-, glas- och
kalkstensfiller ppf betecknar innehåll av 32 µm polypropylen-
fibrer för att begränsa brandspjälkningen till 15% vid ett halvt års ålder (kg/m³)
w/Pc betecknar vattenportlandcementtalet Pc/p Portlandcementpulvertalet {0.50 < c/p < 1}
0.40
0.50
0.60
0.70
0.800.
500.
600.
700.
85
0.0
2.0
4.0
6.0
Fibr
er (1
5%
spjä
lkni
ng,k
g/m
³)
VpctPcpt
Figur 8 - Mängd 32 µm fibrer vid 15% brand spjälkning vid ett halvt års ålder.

1
1. INTRODUCTION, LIMITATIONS AND OBJECTIVE.
1.1 Introduction Concrete that does not require any energy for compacting in order to cover the reinforcement or fill out the mould has attracted a great deal of in-terest in recent years. Swedish experience now ex-ists from 19 full-scale bridges and other full-scale projects with SCC [1]. The technique has also been introduced for dwelling houses and office buildings [2]. A railway tunnel has been con-structed with SCC [3], Appendix 1.1, and a dou-ble highway tunnel was recently made with SCC [4-6], a part of the highway E6. It consists of a 150-m long rock tunnel with twin-lane tubes. For the first time in Sweden, the water sealing system in a tunnel will be built as water drained concrete inner vault, cast directly on the concreted (shot-crete) rock surface. The water sealing consists of a 2-mm thick plastic membrane protected against the shotcrete by a geotextile cloth. The theoretical thickness of the concrete inner vault is 400 mm. The bottom part of this tunnel (barriers) was made of frost resistant SCC and drained by casting to-wards drained remaining concrete formwork [4-6]. Recently SCC has been introduced for the pro-duction of poles, piles and pillars [7-10], Appen-dix 1.2. Bridges, dams, tunnels and so forth require higher durability than concrete that is used for dwelling houses or office buildings. The pri-mary durability properties are chloride ingress, fire resistance, internal frost resistance, salt frost scaling and sulphate resistance for concrete in se-vere situations. All these properties except for the fire resistance were recently studied at our de-partment. Salt frost scaling, internal frost resis-tance and sulphate resistance did not differ much from the corresponding properties of normal com-pacting concrete. The chloride ingress was larger in SCC than in NC. It is known from the Great Belt railway tunnel and also from the Channel railway tunnel that large-scale spalling of the con-crete may occur during catastrophic fire, espe-cially in concrete at low water to cement ratio, w/c. Scaling is avoided by polypropylene fibre in concrete [11-13].
1.2 Limitations The testing of the compressive strength at high temperature took place at about half a year’s age only. Eight concrete were studied, one normal concrete, NC, with w/c = 0.40 and seven SCCs, with w/c = 0.40, 0.55 and 0.70. Tests of compres-sive spalling took place with 12 SCCs and 4 NCs, with w/c = 0.40, 0.55 or 0.70. The concrete was cured in air or water until testing. Strength speci-mens were 100 mm in diameter and 200 mm long.
The fire spalling test specimens were 200 x 200 mm and 2 m long pre-stressed by cast-in tendon wires, 12 mm in diameter. The following parame-ters were studied, Table 1.1 [14]: • w/c = 0.40, 0.55 or 0.70 • Polypropylene fibres, 32 µm, 0, 2 or 4 kg/m³ • Curing type, air or water • Temperature, 20 °C, 200 °C, 400 °C, 800 °C • High-temperature test or residual • Different air content (1 or 6% vol.). Table 1.1 – Parameters in the study Testing status: hot or residual properties Temperature: 200 °C, 400 °C, 600 °C, 800 °C Con-crete
w/c (%)
Ce-ment– air -curing
Age (years)
Filler type
Fibre content (kg/m³)
40AG0 40 A ½ G 0 40AK0 40 A ½ K 0 40AK2 40 A ½ K 2 40AK4 40 A ½ K 4 40AR0 40 A ½ R 0 40BR0 40 A ½ R 0 40BK0 40 A ½ K 0 55BK0 55 B 1 K 0 55BK2 55 B 1 K 2 55BK4 55 B ½ K 4 55BR0 55 B 1 R 0 70BG0 70 B ½ G 0 70BK0 70 B ½ K 0 70BK2 70 B ½ K 2 70BK4 70 B ½ K 4 70BR0 70 B ½ R 0 A = water-cured concrete A with type I Anläggningscement and 5% air-entrainment; B = air-cured concrete B with type II Byggcement and natural air; G = glass filler; K = limestone filler; R = normal concrete without filler or fibres; 0 = 0 kg/m³ polypropylene fibres; 40 = w/c (%).
1.3 Objectives The objectives were to investigate mechanical functioning of SCC under loading at high tem-perature conditions. The SCC contains increased amounts of polypropylene fibre, different types of cement and air content, preconditioned either in the air or in water. The objective was also to com-pare the result with the corresponding properties of NC. The objective was to recommend how to produce SCC able to withstand fire spalling.

2
2. PREVIOUS RESEARCH
2.1 Effect of stress and heating state on compressive strength Influence of fire was studied [15]. The following conclusions were found: • Compressive strength of the specimens during
heating increased with the stress • Strength in the hot state was greater than after
cooling Figure 2.1 shows results of high temperature tests on concrete with different types of aggregate [16].
0
0.2
0.4
0.6
0.8
1
1.2
0 200 400 600 800
Temperature (°C)
Com
pres
sive
str
engt
h to
orig
inal
st
reng
th ra
tio
Barytes Leca Quartz
Figure 2.1 - Compressive strength to original strength ratio [16]. An aggregate of the quartz type seemed more unfavourable than the others tested [16-17]. In other tests the effect of compressive stress under heating on strength of concrete was tested [15,18]. The highest strength was obtained in the heated state provided that the specimen was loaded during the period of heating, at 25 or 40 % of the ultimate strength. The second highest strength was obtained on unloaded specimens that were tested at elevated temperature, the lowest on concrete that was heated to the stipulated temperature and then cured at 21 °C in an ambient relative humidity, RH = 65% before testing, Figure 2.2. The concrete contained aggregate of the quartz type. Figure 2.2 clearly demonstrates that strength increased with stress during loading and further that the strength at the heated state was larger than after cooling [15,18].
0
0.2
0.4
0.6
0.8
1
1.2
0 300 600 900
Temperature (°C)
Com
pres
sive
str
engt
h to
orig
inal
st
reng
th ra
tio
40% of ult. unheated strength (20 °C)25% of ult. unheated strength (20 °C)Unloaded (heated)Unloaded (unheated for 7 days)
Figure 2.2 - Compressive strength to original strength ratio [15,18].
2.2 Effect of changes in cement paste Figure 2.3 shows the effect of age and temperature on the strength of cement paste after heating at different age at start of testing [19,20]. In young cement paste an initial hydration during the heating increased the strength. Between 200 °C and 500 °C hydrated water leaves the cement paste. This results in large shrinkage [18]. Owing to the heating the cement paste is weakened and strength decreases somewhat. At the critical temperature, 500-600 °C, the calcium hydrates are decomposed into calcium oxide causing a substantial strength loss in the cement paste, Figure 2.3. The same applies to concrete [19,20].
2.3 Effect of thermal movements between aggregate and cement paste on compressive strength Figure 2.4 shows the thermal dilatation of the following ingredients of concrete [19]: 1. Granite 2. Concrete with granite aggregate 3. Limestone 4. Sandstone 5. Cement paste under heating 6. Cement paste under cooling

3
0
0.2
0.4
0.6
0.8
1
1.2
1.4
1.6
1.8
2
0 200 400 600 800
Temperature (°C)
Com
pres
sive
str
engt
h af
ter c
oolin
g to
or
igin
al s
tren
gth
ratio
2 days 3 days7 days 28 days
Figure 2.3 - Strength after cooling to original strength ratio [19,20]. The age of cement paste.
-30
-20
-10
0
10
20
30
0 300 600 900
Temperature (°C)
Def
orm
atio
n (‰
)
GraniteConcrete with granite aggregateLimestoneSandstoneCement paste at heatingCement paste at cooling
Figure 2.4 - Thermal dilatation of aggregate, cement paste and concrete [19].
It is quite clear that the aggregate expand during heating while the cement paste shrinks, mainly due to loss of water [18]. The movement of the concrete during heating almost follows the deformation of the aggregate. Therefore large deformations are imposed on the cement paste in concrete subjected to high temperature. The size of the compressive stress during heating of the concrete strongly affects the deformations, Figure 2.5. At high stress more than 50% of the ultimate, which is rare, no expansion takes place of the concrete during heating [16]. At no stress some expansion remains after heating but at low stress, 16.5 % of the ultimate strength, still a substantial shrinkage takes place after heating to 600 °C, figure 2.5.
-20-15-10-505
1015
0 200 400 600
Temperature (°C)
Def
orm
atio
n (‰
)
Heating (unloaded concrete)
Cooling (unloaded concrete)
17% of ult. unheated strength (20 °C-heating)
17% of ult. unheated strength (20 °C-cooling)
33% of ult. unheated strength (20 °C-heating)
33% of ult. unheated strength (20 °C-cooling)
50% of ult. unheated strength (20 °C-heating)
50% of ult. unheated strength (20 °C-cooling)
Figure 2.5 – Effect on deformations of stress during heating [16]. Black (full) mark = heating.

4
2.4 Tensile strength after heating Two types of test applied either rapid or slow type of oven heating combined with two types of specimen, 50 or 94 mm in diameter [18], Figures 2.6-7. During the rapid type of oven heating large difference in temperature between surface and centre of concrete specimen may be avoided with insulation. The slow heating did not exceed 120 °C/h. In case of slow heating the difference in temperature between surface and centre of concrete specimen became small. Figure 2.8 shows the tensile strength at elevated temperature obtained with slow (Ø94 mm) or rapid heating (Ø50 mm) [21]. The tensile strength was not affected by the rate of heating or w/c. Table 2.1 provides the mix proportions of studied concrete [18]. The concrete was water-cured 4 days after casting and then in the air at RH = 60% for 1 month (w/c = 0.55 and w/c = 0.75) or for 2 months at RH = 60% (w/c = 0.50 or w/c = 0.68).
0
100
200
300
400
500
600
0 2 4 6 8
Time (h)
Tem
pera
ture
(°C
)
Ø50Ø50-5 mm insulationØ50-10 mm insulationØ94-4 mm from centreØ94-38 mm from centreOven with Ø94
Figure 2.6 – Temperature rapid heating. Centre distance [18].
Table 2.1 - Mix proportions of studied concrete. Concrete Curing
in RH = 60%
Cement/ sand/ aggregate
fcc (28d, MPa)
fct (28days, MPa)
w/c=0.50 2 months 1:1.8:2.7 5.4 w/c=0.55 1 month 1:2:2.7 41 3.9 w/c=0.68 2 months 1:3.2:4.8 4.3 w/c=0.75 1 month 1:3.2:3.9 21 2.5 From Figure 2.8 the following equation was obtained by regression (dotted line): fct,T/fct,20=-0.000001·T2-0.0003·T+0.95 (2.1) fct,T denotes split tensile strength at elevated
temperature (=1 at 20 °C) fct,20 denotes tensile strength at 20 °C T denotes temperature (20 < T < 800 °C)
0
100
200
300
400
500
600
700
800
0 5 10 15
Time (h)
Tem
pera
ture
(°C
)
Oven, test Oven, Ø94Oven, Ø94 Ø94-0 mmØ94-15 mm-test Ø94-27 mmØ94-36 mm-test Ø94-37 mm
Figure 2.7 – Temperature at slowly heating. Centre distance [18].

5
0
0.2
0.4
0.6
0.8
1
0 200 400 600 800
Temperature (°C)
Tens
ile s
tren
gth
to o
rigin
al s
tren
gth
ratio
w/c=0.50w/c=0.50-5 mmw/c=0.50-10 mmw/c=0.68w/c=0.68-5 mmw/c=0.68-10 mm
Figure 2.8 – Split tensile strength at elevated temperature obtained with slow (Ø94 mm) or rapid heating (Ø50 mm) [21]. Dotted line = equation (2.1). In Figure 2.9 the effect of heating rate and temperature at testing on split tensile strength is shown [18]. Again it is shown that the rate of heating did not affect the split tensile strength. However, the temperature at testing had a substantial effect on the tensile strength at low temperature probably since the internal relative humidity, RH, of the concrete increases with the temperature [22-23]. The full dotted line in Figure 2.9 indicates equation (2.1) and an equation for split tensile strength at 20 °C after cooling from the elevated temperature (thin dotted line in Figure 2.9, equation (2.2)): fct,T20/fct,20=-0.0000008·T2- 0.0006·T+ 1.06 (2.2) fct,T20 denotes split tensile strength at 20 °C after
cooling from the elevated temperature fct,20 denotes tensile strength at 20 °C T denotes temperature (20 < T < 800 °C)
0
0.2
0.4
0.6
0.8
1
0 200 400 600 800
Temperature (°C)
Tens
ile s
tren
gth
to o
rigin
al s
tren
gth
ratio
Heated-rapid Heated-slow20 °C-rapid 20 °C-slow
Figure 2.9 - The effect of heating rate and temperature at testing on split tensile strength is shown [18]. The full dotted line indicates equation (2.1) and thin dotted line equation (2.2). Figure 2.10 shows the effect of w/c and testing temperature on the split tensile strength of the concrete [18]. At w/c = 0.55 the effect of the testing temperature was greater than at w/c = 0.75 probably since moisture of concrete with w/c = 0.75 evaporates more easily during heating than in concrete with w/c = 0.55. Figure 2.11 shows the development of tensile and compressive strength of concrete at elevated temperature [16].

6
0
0.2
0.4
0.6
0.8
1
0 200 400 600 800
Temperature (°C)
Tens
ile s
tren
gth
to o
rigin
al s
tren
gth
ratio
w/c=0.50w/c=0.50-5 mmw/c=0.50-10 mmw/c=0.68w/c=0.68-5 mmw/c=0.68-10 mm
Figure 2.10 - Effect of w/c and temperature on the split tensile strength [18]. Full dotted line indicates equation; and thin dotted line (2.2).
2.5 Creep at varying temperatures and temperature gradients The mechanical behaviour of concrete under torsional loading at transient, high-temperature conditions was studied in order to avoid the influence of thermal expansion during the tests [24]. By studying the twist angle versus time at different temperatures it was possible to determine the effect of temperature on the creep behaviour [24]. Table 2.2 provides the mix proportion of the studied concrete [24]. The strength scatter was fairly large. Table 2.2 - Mix proportion of the concrete studied [24]. Concrete Cement/
sand < 8 mm /crushed quartzite 8-12 mm
fcc (28days, MPa)
fct (28days, MPa)
w/c=0.55 1:2.7:2 32-54 2.7-4.6
0
0.2
0.4
0.6
0.8
1
0 200 400 600 800
Temperature (°C)
Stre
ngth
to o
rigin
al s
tren
gth
ratio
CompressiveTensileRegression-heatedRegression-20 °C
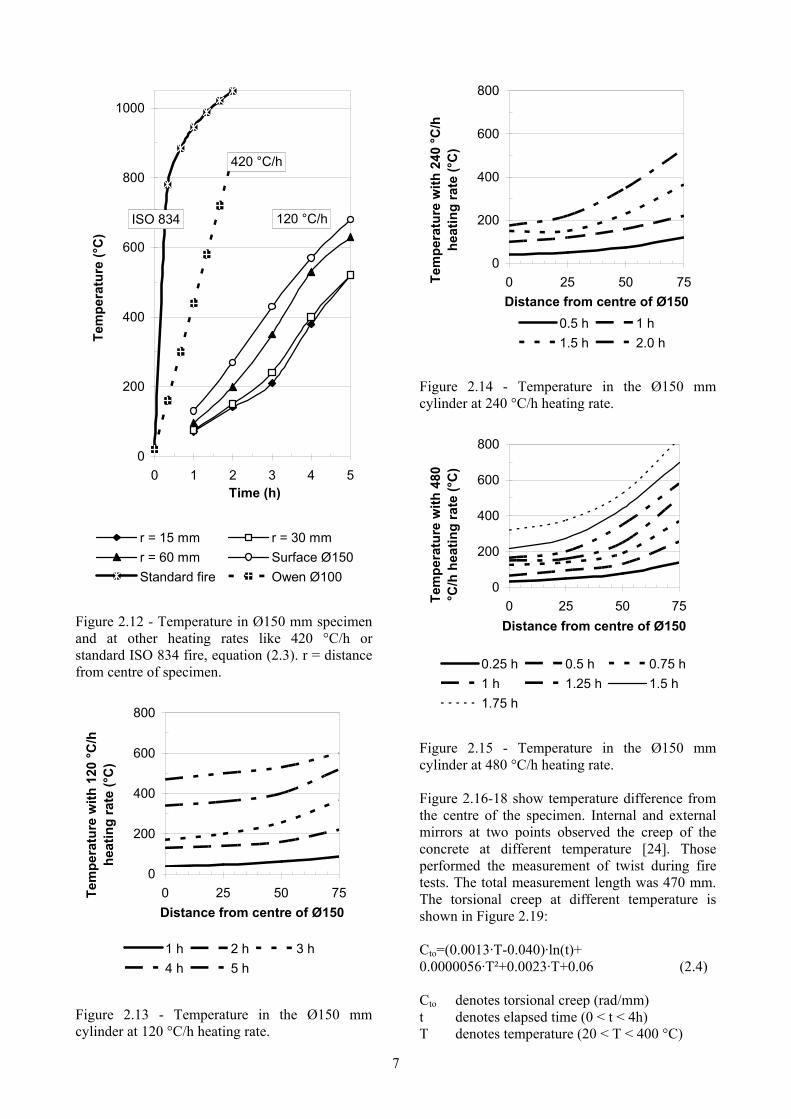
Figure 2.11 - Tensile and compressive strength of concrete versus temperature [16]. The size of the specimen was either circular Ø 150 mm or 150 x 150 mm. The length of the specimen was 1500 mm and the size at the supports was 200 mm square. At the middle of the specimen 800 mm in length was diminished to either 150 mm square or circular testing area. The stress to strength level at loading was 30% of the ultimate torque capacity. The rate of heating was 120 °C/h. Figure 2.12 shows development of the temperature in the Ø150 mm specimen together with the temperature development at other heating rates like 420 °C/h and with standard ISO 834 fire according to the following equation: T = 345·log(480·t+1)+20 (2.3) t denotes time (h) T denotes fire temperature (°C) Figure 2.13-15 show the temperature profiles in the Ø150 mm cylinder at heating rates varying between 120 °C/h and 480 °C/h.
7
0
200
400
600
800
1000
0 1 2 3 4 5Time (h)
Tem
pera
ture
(°C
)
r = 15 mm r = 30 mmr = 60 mm Surface Ø150Standard fire Owen Ø100
ISO 834
420 °C/h
120 °C/h
Figure 2.12 - Temperature in Ø150 mm specimen and at other heating rates like 420 °C/h or standard ISO 834 fire, equation (2.3). r = distance from centre of specimen.
0
200
400
600
800
0 25 50 75Distance from centre of Ø150
Tem
pera
ture
with
120
°C/h
he
atin
g ra
te (°
C)
1 h 2 h 3 h4 h 5 h
Figure 2.13 - Temperature in the Ø150 mm cylinder at 120 °C/h heating rate.
0
200
400
600
800
0 25 50 75Distance from centre of Ø150
Tem
pera
ture
with
240
°C/h
he
atin
g ra
te (°
C)
0.5 h 1 h1.5 h 2.0 h
Figure 2.14 - Temperature in the Ø150 mm cylinder at 240 °C/h heating rate.
0
200
400
600
800
0 25 50 75Distance from centre of Ø150
Tem
pera
ture
with
480
°C
/h h
eatin
g ra
te (°
C)
0.25 h 0.5 h 0.75 h1 h 1.25 h 1.5 h1.75 h
Figure 2.15 - Temperature in the Ø150 mm cylinder at 480 °C/h heating rate. Figure 2.16-18 show temperature difference from the centre of the specimen. Internal and external mirrors at two points observed the creep of the concrete at different temperature [24]. Those performed the measurement of twist during fire tests. The total measurement length was 470 mm. The torsional creep at different temperature is shown in Figure 2.19: Cto=(0.0013·T-0.040)·ln(t)+ 0.0000056·T²+0.0023·T+0.06 (2.4) Cto denotes torsional creep (rad/mm) t denotes elapsed time (0 < t < 4h) T denotes temperature (20 < T < 400 °C)

8
0
2
4
6
8
10
12
0 25 50 75
Distance from centre of Ø150Tem
pera
ture
gra
dien
t with
120
°C/h
hea
ting
rate
(°C
/mm
)
1 h 2 h 3 h4 h 5 h
Figure 2.16 - Temperature gradient in Ø150 cylinder at 120 °C/h heating rate.
0
2
4
6
8
10
12
0 25 50 75Distance from centre of Ø150
Tem
pera
ture
gra
dien
t with
240
°C/h
he
atin
g ra
te (°
C/m
m)
0.5 h 1 h1.5 h 2.0 h
Figure 2.17 - Temperature gradient in Ø150 cylinder at 240 °C/h heating rate.
0
2
4
6
8
10
12
0 25 50 75Distance from centre of Ø150
Tem
pera
ture
gra
dien
t to
cent
re w
ith
480
°C/h
hea
ting
rate
(°C
/mm
)
0.25 h 0.5 h 0.75 h1 h 1.25 h 1.5 h1.75 h
Figure 2.18 - Temperature gradient in Ø150 cylinder at 480 °C/h heating rate.
0
0.5
1
1.5
2
2.5
0 1 2 3Time (h)
Cre
ep (r
ad/m
m)
20 °C 135 °C 190 °C305 °C 380 °C
Figure 2.19 - The torsional creep at different temperature versus time [24]. Torsional strength decreases more rapid with temperature than tensile and compressive strength, Figures 2.11, 2.20 [24]. Compressive creep is therefore overestimated by equation (2.4).

9
0
0.2
0.4
0.6
0.8
1
0 200 400 600 800
Temperature (°C)
Stre
ngth
to o
rigin
al s
tren
gth
ratio
FlexuralTensileTorsionalRegression line-tensile
Figure 2.20 – Strength to original strength ratio [24]. Regression line with equation (2.1).
2.6 Steam pressure during heating When concrete is heated the evaporable water expands more than the structure itself. This expansion leads to an increase of the relative humidity, RH, by about 0.35%/°C at w/c = 0.40, 20 °C [22-23]. RH saturation may take place in the pores and capillary transport take place instead of diffusion. Since the heat at fire comes from the surface the water will be transported inwards where the pores are not yet saturated. The pressure of the water in the pores will rapidly rise in turn causing a risk of surface spalling. The risk of spalling thus is linked closely to the tensile strength. Eventually, when the temperature of the concrete and the water reaches 275 °C explosive fracture takes place of the critical concrete zone. Figure 2.21-23 shows the steam pressure theory [24]. At about 275 °C 30 mm from surface explosion occurs.
2.7 High Performance Concrete, HPC
2.7.1 Swedish recommendations Studies of the fire resistance on HPC were performed in a Swedish project of HPC [11]. First of all the strength of steel was studied versus the temperature, Figure 2.24. Prestressing steel was slightly more sensitive to high temperature than that normal steel was. However, at 450 °C only about half the strength of the steel remains, i.e. the cover layer is of great importance for reinforced structures with reinforcement bars, rebars.
0
100
200
300
400
500
600
0 1 2 3 4 5
Time (h)Te
mpe
ratu
re (°
C),
stea
m p
ress
ure
(kPa
) with
120
°C/h
he
atin
g ra
teP - 6 mm P - 30 mmT - 0 mm T - 25 mmT - 75 mm
Figure 2.21 – Steam pressure with 120 °C/h heating rate. P=pressure, T=temp.
0
100
200
300
400
500
600
0 0.5 1 1.5Time (h)
Tem
pera
ture
(°C
), st
eam
pre
ssur
e (k
Pa)
with
240
°C/h
hea
ting
rate
P - 0 mm P - 30 mmT - 0 mm T - 30 mmT - 75 mm
Figure 2.22 – Steam pressure with 240 °C/h heating rate. P=pressure, T=temp.

10
0
100
200
300
400
500
600
0 0.5 1
Time (h)
Tem
pera
ture
(°C
), st
eam
pre
ssur
e (k
Pa) w
ith
480
°C/h
hea
ting
rate
P - 0 mm T - 10 mmT - 40 mm T - 50 mm
Figure 2.23 – Steam pressure with 480 °C/h heating rate. P=pressure, T=temp.
0
0.2
0.4
0.6
0.8
1
0 300 600 900 1200
Temperature (°C)
Stre
ngth
to o
rigin
al s
tren
gth
Prestress barsPrestr. tendonsRebars 0.2%Rebars 2%
Figure 2.24. Steel strength vs temperature [11].
Other studies showed the corresponding decrease of the elastic modulus of the steel like the strength decrease versus temperature, Figure 2.25. Regarding spalling the following requirement were stated for concrete with 150-mm cube strength varying between 80 and 120 MPa: • Water-binder ratio, w/b > 0.24 • Silica fume < 7% calculated on the basis of
the cement content. • ISO 834 fire exposure, Figure 2.12, equation
(2.3) • Concrete relative humidity, RH < 75% • Stress to strength ratio < 0.45 at fire exposure Still, even though the requirement were fulfilled the mix proportions of HPC required to be completed by the following amount of fibres of polypropylen [11] in order to avoid the risk of spalling of the concrete surface during fire [11]: • 2 kg/m³ fibres at 0.28 < w/b < 0.32 • 4 kg/m³ fibres at w/b < 0.28 Therefore fibres of polypropylene were included in this project.
0
0.2
0.4
0.6
0.8
1
0 300 600 900 1200
Temperature (°C)
Elas
tic m
odul
us to
orig
inal
ratio
Prestessing tendonsReinforcement bars
Figure 2.25 Decrease of elastic modulus versus temperature [11].
11
2.7.2 Swedish research on fire spalling Spalling of concrete in the Swedish experiments was studied on concrete columns with mix proportions given in Appendix 2.1 [11,25]. The column studies were carried out on prestressed constructions. The type of column studied, 200 x 200 x 2000 mm, was symmetrically pre-stressed. It was the objective of the column studies to observed the risk of fire spalling at the standard ISO 834 fire, equation (2.3). The square columns were prestressed by alternatively 12 or 16 pieces of 12.5 mm strands. The strands were symmetrically placed in the column. The initial force of the strands varied between 90 and 135 kN before prestressing of the HPC. The force was hydraulically transferred to the HPC after a curing period varying between 2 and 4 days. Thus the stress in the HPC columns became more or less symmetrically distributed. After pouring, the HPC was heated in the mould. The cubes that were used to obtain the strength were placed in a hot box. The temperature in the box was adjusted to obtain the same heat development as the column. The columns were placed in a climate with a relative humidity of about 45%. All columns were studied at 20 °C after initial curing at about 48 °C. The cubes that were used to obtain the strength development of the square columns were placed in an insulated box on top of the column but inside the mould. The box was not insulated towards the column. The cubes thus obtained the same heat development as the column did. Different target values for the strength of the HPC before prestressing were used dependent on the force applied by the strands. Initially the HPC was cured in the steel mould. Plastic foil and 60 mm of heat insulation covered the top of the HPC. About 12 h before prestressing the columns were cooled to 20 °C. After prestressing the columns were cured at the same temperature as before (20 °C) but uncovered. After 1 h of creep measurement the columns were placed in an ambient climate of ≈ 45% relative humidity at 20 °C temperature [25]. The autogenous shrinkage and the drying shrinkage were measured for all the HPCs studied. The cylinder had a length of 300 mm and a diameter of 55.5 mm. The cylinders were cast on site and then transported to the laboratory where the HPC was demoulded. One cylinder of each batch of HPC was insulated by 2 mm butyl-rubber cloth; one cylinder was cured unprepared. Cast-in items were placed 25 mm from the ends of the 300-mm cylinder. After demoulding, stainless ground screws were placed in the cast-in items. The cylinders were placed in a 20 °C air-conditioned room with an ambient relative humidity of 55%. The first measurement took
place after the HPC reached the same temperature as the ambient climate room. Measurements at three sides of the cylinders started at about 20 hours’ age [25]. The measurement device (Proceq) was calibrated to an INVAR rod, cp. laboratory experiments. The measurements were carried out for 3 years. The weight of the cylinder was obtained parallel to the measurement of length to control losses of moisture from the specimen. cast-in items of steel were placed in the top of the column. The distance from the side of the column to the cast-in item was 100 mm. The horizontal distance between the cast-in items parallel to the column was 250 mm. After demoulding, the column consoles were fixed to the cast-in items. The measurement was carried out by LVDTs in the same way as described above. The LVDTs were calibrated before each measurement took place. A computer automatically collected the strain data. After 1 h the LVDT-measurements were replaced by mechanical measurements in stainless ground screws, that were placed in the cast-in items In the case of square column, cast-in plastic pipes were placed at the top of the column reaching the centre of the square section in order to measure the internal relative humidity. The pipe was tightened with a rubber plug between the measurements. During the measurement of internal relative humidity a dew-point meter (calibrated according to ASTM E 104-85, [26]) was placed in the pipe for at least 16 h. The instrument was covered with a hood to avoid temperature changes.
2.7.3 Research conditions for Swedish tests The stress/strength level was documented by tests of creep and shrinkage before the fire spalling tests were carried out. Even though the creep and shrinkage tests do not give any fire spalling the results of the creep and shrinkage tests influences the stress/strength level substantially. Stress was supposed to have a substantial effect on fire spalling. Therefore the creep and shrinkage results are given as a method to measure and calculated the loss of prestressing. Figure 2.26 shows the results of internal relative humidity in the square columns. Columns with a higher grade of pre-stressing seem to dry out somewhat faster. Figure 2.27 shows the shrinkage of cylinders. The observed total strain at the middle upper edge of the square columns is shown in Figures 2.28-2.32. It was necessary to measure the strain in order to obtain the stresses in the concrete at the fire exposure. Figure 2.33 shows the moisture losses versus time. After about 50 days’ age the concrete started to increase in weight due to carbonation. Figure 2.34 shows the shrinkage versus moisture losses of all columns.

12
0.75
0.8
0.85
0.9
0 50 100 150 200
Age (days)
Inte
rnal
rela
tive
hum
idity
, RH
w/ c = 0.37 (0.30) w/ c = 0.37 (0.50)w/ c = 0.32 (0.30) w/ c = 0.32 (0.40)
Figure 2.26 – Internal relative humidity, RH, in columns. ( ) = stress/strength level [25].
0
200
400
600
800
1 10 100 1000
Age (days)
Shrin
kage
(mill
iont
hs)
S32B S32DS37B S37D
Figure 2.27 - Shrinkage cylinders versus age. B = sealed curing, D = air curing (drying), 37= water-cement ratio, w/c (per cent) [25].
0
0.5
1
1.5
2
0.0001 0.01 1 100 10000
Loading time (days)
Mea
sure
d st
rain
(per
mil)
S3231 S3232 S32341S32342 S3234
Figure 2.28 - Measured total strain of columns S323 versus loading time. S= square column; 32...=w/c (%); ..3.. = 10xprestress level,..1-4.= amount of plastic fibre; ..2= batch no [25].
0
0.5
1
1.5
2
2.5
3
0.0001 0.01 1 100 10000
Loading time (days)
Mea
sure
d st
rain
(per
mil)
S3241 S3242 S32441S32442 S3244
Figure 2.29 - Measured total strain of columns S324 versus loading time. S= square column; 32...=w/c (%); ..4.. = 10xprestress level,..1-4.= amount of plastic fibre; ...1= batch no [25].
13
0
0.5
1
1.5
2
0.0001 0.01 1 100 10000
Loading time (days)
Mea
sure
d st
rain
(per
mil)
S3730 S3731 S37321S37322 S3732
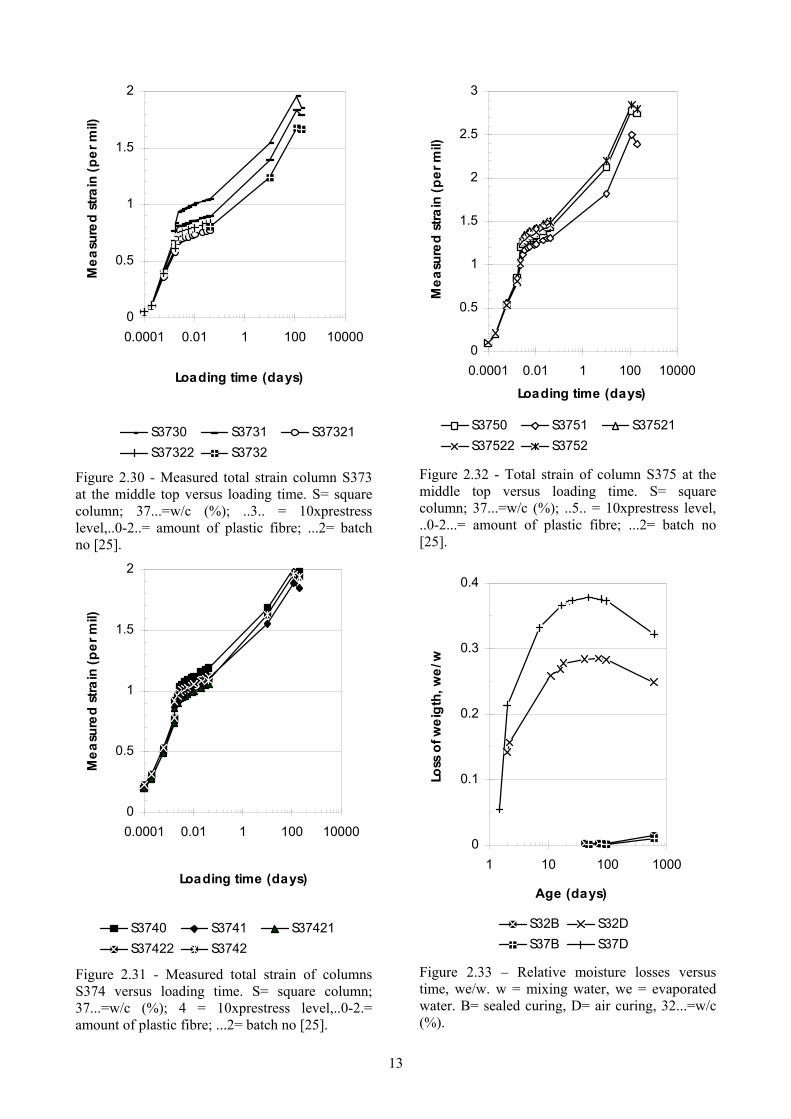
Figure 2.30 - Measured total strain column S373 at the middle top versus loading time. S= square column; 37...=w/c (%); ..3.. = 10xprestress level,..0-2..= amount of plastic fibre; ...2= batch no [25].
0
0.5
1
1.5
2
0.0001 0.01 1 100 10000
Loading time (days)
Mea
sure
d st
rain
(per
mil)
S3740 S3741 S37421S37422 S3742
Figure 2.31 - Measured total strain of columns S374 versus loading time. S= square column; 37...=w/c (%); 4 = 10xprestress level,..0-2.= amount of plastic fibre; ...2= batch no [25].
0
0.5
1
1.5
2
2.5
3
0.0001 0.01 1 100 10000
Loading time (days)
Mea
sure
d st
rain
(per
mil)
S3750 S3751 S37521S37522 S3752
Figure 2.32 - Total strain of column S375 at the middle top versus loading time. S= square column; 37...=w/c (%); ..5.. = 10xprestress level, ..0-2...= amount of plastic fibre; ...2= batch no [25].
0
0.1
0.2
0.3
0.4
1 10 100 1000
Age (days)
Loss
of w
eigt
h, w
e/w
S32B S32DS37B S37D
Figure 2.33 – Relative moisture losses versus time, we/w. w = mixing water, we = evaporated water. B= sealed curing, D= air curing, 32...=w/c (%).

14
0
200
400
600
800
0.00 0.10 0.20 0.30 0.40
Relative loss of water, we/ w
Shrin
kage
(mill
iont
hs)
S32B S32DS37B S37D
Figure 2.34 - Shrinkage versus moisture losses, we/w. B= sealed curing, D= air curing, S= square column, 32= water-cement ratio, w/c (%). The square column was cooled to 20 °C before the prestressing of the HPC was performed. In an extensive investigation of the influence of the moisture profile on the measured shrinkage it was pointed out that the way of measurement was of great importance for obtaining a correct strain [27]. If the measurement points were placed at the surface, the measured shrinkage became larger than the average shrinkage of the column, due to the shrinkage of the surface. The maximum measured fault could be estimated as the difference between drying shrinkage and the autogenous shrinkage. Due to different admixture of plastic fibre in the columns the mixing was continued during the addition of plastic fibre, which may have influenced the compressive strength, perhaps ± 5 MPa. Some differences certainly existed between the ambient climate in the laboratory, where the shrinkage was measured, and the industry where the columns were cured, maybe ± 10% RH. The strain was mainly measured at 20 °C or recalculated to 20 °C accordant a thermal coefficient of dilatation of 0.01 per mil/°C. Some columns were identical as regards the structural properties, in which case only the average results are presented. Appendices 2.2-3 show the structural properties of the square columns S32 and S37. The estimations of the creep were carried out according to [25]. The elastic effect was added. The creep compliance was adjusted taking into account half the
hydraulic radius of the specimen. Half the hydraulic radius of the square column was 0.05 m. Generally the ISO 834 fire tests of the columns S32 and S37 showed large spalling of concrete without fibres at w/c = 0.32 (w/b = 0.30) and no spalling at all of concrete with w/c = 0.37 (w/b = 0.35). Concrete with w/c = 0.32 and 4 kg/m³ did not obtain any spalling at all. Concrete with w/c = 0.32 and 2 kg/m³ did however obtain some spalling. The prestressing level did not seem to affect the spalling at all.
2.7.4 Performance of columns in fire Extensive tests were carried out at the British Building Research Establishment (BRE)’s Cardington Laboratory [28-34]. The size of the 30 unreinforced columns tested in the laboratory was 200 x 200 x 1500 mm. ISO 834 834 standard procedure was used with a maximum temperature of 905 °C. The cylinder strength of the concrete fulfilled C85 (85 MPa). During the tests the columns were loaded, either at 40 % or 60 % of the ultimate load. Only 4 of the 30 columns survived the maximum temperature, three with polypropylene fibres, Figures 2.35 and 2.36. The results of the laboratory tests were utilised in a fire compartment, 225 m² and 2.25 m in height [28,30]. Timber cribs created the fire load of 40 kg/m² (720 MJ/m²). The predicted fire design scenario was based on Eurocode for actions [28,31]. Internal columns of 400 x 400 mm and external 250 x 400 mm were studied. All columns were grade C85 (28-day strength of 103 MPa, 4.2% moisture content) and 2.7 kg/m³ polypropylene fibres were added to the mix proportions of the concrete, which is more than 2.0 kg/m³ as specified in the Eurocode [28,31]. The thickness of the concrete floor was 250 mm. The total design load at the fire limit state was 9.25 kN/m² [28]. The design load is based on a 40% reduction in the partition and imposed load as stated in [32], [28]. During the test a main cable burnt through resulting in loss of all data from this point on. All columns behaved well during the fire and no spalling was observed. However, extensive spalling of the concrete floor occurred [28]. Material falling from the ceiling during spalling had an affect of suppressing the fire [28,33]. For this reason the maximum temperature in the compartment was lower than predicted by the Eurocode [28,34]. Since the loading level was unrealistically high in combination with unreinforced concrete 33% of ultimate loading was applied instead on concrete columns (the same dimension as stated above was studied). The following conclusions were drawn on the tests with reinforced concrete of different grades, with or without polypropylene fibres [28]:

15
400
600
800
1000
80 90 100 110 120
Compressive 28-day strength (MPa)
Tem
pera
ture
at f
irst c
rack
ing
(°C
)
With fibres - with silica fumeWith fibres - without silica fumeWithout fibres - with silica fumeWithout fibres - without silica fume
Figure 2.35 – Temperature at first cracking of unreinforced columns [28].
400
600
800
1000
80 90 100 110 120
Compressive 28-day strength (MPa)
Tem
pera
ture
bef
ore
colla
pse
(°C
)
With fibres - with silica fumeWith fibres - without silica fumeWithout fibres - with silica fumeWithout fibres - without silica fume
40% of ultimate loading
60 % of ultimate loading
Figure 2.36 – Temperature before collapse of unreinforced columns [28].
1. For C45 no spalling took place 2. For C85 severe spalling took place in case of
no polypropylene fibres 3. Spalling also occurred of C105 grade concrete
without fibres The largest benefit observed from the use of polypropylene fibres was for the C85 concrete. The strength increased from 55% of the ambient temperature strength in case of no fibres to 70% of the ambient temperature strength in the case with fibres. The research also gave the following main conclusions [28-29]: 1. When it is required to prevent spalling in high
grade concrete, then polypropylene fibres should be included
2. The residual strength was not improved by use of polypropylene fibres
3. The compressive strength was decreased by use of polypropylene fibres in the concrete
4. The density was decreased by use of polypropylene fibres in the concrete
5. Silica fume did not affect the properties of concrete in fire
2.7.5 Effect of high temperature on the permeability The effect of high temperature on the permeability was studied for three types of HPC, Appendix 2.4 [35-37]. The heating rate was slow: 60 °C/h, e.i. about 10 h from 20 to 600 °C. The size of the specimens was also fairly small, cylinders 150-160 mm in diameter and 300-320 mm long [35]. The following conclusions were drawn [35]: 1. Two kg/m³ of polypropylene fibres did not
change the mechanical properties. 2. Explosive spalling occurred in light weight
concrete probably due to high temperature gradient.
3. Under the same thermal treatment at 200 °C the increase of permeability is greater in HPC with polypropylene fibres due to the fibres melting.
4. Under the same thermal treatment at 600 °C the increase of permeability is equal in HPC with and without polypropylene fibres due to the fibres melting.
5. Under the same thermal treatment at 200 °C and 600 °C the permeability of light weight HPC is lower than that of normal weight HPC which also may explain the spalling.

16
2.7.6 Thermal stresses and water vapour pressure of HPC Thermal stresses and water vapour pressure of HPC at high temperature was studied [38-39]. The specimen size was diameter 150 mm and length 320 mm. It was stored at relative humidity, RH = 95% and temperature = 22 °C 2 months before testing. The heating rate was slow, 60 °C/h. The mix proportions of the concrete are given in Appendix 2.5. Figure 2.37 shows that the residual (after cooling) relative tensile strength is slightly larger in HPC than in NC at higher temperature [38]. The same applies for the elastic modulus of HPC in comparison to NC, Figure 2.38 [38]. Table 2.3 gives the thermal expansion coefficient at elevated temperature [38]. Table 2.3 - Thermal expansion coefficient ·10-5 [38], Appendix 2.5. Temp. (°C) HPC NC 20-50 1.4 ·10-5 1.1 50-90 1.5 1.2 90-200 1.6 1.3 200-275 1.7 1.5
0
0.2
0.4
0.6
0.8
1
0 200 400 600 800
Temperature (°C)
Res
idua
l rel
ativ
e te
nsile
str
engt
h
HPC - dir. HPC-splitNC-dir. NC-split
Figure 2.37 - The residual (after cooling) relative tensile strength is slightly larger in HPC than in NC at higher temperature [38], Appendix 2.5.
0
0.2
0.4
0.6
0.8
1
0 200 400 600 800
Temperature (°C)
Res
idua
l rel
ativ
e el
astic
mod
ulus
HPC NC
Figure 2.38 - The residual (after cooling) elastic modulus is slightly larger in HPC than in NC at higher temperature [38], Appendix 2.5. In Figures 2.16-18 above it has been shown than temperature gradients of more than 5 °C/mm are required to obtain spalling in 150 mm cylinders [24]. The temperature gradient obtained by 60 °C/h heating rate was obviously too small to create spalling of 160 mm cylinders, Figure 2.41 [38]. Figure 2.41 shows the temperature gradient obtained by 60 °C/h heating rate of 160 mm cylinders [38], Appendix 2.5. Figure 2.39 shows the residual relative porosity at elevated temperature being 4% for both HPC and NC at 20 °C [38]. The porosity increase is larger for NC than for HPC in the critical temperature span between 200 and 300 °C. Since water in fluid state cannot exist above 275 °C it is of great importance that the water may be transported through the outer part of the concrete or be incorporated in an increased porosity. This is evidently possible in NC but not in HPC causing spalling in HPC. In order to establish the amount of spalling it is important to know the weight loss of concrete at elevated temperature. The losses come from evaporated and non-evaporable water and ignition losses from the aggregate, for example after fire spalling tests. Figure 2.40 shows the residual relative weight of HPC and NC after heating [38]. The weight loss was somewhat larger of NC than of HPC probably due to larger water content in NC than in HPC. Another important parameter to take into account during spalling is the temperature gradient within the concrete.

17
1
1.5
2
2.5
3
0 200 400 600 800
Temperature (°C)
Res
idua
l rel
ativ
e po
rosi
ty
HPC NC
Figure 2.39 - Residual relative porosity at high temperature being 4% for HPC and NC at 20 °C [38], Appendix 2.5.
0.7
0.75
0.8
0.85
0.9
0.95
1
0 200 400 600 800
Temperature (°C)
Res
idua
l rel
ativ
e w
eigh
t
HPC NC
Figure 2.40 - Residual relative weight of HPC and NC after heating [38], Appendix 2.5.
0
0.5
1
1.5
2
2.5
3
3.5
4
4.5
0 200 400 600 800
Oven temperature (°C)
Tem
pera
ture
gra
dien
t in
160
mm
cyl
inde
r with
60
°C/h
hea
ting
rate
(°C
/mm
)
20 40 60
Figure 2.41 - Temperature gradient obtained by 60 °C/h heating rate of 160-mm cylinders [38], Appendix 2.5. The maximum gradient was 4.2 °C/mm at about 275 °C oven temperature. At higher temperature fluid water may no longer exists but in this case the water may be transported towards the surface since the heating rate was fairly low. At higher heating rate no time is available for this transport, the gradient will be too large and spalling take place starting from the surface. In order to calculate the maximum pressure in a 160-mm cylinder at 60 °C/h heating rate some permeability values had to be used, Table 2.4 [38]. Table 2.4 - Permeability values [38]. Concrete HPC NC w/b 0.56 0.53w/c 0.56 0.61w/p 0.56 0.44Permeability (10-12 x(m/s)) 3 15 Age (days) 30 30 RH (%) 95 95 Thermal conductivity (J/ms°C)
1.6 1.6
Heating rate (°/h) 60 60 Figure 2.42 shows the calculated maximum pressure in 160- mm cylinder at 60 °C/h heating rate [38], Appendix 2.5.

18
0
0.5
1
1.5
2
2.5
0 200 400 600 800
Oven temperature (°C)
Max
imum
pre
ssur
e in
160
-mm
cyl
inde
r at 6
0 °C
/h h
eatin
g ra
te (M
Pa)
HPC NC
Figure 2.42 - Calculated maximum pressure in 160-mm cylinder at 60 °C/h heating rate [38], Appendix 2.5. Again it is shown that the critical temperature where water formed due to the temperature increase and accompanying RH-increase no longer may exists is 275 °C, Figure 2.42. The pressure shown in Figure 2.42 is larger than those shown in Figures 2.21-23 which is explained by the type of concrete, HPC in Figure 2.42 and NC in Figures 2.21-23.
2.7.7 Rapid heating In Figure 2.22-23 water pressure, heat and spalling of NC is registered [24]. Similar experiments but on HPC and with smaller specimens, cylinders 100 mm in diameter and 200 mm long, or blocks 100 x 200 x 200 mm subjected to fire from one side only, were performed [40-44]. The heating rate was set at 300 °C/h, i.e. slightly lower than that use in Figure 2.22-23. In Figure 2.22-23 extensive spalling occurred of 150-mm diameter NC cylinders at either 240 or 480 °C/h heating rate in the oven [24]. The temperature gradient then exceeded 5 °C/mm, Figure 2.16-17. The tests of HPC show the efficiency of using polypropylene fibres for mitigation of explosive spalling [40-44]. Materials and properties of the concrete in study are shown in Appendix 2.6 [40]. Spalling of the 100-mm diameter specimen took place after about 2.5 h at a oven temperature of 500 °C at a specimen centre
temperature of about 275 °C [40]. This findings confirms results by [24], i.e. at 275 °C when fluid water no longer may exist a sudden explosion takes place when the water is transformed into vapour (initially the specimen contained water vapour but when the temperature increases also RH increase in the specimen and fluid water formed moving toward the specimen centre). In Figure 2.43 the temperature gradient of the 100-mm cylinder specimen of mix proportion 1, Appendix 2.6, versus time, the temperature rate and the calculated value gradient-rate ratio, g/r, are shown are shown [40]. Around g/r = 360 min/m or g/r = 6 h/m explosive spalling occurred [40]. What happened after spalling as concerns temperature development is of low interest and even difficult to measure. In Figure 2.44 the temperature gradient of a 100-mm slab specimen versus time, the temperature rate and the calculated gradient-rate ratio, g/r, are shown [40], mix proportion 1, Appendix 2.6. In this case the double g/r-value was acceptable due to twice the hydraulic radius of the specimen as compared to the 100-mm cylinder specimen. Figure 2.45 shows the pore pressure of a 100-mm slab for mix proportions 1-4, Appendix 2.6 [40]. Amount of polypropylene fibres is indicated.
0
200
400
600
800
0 1 2 3Time (h)
Obs
erva
tion
for 1
00-m
m c
ylin
der
Temperature gradient (°C/m)Temperature rate (°C/h)(Gradientxrate)0.5 (°C0.5/hxm)
Figure 2.43 - Temperature gradient of 100-mm cylinder specimen versus time, the temperature rate and the calculated gradient-rate ratio, g/r, [40]. Mix proportion 1, Appendix 2.6.

19
0
500
1000
1500
2000
0 1 2 3Time (h)
Obs
erva
tion
in 1
00-m
m s
lab
Temperature gradient (°C/m)Temperature rate (°C/h)(Gradientxrate)0.5 (°C/hxm)
Figure 2.44 - Temperature gradient of 100-mm slab specimen versus time, the temperature rate and the calculated gradient-rate ratio, g/r, [40]. Mix proportion 1, Appendix 2.6.
0
0.5
1
1.5
2
0 100 200 300 400
Temperature 25 mm from surface (°C)
Pres
sure
25
mm
from
sur
face
(MPa
)
HPC1 HPC1-1.5 kg/m³HPC1-3.0 kg/m³ NC4NC4 -air
Spalling
Figure 2.45 - Pore pressure of 100-mm slab for mix proportions 1-4, Appendix 2.6. Amount of polypropylene fibres is given [40].
Three kg/m³ of fibres had a very beneficial effect on the fire spalling resistance at w/b = 0.20. One-point-five kg/m³ of fibres was not sufficient to control the pressure but still spalling was avoided.
2.7.8 Relative strength Figure 2.46 shows the development of relative stressed strength versus temperature of concrete given in Appendix 2.6 [40]. The stress was 40% of the 23 °C-strength and withhold throughout the testing. Figure 2.47 in turn shows the development of relative unstressed strength versus temperature of concrete given in Appendix 2.6 [40]. Both the stressed and the unstressed strength properties were tested at elevated temperature. Figure 2.48 shows the residual relative unstressed strength versus temperature, Appendix 2.6 [40]. The residual relative strength was normally lower than the stress and the unstressed strength on at elevated temperature, about 300 °C and higher except for w/b = 0.20 [40].
2.7.9 Comparison with European codes Figure 2.49 shows a comparison of the relative stressed strength according to various European codes [40]. The lowest relative strength was obtained for HPC followed by the CEB code.
0
0.2
0.4
0.6
0.8
1
0 200 400 600 800
Temperature (°C)
Rel
ativ
e st
ress
ed s
tren
gth
HPC1 HPC2HPC3 NC4
Figure 2.46 – Relative stressed strength versus temperature, Appendix 2.6 [40].

20
0
0.2
0.4
0.6
0.8
1
0 200 400 600 800
Temperature (°C)
Rel
ativ
e un
stre
ssed
str
engt
h
HPC1 HPC2HPC3 NC4
Figure 2.47 - Relative unstressed strength versus temperature, Appendix 2.6 [40].
0
0.2
0.4
0.6
0.8
1
0 200 400 600 800
Temperature (°C)
Rel
. uns
tres
sed
resi
dual
str
engt
h
HPC1 HPC2HPC3 NC4
Figure 2.48 – Residual relative unstressed strength versus temperature, Appendix 2.6 [40].
0
0.2
0.4
0.6
0.8
1
0 200 400 600 800 1000
Temperature (°C)R
el. s
tres
sed
stre
ngth
CEBEurocode SiliceousEurocode CalcareousRakMK HPCRakMK NC - 30% preload
Figure 2.49 - Comparison of the relative stressed strength according to European codes [40]. The highest relative stressed strength was obtained by the Eurocode for calcareous material and by the Finnish code RakMK for normal concrete, 30% preloading of the ultimate strength [40]. Figure 2.50 shows the corresponding unstressed relative strength according to the Finnish code [40].
2.8 SCC with steel fibres In order to incorporate steel fibres in SCC is was necessary to diminish the amount of large aggregate in the mix proportions [45-47]. Table 2.5 and Figure 2.51 give example of mix proportions and grading of SCC with steel fibres. Table 2.5 - Mix proportions of SCC with steel fibres (kg/m³) Cement 400 Fly ash 100 Steel fibrers 79 Water 190 w/b = w/p 0.38 w/c 0.43 Slump flow (mm) 620 28-day strength (MPa) 70
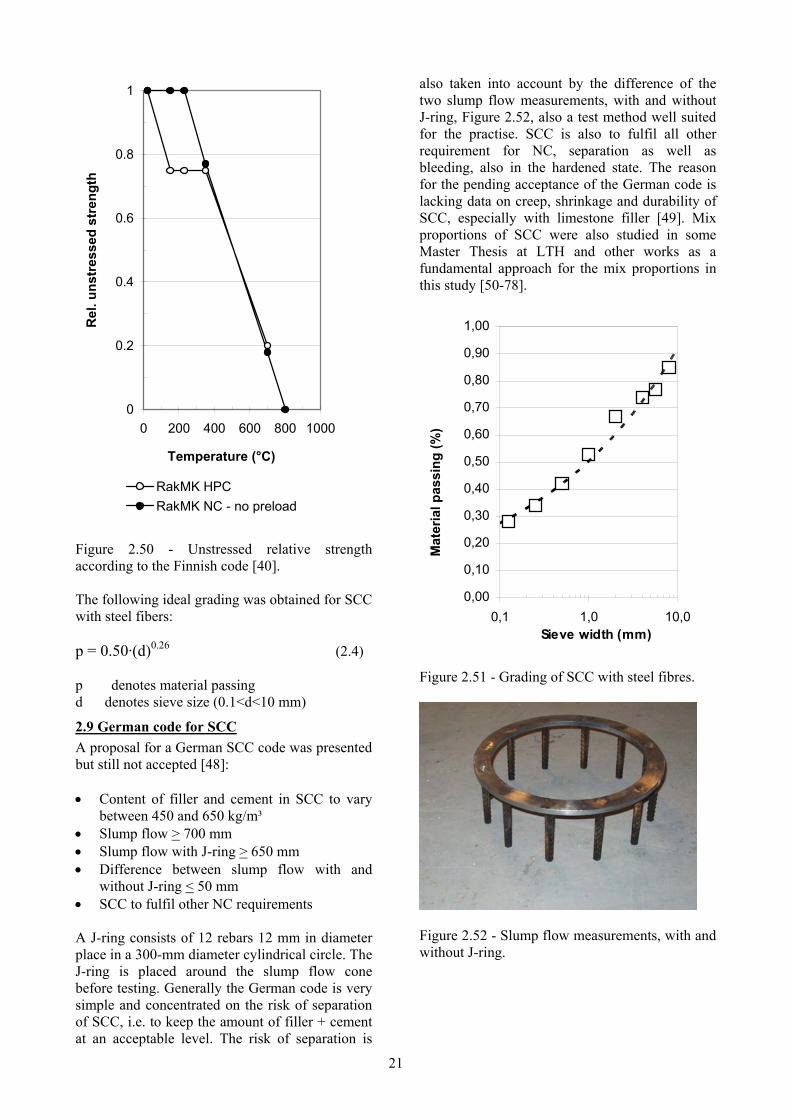
21
0
0.2
0.4
0.6
0.8
1
0 200 400 600 800 1000
Temperature (°C)
Rel
. uns
tres
sed
stre
ngth
RakMK HPCRakMK NC - no preload
Figure 2.50 - Unstressed relative strength according to the Finnish code [40]. The following ideal grading was obtained for SCC with steel fibers: p = 0.50·(d)0.26 (2.4) p denotes material passing d denotes sieve size (0.1<d<10 mm)
2.9 German code for SCC A proposal for a German SCC code was presented but still not accepted [48]: • Content of filler and cement in SCC to vary
between 450 and 650 kg/m³ • Slump flow > 700 mm • Slump flow with J-ring > 650 mm • Difference between slump flow with and
without J-ring < 50 mm • SCC to fulfil other NC requirements A J-ring consists of 12 rebars 12 mm in diameter place in a 300-mm diameter cylindrical circle. The J-ring is placed around the slump flow cone before testing. Generally the German code is very simple and concentrated on the risk of separation of SCC, i.e. to keep the amount of filler + cement at an acceptable level. The risk of separation is
also taken into account by the difference of the two slump flow measurements, with and without J-ring, Figure 2.52, also a test method well suited for the practise. SCC is also to fulfil all other requirement for NC, separation as well as bleeding, also in the hardened state. The reason for the pending acceptance of the German code is lacking data on creep, shrinkage and durability of SCC, especially with limestone filler [49]. Mix proportions of SCC were also studied in some Master Thesis at LTH and other works as a fundamental approach for the mix proportions in this study [50-78].
0,00
0,10
0,20
0,30
0,40
0,50
0,60
0,70
0,80
0,90
1,00
0,1 1,0 10,0Sieve width (mm)
Mat
eria
l pas
sing
(%)
Figure 2.51 - Grading of SCC with steel fibres.
Figure 2.52 - Slump flow measurements, with and without J-ring.

22
2.10 Explosive fire spalling of normal concrete
2.10.1 Conditions for fire spalling Khoury [79] states the following types of spalling for normal concrete: • Aggregate spalling • Explosive spalling • Surface spalling • Corner spalling The first three types occur between the first 20 and 30 minutes of fire and are influenced by the heating rate mainly. The fourth type of spalling (corners) takes place after 30 to 60 minutes after fire and is influenced by the maximum temperature. All types of spalling are violent except for the fourth ones. Khoury [79] also states that the fire spalling is influenced by the following material parameters: • Permeability • Saturation level • Aggregate size • Aggregate type The shape and size are geometric factors that significantly influences on the risk of fire spalling [79]. Few environmental factors are critical for the fire spalling to occur, Table 2.6 and Figure 2.53: • The heating rate • The heating profile • The load level The heating rate is supposed to be more than between 120 and 180 °C/h and the pore saturation level to be more than between 2 and 3% for the fire spalling to occur, Figure 2.53. The applied stress in a way work hand in hand with the concrete quality, i.e. for HPC the stress will automatically be larger than in NC. For a 100-MPa HPC a normal applied stress may be 30 MPa but in NC of 30 MPa only around 10 MPa. The critical moisture level then is around 2.5% for HPC to give fire spalling and around 3.5% for NC. HPC also has low permeability, which is another factor to take into account when estimating the risk of fire spalling even though the tensile strength is substantially larger in HPC than in NC. The low permeability in HPC affects the pore pressure rise parallell with the temperautre rise also due the much more horizontal isotherm in HPC than in NC. A small change of moisture when the water in the pores moves inwards during fire influences RH more in HPC than in NC. This is due to a finer pore system in HPC than in NC.
Table 2.6 – Factors effecting fire spalling [79]. Spalling Time
(h) Kind Sound Effect Root
Aggregate 0.11-0.5
Split-ting
Pop-ping Super-ficial
A,D, S,H,W
Corner 0.5-1.5
Non-violent
None Can be serious
A,F, R,T
Explosive 0.11-0.5
Violent Load bang
Serious A,Fs, G,H, L,O, P,Q, R,S, W,Z
Surface 0.11-0.5
Violent Cracking Can be serious
Ft,H, P,W
A aggregate thermal expansion D aggregate thermal diffusivity Fs Shear strength of concrete Ft Tensile strength of concrete G age of concrete H heating rate L loading restraint O heating profile P Permeability Q Section shape R Reinforcement S Aggregate size T Maximum temperature W Moisture content Z Section size Figure 2.53 gives an equation for the risk of fire spalling [79]:
0
2
4
6
8
0 10 20 30
Applied stress (MPa)
Moi
stur
e co
nten
t (%
)
Spalling
No spalling
Figure 2.53 – Risk of fire spalling in concrete versus stress and moisture content [79].
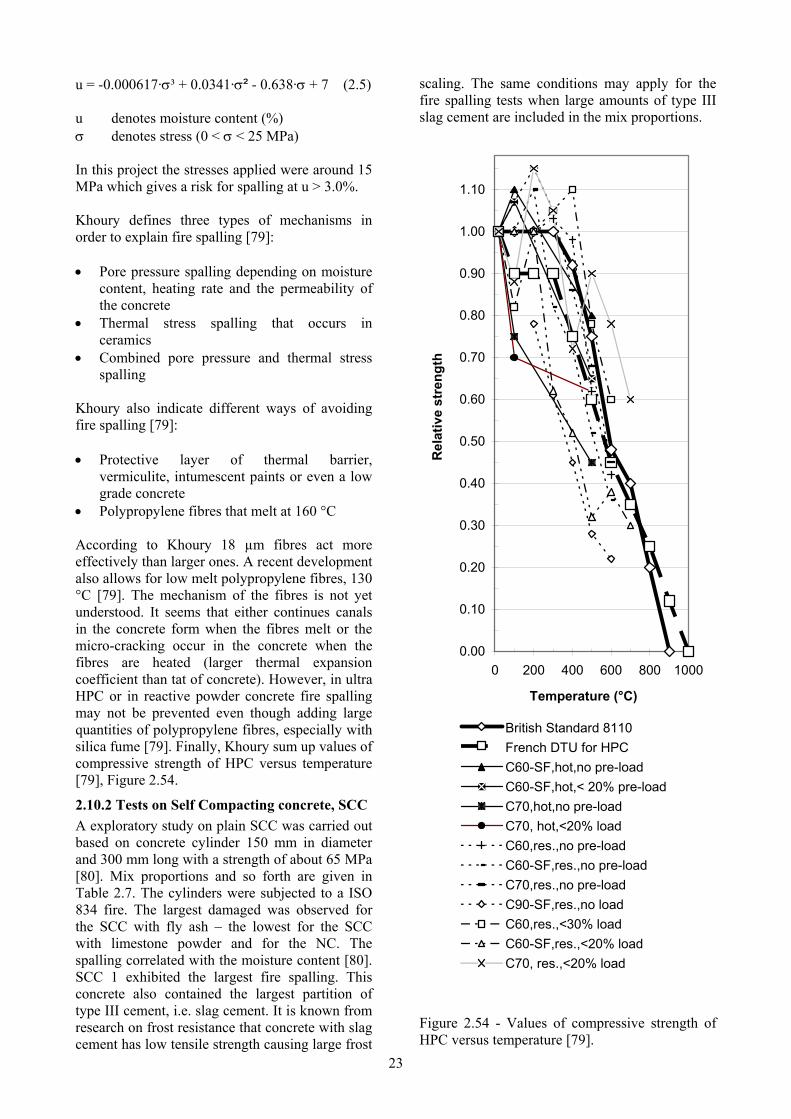
23
u = -0.000617·σ³ + 0.0341·σ² - 0.638·σ + 7 (2.5) u denotes moisture content (%) σ denotes stress (0 < σ < 25 MPa) In this project the stresses applied were around 15 MPa which gives a risk for spalling at u > 3.0%. Khoury defines three types of mechanisms in order to explain fire spalling [79]: • Pore pressure spalling depending on moisture
content, heating rate and the permeability of the concrete
• Thermal stress spalling that occurs in ceramics
• Combined pore pressure and thermal stress spalling
Khoury also indicate different ways of avoiding fire spalling [79]: • Protective layer of thermal barrier,
vermiculite, intumescent paints or even a low grade concrete
• Polypropylene fibres that melt at 160 °C According to Khoury 18 µm fibres act more effectively than larger ones. A recent development also allows for low melt polypropylene fibres, 130 °C [79]. The mechanism of the fibres is not yet understood. It seems that either continues canals in the concrete form when the fibres melt or the micro-cracking occur in the concrete when the fibres are heated (larger thermal expansion coefficient than tat of concrete). However, in ultra HPC or in reactive powder concrete fire spalling may not be prevented even though adding large quantities of polypropylene fibres, especially with silica fume [79]. Finally, Khoury sum up values of compressive strength of HPC versus temperature [79], Figure 2.54.
2.10.2 Tests on Self Compacting concrete, SCC A exploratory study on plain SCC was carried out based on concrete cylinder 150 mm in diameter and 300 mm long with a strength of about 65 MPa [80]. Mix proportions and so forth are given in Table 2.7. The cylinders were subjected to a ISO 834 fire. The largest damaged was observed for the SCC with fly ash – the lowest for the SCC with limestone powder and for the NC. The spalling correlated with the moisture content [80]. SCC 1 exhibited the largest fire spalling. This concrete also contained the largest partition of type III cement, i.e. slag cement. It is known from research on frost resistance that concrete with slag cement has low tensile strength causing large frost
scaling. The same conditions may apply for the fire spalling tests when large amounts of type III slag cement are included in the mix proportions.
0.00
0.10
0.20
0.30
0.40
0.50
0.60
0.70
0.80
0.90
1.00
1.10
0 200 400 600 800 1000
Temperature (°C)
Rel
ativ
e st
reng
th
British Standard 8110French DTU for HPCC60-SF,hot,no pre-loadC60-SF,hot,< 20% pre-loadC70,hot,no pre-loadC70, hot,<20% loadC60,res.,no pre-loadC60-SF,res.,no pre-loadC70,res.,no pre-loadC90-SF,res.,no loadC60,res.,<30% loadC60-SF,res.,<20% loadC70, res.,<20% load
Figure 2.54 - Values of compressive strength of HPC versus temperature [79].

24
Table 2.7 - Mix proportions, spalling and so forth of study on SCC (kg/m³) [80]. Concrete NC SCC1 SCC2 SCC3 CEMI R A 260 240 CEMI R E 100 185 80 CEMIII B 300 185 110 CEMIII C Fly ash 185 Limestone filler 250 250 Sand 0-4 mm 830 660 790 770 Pea gravel 4-16 mm
900
Crushed 4-16 mm 975 Gravel 4-16 mm 860 Limestone 4-14 mm
840
Plasticiser 2.3 2.4 2.4 Cement 400 370 340 350 Cement + fly ash 400 555 340 350 Powder 400 555 590 600 Water 156 177 119 133 c/p 1 0.67 0.57 0.58 (c+fly ash)/p 1 1 0.57 0.58 w/c 0.39 0.48 0.35 0.38 w/p 0.39 0.32 0.20 0.22 E-modulus (GPa) 37 34 40 37 Moisture, unsealed (%)
2.7 3.4 3.3 3.9
Spalling, unsealed (%)
6.0 6.9 7.2 6.5
Moisture, sealed (%)
3.9 4.7 4.0 4.6
Spalling, sealed (%)
7.1 9.6 7.2 7.4
Damage, sealed (%)
5 14 0 3
Moisture, saturated (%)
4.2 5.7 4.6 4.9
CEMI = Portland cement; CEMIII = slag cement.

25
3. MATERIALS AND METHODS
3.1 Material Cement type I Degerhamn and type II Byggce-ment Skövde were used, Appendix 3.1. Crushed aggregate 8-11 and 11-16 mm and natural sand 0-8 mm, based on gneiss and filler of glass (brand SGÅ) or limestone (brand Limus 40) were used. Grading of the aggregates, filler and cements are given in Appendix 3.2. Superplasticiser of mela-mine formaldehyde or polycarboxyl ether were used. Air-entrainment agent was fir oil-based. Polypropylene fibres 32 µm in diameter were used (brand Bagrat LMF).
3.2 Optimisation of SCC Optimisation took place during the first half of 2001 mainly based on the following requirement to be fulfilled for the concrete: • Slump flow > 650 mm • Slump flow to 500 mm < 10 s • L-box ratio < 0.8, i.e. height in L-box at front
to height at shaft • Separation cylinder ratio < 0.9 • Air-content 5% for concrete with Degerhamn
Std cement Mix proportions of NC were obtained from the production of concrete at Skanska Prefab, SPAB, in Bollebygd. When the optimisations were fin-ished, field tests were carried out. The field test in the first half of 2001 failed since it was not possi-ble to adjust the amount of superplasticiser during the mixing procedure. Thus the decision was taken to re-optimise all the SCC [81-82].
3.3 Fabrication of concrete specimen The specimen size for fire test were either cylin-ders 100 mm in diameter and 200 mm long. Be-side also cubes were cast and tested, either 100-mm or 150-mm. All columns were produced at the factory at SPAB. A 1000-l compulsive mixer was used. At LTH the concrete was mixed in a 40-l compulsive mixer. The same material was used in SPAB like in Lund. At fabrication of specimen in Lund the following mixing procedure was used: • Mixing with water and air-entrainment, ½ min • Mixing with superplasticiser for 2 min. • Test of slump flow • Adjustment of superplasticiser • Mixing with superplasticiser for 2 min. In the first half of 2001 the following mixing pro-cedure was used during fabrication of specimen at SPAB (concrete 55BK0, 55BK2 and 55BR0):
• Mixing with water and air-entrainment, ½ min • Mixing with superplasticiser for 2 min. In second half of 2001 at SPAB: • Mixing with water and air-entrainment, ½ min • Mixing with superplasticiser for 2 min. • Test of slump flow • Adjustment of superplasticiser • Mixing with superplasticiser for 2 min. Concrete with Byggcement intended for house building was cured at ambient RH = 60%, at least half a year before testing. Concrete with Deger-hamn cement intended for outdoor constructions was cured in water half a year before testing. The water curing was supposed to simulate the condi-tions for a tunnel wall subjected to water pressure from one side and air from the other. The cubes for compressive strength testing were cured like-wise. Details of the oven are shown in Appendices 3.3-6. The specimen for the oven tests were used in the following way: 20 °C 2 pieces for strength and RH 200 °C 2+2 pieces for strength at elevated tem-
perature and after cooling 400 °C 2+2 pieces for strength at elevated tem-
perature and after cooling 800 °C 2+2 pieces for strength at elevated tem-
perature and after cooling
3.4 Mechanical behaviour of concrete The following equipment was used at LTH: • Testing machine with high-temperature
oven completed with cooling equipment • Stainless steel supports 100 mm in diame-
ter, SIS 2368 M3 253A (brand: Avesta Sheffield) at tests with 20 °C, 200 °C, 400 °C and 800 °C oven temperature
• Protective net on the specimen, Appendix 3 • Testing with 0.5 N/(s·mm²) loading rate • Vaisala HMP 44 probes for RH • Grindosonic frequency indicator • Two LVDTs for deformation measurements • Thermocouples cast in the specimen and
placed in the oven • Scale • Humidity generator (for calibration of the
RH probe, before and after measurements) The testing equipment was calibrated before the testing took place, both the compressive testing machine and the LVDTs. In all about 140 cylin-ders were tested. The following were obtained:

26
• Weight and fundamental frequency at 20 °C before testing
• RH before strength testing • Temperature inside and at the surface of the
specimen • Deformation of specimen at the outside of the
oven after deduction of deformations of equipment
• Compressive stress during testing • Residual properties were obtained at 20 °C
and RH = about 40% after 7 days of cooling

27
4. RESULTS
4.1 Time schedule The cylinders were cast during 2001-2002 and tested in the autumn of 2002, Appendix 4.1. Cyl-inder were older than concrete cast in Bollebygd: 160 days’ age at fire spalling test except for con-crete 55BK0, 55BK2 and 55BR0 (320 days’ age).
4.2 Optimisation and strength Concrete optimised and cast at LTH and Bolle-bygd are given in Appendices 4.2-4.6 [81-84]. Figures 4.1-4.6 and Appendices 4.7-4.8 show the concrete strength. Figure 4.7 shows similar 28-day strength of concrete cast at LTH and at SPAB. Notations: A = Degerhamn cement (6% air), B = Byggcement (1% air), G = Glass filler, K = Lime-stone powder, R = reference, SGÅ = Svensk Glasåtervinning; NKK = Nordkalk; 0 = 0 kg polypropylenfibre/m³, 40 = w/c (%).
4.3 Pre-testing in oven at LTH The LTH oven was pre-tested at 20 °C, 200 °C, 400 °C and 800 °C, with steel, Figures 4.8-11 and with concrete, Figures 4.12-15. The tests with steel were performed in order to obtain its elastic modulus, which was set at 184 GPa for loading. The temperature development in the oven was much slower than the standard fire, equation (2.3), Figures 2.12 and 4.16 but the objective was to avoid fire spalling. The LVDT deformation gauges and the load cells in use were calibrated. From the pre-tests it was concluded that the elastic modulus and the strength declined with the tem-perature but that the ultimate strain increased up to 400 °C, Figures 4.17-18.
4.4 Stress/strain tests in oven A summary of the number of Appendices and Tables in which the result of strain/stress tests are shown is given in Table 4.1. Table 4.1 - Summary of Appendices and Tables with result of strain/stress tests. Concrete Appendices Figures 40AG0 4.9-4.15 4.19-4.22 40AK0 4.16-4.21 4.23-4.26 40AK2 4.22-4.27 4.27-4.30 40AK4 4.28-4.33 4.31-4.34 40BR0 4.34-4.40 4.35-4.38 55BK0 4.41-4.46 4.39-4.42 70BG0 4.47-4.53 4.43-4.46 70BK0 4.54-4.59 4.47-4.50 Notations: A = Degerhamn cement with 6% air –entrainment, B = Byggcement with natural air content (about 1%), G = Glass filler, K = Lime-stone powder, R = Reference, 0 = 0 kg polypro-pylenfibre/m³, 40 = w/c (%).
0
20
40
60
80
100
1 10 100Age (days)
Stre
ngth
(MPa
)
40AK0 40AK240AK4 40AK4-new40BK0 40BR0
Figure 4.1 –Strength with w/c = 0.40 (LTH).
0
20
40
60
80
100
1 10 100
Age (days)
Stre
ngth
(MPa
)
55BK0 55BK0-new
Figure 4.2 – Strength with w/c = 0.55 cast at LTH.
0
20
40
60
80
100
1 10 100
Age (days)
Stre
ngth
(MPa
)
70BG0LTH 70BG0SGÅ70BK0LTH 70BK0NKK
Figure 4.3 – Concrete strength at LTH (w/c=0.70).

28
0
20
40
60
80
100
0 10 20 30
Age (days)
Stre
ngth
(MPa
)
40AG0 40AK040AK2 40AK440AR0 40BK040BR0
Figure 4.4 – Strength of concrete with w/c = 0.40 cast at SPAB, Bollebygd.
0
20
40
60
80
100
0 10 20 30Age (days)
Stre
ngth
(MPa
)
55BK0 55BK255BK4 55BR0
Figure 4.5 – Strength of concrete with w/c = 0.55 cast at SPAB, Bollebygd.
0
20
40
60
80
100
0 10 20 30
Age (days)
Stre
ngth
(MPa
)70BG0 70BK070BK2 70BK470BR0
Figure 4.6 – Strength of concrete with w/c = 0.55 cast at SPAB, Bollebygd.
0
20
40
60
80
100
40AG0
40AK0
40AK2
40AK4
40BR0
55BK0
70BG0
70BK0
Stre
ngth
(MPa
)
LTH SPAB
LTH
SPAB
Figure 4.7 – Comparison of 28-day strength for concrete cast at LTH and at SPAB. Upper regres-sion line = average strength of concrete cast at SPAB; lower regression line = average strength of concrete cast at LTH.
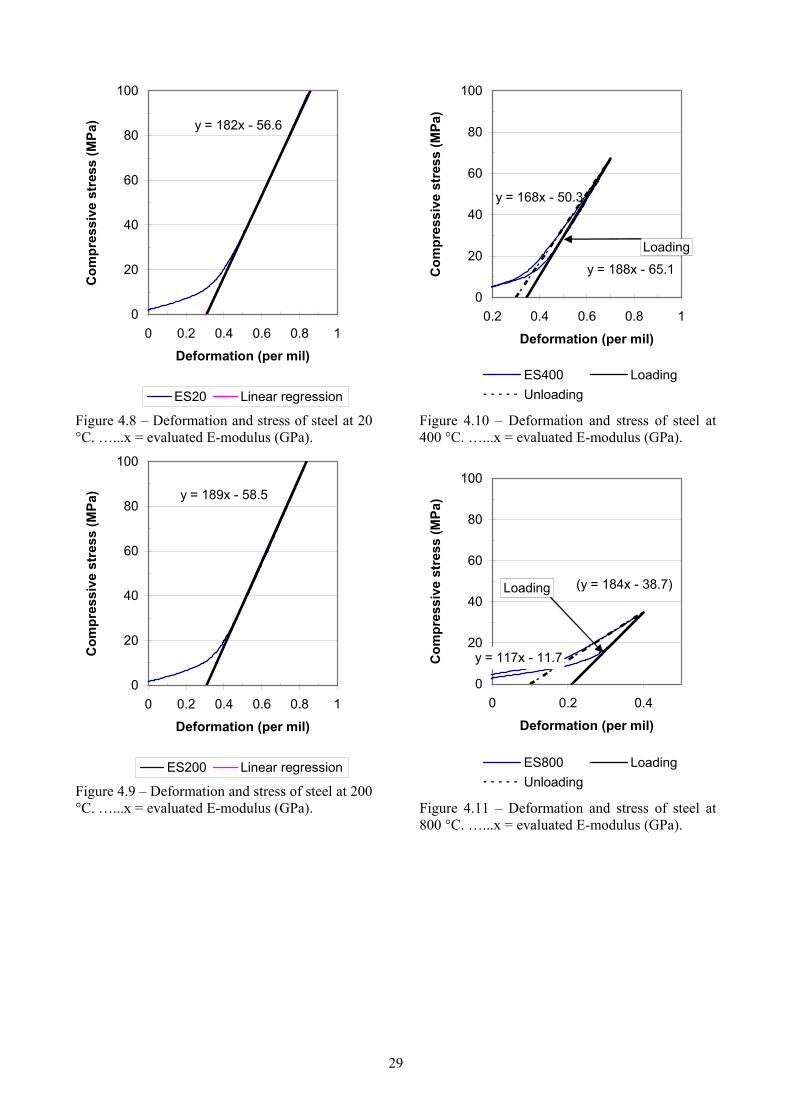
29
y = 182x - 56.6
0
20
40
60
80
100
0 0.2 0.4 0.6 0.8 1
Deformation (per mil)
Com
pres
sive
str
ess
(MPa
)
ES20 Linear regression
Figure 4.8 – Deformation and stress of steel at 20 °C. …...x = evaluated E-modulus (GPa).
y = 189x - 58.5
0
20
40
60
80
100
0 0.2 0.4 0.6 0.8 1
Deformation (per mil)
Com
pres
sive
str
ess
(MPa
)
ES200 Linear regression
Figure 4.9 – Deformation and stress of steel at 200 °C. …...x = evaluated E-modulus (GPa).
y = 188x - 65.1
y = 168x - 50.3
0
20
40
60
80
100
0.2 0.4 0.6 0.8 1
Deformation (per mil)
Com
pres
sive
str
ess
(MPa
)
ES400 LoadingUnloading
Loading
Figure 4.10 – Deformation and stress of steel at 400 °C. …...x = evaluated E-modulus (GPa).
(y = 184x - 38.7)
y = 117x - 11.7
0
20
40
60
80
100
0 0.2 0.4
Deformation (per mil)
Com
pres
sive
str
ess
(MPa
)
ES800 LoadingUnloading
Loading
Figure 4.11 – Deformation and stress of steel at 800 °C. …...x = evaluated E-modulus (GPa).

30
y = 29.5x
0
10
20
30
40
50
60
70
0 1 2 3 4 5Strain (per mil)
Stre
ss (M
Pa)
Pretest 20-ILin. regressionPretest 200-IPretest 400-IPretest800-I
Figure 4.12 – Deformation and stress of concrete at 20 °C, 200 °C, 400 °C and 800 °C. …...x = evaluated E-modulus (GPa).
y = 15.6x
0
5
10
15
20
25
30
35
40
45
50
0 1 2 3 4 5 6
Deformation (per mil)
Stre
ss (M
Pa)
Pretest 200-I Linear regression
Figure 4.13 – Deformation and stress of concrete at 200 °C. …...x = evaluated E-modulus (GPa).
y = 15.3x + 0.5
0
5
10
15
20
25
30
35
40
45
50
0 1 2 3 4 5 6
Deformation (per mil)
Stre
ss (M
Pa)
Pretest 400-ILinear regression
Figure 4.14 – Deformation and stress of concrete at 400 °C. …...x = evaluated E-modulus (GPa).
y = 5.81x
0123456789
10
0 1 2 3Deformation (per mil)
Stre
ss (
MPa
)
Pretest800-ILinear regression
Figure 4.15 – Deformation and stress of concrete at 800 °C. …...x = evaluated E-modulus (GPa).

31
0
200
400
600
800
1000
1200
0 50 100 150
Time (minutes)
Tem
pera
ture
(°C
)
Standard fire Oven
Figure 4.16 – Temperature with standard fire and in LTH oven.
0
20
40
60
80
100
0 200 400 600 800
Temperature (° C)
Valu
e of
mea
sure
d pa
ram
eter
E-modulus (GPa)
Strength (MPa)
Strain (10 x per mil)
Figure 4.17 – Elastic modulus and the strength declined with the temperature but that the ultimate strain increased somewhat up to 400 °C.
0
0.5
1
1.5
0 200 400 600 800
Temperature (° C)
Rat
io to
20-
degr
ee c
entig
rade
va
lue
of m
easu
red
para
met
er
E-modulus (GPa)Strength (MPa)Strain (10 x per mil)
Figure 4.18 –Relative elastic modulus and relative strength declined with the temperature but the relative ultimate strain increased up to 400 °C.
0
20
40
60
80
100
0 200 400 600 800
Temperature (°C)
Res
idua
l pro
pert
y
Elastic modulus (GPa)Strain (‰)Strength (MPa)
Figure 4.19 – Residual property of concrete 40AG0 versus temperature.
0
1
2
3
4
0 200 400 600 800
Temperature (°C)
Rel
ativ
e re
sidu
al
prop
erty
Elastic modulus (GPa)Strain (‰)Strength (MPa)
Figure 4.20 – Relative residual property of con-crete 40AG0 versus temperature.

32
0
20
40
60
80
100
0 200 400 600 800
Temperature (°C)
Hot
pro
pert
y
Elastic modulus (GPa)Strain (10‰)Strength (MPa)
Figure 4.21 – Hot property of concrete 40AG0 versus temperature.
0
1
2
3
4
0 200 400 600 800
Temperature (°C)
Rel
ativ
e ho
t pro
pert
y
Elastic modulus (GPa)Strain (‰)Strength (MPa)
Figure 4.22 – Relative hot property of concrete 40AG0 versus temperature.
0
20
40
60
80
100
0 200 400 600 800
Temperature (°C)
Res
idua
l pro
pert
y
Elastic modulus (GPa)Strain (‰)Strength (MPa)
Figure 4.23 – Residual property of concrete 40AK0 versus temperature.
0
0.5
1
1.5
2
0 200 400 600 800
Temperature (°C)
Rel
ativ
e re
sidu
al
prop
erty
Elastic modulus (GPa)Strain (‰)Strength (MPa)
Figure 4.24 – Relative residual property of con-crete 40AK0 versus temperature.
0
20
40
60
80
100
0 200 400 600 800
Temperature (°C)
Hot
pro
pert
y
Elastic modulus (GPa)Strain (10‰)Strength (MPa)
Figure 4.25 – Hot property of concrete 40AK0 versus temperature.
0
0.5
1
1.5
2
0 200 400 600 800
Temperature (°C)
Rel
ativ
e ho
t pro
pert
y
Elastic modulus (GPa)Strain (‰)Strength (MPa)
Figure 4.26 – Relative hot property of concrete 40AK0 versus temperature.

33
0
20
40
60
80
100
0 200 400 600 800
Temperature (°C)
Res
idua
l pro
pert
y
Elastic modulus (GPa)Strain (‰)Strength (MPa)
Figure 4.27 – Residual property of concrete 40AK2 versus temperature.
0
0.5
1
1.5
2
0 200 400 600 800
Temperature (°C)
Rel
ativ
e re
sidu
al
prop
erty
Elastic modulus (GPa)Strain (‰)Strength (MPa)
Figure 4.28 – Relative residual property of con-crete 40AK2 versus temperature.
0
20
40
60
80
100
0 200 400 600 800
Temperature (°C)
Hot
pro
pert
y
Elastic modulus (GPa)Strain (10‰)Strength (MPa)
Figure 4.29 – Hot property of concrete 40AK2 versus temperature.
0
0.5
1
1.5
2
0 200 400 600 800
Temperature (°C)
Rel
ativ
e ho
t pro
pert
y
Elastic modulus (GPa)Strain (‰)Strength (MPa)
Figure 4.30 – Relative hot property of concrete 40AK2 versus temperature.
0
20
40
60
80
100
0 200 400 600 800
Temperature (°C)
Res
idua
l pro
pert
y
Elastic modulus (GPa)Strain (‰)Strength (MPa)
Figure 4.31 – Residual property of concrete 40AK4 versus temperature.
0
0.5
1
1.5
2
0 200 400 600 800
Temperature (°C)
Rel
ativ
e re
sidu
al
prop
erty
Elastic modulus (GPa)Strain (‰)Strength (MPa)
Figure 4.32 – Relative residual property of con-crete 40AK4 versus temperature.

34
0
20
40
60
80
100
0 200 400 600 800
Temperature (°C)
Hot
pro
pert
y
Elastic modulus (GPa)Strain (10‰)Strength (MPa)
Figure 4.33 – Hot property of concrete 40AK4 versus temperature.
0
0.5
1
1.5
2
0 200 400 600 800
Temperature (°C)
Rel
ativ
e ho
t pro
pert
y
Elastic modulus (GPa)Strain (‰)Strength (MPa)
Figure 4.34 – Relative hot property of concrete 40AK4 versus temperature.
0
20
40
60
80
100
0 200 400 600 800
Temperature (°C)
Res
idua
l pro
pert
y
Elastic modulus (GPa)Strain (‰)Strength (MPa)
Figure 4.35 – Residual property of concrete 40BR0 versus temperature.
0
1
2
3
4
0 200 400 600 800
Temperature (°C)
Rel
ativ
e re
sidu
al
prop
erty
Elastic modulus (GPa)Strain (‰)Strength (MPa)
Figure 4.36 – Relative residual property of con-crete 40BR0 versus temperature.
0
20
40
60
80
100
0 200 400 600 800
Temperature (°C)
Hot
pro
pert
y
Elastic modulus (GPa)Strain (10‰)Strength (MPa)
Figure 4.37 – Hot property of concrete 40BR0 versus temperature.
0
1
2
3
4
0 200 400 600 800
Temperature (°C)
Rel
ativ
e ho
t pro
pert
y
Elastic modulus (GPa)Strain (‰)Strength (MPa)
Figure 4.38 – Relative hot property of concrete 40BR0 versus temperature.

35
0
20
40
60
80
100
0 200 400 600 800
Temperature (°C)
Res
idua
l pro
pert
y
Elastic modulus (GPa)Strain (‰)Strength (MPa)
Figure 4.39 – Residual property of concrete 55BK0 versus temperature.
0.00
0.50
1.00
1.50
2.00
0 200 400 600 800
Temperature (°C)
Rel
ativ
e re
sidu
al
prop
erty
Elastic modulus (GPa)Strain (‰)Strength (MPa)
Figure 4.40 – Relative residual property of con-crete 55BK0 versus temperature.
0
20
40
60
80
100
0 200 400 600 800
Temperature (°C)
Hot
pro
pert
y
Elastic modulus (GPa)Strain (10‰)Strength (MPa)
Figure 4.41 – Hot property of concrete 55BK0 versus temperature.
0.00
0.50
1.00
1.50
2.00
0 200 400 600 800
Temperature (°C)
Rel
ativ
e ho
t pro
pert
y
Elastic modulus (GPa)Strain (‰)Strength (MPa)
Figure 4.42 – Relative hot property of concrete 55BK0 versus temperature.
0
20
40
60
80
100
0 200 400 600 800
Temperature (°C)
Res
idua
l pro
pert
y
Elastic modulus (GPa)Strain (‰)Strength (MPa)
Figure 4.43 – Residual property of concrete 70BG0 versus temperature.
0.00
1.00
2.00
3.00
4.00
0 200 400 600 800
Temperature (°C)
Rel
ativ
e re
sidu
al
prop
erty
Elastic modulus (GPa)Strain (‰)Strength (MPa)
Figure 4.44 – Relative residual property of con-crete 70BG0 versus temperature.

36
0
20
40
60
80
100
0 200 400 600 800
Temperature (°C)
Hot
pro
pert
y
Elastic modulus (GPa)Strain (10‰)Strength (MPa)
Figure 4.45 – Hot property of concrete 70BG0 versus temperature.
0.00
1.00
2.00
3.00
4.00
0 200 400 600 800
Temperature (°C)
Rel
ativ
e ho
t pro
pert
y
Elastic modulus (GPa)Strain (‰)Strength (MPa)
Figure 4.46 – Relative hot property of concrete 70BG0 versus temperature.
0
20
40
60
80
100
0 200 400 600 800
Temperature (°C)
Res
idua
l pro
pert
y
Elastic modulus (GPa)Strain (‰)Strength (MPa)
Figure 4.47 – Residual property of concrete 70BK0 versus temperature.
0.00
0.50
1.00
1.50
2.00
0 200 400 600 800
Temperature (°C)
Rel
ativ
e re
sidu
al
prop
erty
Elastic modulus (GPa)Strain (‰)Strength (MPa)
Figure 4.48 – Relative residual property of con-crete 70BK0 versus temperature.
0
20
40
60
80
100
0 200 400 600 800
Temperature (°C)
Hot
pro
pert
y
Elastic modulus (GPa)Strain (10‰)Strength (MPa)
Figure 4.49 – Hot property of concrete 70BK0 versus temperature.
0.00
0.50
1.00
1.50
2.00
0 200 400 600 800
Temperature (°C)
Rel
ativ
e ho
t pro
pert
y
Elastic modulus (GPa)Strain (‰)Strength (MPa)
Figure 4.50 – Relative hot property of concrete 70BK0 versus temperature.

37
5. ANALYSIS
5.1 Optimisation
5.1.1 Optimisation at LTH Since a great deal of the project was spent on the optimisation of the concrete it was important to analyse the reason for this. The optimisations at LTH were performed under the principles of a linear logarithmic distribution of the particles in the fresh concrete [85-88]. The mix proportions obtained at LTH more or less fulfilled the re-quirement of workability. The main problem was adding as much as 4 kg/m³ plastic fibres to the mix proportions, which works in the opposite direction to SCC, giving a very stiff mix. There-fore Japanese experience was taken into account by diminishing the maximum size of the aggre-gate from 16 mm to 11 mm [45-47]. Four kg/m³ of plastic fibres is comparable to 79 kg/m³ steel fibres accounting for the volume that the fibres occupy. The mix proportions with 4 kg/m³ ob-tained at LTH were later on used during the full-scale production of columns at SPAB [85-88].
5.1.2 Re-optimisation at LTH In principle, the main problem that initialised the re-optimisation at LTH was that it initially was not possible to adjust the amount of superplasti-ciser at SPAB in order to achieve a good worka-bility of the SCC. Very small faults of the amount of moisture in the gravel and aggregate or small changes of the particles distribution of the differ-ent materials may caused changes of the workabil-ity of SCC. Therefore it was suggested to perform control trial mixing of the different concretes be-fore the full-scale production at SPAB. Since this was not possible at SPAB the first half of 2001 the SCC was cast directly without adjusting the amount of superplasticiser. In the first half of 2001 it was not possible the restart the mixer at SPAB once it was stopped after mixing. The re-optimisation at LTH of the mixes was per-formed with the principle of gap-grading which increases the workability of the concrete but also the risk of blocking and segregation [89]. During the re-optimisation of the mix proportions the crushed aggregate between 8 and 11 mm was abandoned. The mix proportions obtained by Nordkalk and Svensk Glasåtervinning, SGÅ, at the re-optimisation at LTH more or less fulfilled the requirement of workability. The main problem was the risk of segregation according to the test with the segregation cylinder of following mixes: • 70AK0
• 70BK0 Another problem during the re-optimisation per-formed by Nordkalk and SGÅ, at LTH, was the risk of blocking according to the test with the L-box [82,84], of the following mix proportions: • 40AK4 • 55BK4 • 70BG0 • 70BK4 As mentioned above the mix proportions with 4 kg/m³ plastic fibre performed well at SPAB once the amount of superplasticiser was adjusted after-wards. However, the mix proportion 70 BG0 did not performed well during the fabrication of cyl-inders at LTH. The mixing had to be repeated twice before acceptable. The main reason was segregation of this mix proportions due to low content of cement + filler (only about 400 kg/m³ which was much less that 450 kg/m³ [48]).
5.1.3 Differences of mixes Analyses were performed on the differences of particle grading in fresh concrete of the different mixes. In [85] the following particle grading of fresh NC was foreseen, Figure 5.1, Appendix 5.1: s = a·db {0.125 < d < 0.7·dmax} (5.1) s denotes particle passing through a 38% b constant according to Table 5.1 d particle diameter (0.1 < d < 10 mm) K cube strength of concrete (MPa) Table 5.1 - Constant b in equation (5.1) K 25 60 90 120 150 b 0.32 0.24 0.20 0.18 0.16 Particle grading obtained at LTH is shown in Fig-ure 5.2, Appendix 5.2 [82]. NC followed more or less the grading foreseen in Figure 5.1, i.e. much less fines than in SCC. In Table 5.2 the particles distributions obtained at LTH are given following equation (5.1). For NC and sieves varying be-tween 0.063 mm and 16 mm a = 37% and b vary-ing between b = 0.24 (corresponds to K60) and b = 0.35 (K30) were obtained. For sieves varying between 0.063 mm and 16 mm and SCC without fibres a = 47% was obtained with b varying be-tween b = 0.24 (K60) and b = 0.27 (slightly more inclined, correspond to K30).

38
0
20
40
60
80
100
0.00
1
0.00
8
0.06
3
0.50
0
4.00
0
11.2
00Sieve width (mm)
Mat
eria
l pas
sing
(%)
K25 K60 K90K120 K150
Figure 5.1 – Ideal particle grading of fresh NC.
0.00
0.10
0.20
0.30
0.40
0.50
0.60
0.70
0.80
0.90
1.00
0.00
1
0.01
0
0.10
0
1.00
0
10.0
00
Sieve dimension (mm)
Mat
eria
l pas
sing
thro
ugh
40AG0 40AK0 40AK440BK0 40BR0 55BK055BK4 55BR0 70BG070BK0 70BK4 70BR0
Figure 5.2 – Particle grading obtained at LTH.
Table 5.2 - Particle grading obtained at LTH for sieves varying between 0.063 mm and 16 mm. Concrete a b 40AG0 49 0.24 40AK0 48 0.25 40AK4 55 0.24 40BK0 48 0.25 40BR0 37 0.24 55BK0 47 0.27 55BK4 54 0.25 55BR0 38 0.31 70BG0 47 0.26 70BK0 46 0.27 70BK4 56 0.27 70BR0 36 0.35 For sieves varying between 0.063 mm and 16 mm and SCC with 2 kg/m³ polypropylene fibres a = 48% was obtained with b varying between b = 0.23 (corresponds to K60) and b = 0.26 (slightly more inclined, correspond to K30).
0.00
0.10
0.20
0.30
0.40
0.50
0.60
0.70
0.80
0.90
1.00
0.00
1
0.01
0
0.10
0
1.00
0
10.0
00
Sieve dimension (mm)
Mat
eria
l pas
sing
thro
ugh
40AG0 40AK0 40AK240AK4 40BK0 55BK055BK2 55BK4 70BG070BK0 70BK2 70BK4
Figure 5.3 – Particle grading by SGÅ and Nord-kalk [84].

39
The conclusion was that much more fines were required in SCC than in NC, about 10% more particles less than 1 mm, i.e. about 220 kg/m³ more fines < 1 mm in SCC than in NC. For SCC corresponding to K60 the inclination of the distri-bution of the particles in the fresh concrete was more or less the same like in NC, b = 0.24, but for K30 less inclination of the grading curve was observed in SCC than in NC, i.e. the grading of the particles of NC was steeper for K30 made of NC than in a K30 made of SCC [82]. For SCC with 4% plastic fibres a = 55% and b varying between b = 0.24 (K60) and b = 0.27 (K30) was obtained. Japanese experience indicated a = 50% and b = 0.26, i.e. less fines and steeper grading [45-47]. Figure 5.3, Table 5.3 and Appendix 5.3 shows grading of particles of fresh concrete opti-mised by SGÅ and Nordkalk [84]. Table 5.3 - Particle grading obtained by Nordkalk for sieves between 0.063 mm and 16 mm [84]. Concrete a b 40AG0 45 0.25 40AK0 47 0.24 40AK2 49 0.23 40AK4 51 0.21 40BK0 47 0.24 55BK0 45 0.26 55BK2 48 0.24 55BK4 51 0.22 70BG0 43 0.29 70BK0 43 0.28 70BK2 46 0.26 70BK4 51 0.22 Good workability of SCC without fibre as opti-mised by SGÅ and Nordkalk was obtained with a ≈ 46% and b ≈ 0.24-0.26. Bad workability of SCC without fibre as optimised by SGÅ and Nordkalk was obtained with a ≈ 43% and b ≈ 0.28-0.28 (segregation; too little cement + filler and too steep grading; 70BG0 and 70 BK0). Bad worka-bility of SCC with 4% fibre as optimised by Nordkalk was obtained with a = 51% and b = 0.22 (blocking; too little cement + filler and too flat grading). Japanese experience indicated that a = 50% and b = 0.26 was needed in order to obtain good workability of SCC [45], i.e. much less steep grading than foreseen by Nordkalk [84].
5.1.4 Conclusions on particle grading The following consideration should be taken when constructing a grading curve for fresh SCC without fibre as described by equation (5.1): s = a·db {0.125 < d < 0.7·dmax} (5.1) s denotes particle passing through
d particle diameter (mm) • a = 47% • b = 0.27 (K30) • b = 0.24 (K60) With 2 kg/m³ polypropylene fibres the following constants in equation (5.1): • a = 48% • b = 0.26 (K30) • b = 0.23 (K60) With 4 kg/m³ fibres the following constants in equation (5.1): • a = 55% • b = 0.27 (K30) • b = 0.24 (K60) Little cement + filler in SCC gave a risk of segre-gation. i.e. low a-value in equation (5.1); too flat grading gave a risk of blocking for concrete with 4% fibres, i.e. too low b-value in equation (5.1).
5.2 Strength
5.2.1 Effect of fibres Figure 5.4 shows the effect of fibres on strength based on this limited investigation. The filler, aggregate and the cement content was change simultaneously when the fibres were added. Thus it is a combined effect shown in Figure 5.4. The following equation was evaluated: fc28ppf = fc280·(1-0.023·ppf) (5.2) ppf denotes amount of 32 µm polypropylene
fibre (0 < ppf <4 kg/m³) fc28ppf denotes 28-day strength (fibre, MPa) fc280 denotes 28-day strength (no fibre, 30 < fc280
< 60 MPa)
5.2.1 Effect of filler Figure 5.5 shows the effect of filler but also some effect of change of cement content based on this limited investigation. Adding filler was beneficial for strength. For concrete 40BK the amount of coarse aggregate was diminished from 1004 to 602 kg/m³, which explains the negative effect of filler observed. The effect of filler was evaluated: fc28f = fc280 + f·0.07 (5.3) f denotes limestone/glass filler (0<f<250 kg/m³) fc28f denotes 28-day strength with filler (MPa) fc280 denotes 28-day strength (no filler, 30 < fc280 < 60 MPa MPa)

40
y = -1.8x + 88.8
y = -3x + 76
y = -0.8x + 66.8
y = -0.8 krx + 51.2 kr
0
20
40
60
80
100
0 2 4Amount of fibres (kg/m³)
Stre
ngth
(MPa
)
LTH 40AK SPAB 40AKSPAB 55BK SPAB 70BK
Figure 5.4 - Effect of fibres on strength.
y = 0.0538x + 85y = 0.0806x + 75
y = 0.0872x + 75
y = -0.0538x + 75y = 0.0207x + 63
y = 0.0886x + 41y = 0.0794x + 41
0
20
40
60
80
100
0 100 200 300Amount of filler (kg/m³)
Stre
ngth
(MPa
)
LTH 40BK SPAB 40AGSPAB 40AK SPAB 40BKSPAB 55BK SPAB 70BGSPAB 70BK
Figure 5.5 - Effect of filler on strength.
The strength development before 28-day age was more dependent on the cement type than the con-tent of filler in the concrete. At w/c = 0.40 one-day strength was twice as large with Byggcement compared with Degerhamn Cement. A logarith-mic development of strength was evaluated. For Byggcement the following strength increase rate, δfc/δt, was obtained (MPa/day): δfc/δt = 9/t (5.4) and for Degerhamn cement: δfc/δt = 18/t (5.5) t denotes concrete age (2 < t < 28 days)
5.3 Unstressed properties
5.3.1 Residual properties at 20 °C Figures 5.6-8 and Appendix 5.4 show the residual properties of the concrete at 20 °C (residual elas-tic modulus, residual strength and residual strain at maximum strength). After heating to 800 °C the concrete with limestone powder did not exhibit any residual strength after cooling to 20 °C. Fig-ure 5.9-11 show the relative residual properties of the concrete at 20 °C (residual elastic modulus, residual strength and residual strain at maximum strength). Figure 5.12 shows the on average resid-ual properties of the concrete except for concrete with limestone powder at 800 °C.
0.00
0.50
1.00
1.50
2.00
2.50
3.00
0 200 400 600 800
Temperature (°C)
Res
idua
l pro
pert
y
E-modulusStrengthStrain at maxiumum strength
Figure 5.12 - Residual properties after cooling to 20 °C and RH = about 40% 1 week from elevated temperature except with limestone powder at 800 °C (= 0; one point = 16 measurements average).
5.3.2 Hot properties Figures 5.13-19 and Appendix 5.5 show the corre-sponding hot properties of the concrete at elevated temperatures. In this case strength still was ob-served at 800 °C even for concrete with limestone powder.

41
20 °
C
200
°C
400
°C
800
°C
40AG
040
AK0
40AK
240
AK4
40B
R0
55BK
070
BG0
70BK
0
0.00
5.00
10.00
15.00
20.00
25.00
30.00
35.00R
esid
ual e
last
ic m
odul
us
(GPa
)
Figure 5.6 – Residual elastic modulus at 20 °C.
20 °
C20
0 °C
400
°C
800
°C
40AG
0
40AK
0
40AK
2
40AK
4
40B
R0
55BK
0
70BG
0
70BK
0
0.00
10.00
20.00
30.00
40.00
50.00
60.00
70.00
80.00
Res
idua
l str
engt
h (M
Pa)
Figure 5.7 – Residual strength at 20 °C.
20 °
C
200
°C
400
°C
800
°C
40AG
040
AK0
40AK
240
AK4
40B
R0
55BK
070
BG0
70BK
0
0.00
2.00
4.00
6.00
8.00
10.00
12.00
Res
idua
l ulti
mat
e st
rain
(‰)
Figure 5.8 – Residual strain at maximum strength at 20 °C.

42
20 °
C20
0 °C
400
°C
800
°C
40AG
040
AK0
40AK
240
AK4
40B
R0
55BK
070
BG0
70BK
0
0.00
0.20
0.40
0.60
0.80
1.00
Res
idua
l rel
ativ
e el
astic
m
odul
us
Figure 5.9 – Residual relative elastic modulus at 20 °C (= 0 at 800 °C for concrete with limestone powder).
20 °
C
200
°C
400
°C
800
°C
40AG
040
AK0
40AK
240
AK4
40B
R0
55BK
070
BG0
70BK
0
0.00
0.20
0.40
0.60
0.80
1.00
1.20
Res
idua
lrela
tive
stre
ngth
Figure 5.10 – Residual relative strength at 20 °C (= 0 at 800 °C for concrete with limestone powder).
20 °
C
200
°C
400
°C
800
°C
40AG
040
AK0
40AK
240
AK4
40B
R0
55BK
070
BG0
70BK
0
0.00
0.50
1.00
1.50
2.00
2.50
3.00
3.50
Res
idua
l rel
ativ
e ul
timat
e st
rain
Figure 5.11 – Residual relative strain at maximum strength at 20 °C (= 0 at 800 °C for concrete with lime-stone powder).

43
20 °
C
200
°C
400
°C
800
°C
40AG
040
AK0
40AK
240
AK4
40BR
055
BK0
70BG
070
BK0
0.00
5.00
10.00
15.00
20.00
25.00
30.00
35.00
Hot
ela
stic
mod
ulus
(GPa
)
Figure 5.13 – Hot elastic modulus at 20 °C.
20 °
C20
0 °C
400
°C
800
°C
40AG
0
40AK
0
40AK
2
40AK
4
40B
R0
55BK
0
70BG
0
70BK
0
0.00
10.00
20.00
30.00
40.00
50.00
60.00
70.00
80.00
Hot
str
engt
h (M
Pa)
Figure 5.14 – Hot strength at 20 °C.
20 °
C
200
°C
400
°C
800
°C
40AG
040
AK0
40AK
240
AK4
40B
R0
55BK
070
BG0
70BK
0
0.00
2.00
4.00
6.00
8.00
10.00
12.00
Hot
ulti
mat
e st
rain
(‰)
Figure 5.15 – Hot strain at maximum strength at 20 °C.

44
20 °
C20
0 °C
400
°C
800
°C
40AG
040
AK0
40AK
240
AK4
40B
R0
55BK
070
BG0
70BK
0
0.00
0.20
0.40
0.60
0.80
1.00
Hot
rela
tive
elas
tic
mod
ulus
Figure 5.16 – Hot relative elastic modulus at 20 °C.
20 °
C
200
°C
400
°C
800
°C
40AG
040
AK0
40AK
240
AK4
40B
R0
55BK
070
BG0
70BK
0
0.00
0.20
0.40
0.60
0.80
1.00
1.20
Hot
rela
tive
stre
ngth
Figure 5.17 – Hot relative strength at 20 °C.
20 °
C
200
°C
400
°C
800
°C
40AG
040
AK0
40AK
240
AK4
40B
R0
55BK
070
BG0
70BK
0
0.00
0.50
1.00
1.50
2.00
2.50
3.00
3.50
Hot
rela
tive
ultim
ate
stra
in
Figure 5.18 – Hot relative strain at maximum strength at 20 °C.
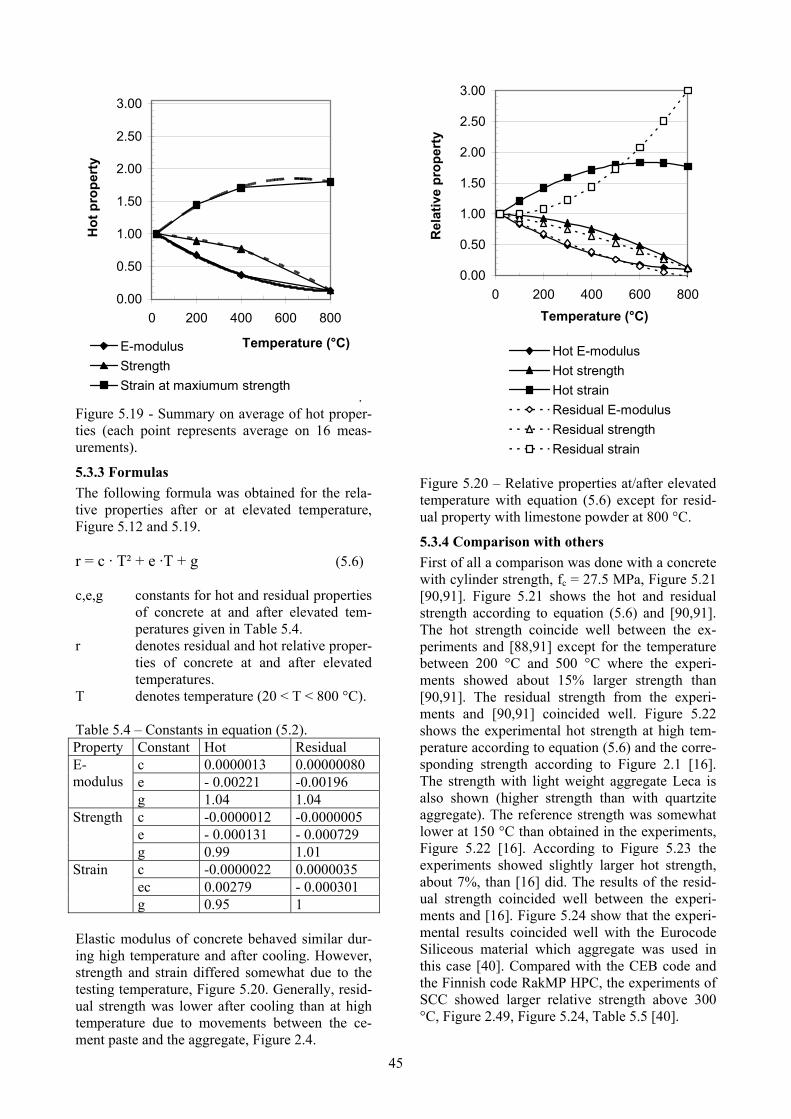
45
0.00
0.50
1.00
1.50
2.00
2.50
3.00
0 200 400 600 800
Temperature (°C)
Hot
pro
pert
y
E-modulusStrengthStrain at maxiumum strength
. Figure 5.19 - Summary on average of hot proper-ties (each point represents average on 16 meas-urements).
5.3.3 Formulas The following formula was obtained for the rela-tive properties after or at elevated temperature, Figure 5.12 and 5.19. r = c · T² + e ·T + g (5.6) c,e,g constants for hot and residual properties
of concrete at and after elevated tem-peratures given in Table 5.4.
r denotes residual and hot relative proper-ties of concrete at and after elevated temperatures.
T denotes temperature (20 < T < 800 °C). Table 5.4 – Constants in equation (5.2). Property Constant Hot Residual
c 0.0000013 0.00000080 e - 0.00221 -0.00196
E-modulus
g 1.04 1.04 c -0.0000012 -0.0000005 e - 0.000131 - 0.000729
Strength
g 0.99 1.01 c -0.0000022 0.0000035 ec 0.00279 - 0.000301
Strain
g 0.95 1 Elastic modulus of concrete behaved similar dur-ing high temperature and after cooling. However, strength and strain differed somewhat due to the testing temperature, Figure 5.20. Generally, resid-ual strength was lower after cooling than at high temperature due to movements between the ce-ment paste and the aggregate, Figure 2.4.
0.00
0.50
1.00
1.50
2.00
2.50
3.00
0 200 400 600 800Temperature (°C)
Rel
ativ
e pr
oper
ty
Hot E-modulusHot strengthHot strainResidual E-modulusResidual strengthResidual strain
Figure 5.20 – Relative properties at/after elevated temperature with equation (5.6) except for resid-ual property with limestone powder at 800 °C.
5.3.4 Comparison with others First of all a comparison was done with a concrete with cylinder strength, fc = 27.5 MPa, Figure 5.21 [90,91]. Figure 5.21 shows the hot and residual strength according to equation (5.6) and [90,91]. The hot strength coincide well between the ex-periments and [88,91] except for the temperature between 200 °C and 500 °C where the experi-ments showed about 15% larger strength than [90,91]. The residual strength from the experi-ments and [90,91] coincided well. Figure 5.22 shows the experimental hot strength at high tem-perature according to equation (5.6) and the corre-sponding strength according to Figure 2.1 [16]. The strength with light weight aggregate Leca is also shown (higher strength than with quartzite aggregate). The reference strength was somewhat lower at 150 °C than obtained in the experiments, Figure 5.22 [16]. According to Figure 5.23 the experiments showed slightly larger hot strength, about 7%, than [16] did. The results of the resid-ual strength coincided well between the experi-ments and [16]. Figure 5.24 show that the experi-mental results coincided well with the Eurocode Siliceous material which aggregate was used in this case [40]. Compared with the CEB code and the Finnish code RakMP HPC, the experiments of SCC showed larger relative strength above 300 °C, Figure 2.49, Figure 5.24, Table 5.5 [40].

46
0.00
0.20
0.40
0.60
0.80
1.00
0 200 400 600 800
Temperature (°C)
Rel
ativ
e st
reng
th
Hot strengthHot [90,91]Residual strengthResidual [90,91]
Figure 5.21 - Hot and residual strength according to equation (5.6) and [90,91].
0.00
0.20
0.40
0.60
0.80
1.00
1.20
0 200 400 600 800
Temperature (°C)
Rel
ativ
e st
reng
th
Hot strengthHot Leca [16]Hot quartz [16]
Figure 5.22 - Hot strength according to equation (5.6) and corresponding strength, Figure 2.1 [16].
0.00
0.20
0.40
0.60
0.80
1.00
0 200 400 600 800
Temperature (°C)
Rel
ativ
e st
reng
th
Hot strengthRegression heated [16]Regression-20 °C [16]Residual strength
Figure 5.23 - Hot and residual strength according to experiments and figure 2.11 [16].
0.00
0.20
0.40
0.60
0.80
1.00
0 200 400 600 800
Temperature (°C)
Rel
ativ
e st
reng
th
Hot strengthCEB [40]Eurocode Siliceous [40]RakMK HPC [40]
Figure 5.24 - Hot strength (64 specimens), CEB, Eurocode Siliceous and RakMP HPC code [40].

47
At 180 °C CEB showed about 5% larger relative strength than the experimental results on 16 specimens indicated but the RakMP HPC code, on the other hand about 20% lower relative strength [40]. The present study showed half the elastic modulus at 500 °C compared with [40], Figure 5.25. Table 5.5 – Comparison of hot strength (in all 64 specimens), CEB and RakMP HPC code [40]. Temperature (°C) CEB RakMK HPC 20 0.00 0.00 150 -0.05 0.20 180 -0.06 0.19 320 0.04 0.09 340 0.07 0.07 400 0.11 0.08 600 0.16 0.14 800 0.13 0.13 Average 0.05 0.11
0.00
0.20
0.40
0.60
0.80
1.00
0 200 400 600 800
Temperature (°C)
Rel
ativ
e el
astic
mod
ulus
Residual HPC [40]NC [40]
Figure 5.25 – E-modulus compared with [38].
5.4 Elastic modulus
5.4.1 Dynamic elastic modulus Before each stress/strain tests, the dynamic elastic modulus, Edyn, was established by measurements of the fundamental resonance frequency, FRF, in the 100 mm cylinders, 200 mm in length. A non-destructive testing method of the elastic modulus was of great interest for the purpose of studying damage in the concrete that was related to possi-
ble interior detriment due to, for example, heating. Edyn, of SCC was detected by the FRF. A vibration was applied to the centre of the SCC specimen and FRF obtained at one end of the specimen. The evaluation of Edyn was dependent on the weight, the shape of the specimen, RH and on Poisson’s ratio. Xu studied Edyn on prisms of cement mortar stored at different ambient RH and supposed to be equal to the internal RH [92]. A large dependence of RH on Edyn was found to exist [25,92]. Between RH = 0.40 and RH = 0.95 Edyn rose from 30 to around 36 GPa, i.e. ≈ 20%. It was the objective of the studies of Edyn to compare the results with the static modulus of elasticity (at loading in the stress/strain tests), Estat, of the SCC specimens. It was also the aim of the studies to correlate the influence of moisture on the measured Edyn.
5.4.2 Evaluation of dynamic elastic modulus Right before the stress/strain tests of the very same specimen was tested related to Edyn. Sup-plementary tests were also performed. During test conditions according to Section 3 applied. The following testing procedure was used: • Weight and shape were measured. • FRF was detected by a pickup applied to the
centre at one side of the concrete specimen. • The driver (vibrator) was placed at one side of
one end of the specimen. • RH measured on fragment (parallel specimen) • Calibration of RH devices according to [26]. • Edyn was taken within ½ h of the stress/strain. • Poisson’s ratio, υ, was assumed to be υ=1/6. The evaluation of Edyn was carried out according to ASTM C 215-85 [93]: Edyn = 0.00416·(L3·T/d4)·W·n2 (5.7) D denotes the diameter of the specimen (in.) n denotes FRF (Hz) K ratio of gyration (=d/4 for cylinder) L denotes the length (in.) T = 1.09 for υ=1/6 and K/L=0.125
[=100/(4·200] W denotes the weight of the specimen (lb.) A simplification was done of equation (5.7, GPa): Edyn = 2.14·10-6 G·n2 (5.8) G denotes the weight (kg)
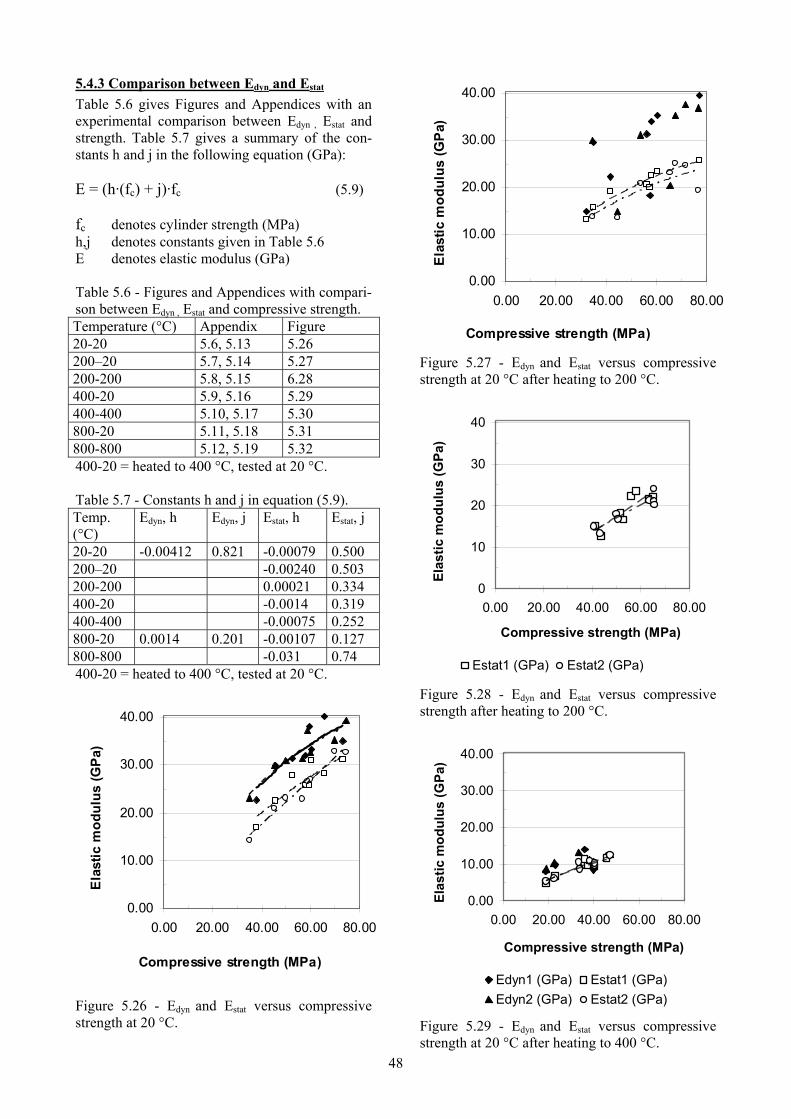
48
5.4.3 Comparison between Edyn and Estat
Table 5.6 gives Figures and Appendices with an experimental comparison between Edyn , Estat and strength. Table 5.7 gives a summary of the con-stants h and j in the following equation (GPa): E = (h·(fc) + j)·fc (5.9) fc denotes cylinder strength (MPa) h,j denotes constants given in Table 5.6 E denotes elastic modulus (GPa) Table 5.6 - Figures and Appendices with compari-son between Edyn , Estat and compressive strength. Temperature (°C) Appendix Figure 20-20 5.6, 5.13 5.26 200–20 5.7, 5.14 5.27 200-200 5.8, 5.15 6.28 400-20 5.9, 5.16 5.29 400-400 5.10, 5.17 5.30 800-20 5.11, 5.18 5.31 800-800 5.12, 5.19 5.32 400-20 = heated to 400 °C, tested at 20 °C. Table 5.7 - Constants h and j in equation (5.9). Temp. (°C)
Edyn, h Edyn, j Estat, h Estat, j
20-20 -0.00412 0.821 -0.00079 0.500 200–20 -0.00240 0.503 200-200 0.00021 0.334 400-20 -0.0014 0.319 400-400 -0.00075 0.252 800-20 0.0014 0.201 -0.00107 0.127 800-800 -0.031 0.74 400-20 = heated to 400 °C, tested at 20 °C.
0.00
10.00
20.00
30.00
40.00
0.00 20.00 40.00 60.00 80.00
Compressive strength (MPa)
Ela
stic
mod
ulus
(GPa
)
Figure 5.26 - Edyn and Estat versus compressive strength at 20 °C.
0.00
10.00
20.00
30.00
40.00
0.00 20.00 40.00 60.00 80.00
Compressive strength (MPa)
Ela
stic
mod
ulus
(GP
a)
Figure 5.27 - Edyn and Estat versus compressive strength at 20 °C after heating to 200 °C.
0
10
20
30
40
0.00 20.00 40.00 60.00 80.00
Compressive strength (MPa)
Elas
tic m
odul
us (G
Pa)
Estat1 (GPa) Estat2 (GPa)
Figure 5.28 - Edyn and Estat versus compressive strength after heating to 200 °C.
0.00
10.00
20.00
30.00
40.00
0.00 20.00 40.00 60.00 80.00
Compressive strength (MPa)
Elas
tic m
odul
us (G
Pa)
Edyn1 (GPa) Estat1 (GPa)Edyn2 (GPa) Estat2 (GPa)
Figure 5.29 - Edyn and Estat versus compressive strength at 20 °C after heating to 400 °C.

49
0
10
20
30
40
0.00 20.00 40.00 60.00 80.00Compressive strength (MPa)
Elas
tic m
odul
us (G
Pa)
Estat1 (GPa) Estat2 (GPa)
Figure 5.30 - Edyn and Estat versus compressive strength after heating to 400 °C.
0.00
10.00
20.00
30.00
40.00
0.00 20.00 40.00 60.00 80.00Compressive strength (MPa)
Elas
tic m
odul
us (G
Pa)
Edyn1 (GPa) Estat1 (GPa)Edyn2 (GPa) Estat2 (GPa)
Figure 5.31 - Edyn and Estat versus compressive strength at 20 °C after heating to 800 °C.
0
10
20
30
40
0.00 20.00 40.00 60.00 80.00
Compressive strength (MPa)
Elas
tic m
odul
us
(GPa
)
Estat1 (GPa)Estat2 (GPa)Poly. (Estat1 (GPa))Poly. (Estat2 (GPa))
Figure 5.32 - Edyn and Estat versus compressive strength after heating to 800 °C.
5.4.4 Elastic moduli, Edyn and Estat Based on the experimental results given in Tables 5.6-5.7 the following formulas were obtained on the elastic modulus, E, Figure 5.33-5.35 (GPa): Edyn = ((0.0000071·T-0.00426)·(fc) + (-0.00079·T+0.837))·(fc) (5.10) Estat,hot =((-0.0000000916·(T)² + 0.0000374·T - 0.00211)·(fc)+(0.00000232·(T)² - 0.00161·T + 0.540))·fc (5.11) Estat,residual =(-0.00152·(fc) + (-0.000263·T+0.507))·(fc) (5.12) fc denotes cylinder strength (5 < fc < 60 MPa)
0
10
20
30
40
0 20 40 60 80
Cylinder strength (MPa)
Hot
ela
stic
mod
ulus
(GPa
)
Edyn20 °C Estat20 °CEstat200 °C Estat400 °CEstat800 °C
Figure 5.33 – Hot elastic modulus at different temperatures versus cylinder strength.
0
10
20
30
40
0 20 40 60 80
Cylinder strength (MPa)
Res
idua
l dyn
amic
ela
stic
m
odul
us (G
Pa)
Edyn20 °C Edyn800 °C
Figure 5.34 – Dynamic modulus at 20 °C and dynamic elastic modulus at 20 °C after heating to 800 °C versus cylinder strength.

50
0
10
20
30
40
0 20 40 60 80Cylinder strength (MPa)
Res
idua
l ela
stic
mod
ulus
(MPa
)
Edyn20 °C Estat20 °CEstat200 °C Estat400 °CEstat800 °C
Figure 5.35 – Dynamic and static elastic modulus at 20 °C after heating versus cylinder strength.
5.5 Moisture losses at heating In Figure 5.36 and Appendix 5.20 the moisture losses of different concretes are compared to [40,94]. The reference concrete, BR0, and con-crete with high w/c normally give the smallest weight losses at 400 °C since these concrete con-tains a larger amount of aggregate. However, at 800 °C all weight was lost of limestone filler con-crete AK and BK since the specimen showed no strength after cooling, Figure 5.36. At 800 °C about 94% of the initial weight remains of the reference concrete 40BR0 and of the glass filler concrete 70BG0 due to large aggregate content.
5.6 Comparison of RH in columns and cylin-ders Figure 5.37 and Appendix 5.21 show RH at 20 °C before heating, both of columns, 200 x 200 mm and 2 m long, cast of the same concrete like in the experiments with cylinders and of cylinders [94]. A comparison showed that RH of water-cured columns was somewhat smaller than that of cylin-ders which is a size effect and explained by the effect of self-desiccation. In larger specimen (col-umns 200 x 200 mm) the effect of self-desiccation is more pronounced than in a cylinder 100 mm in diameter. On the other hand air-cured cylinders showed lower RH than the columns, even after ½ a years, Figure 5.37
0.90
0.92
0.94
0.96
0.98
1.00
0 200 400 600 800
Temperature (°C)
Rel
ativ
e w
eigh
t of c
ylin
ders
at 2
0 °C
HPC [40] NC [40] 40AG040AK0 40AK2 40AK440BR0 55BK0 70BG070BK0
Figure 5.36 - Moisture losses [40,94].
5.7 Spalling of cylinders at slow heating Even at slow heating rate, 240 °C/h., a small, wa-ter-cured specimen, cylinders 100 mm in diame-ter, showed explosive spalling. The following conditions were observed at the time of spalling: External temperature: 350 °C Internal temperature: 185 °C Heating rate 240 °C/h It was great interest to compare the conditions at explosive spalling of the cylinder with previous studies, Figure 2.43, also cylinders 100 mm in diameter [40]. The following values were calcu-lated for the present cylinders: Temperature gradient: 3300 °C/m Temperature rate: 4 °C/min.= 360 °C/h Gradient-rate ratio: 825 min/m However, the values of the present exploding cylinder and the previous studies did not coincide probably since different concrete were used. Any-how the heating rate exceeded 120-180 °C/h in the present experiments with probably was the critical parameter in this case [79].

51
Col
umn
Cyl
inde
r 1
Cyl
inde
r 2
Cyl
inde
rs
40AG040AK0
40AK240AR0
40BK040BR0
55BK055BR0
70BG070BK0
70BR060.0
70.0
80.0
90.0
100.0
RH (%
)
Conc
rete
Figure 5.37 - RH at 20 °C before heating, of columns, 200 x 200 mm [95] and of cylinders, 100 mm in di-ameter.

52
6. TEST SIGNIFICANCES AND SOURCES OF ERROR
6.1 Sources of error The following sources of error may be identified:
• Weighing faults at fabrication of concrete • Moisture differences of aggregate • Curing faults • Variance in loading rate at testing • Equipment faults at testing • Exchange of specimens • Age of specimens • Temperature measurements and changes
6.2 Test significance The moisture of the aggregate was taken daily before mixing in order to avoid any difference of water added to the mix proportions. The weight of the materials in the mix proportions was double checked and sometime checked three times before the mixing took place (in the field test the weight was measured automatically by computer). The concrete was possible to mix within a w/c-fault of ± 0.002, i.e. a fault of about ± 2 MPa. The varia-tion of RH during curing was measured continu-ously and measured to be ± 3% RH. In the field tests the ambient RH was used which probably gave a larger in RH than in the laboratory. Figures 6.1-3, Table 6.1 and Appendix 6 show the test significance of repeated laboratory tests at LTH, in all three tests. The test results of the strength and of elastic modulus at high temperature in the oven at LTH showed good test significance while the test significance of the strain tests was lower (however, less than 10% variance). Table 6.1 – Test significance of repeated labora-tory tests at LTH, in all three tests. Test/Concrete Elastic modulus (GPa) Std Average Varians (%) 40BR0-200-200 0.87 20.46 4.2770BG0-200-200 0.45 12.74 3.5170BK0-200-200 2.51 19.19 13.05Strain (per mil) Std Average Varians (%) 40BR0-200-200 0.52 5.41 9.5970BG0-200-200 0.51 6.25 8.1270BK0-200-200 0.25 4.86 5.05Strength (MPa) Std Average Varians (%) 40BR0-200-200 1.61 65.21 2.4870BG0-200-200 0.20 43.33 0.4670BK0-200-200 1.11 51.88 2.13
10.00
15.00
20.00
25.00
40BR0-200-200
70BG0-200-200
70BK0-200-200
Concrete
Elas
tic m
oulu
s (G
Pa)
1 2 3
Figure 6.1 – Test significance of elastic modulus.
4.00
5.00
6.00
7.00
40BR0-200-200
70BG0-200-200
70BK0-200-200
Concrete
Stra
in a
t max
imum
str
engt
h (‰
)
1 2 3
Figure 6.2 – Test significance of strain (‰).
40.00
50.00
60.00
70.00
40BR0-200-200
70BG0-200-200
70BK0-200-200
Concrete
Stre
ngth
(MPa
))
1 2 3
Figure 6.3 – Test significance of strength (MPa).

53
7. SUPPLEMENTARY TESTS
7.1 General Concrete with lime stone powder showed no strength after cooling from 800 °C. Therefore it was of great interest to measure the properties after heating to 600 °C using precisely the same method like on tests at other temperatures. The objective of the Supplementary tests was to obtain residual elastic modulus, residual strength and residual strain at ultimate strength. It was also of great interest to measure the porosity and the re-sistance to water penetration of the concrete since it affected the strength, elastic modulus and also the risk of fire spalling. The objectives of the Supplementary tests were also to obtain the capil-lary porosity and the resistance to water penetra-tion of the concrete. The size of the specimen was circular disc 100 mm in diameter and 20 mm in thickness. The test were performed with specimen treated with either at 105 °C, 200 °C, 400 °C or 600 °C. After the heating the concrete was cooled in an exsiccator with drying compound, blue gel, about 10% RH. The following tests were per-formed: • Residual elastic modulus after 600 °C. • Residual strength after 600 °C. • Residual strain at maximum strength after
heating to 600 °C. • Capillary porosity. • Resistance to water penetration at suction.
7.2 Residual elastic modulus strength at 600 °C The same procedure as described in Chapter 3 above applied. The concrete was slowly heated at 600 °C (the precise temperature of the concrete varied between 595 and 625 °C dependent on the location in the oven). After heating the specimen were cooling for 1 week in the laboratory air at about RH = 30%. The stress/strain properties were then obtained. Appendix 7.1-8 show the results of the tests after heating to 600 °C. Figure 7.1-22 give a Supplementary view of the residual proper-ties after heating to 600 °C. For concrete without limestone powder the equations given in Chapter 5 still apply. For limestone powder concrete new formulas for residual properties were estimated, Figure 7.23, Table 7.1: r = c · T² + e ·T + g (7.1) c,e,g constants for residual properties at and after
elevated temperatures given in Table 7.1. r denotes residual relative properties of con-
crete at and after elevated temperatures. T denotes temperature (°C).
Table 7.1 – Constants in equation (7.1). Residual property
Con-stant
Without lime-stone powder
Limestone powder
c 0.0000013 0.000000994 e - 0.00221 -0.00215
E-modulus
g 1.04 1.09 c -0.000000349 -0.000000349 e - 0.000131 - 0.00094
Strength
g 0.99 1.07 c -0.0000022 0.00000333 e 0.00279 - 0.000142
Strain
g 0.95 1.04 The residual elastic modulus and the residual strength were lower of concrete with limestone powder than without the mineral additive. How-ever, the strain at ultimate strength was somewhat larger, Figure 7.17-22.
0
20
40
60
80
100
0 200 400 600 800
Temperature (°C)
Res
idua
l pro
pert
y
Elastic modulus (GPa)Strain (‰)Strength (MPa)
Figure 7.1 – Residual properties of concrete 40 AG0 after cooling 1 week at 20 °C and RH = 30%.
0
1
2
3
4
0 200 400 600 800
Temperature (°C)
Rel
ativ
e re
sidu
al
prop
erty
Elastic modulus (GPa)Strain (‰)Strength (MPa)
Figure 7.2 – Relative residual properties of con-crete 40 AG0 after cooling 1 week at 20 °C and RH = 30%.
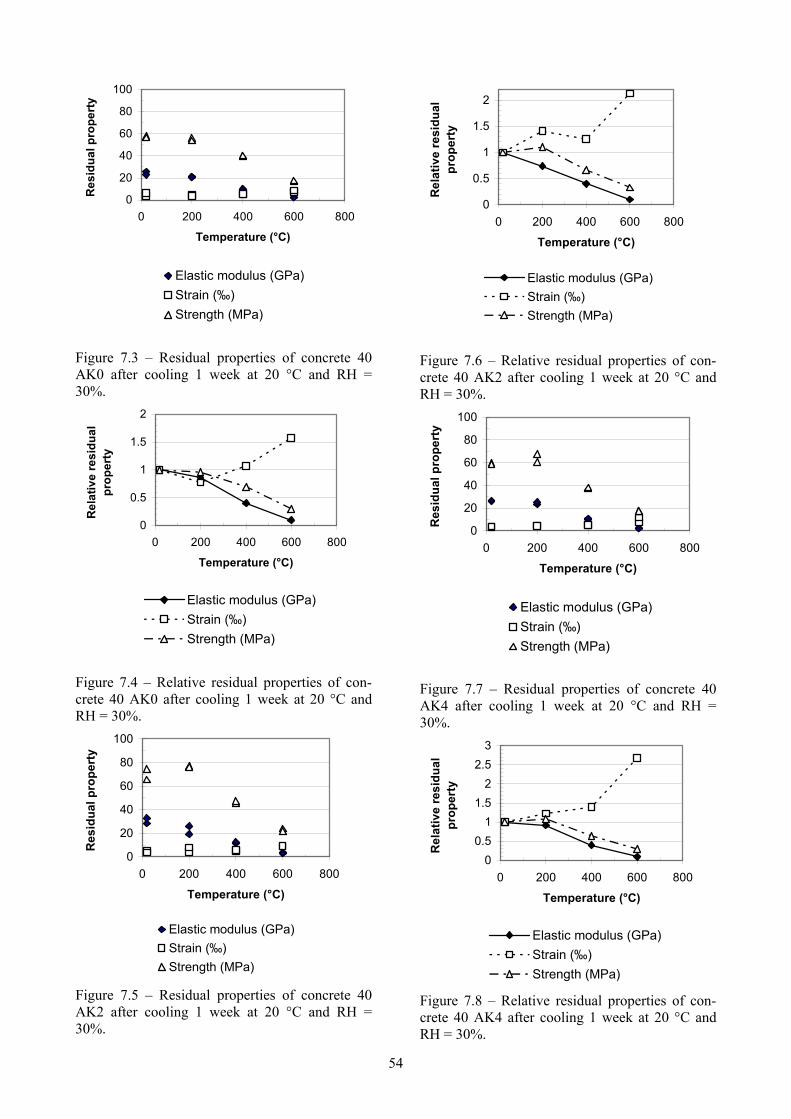
54
0
20
40
60
80
100
0 200 400 600 800
Temperature (°C)
Res
idua
l pro
pert
y
Elastic modulus (GPa)Strain (‰)Strength (MPa)
Figure 7.3 – Residual properties of concrete 40 AK0 after cooling 1 week at 20 °C and RH = 30%.
0
0.5
1
1.5
2
0 200 400 600 800
Temperature (°C)
Rel
ativ
e re
sidu
al
prop
erty
Elastic modulus (GPa)Strain (‰)Strength (MPa)
Figure 7.4 – Relative residual properties of con-crete 40 AK0 after cooling 1 week at 20 °C and RH = 30%.
0
20
40
60
80
100
0 200 400 600 800
Temperature (°C)
Res
idua
l pro
pert
y
Elastic modulus (GPa)Strain (‰)Strength (MPa)
Figure 7.5 – Residual properties of concrete 40 AK2 after cooling 1 week at 20 °C and RH = 30%.
0
0.5
1
1.5
2
0 200 400 600 800
Temperature (°C)
Rel
ativ
e re
sidu
al
prop
erty
Elastic modulus (GPa)Strain (‰)Strength (MPa)
Figure 7.6 – Relative residual properties of con-crete 40 AK2 after cooling 1 week at 20 °C and RH = 30%.
0
20
40
60
80
100
0 200 400 600 800
Temperature (°C)
Res
idua
l pro
pert
y
Elastic modulus (GPa)Strain (‰)Strength (MPa)
Figure 7.7 – Residual properties of concrete 40 AK4 after cooling 1 week at 20 °C and RH = 30%.
00.5
11.5
22.5
3
0 200 400 600 800
Temperature (°C)
Rel
ativ
e re
sidu
al
prop
erty
Elastic modulus (GPa)Strain (‰)Strength (MPa)
Figure 7.8 – Relative residual properties of con-crete 40 AK4 after cooling 1 week at 20 °C and RH = 30%.
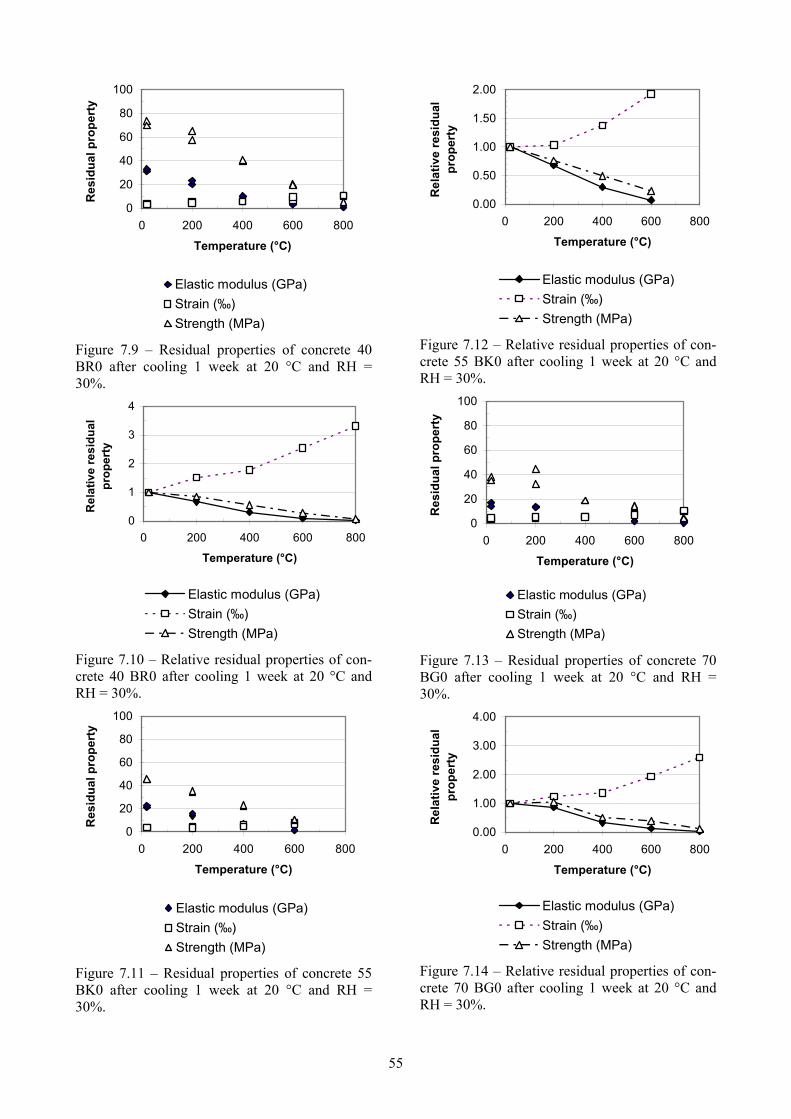
55
0
20
40
60
80
100
0 200 400 600 800
Temperature (°C)
Res
idua
l pro
pert
y
Elastic modulus (GPa)Strain (‰)Strength (MPa)
Figure 7.9 – Residual properties of concrete 40 BR0 after cooling 1 week at 20 °C and RH = 30%.
0
1
2
3
4
0 200 400 600 800
Temperature (°C)
Rel
ativ
e re
sidu
al
prop
erty
Elastic modulus (GPa)Strain (‰)Strength (MPa)
Figure 7.10 – Relative residual properties of con-crete 40 BR0 after cooling 1 week at 20 °C and RH = 30%.
0
20
40
60
80
100
0 200 400 600 800
Temperature (°C)
Res
idua
l pro
pert
y
Elastic modulus (GPa)Strain (‰)Strength (MPa)
Figure 7.11 – Residual properties of concrete 55 BK0 after cooling 1 week at 20 °C and RH = 30%.
0.00
0.50
1.00
1.50
2.00
0 200 400 600 800
Temperature (°C)
Rel
ativ
e re
sidu
al
prop
erty
Elastic modulus (GPa)Strain (‰)Strength (MPa)
Figure 7.12 – Relative residual properties of con-crete 55 BK0 after cooling 1 week at 20 °C and RH = 30%.
0
20
40
60
80
100
0 200 400 600 800
Temperature (°C)
Res
idua
l pro
pert
y
Elastic modulus (GPa)Strain (‰)Strength (MPa)
Figure 7.13 – Residual properties of concrete 70 BG0 after cooling 1 week at 20 °C and RH = 30%.
0.00
1.00
2.00
3.00
4.00
0 200 400 600 800
Temperature (°C)
Rel
ativ
e re
sidu
al
prop
erty
Elastic modulus (GPa)Strain (‰)Strength (MPa)
Figure 7.14 – Relative residual properties of con-crete 70 BG0 after cooling 1 week at 20 °C and RH = 30%.

56
20 °
C20
0 °C
400
°C
600
°C
800
°C
40AG
040
AK0
40AK
240
AK4
40B
R0
55BK
070
BG0
70BK
00.00
5.00
10.00
15.00
20.00
25.00
30.00
35.00
Res
idua
l ela
stic
mod
ulus
(G
Pa)
Figure 7.17 – Residual elastic modulus at 20 °C.
20 °
C
200
°C
400
°C
600
°C
800
°C
40AG
040
AK0
40AK
240
AK4
40B
R0
55BK
070
BG0
70BK
00.00
10.00
20.00
30.00
40.00
50.00
60.00
70.00
80.00
Res
idua
l str
engt
h (M
Pa)
Figure 7.18 – Residual strength at 20 °C.
20 °
C
200
°C
400
°C
600
°C
800
°C
40AG
040
AK0
40AK
240
AK4
40B
R0
55BK
070
BG0
70BK
0
0.00
2.00
4.00
6.00
8.00
10.00
12.00
Res
idua
l ulti
mat
e st
rain
(‰)
Figure 7.19 – Residual strain at maximum strength at 20 °C.

57
20 °
C20
0 °C
400
°C
600
°C
800
°C
40AG
040
AK0
40AK
240
AK4
40B
R0
55BK
070
BG0
70BK
0
0.00
0.20
0.40
0.60
0.80
1.00
Res
idua
l rel
ativ
e el
astic
m
odul
us
Figure 7.20 – Residual relative elastic modulus at 20 °C (= 0 at 800 °C for concrete with limestone powder).
20 °
C
200
°C
400
°C
600
°C
800
°C
40AG
0
40AK
040
AK2
40AK
440
BR
055
BK0
70BG
070
BK0
0.00
0.20
0.40
0.60
0.80
1.00
1.20
Res
idua
lrela
tive
stre
ngth
Figure 7.21 – Residual relative strength at 20 °C (= 0 at 800 °C for concrete with limestone powder).
20°C
200°C
400°C
600°C
800°C
40AG
040
AK0
40AK
240
AK4
40BR
055
BK0
70BG
070
BK0
0.00
0.50
1.00
1.50
2.00
2.50
3.00
3.50
Res
idua
l rel
ativ
e ul
timat
e st
rain
Figure 7.22 – Residual relative strain at maximum strength at 20 °C.

58
0
20
40
60
80
100
0 200 400 600 800
Temperature (°C)
Res
idua
l pro
pert
y
Elastic modulus (GPa)Strain (‰)Strength (MPa)
Figure 7.15 – Residual properties of concrete 70 BK0 after cooling 1 week at 20 °C and RH = 30%.
0.00
0.50
1.00
1.50
2.00
0 200 400 600 800
Temperature (°C)
Rel
ativ
e re
sidu
al
prop
erty
Elastic modulus (GPa)Strain (‰)Strength (MPa)
Figure 7.16 – Relative residual properties of con-crete 70 BK0 after cooling 1 week at 20 °C and RH = 30%.
0.00
0.50
1.00
1.50
2.00
2.50
3.00
0 200 400 600 800
Temperature (°C)
Res
idua
l pro
pert
y
E-modulusStrengthStrain at maxiumum strength
Figure 7.23 - Relative residual properties of SCC with limestone powder versus temperature.
The reason for the different behaviour of concrete with and without limestone powder is probably the variation of the aggregate content. In concrete with limestone powder a great deal of the aggre-gate is replaced by limestone powder which ab-sorbs water from the air during cooling. The ab-sorption of water leads to expansion of the lime-stone powder during the cooling phase, which is not the case for the aggregate. A comparison was also performed between the elastic modulus and the strength of the concrete, Figure 7.24. From Figure 7.24 the following equation for the elastic modulus at 20 ° after heating to 600 °C, was esti-mated, E600-20: E600-20 = (0.0025·(fc) + 0.0994)·fc (7.2) fc denotes cylinder strength (5 < fc < 25
MPa)
0.00
10.00
20.00
30.00
40.00
0.00 20.00 40.00 60.00 80.00
Compressive strength (MPa)
Elas
tic m
odul
us (G
Pa)
Estat1 Estat2
Figure 7.24 – Elastic modulus versus compressive strength at 20 °C after heating to 600 °C and cool-ing for 1 week in RH = 30%.
7.2 Porosity at water suction The specimen size was 100 mm in diameter and 20 mm in thickness, three of each concrete. Poros-ity at water suction was measured. In the Supple-mentary test series the weight of the concrete was first taken at 20 °C. Then the concrete was heated to 105 °C for 1 week. After this heating the con-crete was weighed again and further heated to either 105 °C, 200 °C, 400 °C or 600 °C. The concrete was then cooled to 20 °C in an exsiccator and weighed again. Then the concrete was vac-uum treated for 24 h. Water was then immersed a vacuum tank and fully penetrating the concrete. The weight was then taken again at 20 °C, both in the air and under water by the wire method. Table 7.3 and Figures 7.25-26 give results of the capil-lary porosity of the concrete. The concrete capil-lary porosity was calculated according the follow-ing formula [95]:

59
0.10 0.15 0.20 0.25
40AG0
40AK0
40AK2
40AK4
40BR0
55BK0
70BG0
70BK0
Capillay porosity after heating
100 °C 200 °C 400 °C 600 °C
Figure 7.25 - Results of the capillary porosity at water suction of the concrete.
0.10
0.15
0.20
0.25
0 200 400 600
Temperature (°C)
Cap
illar
y po
rosi
ty a
fter h
eatin
g
40AG0 40AK0 40AK240AK4 40BR0 55BK070BG0 70BK0
Figure 7.26 - Results of the capillary porosity at water suction of the concrete versus temperature. P = (WV-WT)/(WV-WU) (7.3) WT denotes the weight in exsiccator at 20 °C
after heating to 105 °C, 200 °C, 400 °C or 600 °C.
WU denotes the weight under water at 20 °C after heating to 105 °C, 200 °C, 400 °C or 600 °C.
WV denotes the weight after water ingress in vacuum at 20 °C after heating to 105 °C, 200 °C, 400 °C or 600 °C.
Table 7.3 - Results of the capillary porosity at water suction of the concrete. Concrete 105 °C 200 °C 400 °C 600 °C 40AG0 0.213 0.213 0.223 0.256 40AK0 0.157 0.157 0.147 0.198 40AK2 0.140 0.150 0.156 0.207 40AK4 0.141 0.153 0.150 0.210 40BR0 0.119 0.140 0.161 0.185 55BK0 0.167 0.178 0.183 0.222 70BG0 0.150 0.162 0.167 0.223 70BK0 0.138 0.132 0.146 0.183 The porosity was larger for the glass filler con-crete 40BG0 than for the other concrete. An ex-planation for the increased porosity of glass filler concrete is the thermal expansion of glass that is larger than for concrete. Another possible expla-nation is an alkali-silica reaction between glass and the alkalis of the cement. A major increase of porosity was observed between 400 °C and 600 °C probably due to the quartzite transformation and releases hydrated water from the cement gel when the calcium hydrates recomposed into cal-cium oxide. The largest increase in porosity was observed for the reference concrete 40BR0: the smallest from concrete with limestone powder. Slightly larger increase of porosity at water suc-tion was observed in concrete with polypropylene fibres than in concrete without fibres.
7.3 Resistance to water penetration at suction The specimen size was 100 mm in diameter and 20 mm in thickness, three of each concrete. The concrete was treated at different temperatures either 105 °C, 200 °C, 400 °C or 800 °C. After cooling in a exsiccator at about RH = 10%, the weight was taken at 20 °C. The concrete was then subjected to suction by the flat side of the speci-men. The water was penetrating the flat side of the specimen and the rim by about 1 mm in height. The weight was taken after 1, 2, 3, 4, 1050 and 4000 min. after start of the suction until it stabi-lised. The resistance to water penetration was calculated from the slopes of the abscissas of the water suction versus the square root of time, both between 0 and 4 min and between 1000 and 4000 min., Appendices 7.9-12, Table 7.4 and Figures 7.27-28 [95]: m=(r/((o-q)·t))² (7.4)

60
0.0 5.0 10.0 15.0 20.0 25.0
40AG0
40AK0
40AK2
40AK4
40BR0
55BK0
70BG0
70BK0
Resistance to water penetration after heating (s/m²·10^6)
100 °C 200 °C 400 °C 600 °C
Figure 7.27 - Resistance to water penetration at suction after heating (s/m²·106).
0
5
10
15
20
25
0 200 400 600
Heating temperature (°C)
Res
ista
nce
to w
ater
pen
etra
tion
afte
r he
atin
g (s
/m²·1
0^6)
40AG0 40AK0 40AK240AK4 40BR0 55BK070BG0 70BK0
v
Figure 7.28 - Resistance to water penetration at suction after heating (s/m²·106) versus time.
m denotes the resistance to water penetration after heating (s/m²·106)
o slope of the water suction between 0 and 4 min. versus square root of time
q slope of the water suction between 1000 and 4000 min. versus square root of time
r constant in order fully to describe suction between 1000 and 4000 min. (kg/m²)
t thickness of specimen (m) Table 7.4 - Resistance to water penetration after heating (s/m²·106). Concrete 105 °C 200 °C 400 °C 600 °C 40AG0 10.3 4.64 2.01 0.727 40AK0 18.7 9.10 3.24 0.693 40AK2 23.2 11.1 1.59 0.486 40AK4 14.6 17.9 1.19 0.779 40BR0 13.9 6.52 4.40 0.676 55BK0 22.2 14.5 11.3 0.777 70BG0 17.0 10.7 8.62 0.713 70BK0 17.8 16.9 8.85 1.20 The lowest resistance to water penetration at suc-tion was obtained for the glass filler concrete 40BG0 followed by the reference concrete 40BR0. These results coincide well with the ob-servations of the porosity at water suction above. However, for concrete with 2 kg/m³ polypropyl-ene fibres larger resistance to water penetration at suction was observed at 105 °C than for the same concrete without fibres and than for concrete with 4 kg/m³ polypropylene fibres. For concrete with 4 kg/m³ polypropylene fibres larger resistance to water penetration at suction was observed at 200 °C than for the same concrete without fibres and for concrete with 2 kg/m³ polypropylene fibres. The reason for the increasing resistance to water penetration was probably an expansion and melt-ing of the polypropylene fibres at 105-200 °C. These phenomena remained also after cooling the specimen at 20 °C and therefore decreased the water suction. During fire heating water transport thus may be prohibited inward concrete with fi-bres. In this case the water pressure in concrete with fibres may increase slower than in concrete with fibres as the water instead of moving inward will leave the surface of the concrete. This is probably explaining the mechanism of the poly-propylene fibres in concrete at fire: • Possible increase of the polypropylene fibre
volume and melting at 105-200 °C. • Water movement inward concrete with fibre
is diminished at 105-200 °C due to an in-crease in the resistance to water penetration.
• Water instead moves the surface of concrete with fibres and thus fire spalling is avoided.

61
7.4 Capillary water suction and porosity Normally a relationship exists between capillary suction (resistance to water penetration) and capil-lary porosity. Figure 7.29 shows that normal con-crete had lower resistance to water penetration at capillary suction than SCC did when the capillary porosity is held constant. Especially with glass filler concrete with w/c=0.40 exhibited larger resistance to water penetration as compared to normal concrete at the same w/c=0.40. This is probably due to the glass filler content in SCC, which prohibit water movement, more than in normal concrete. It may also be due to a larger absorption of water in concrete with larger amount of filler that the absorption in concrete without filler, i.e. the isotherm of concrete might be affected. From Figure 7.29 the following for-mula was obtained, Figure 7.30: m = d·(Pcap)e (7.5) d,e denotes constants given in Table 7.5 m denotes resistance to water penetration
(s/m²·106) Pcap denotes capillary porosity {0.14<Pcap<0.24} Table 7.5 - Constants in equation (7.5) Normal concrete - air SCC - air SCC - water d 0.0001 0.0001 0.000000064e -5.72 -6.23 -10.1
0
5
10
15
20
0.10 0.15 0.20 0.25Capillary porosity
Res
ista
nce
to w
ater
pen
etra
tion
afte
r he
atin
g (s
/m²·1
0^6)
c/p=0.58(u=0.034) c/p=0.73(u=0.053)c/p=0.80(u=0.039) c/p=0.87(u=0.069)c/p=1(u=0.034)
Normal-air
SCC-water
SCC-air
Concrete 40AG0
Figure 7.29 - Resistance to water penetration at capillary suction versus the capillary porosity. c = cement; p = powder (cement + filler); u = mois-ture content (weight wet/dry – 1).
0.14 0.160.18
Nor
mal
-air
SCC
-air
SCC
-wat
er
0
10
20
30
Res
ista
nce
to w
ater
pe
netr
atio
n (s
/m²·1
0^6)
Capillary porosity
Figure 7.30 – Calculation of the resistance to wa-ter penetration with equation (7.5) for normal concrete and for SCC.

62
8. DISCUSSION
8.1 General SCC is characterised by its large amount of fine material, cement and filler, in the purpose of achieving a high stability and for avoiding segregation during casting of the concrete. These requirements causes too a large tightness and low permeability of SCC. This in turn affects the conditions at the ingress of a fire for the concrete to transport water vapour present in the concrete out of the concrete. The water vapour is instead forced to be transported inward in the concrete where it is transformed into the liquid phase when the temperature is rapidly increasing during occasion of fire. Water has namely a larger coefficient of expansion than the concrete structure causing the pores of the concrete to be saturated by water rapidly as the temperature increases (the relative humidity, RH increases in concrete on the same time as the temperature increases). After few minutes of fire also the pressure in the water filled pores of the concrete increases. At a certain critical temperature water may no longer exist but is transforms into vapour, which may spall the concrete. After the time of explosion of the concrete liquid water may be seen flushing down the surface of the remaining part of a fire spalled vertical column, which indicates that liquid water is formed even though the column is well dried before the testing. At RH = 70%, initially in concrete with w/c = 0.40, a temperature rise of 100 °C is sufficient to cause saturation provided sealed conditions, Figure 8.1 [22,96]. Figure 8.1 shows the temperature of saturation for normal concrete (varying w/c and RH at start of fire) provided sealed conditions. Generally RH varies between 60% and 90% in the concrete at start of fire since the concrete normally obtains about 5% higher RH than the average RH of the ambient atmosphere. When polypropylene fibres are included the water transport inward the concrete probably is diminished between 100 °C and 200 °C. From Figure 8.1 the following equation was evaluated: Tsat =115·(1.07-RH )·exp((2.52-0.95·RH)·w/c)) (8.1) w/c denotes water-cement ratio (0.35 w/c <0.75) RH denotes RH before fire (0.30 < RH < 0.90) Tsat denotes temperature of saturation (°C). Explosion of concrete during heat spalling seems to take place at lower temperature than the critical one (275 °C). A temperature observed at the time
of explosion is 185 °C with 350 °C at the surface of the concrete, Figure 8.2.
0
50
100
150
200
250
0.35 0.45 0.55 0.65 0.75
Water-cement ratio, w/cTe
mpe
ratu
re a
t sat
urat
ion
(°C
)
RH=0.30 RH=0.50RH=0.70 RH=0.90
Figure 8.1 - Temperature at saturation of concrete with varying w/c and RH at start of fire provided sealed conditions [22,96].
Figure 8.2 – Performance of concrete 40AK0 after heating with 350 °C surface temperature and 185 °C concrete temperature at the time of explosion.

63
During fire spalling testing at SP not only part of the tested columns were damaged but also a security window glass that was placed in the wall of the large oven. The forces at fire spalling thus are enormous and may be a hazard for the fire rescue personnel at the start of a fire.
8.2 Effect of high temperature on mechanical properties of concrete tested at LTH Normal concrete consists to its main part of aggregate, gravel and coarse aggregate. A minor part, about 25%, consists of hardened cement paste; approximately equal parts by weight of water and cement. The ratio of water and cement defines the water-cement ratio, w/c, of the concrete. When the concrete is heated the aggregate expands parallel to shrinkage of the cement paste. Water leaves the hardened cement paste parallel to the temperature increase causing large deformation as compared to the deformation of the aggregate. These interacting deformations ground the basis for shear stresses in the interfacial zone between aggregate and the hardened cement paste. In the hot state strength of SCC is not affected much up to a temperature of 400 °C, Figure 5.19. The hardened cement paste still has fairly plastic properties during the phase of heating at fire so the hardened cement paste may well deform itself with the aggregate up to 575 °C, anyhow, at which temperature the quartzite transformation takes place. The elastic modulus of concrete is much more affected by fire temperatures than the strength is (the deformation of the concrete is affected). The elastic modulus may be halved up to 400 °C when tested in the hot state, Figure 7.23. It is positively for SCC that no drop of strength seems to exist between 105 °C and 200 °C like occurs for High Performance Concrete, HPC, Figure 5.24. For HPC the strength was diminished about 20% between 105 °C and 200 °C, which is a disadvantage. After heating and when the concrete cools to normal temperature, large movements for a second time happens between the aggregate and the hardened, partly de-watered, cement paste. Both aggregate and the remaining part of the hardened cement paste shrinks, but the cement paste less since it absorbs water from the ambient air, especially after cooling. Especially SCC is affected after heating up to 800 °C and cooling for a week or more at 20 °C. SCC with limestone powder then loses its strength totally and is pulverised autonomy, Figure 7.23. The calculated residual properties are not affected much since no strength for concrete above 500 °C normally is taken into account. Damages may also occur after long since SCC loosens its strength after the fire.
8.3 Influence of mix proportions on fire spalling of concrete columns tested at SP [94] In the laboratory at SP, Borås, hanging pre-stressed columns, 200 mm square and 2 m long, were tested during at least standard ISO 834 fire conditions (close to Hydro Carbon fire enhanced ISO 834 fire conditions for water-cured columns, equation (2.3), Figure 2.12). The age of the columns was either ½ or 1 year. The pre-stressing force (either 104 kN or 112 kN) was 30% of the current ultimate compressive 150-mm cube strength, i.e. about 40% of the ultimate strength of the columns, Appendix 4.6. Pre-stressing was carried out at about 2 days’ age. About 14 columns were hanging at each fire test occasion. Data from the work has been used in order to correlate the weight of tested concrete to w/p, Figure 8.3 [94,97-100]. For water-cured concrete A with cement type I, the fire spalling results seems logical, Table 8.1. The following parameters was studied, Appendix 8: • RH in the concrete before fire testing. • Moisture in the concrete before fire testing. • Weight of concrete before and after fire. • Temperature of the column. • Temperature in the fire room. • Fire spalling of the surface (video cameras). Table 8.1 – Age, mix proportions (kg/m³) and weight of columns after fire spalling [94,97-100]. Con-crete
Age (days)
Wa-ter
Ce-ment
Filler w/p We-ight
Air (%)
40AG0 170 172 430 62 0.35 0.82 5 40AK0 170 164 411 149 0.29 0.68 5.1 40AK2 170 173 433 181 0.28 0.88 2.5 40AK4 170 195 487 171 0.30 0.94 2.8 40AR0 170 206 518 0 0.40 0.93 4 40BR0 170 175 436 0 0.40 0.95 - 40BK0 170 179 518 130 0.28 0.76 - 55BK0 320 170 308 242 0.31 0.73 1.3 55BK2 320 189 344 241 0.32 0.85 1.1 55BK4 160 210 382 233 0.34 0.86 - 55BR0 320 192 348 0 0.55 0.86 1.5 70BG0 170 225 321 80 0.56 0.87 1.7 70BK0 170 188 268 189 0.41 0.82 2.6 70BK2 160 209 298 229 0.40 0.97 - 70BK4 160 214 306 331 0.34 0.86 - 70BR0 170 195 278 0 0.70 0.92 5 p = powder (cement + filler); w = water; A = Anläggningscement; B = Byggcement; K = limestone filler; R = normal concrete; 0 = 0 kg/m³ polypropylene fibres; 40 = w/c (%).

64
0.60
0.70
0.80
0.90
1.00
0.25 0.35 0.45 0.55 0.65
Water-powder ratio, w/p
Rel
ativ
e w
eigh
t
Air - no fibre Air - 2 kg/m³ fibreAir - 4 kg/m³ fibre Water - no fibreWater - 2 kg/m³ fibre Water - 4 kg/m³ fibre
Air curing - no fibre
Water curing - no fibre
Figure 8.3 - Fire spalling versus w/p. The concrete contained large amount of limestone powder which was due to the available aggregate. More than 200 kg/m³ of limestone powder was used in the following mix proportions: • 55BK0 • 55BK2 • 55BK4 • 70BK2 • 70BK4 In a way the limestone powder content in the mentioned mix proportions shows that SCC cannot be produced with all kinds of aggregate except adding unreasonable amounts of limestone powder. Another aspect is that the early age water curing increased the tensile strength of the surface of the concrete, which may increase the resistance to fire spalling but also the resistance to fire spalling. The relative weight of the concrete A with type I cement subjected to water curing was reduced in the following way: WA = 2.39·(w/p) - 0.019 (8.2) w/p denotes water-powder ratio (0.25 < w/p <
0.40) WA denotes weight after fire spalling concrete A
8.4 Parameters affecting fire spalling tests performed at SP [94]
8.4.1 Concrete A with Portland cement type I From above significant effect of w/p was observed on the weight of concrete after fire spalling. Further parameter analyses were performed in order to explain some inconsistent observations above, Figures 8.4-5.
0.00
0.20
0.40
0.60
0.80
1.00
0.60 0.70 0.80 0.90 1.00
Relative weight to original
Para
met
er in
stu
dy o
f co
ncre
te A
with
type
I ce
men
t
w/pRHMoisturex10f/pa/(10xp)16 mm/(10xp)11 mm/(10xp)8 mm/(10xp)c/pLinjär (f/p)Linjär (16 mm/(10xp))Linjär (w/p)Linjär (c/p)
Figure 8.4 – Parameter analysis of spalling on concrete A with cement type I without fibres. The following relationships were found for concrete A with cement type I without fibres: n = k·(1-W)+ m (8.3) c denotes cement content k, m denotes constants given in Table 8.2 f denotes filler content n denotes parameter in study p denotes powder content (cement+filler) W denotes weight after fire spalling

65
0.00
0.20
0.40
0.60
0.80
1.00
0.60 0.70 0.80 0.90 1.00
Relative weight to original
Para
met
er in
stu
dy
RH Moisturef/p a/(10xp)16 mm/(10xp) 11 mm/(10xp)8 mm/(10xp) c/p
2 kg/m³ fibre
4 kg/m³ fibre
w/p=0.29
Figure 8.5 – Parameter analysis of spalling on concrete A with cement type I with fibres. Table 8.2 – Parameters in equation (8.3). Parameter, n k m Aggregate 11-16 mm/(10·p) -0.234 0.177 c/p -1.060 1.070 f/p 1.060 -0.070 w/p -0.411 0.411 Some of the parameters affected the fire spalling in parallel so that they are difficult to separate. The following result was obtained by the parameter analysis on fire spalling of concrete A with cement type I without fibres: • Less aggregate 11-16 mm gave larger amount
of spalling since k was negative. • Lower c/p-ratio influenced on the spalling so
that larger spalling was obtained. • Subsequently larger f/p-ratio imposed larger
spalling. • Lower w/p-ratio gave larger spalling as found
above. For concrete A with 2% and 4% of fibres the fire spalling was decreased in a logical way by the increased of the amount of fibres, Figure 8.5.
8.4.2 Concrete B with filler cement type II Figures 8.6 and 8.7 show a summary of factors influencing the weight of concrete B with filler cement type II. The following relationships were found on concrete B without fibres, Figure 8.6: s = q·(1-W)+ r (8.4) c denotes cement content f denotes filler content p denotes powder content (cement+filler) q, r denotes constants given in Table 8.3 s denotes parameter in study W denotes weight after fire spalling Table 8.3 – Parameters in equation (8.4). Parameter, s q r Aggregate /(10xp) -1.23 0.609 Aggregate 0-8 mm /(10xp) -0.917 0.394 Aggregate 8-11 mm /(10xp) -0.323 0.151 c/p -1.59 0.943 f/p 1.87 0.110 Moisture 0.0286 0.747 w/p -1.30 0.659 Again, some of the parameters affected the fire spalling in parallel so that they are difficult to separate. The following result was obtained by the parameter analysis on fire spalling of concrete B with cement type II without fibres (cement type II was recalculated into Portland cement): • Less aggregate content gave larger spalling. • Less aggregate 0-8 mm gave more spalling. • Less aggregate 8-11 mm increased spalling. • Content of aggregate 11-16 mm did not
influence on the spalling. • Lower c/p-ratio influenced on the spalling so
that larger spalling was obtained. • Larger f/p-ratio imposed larger spalling. • Larger RH caused more spalling. • Lower w/p-ratio gave larger spalling. For concrete with B with 2% and 4% of fibres the increasing fire spalling was not logical, Figure 8.7. Possible reasons for the same amount of fire spalling of concrete 55BK2 and 55BK4 (even though the fibre content increased from 2 to 4 kg/m³) is shown in Table 8.4: • Increase of testing age from 160 days
(55KB4) to 320 days (55BK2). • Decreased amount of aggregate. • Increased amount of water. • RH was 6% larger in 55BK4 than in 55BK2.

66
0.00
0.20
0.40
0.60
0.80
1.00
0.60 0.70 0.80 0.90 1.00
Relative weight to original
Para
met
er in
stu
dy
w/pRHMoisturef/pa/(10xp)16 mm/(10xp)11 mm/(10xp)0-8 mm /(10xp)c/pLinjär (w/p)Linjär (f/p)Linjär (c/p)Linjär (a/(10xp))Linjär (11 mm/(10xp))Linjär (0-8 mm /(10xp))Linjär (RH)
Figure 8.6 – Parameter analysis of spalling on concrete B with cement type II without fibres. According to Anderberg [101] the age of concrete has a fundamental effect on the risk of spalling mainly due to the strength increase over time but also due to internal drying of the concrete. RH was not measured either in concrete 55BK4 or in 55BK2, which is unfortunate, since it is known that the moisture content and then also RH in the concrete affects the risk of fire spalling substantially. However, RH in concrete 55BK0 was know at 320 days’ age, RH = 0.77, Appendix 8. Calculations with TorkaS [101] indicates that RH in concrete 55BK4 at 160 days’ age was about 6% larger, i.e. RH = 83%, than in concrete 55BK2 at 320 days’ age, i.e. RH = 77%. It is shown in the experiments that 4 kg/m³ of polypropylene fibres gave the same fire spalling at 160 days’ testing age (55BK4) like 2 kg/m³ of polypropylene fibres did at 320 days’ testing age (55BK2).
0.00
0.20
0.40
0.60
0.80
1.00
0.60 0.70 0.80 0.90 1.00
Relative weight to originalPa
ram
eter
in s
tudy
w/pRHMoisturef/pa/(10xp)16 mm/(10xp)11 mm/(10xp)8 mm/(10xp)c/pw/1000
2kg/m³ fibre
4%kg/m³fibre
2kg/m³ fibre
Figure 8.7 – Parameter analysis of spalling on concrete B with cement type I with fibres. One-hundred-and-sixty days’ age at testing of concrete was an quite unrealistic low age. Then 320 days’ age is more appropriate and would indicate that 2 kg/m³ of polypropylene fibres is sufficient to reduce the fire spalling to 15%. For the comparable reference, normal concrete 55BR0 the age at testing was 320 days with a fire spalling of 14%. It is not reasonable to increase the requirements of fire spalling in SCC as compared to normal concrete. For concrete 70BK2 and 70BK4 the decrease of c/p and w/p probably was a reason for the increased spalling. Table 8.4 - Mix proportions and other properties of concrete (kg/m³). Con-crete
Age (d)
Spal-ling
w/p f/p c/p w a/(10xp)
55BK2 320 0.15 0.32 0.41 0.50 189 0.28 55BK4 160 0.14 0.34 0.38 0.62 210 0.25 70BK2 160 0.03 0.40 0.43 0.57 209 0.30 70BK4 160 0.14 0.34 0.52 0.48 214 0.23 d = days
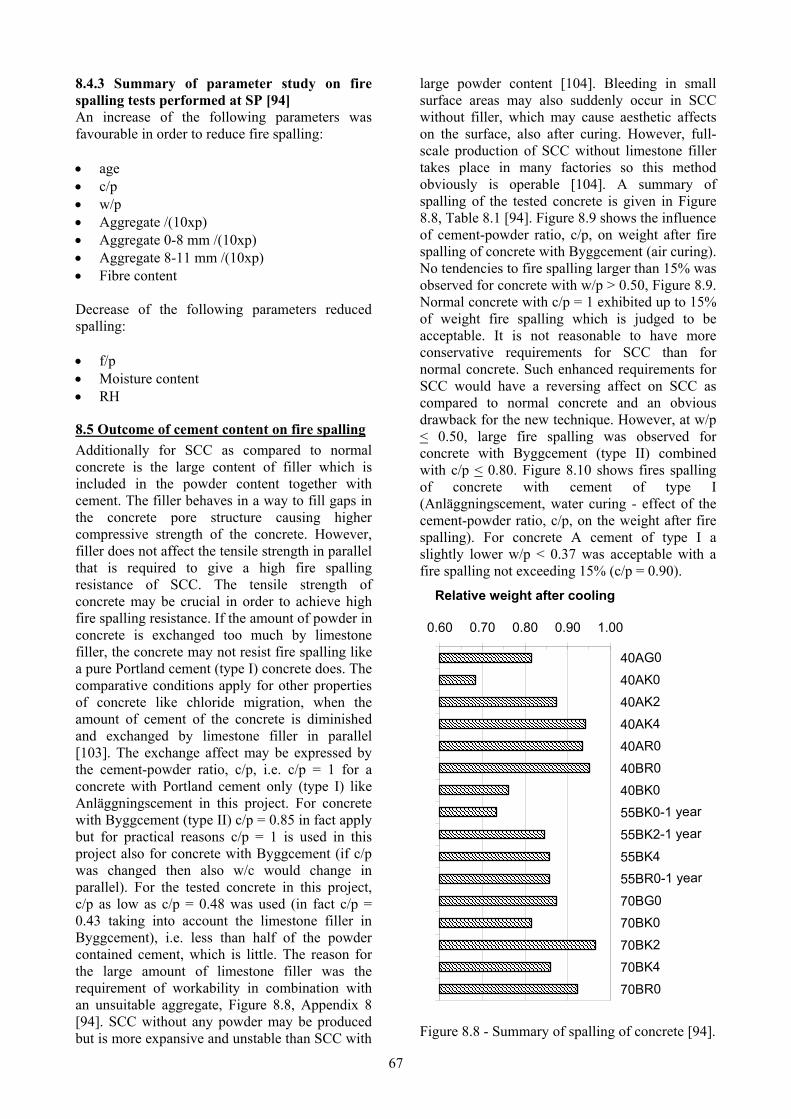
67
8.4.3 Summary of parameter study on fire spalling tests performed at SP [94] An increase of the following parameters was favourable in order to reduce fire spalling: • age • c/p • w/p • Aggregate /(10xp) • Aggregate 0-8 mm /(10xp) • Aggregate 8-11 mm /(10xp) • Fibre content Decrease of the following parameters reduced spalling: • f/p • Moisture content • RH
8.5 Outcome of cement content on fire spalling Additionally for SCC as compared to normal concrete is the large content of filler which is included in the powder content together with cement. The filler behaves in a way to fill gaps in the concrete pore structure causing higher compressive strength of the concrete. However, filler does not affect the tensile strength in parallel that is required to give a high fire spalling resistance of SCC. The tensile strength of concrete may be crucial in order to achieve high fire spalling resistance. If the amount of powder in concrete is exchanged too much by limestone filler, the concrete may not resist fire spalling like a pure Portland cement (type I) concrete does. The comparative conditions apply for other properties of concrete like chloride migration, when the amount of cement of the concrete is diminished and exchanged by limestone filler in parallel [103]. The exchange affect may be expressed by the cement-powder ratio, c/p, i.e. c/p = 1 for a concrete with Portland cement only (type I) like Anläggningscement in this project. For concrete with Byggcement (type II) c/p = 0.85 in fact apply but for practical reasons c/p = 1 is used in this project also for concrete with Byggcement (if c/p was changed then also w/c would change in parallel). For the tested concrete in this project, c/p as low as c/p = 0.48 was used (in fact c/p = 0.43 taking into account the limestone filler in Byggcement), i.e. less than half of the powder contained cement, which is little. The reason for the large amount of limestone filler was the requirement of workability in combination with an unsuitable aggregate, Figure 8.8, Appendix 8 [94]. SCC without any powder may be produced but is more expansive and unstable than SCC with
large powder content [104]. Bleeding in small surface areas may also suddenly occur in SCC without filler, which may cause aesthetic affects on the surface, also after curing. However, full-scale production of SCC without limestone filler takes place in many factories so this method obviously is operable [104]. A summary of spalling of the tested concrete is given in Figure 8.8, Table 8.1 [94]. Figure 8.9 shows the influence of cement-powder ratio, c/p, on weight after fire spalling of concrete with Byggcement (air curing). No tendencies to fire spalling larger than 15% was observed for concrete with w/p > 0.50, Figure 8.9. Normal concrete with c/p = 1 exhibited up to 15% of weight fire spalling which is judged to be acceptable. It is not reasonable to have more conservative requirements for SCC than for normal concrete. Such enhanced requirements for SCC would have a reversing affect on SCC as compared to normal concrete and an obvious drawback for the new technique. However, at w/p < 0.50, large fire spalling was observed for concrete with Byggcement (type II) combined with c/p < 0.80. Figure 8.10 shows fires spalling of concrete with cement of type I (Anläggningscement, water curing - effect of the cement-powder ratio, c/p, on the weight after fire spalling). For concrete A cement of type I a slightly lower w/p < 0.37 was acceptable with a fire spalling not exceeding 15% (c/p = 0.90).
0.60 0.70 0.80 0.90 1.00
40AG0
40AK0
40AK2
40AK4
40AR0
40BR0
40BK0
55BK0-1 year
55BK2-1 year
55BK4
55BR0-1 year
70BG0
70BK0
70BK2
70BK4
70BR0
Relative weight after cooling
Figure 8.8 - Summary of spalling of concrete [94].

68
0.70
0.80
0.90
1.00
0.20 0.40 0.60 0.80
w/p
Rel
ativ
e w
eigh
t afte
r fire
(air-
cure
d co
ncre
te w
ith B
yggc
emen
t)
c/p= 0.6 c/p=0.8c/p=1 Linjär (c/p= 0.6)Linjär (c/p=0.8)
Figure 8.9 - Influence of cement-powder ratio, c/p, and water-powder ratio, w/p, on weight after fire spalling of concrete B (air curing).
0.60
0.70
0.80
0.90
1.00
0.28 0.32 0.36 0.40
Water-powder ratio, w/p
Rel
ativ
e w
eigh
t afte
r fire
(wat
er c
urin
g w
ith c
emen
t A)
c/p=1
c/p=0.87
c/p=0.73
Figure 8.10 - Weight after fire spalling of concrete A with cement of type I (water curing, Anläggningscement, effect of c/p). Obviously a relationship also exists between the parameters the cement-powder ratio, c/p and the water-powder ratio, w/p. Both these parameters increased in parallel when w/c was held constant. The question was how to express fire spalling in the best way, by w/c or w/p. w/c is the most well-known parameter of concrete affecting both strength and durability so this parameter was preferable to be further evaluated. From Figure 8.10 and equation (8.2) the following simplified
equation was obtained for the relative weight of water-cured concrete after fire, Ww: Ww = 2.4·w/p (8.5) w/p denotes water-powder ratio (0.25 < w/p <
0.40)
8.6 Weight of curing, air entrainment and testing age on fire spalling Effect of type of curing on the weight of concrete after fire spalling may be judged on the result of two concrete according to Figure 8.8, 40AR0 and concrete 40BR0, Table 8.5 [94]. Concrete 40AR0 (water-cured with Anläggningscement; w/c = w/p = 0.40; c/p = 1) obtained 93% of weight after fire spalling and concrete 40BR0 (air-cured with Byggcement; w/c = w/p = 0.40; c/p = 1) obtained 95% of weight [94]. The similar fire spalling of the concrete 40AR0 and 40 BR0 was astonishing. Even though the curing type varied from water to air more or less the same amount of spalling was observed. This may be due to a lower c/p for Byggcement, w/p = 0.85, than for Anläggningscement, w/p = 1. If the definition for w/p is altered w/c is also affected, in case an increase from w/c = 0.40 to w/c = 0.47 for concrete 40BR0 (calculation with pure Portland cement). In any case sufficient amount of water was available in the concrete for fire spalling to take place. A comparison with Figure 8.1 shows that an increase of temperature of 50 °C was necessary for concrete with w/c = 0.40 and RH = 90% initially to obtain saturation but about 105 °C increase of temperature for concrete with w/c = 0.40 and RH = 70%. Still much higher temperature changes takes place during fire, enough for the saturation of the pores to take place. Sufficient amount of water was available in the pore system even at RH = 70% in order to obtain saturation and fire spalling rapidly. Another reason for the low fire spalling of concrete A with water curing compared with concrete B with air curing may be the air content, 5% air content in concrete 40AR0 and natural air in concrete 40BR0 [94]. The effect of age on the amount of fire spalled concrete may be judge from Figure 8.8 and Table 8.6 [94]. Concrete 55BR0, that was 1 year at the time of testing lost 14% in weight at fire spalling compared with on average 7% for the comparable concrete at an age of half a year, 40AR0, 40BR0 and 70BR0. Neither in this case it seemed like age had a significant effect on fire spalling, rather a reversed effect. Normal air-cured concrete may obtain 14% of fire spalling even after 1 year of air-curing with RH = 73% in centre of the columns when it was tested, 55BR0. It also was interesting to compare

69
the fire spalling of the concrete 55BK2 (2 kg/m³ plastic fibre, 1 year old) with the same concrete 55BK4 (4 kg/m² fibre, ½ year). Both concrete obtained about 15% of fire spalling, i.e. in this case the ageing seems to halve the requirement of spalling to an acceptable level, Table 8.6. In general it seemed like the age, half a year or 1 year, did not affect the fire spalling at all, Table 8.6. These results are noticeable and in contrast to previous research. Probably the time of drying, half a year or 1 year still was too short in order to obtain significant difference to water curing. The question is also at what an age the concrete is required to be resistant to fire? Previous research shows that the same type of concrete construction sensible to fire spalling at half a year of age resisted the same type of fire at 5 years’ age [105]. Table 8.5 –Properties of concrete 40AR0 and 40BR0 weight after fire [94, 97-100]. Concrete 40AR0 40BR0 Air content 4% - Cement-powder ratio, c/p 1 1 Curing (6 months) Water Air Portland cement-powder ratio, c/p (real c/p))
1 0.85
RH 73% 93% Water-cement ratio, w/c 0.40 0.40 Water-powder ratio 0.40 0.40 Water-Portland cement ratio, w/Pc
0.40 0.47
Weight after fire 93% 95% Table 8.6– Effect of age on weight after fire [94]. Concrete c/p w/c w/p RH Weight 40AR0 1.00 0.40 0.40 0.93 0.93 40BR0 1.00 0.40 0.40 0.95 55BK0-1 year 0.56 0.55 0.31 0.77 0.73 55BK2-1 year. 0.59 0.55 0.32 0.8585 55BK4 0.62 0.55 0.34 0.86 55BR0-1 year 1.00 0.55 0.55 0.73 0.86 70BR0 1.00 0.55 0.70 0.77 0.92 p = powder (cement + filler); w = water; A = Anläggningscement; B = Byggcement; K = limestone filler; R = normal; RH = rel. humidity; 0 = 0 kg/m³ polypropylene fibres; 40 = w/c (%).
8.7 Consequence of amount and type of fibre For some combinations of cement-powder ratio, c/p < 0.80, and water-powder ratio, w/p < 0.50, other measures were required to secure the fire spalling resistance at a maximum limit of 15% of the original weight before the fire. In the present investigation the fibre in use had a 32-µm diameter in contrast to another type of fibre of 18-µm which exhibited half the amount of spalling provided the same condition for the other
parameters [79]. The amount of fibres given here is based on the 32-µm-diameter fibre at half a year of age and a maximum 15% of fire spalling. If the age of testing is increased from half a year to 1 year the required amount seem to be half, Table 8.6. The required amount of fibres will then be further diminished in order to secure SCC for fire spalling. However, first of all the amount of limestone powder is to be lowered in concrete before adding fibres. Figure 8.11 shows the weight after fire spalling of concrete B with Byggcement type I at varying amount of fibre and w/p. Amount of fibre is based on diameter 32 µm and half a year age. The effect of fibre was substantial in order to obtain a concrete resistant to fire spalling, Figure 8.11. In the same way the Figure 8.12 show the weight after fire spalling of concrete with Anläggningscement at varying amount of fibre and w/p. The amount of fibre is based on diameter 32 µm and half a year age and a 15% maximum level of fire spalling. At constant w/p ≈ 0.29 the effect of polypropylene fibres on the relative weight after fire exposure was observed on concrete A with Type I cement, Figure 8.12, Table 8.7. Table 8.7. - Effect of polypropylene fibres on the relative weight of concrete A at w/p ≈ 0.29. Fibre content (kg/m³) Relative weight (%) 0 68 2 88 4 94
0.60
0.70
0.80
0.90
1.00
0 1 2 3 4
Amount of fibres (kg/m³)
Rel
ativ
e w
eigh
t (ai
r-cu
red
conc
rete
w
ith B
yggc
emen
t)
w/0=0.32 w/p=0.40w/p=0.55 w/p=0.70
w/p=0.40
w/p=0.32
Figures 8.11 - Weight after fire spalling at half a year’s age of concrete with Byggcement versus amount of 32 µm fibre and w/p.
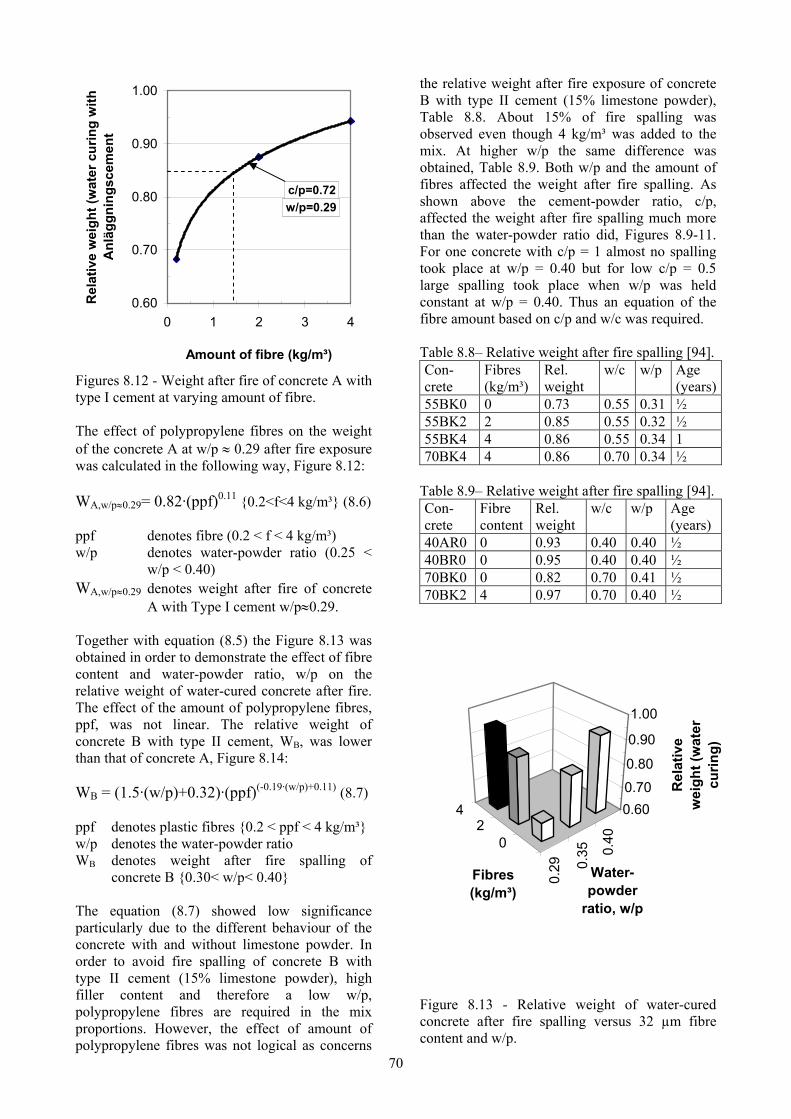
70
0.60
0.70
0.80
0.90
1.00
0 1 2 3 4
Amount of fibre (kg/m³)
Rel
ativ
e w
eigh
t (w
ater
cur
ing
with
A
nläg
gnin
gsce
men
t
c/p=0.72w/p=0.29
Figures 8.12 - Weight after fire of concrete A with type I cement at varying amount of fibre. The effect of polypropylene fibres on the weight of the concrete A at w/p ≈ 0.29 after fire exposure was calculated in the following way, Figure 8.12: WA,w/p≈0.29= 0.82·(ppf)0.11 {0.2<f<4 kg/m³} (8.6) ppf denotes fibre (0.2 < f < 4 kg/m³) w/p denotes water-powder ratio (0.25 <
w/p < 0.40) WA,w/p≈0.29 denotes weight after fire of concrete
A with Type I cement w/p≈0.29. Together with equation (8.5) the Figure 8.13 was obtained in order to demonstrate the effect of fibre content and water-powder ratio, w/p on the relative weight of water-cured concrete after fire. The effect of the amount of polypropylene fibres, ppf, was not linear. The relative weight of concrete B with type II cement, WB, was lower than that of concrete A, Figure 8.14: WB = (1.5·(w/p)+0.32)·(ppf)(-0.19·(w/p)+0.11) (8.7) ppf denotes plastic fibres {0.2 < ppf < 4 kg/m³} w/p denotes the water-powder ratio WB denotes weight after fire spalling of
concrete B {0.30< w/p< 0.40} The equation (8.7) showed low significance particularly due to the different behaviour of the concrete with and without limestone powder. In order to avoid fire spalling of concrete B with type II cement (15% limestone powder), high filler content and therefore a low w/p, polypropylene fibres are required in the mix proportions. However, the effect of amount of polypropylene fibres was not logical as concerns
the relative weight after fire exposure of concrete B with type II cement (15% limestone powder), Table 8.8. About 15% of fire spalling was observed even though 4 kg/m³ was added to the mix. At higher w/p the same difference was obtained, Table 8.9. Both w/p and the amount of fibres affected the weight after fire spalling. As shown above the cement-powder ratio, c/p, affected the weight after fire spalling much more than the water-powder ratio did, Figures 8.9-11. For one concrete with c/p = 1 almost no spalling took place at w/p = 0.40 but for low c/p = 0.5 large spalling took place when w/p was held constant at w/p = 0.40. Thus an equation of the fibre amount based on c/p and w/c was required. Table 8.8– Relative weight after fire spalling [94]. Con-crete
Fibres (kg/m³)
Rel. weight
w/c w/p Age (years)
55BK0 0 0.73 0.55 0.31 ½ 55BK2 2 0.85 0.55 0.32 ½ 55BK4 4 0.86 0.55 0.34 1 70BK4 4 0.86 0.70 0.34 ½
Table 8.9– Relative weight after fire spalling [94]. Con-crete
Fibre content
Rel. weight
w/c w/p Age (years)
40AR0 0 0.93 0.40 0.40 ½ 40BR0 0 0.95 0.40 0.40 ½ 70BK0 0 0.82 0.70 0.41 ½ 70BK2 4 0.97 0.70 0.40 ½
0.29 0.
35 0.400
24 0.60
0.70
0.80
0.90
1.00
Rel
ativ
e w
eigh
t (w
ater
cu
ring)
Water-powder
ratio, w/p
Fibres (kg/m³)
Figure 8.13 - Relative weight of water-cured concrete after fire spalling versus 32 µm fibre content and w/p.

71
02
4
0.320.
360.40
0.60
0.70
0.80
0.90
1.00
Rel
ativ
e w
eigh
t (ai
r cu
ring)
Fibre content (kg/m³)Water-
powder ratio, w/p
Figure 8.14 - Relative weight of concrete B with type II cement at different fibre content and w/p.
8.8 Effect of moisture and hydration losses
8.8.1 Moisture content The moisture content of the concrete was not measured before the fire spalling test [94], but at the cylinder tests and also before the water suction and the porosity tests. (At full-scale tests it is necessary to cast dummies in order to obtain the moisture content.) In parallel also RH was measured in concrete, at half a years’ age. Figure 8.15 shows the moisture content, u, in some concrete, either water-cured or in the air together with some previous result [40]. The moisture content, u, was calculated in the following way: u=Wwet/Wdry-1 (8.8) Wdry denotes the dry weight after heating 1 week
at 105 °C and cooling in exsiccator at 20 °C Wwet denotes the wet weight before heating About 3% moisture in normal concrete is critical for the fire spalling to take place [79,101]. Even though the concrete was dried to about 75%RH high moisture content was observed. On average the following moisture content was found: • Previous research [40]: 2.2% • Air-cured specimen: 3.6% • Water-cured specimen: 5.9%
0.00 0.02 0.04 0.06 0.08
HPC [40]
NC [40]
40AG0
40AK0
40AK2
40AK4
40BR0
55BK0
70BG0
70BK0
Moisture compared to 105 °C-weight
Figure 8.15 - Moisture content in concrete, either water- or air-cured with some previous result [40].
8.8.2 Isothermal behaviour In Figure 8.16 the moisture content of the concrete was compared with the isotherm of normal concrete with either w/c = 0.40 or w/c = 0.70 [104]. Figure 8.16 shows that normal concrete 40BR0 performed as expected and followed the isotherm like concrete with w/c = 0.40 [106]. All other concrete with filler (SCC) showed isothermal properties above normal concrete. Especially concrete 40AG0 and 70BG0 contained more water than given by the isotherm. This in turn clearly shows that SCC contains more water than normal concrete when RH is held constant (especially concrete with glass filler). The observation shows that the reason for larger fire spalling of SCC may be a different isotherm. A structure with filler may absorbs more moisture than the gravel and aggregate does causing a larger moisture content shown by the isotherm (especially concrete with glass filler), Figure 8.16.
8.8.3 Hydration losses It was important to calculate correct hydration losses at every temperature. If the hydration losses were incorrect part of the weight attributed to fire spalling may be hydration losses. From a practical point of view the following calculations were performed: h= 1-Wdry/Wwet (8.9)

72
0.10
0.20
0.30
0.40
0.50
0.40 0.60 0.80 1.00
Relative humidity, RH
Evap
orab
le w
ater
to c
emen
t con
tent
w/c=0.40 [105] w/c=0.70 [105]40AG0 40AK0
40AK2 40AK440BR0 55BK0
70BG0 70BK0
Figure 8.16 - Moisture content compared with the isotherm of normal concrete either with w/c= 0.40 or w/c= 0.70 [106]. A = Anläggningscement; B = Byggcement; G = glass; K = limestone; R = normal; 0 = 0 kg/m³ plastic fibres; 40 = w/c (%). h denotes the relative weight after evaporated
or hydrated water losses Wdry denotes the dry weight after heating 1 week
at 105 °C and cooling in exsiccator at 20 °C Wwet denotes the wet weight before heating The relative hydration losses thus are slightly larger than the relative moisture content. Figure 8.17 and Table 8.10 show the relative weight of the tested concrete after evaporated or hydrated water losses. The largest evaporated and hydration water losses were obtained for concrete with glass filler, 40AG0, which confirms the previous results of capillary porosity, Chapter 7. Table 8.10 – Relative weight of the tested concrete after evaporated or hydrated water losses. T (°C)
40AG0
40AK0
40AK2
40AK4
40BR0
55BK0
70BG0
70BK0
20 1.00 1.00 1.00 1.00 1.00 1.00 1.00 1.00100 0.93 0.95 0.95 0.95 0.97 0.96 0.96 0.97200 0.93 0.95 0.95 0.94 0.96 0.95 0.96 0.97400 0.91 0.94 0.93 0.93 0.95 0.95 0.95 0.97600 0.90 0.92 0.92 0.92 0.95 0.94 0.94 0.95800 0.91 0.00 0.00 0.00 0.94 0.00 0.93 0.00
0.90
0.92
0.94
0.96
0.98
1.00
0 200 400 600 800
Temperature (°C)
Rel
ativ
e w
eigh
t com
pare
d to
20
°C-
wei
ght
40AG0 40AK0 40AK2
40AK4 40BR0 55BK0
70BG0 70BK0
Figure 8.17 – Relative weight of concrete after evaporated or hydrated water losses.
8.9 Effect of porosity on fire spalling Porosity and fire spalling were compared [94]. Figures 8.18-23 show the development of fire spalling versus capillary porosity at 20 °C after heating to different temperatures, 105 °C, 200 °C, 400 °C and 600 °C. The same observations apply after heating to 200 °C like after heating to 105 °C except for the porosity of SCC with fibres that became the same that for concrete without fibres when the other mix proportions of the concrete was held constant. The following conclusions were drawn: • Water-curing concrete showed less relative
weight after fire spalling compared to air-cured concrete when the porosity was held constant (no fibres).
• Larger c/p-ratio gave larger weight after fire spalling when the porosity was held constant.
• Polypropylene fibres lowered the porosity after treating the concrete at 105 °C compared with the porosity without fibres.
• The relative weight after fire spalling became larger in SCC with fibres even though the porosity with fibres became smaller.
• Larger porosity of concrete with fibres than of concrete without fibres was observed after heating to 400 °C.

73
0.60
0.70
0.80
0.90
1.00
0.10 0.15 0.20
Capillary porosity at water suction after heating to 105 °C
Rel
ativ
e w
eigt
h af
ter f
ire
c/p=0.58(u=0.034) c/p=0.73(u=0.053)c/p=0.80(u=0.039) c/p=0.87(u=0.069)c/p=1(u=0.034)
4 kg/m³
2 kg/m³
Figure 8.18 - Development of fire spalling versus capillary porosity at 20 °C after heating to 105 °C.
0.60
0.70
0.80
0.90
1.00
0.10 0.15 0.20Capillary porosity at water suction
after heating to 200 °C
Rel
ativ
e w
eigt
h af
ter f
ire
c/p=0.58(u=0.034) c/p=0.73(u=0.053)c/p=0.80(u=0.039) c/p=0.87(u=0.069)c/p=1(u=0.034)
4 kg/m³
2 kg/m³
Figure 8.19 - Development of fire spalling versus capillary porosity at 20 °C after heating to 200 °C. After heating to 400 °C and 600 °C the porosity increased more for concrete with polypropylene fibres than for concrete with the same mix proportions but without fibres. The pore volume for transport of water vapour increased more in concrete with fibres. The following equation was found for the relative weight after fire spalling of air-cured SCC with c/p=0.58, Wfs, Figure 8.24:
0.60
0.70
0.80
0.90
1.00
0.10 0.15 0.20
Capillary porosity at water suction after heating to 400 °C
Rel
ativ
e w
eigt
h af
ter f
irec/p=0.58(u=0.034) c/p=0.73(u=0.053)c/p=0.80(u=0.039) c/p=0.87(u=0.069)c/p=1(u=0.034)
4 kg/m³
2 kg/m³
Figure 8.20 - Development of fire spalling versus capillary porosity at 20 °C after heating to 400 °C.
0.60
0.70
0.80
0.90
1.00
0.10 0.15 0.20 0.25Capillary porosity at water
suction after heating to 600 °C
Rel
ativ
e w
eigt
h af
ter f
ire
c/p=0.58(u=0.034) c/p=0.73(u=0.053)c/p=0.80(u=0.039) c/p=0.87(u=0.069)c/p=1(u=0.034)
4 kg/m³
2 kg/m³
Figure 8.21 - Development of fire spalling versus capillary porosity at 20 °C after heating to 600 °C. Wfs = (-1.02·10-6·(T)²+0.000734·T+0.232)· (Pcap)(-2.22·10^-6·(T)^2+0.00144·T-0.644) (8.10) Pcap denotes capillary porosity at suction T denotes temperature at heating (°C) Wfs denotes relative weight after fire spalling of
air-cured SCC with c/p=0.58
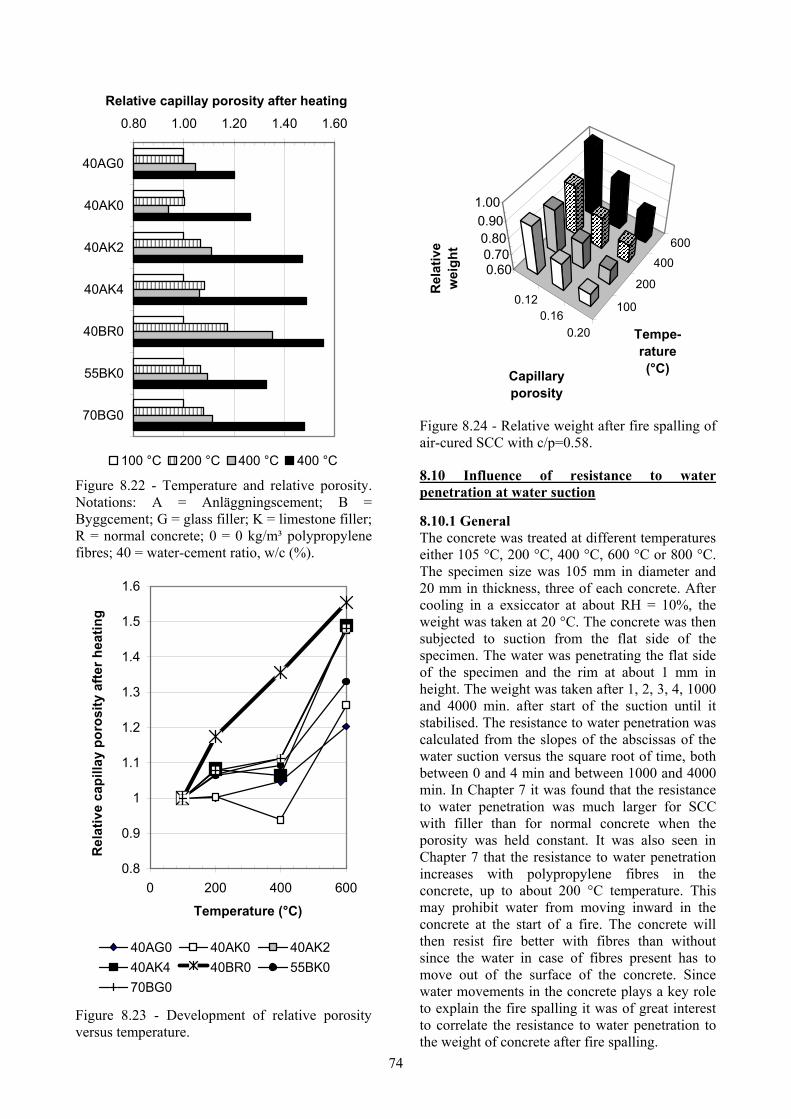
74
0.80 1.00 1.20 1.40 1.60
40AG0
40AK0
40AK2
40AK4
40BR0
55BK0
70BG0
Relative capillay porosity after heating
100 °C 200 °C 400 °C 400 °C
Figure 8.22 - Temperature and relative porosity. Notations: A = Anläggningscement; B = Byggcement; G = glass filler; K = limestone filler; R = normal concrete; 0 = 0 kg/m³ polypropylene fibres; 40 = water-cement ratio, w/c (%).
0.8
0.9
1
1.1
1.2
1.3
1.4
1.5
1.6
0 200 400 600
Temperature (°C)
Rel
ativ
e ca
pilla
y po
rosi
ty a
fter h
eatin
g
40AG0 40AK0 40AK240AK4 40BR0 55BK070BG0
Figure 8.23 - Development of relative porosity versus temperature.
0.120.16
0.20
100
200
400
600
0.600.700.800.901.00
Rel
ativ
e w
eigh
t
Capillary porosity
Tempe-rature (°C)
Figure 8.24 - Relative weight after fire spalling of air-cured SCC with c/p=0.58.
8.10 Influence of resistance to water penetration at water suction
8.10.1 General The concrete was treated at different temperatures either 105 °C, 200 °C, 400 °C, 600 °C or 800 °C. The specimen size was 105 mm in diameter and 20 mm in thickness, three of each concrete. After cooling in a exsiccator at about RH = 10%, the weight was taken at 20 °C. The concrete was then subjected to suction from the flat side of the specimen. The water was penetrating the flat side of the specimen and the rim at about 1 mm in height. The weight was taken after 1, 2, 3, 4, 1000 and 4000 min. after start of the suction until it stabilised. The resistance to water penetration was calculated from the slopes of the abscissas of the water suction versus the square root of time, both between 0 and 4 min and between 1000 and 4000 min. In Chapter 7 it was found that the resistance to water penetration was much larger for SCC with filler than for normal concrete when the porosity was held constant. It was also seen in Chapter 7 that the resistance to water penetration increases with polypropylene fibres in the concrete, up to about 200 °C temperature. This may prohibit water from moving inward in the concrete at the start of a fire. The concrete will then resist fire better with fibres than without since the water in case of fibres present has to move out of the surface of the concrete. Since water movements in the concrete plays a key role to explain the fire spalling it was of great interest to correlate the resistance to water penetration to the weight of concrete after fire spalling.

75
8.10.2 Conditions after heating to 105 °C The resistance to water penetration at water suction, m, is easily measure and a good tool to judge whether the concrete is sensitive to fire spalling or not. Figure 8.25 shows the results obtained after heating to 105 °C and measuring at 20 °C. The following observations were done: • The resistance to water penetration at water
suction, m, was about twice as large for air-cured concrete as for water-cured concrete at the same amount of fire spalling.
• For air-cured concrete maximum m = 17 s/m²·106 was found to give more than 85%-weight after fire spalling occurred.
• For water-cured concrete maximum m = 8.5 s/m²·106 was found to give more than 85%-weight after fire spalling occurred.
• Early water curing probably decreased the porosity of the surface of the concrete affecting the resistance to water penetration at water suction, c.p. Chapter 7.
• For 2 kg/m³ of polypropylene fibre increase of the resistance to water penetration at water suction was observed.
• For 4 kg/m³ of polypropylene fibre slight decrease of the resistance to water penetration at water suction was observed.
0.60
0.70
0.80
0.90
1.00
0 5 10 15 20 25Resistance to water penetration
after heating to 105 °C (s/m²·10^6)
Rel
ativ
e w
eigt
h af
ter f
ire
c/p=0.58(u=0.034) c/p=0.73(u=0.053)c/p=0.80(u=0.039) c/p=0.87(u=0.069)c/p=1(u=0.034)
2 kg/m³
4 kg/m³
0 kg/m³
Water curing:
Air curing:
Figure 8.25 – Relative weight after fire spalling versus resistance to water penetration after heating to 105 °C and measuring at 20 °C. u = moisture content.
The following equation was evaluated in order to describe the fire spalling versus the resistance to water penetration at water suction: Wi = h·(m)j < 1 (8.11) i = A denotes air curing; = W denotes water
curing h,j denotes constants given in Table 8.11. m denotes the resistance to water penetration
at water suction (s/m²·106) W denotes the relative weight of concrete after
fire spalling Table 8.11 - Constants in equation (8.11). Air curing, A Water curing, W T (°C) h j T (°C) h j 100 4.29 -0.570 100 1.65 -0.300200 1.44 -0.220 200 1.22 -0.264400 2.12 -0.438 400 1.01 -0.328600 0.813 -0.164 600 2.65 3.70 It was probably the effect on hydration of the water curing that causes a lower resistance to water penetration at water suction in water-cured than in air-cured. However, for durability reasons it is preferred to cure the concrete well with water. For indoor use it seems an advantage to avoid too long water curing in order to limit the fire spalling of the concrete. It was also interesting to observe that the polypropylene fibres expands more than the concrete structure due to larger coefficient of thermal expansion and in a way tightened up the pores as regards water transports.
8.10.3 Conditions after heating to 200 °C Figure 8.26 shows the performance of fire spalling versus the resistance to water penetration at water suction. Two-hundred °C is an interesting temperature since fire spalling occurs around this temperature. The polypropylene fibres are supposed to melt at about 170 °C but then become solid again as the temperature drops to 20 °C. The observations were as follows: • The resistance to water penetration at water
suction, m, was more than twice as large for air-cured concrete as for water-cured concrete at the same amount of fire spalling.
• For air-cured concrete maximum m = 10 s/m²·106 was found to give more than 85%-weight after fire spalling occurred.
• For water-cured concrete maximum m = 4.0 s/m²·106 was found to give more than 85%-weight after fire spalling occurred.
• Early water curing probably decreased the porosity of the surface of the concrete affecting the resistance to water penetration.

76
0.60
0.70
0.80
0.90
1.00
0 5 10 15
Resistance to water penetration after heating to 200 °C
(s/m²·10^6)
Rel
ativ
e w
eigt
h af
ter f
ire
c/p=0.58(u=0.034) c/p=0.73(u=0.053)
c/p=0.80(u=0.039) c/p=0.87(u=0.069)
c/p=1(u=0.034)
2 kg/m³ 4 kg/m³
0 kg/m³Water curing:
Air curing:
Figure 8.26 - Relative weight after fire spalling versus resistance to water penetration after heating to 200 °C and measuring at 20 °C. u = moisture content. • For 2 kg/m³ of polypropylene fibre increase
of the resistance to water penetration at water suction was observed.
• For 4 kg/m³ of polypropylene fibre a substantial increase of the resistance to water penetration at water suction was observed.
• Equation (8.10) describes the fire spalling.
8.10.4 Conditions after heating to 400 °C Figure 8.27 shows the performance of fire spalling versus the resistance to water penetration at water suction. Four-hundred °C also is an interesting temperature since fire spalling certainly has occurred at lower temperature. The polypropylene fibres have melted and it is questioned if they evaporates or become solid again as the temperature drops to 20 °C. The observations were as follows: • The resistance to water penetration at water
suction, m, was more than four times as large for air-cured concrete as for water-cured concrete at the same amount of fire spalling.
• For air-cured concrete maximum m = 8.0 s/m²·106 was found to give more than 85%-weight after fire spalling occurred.
• For water-cured concrete maximum m = 2.0 s/m²·106 was found to give more than 85%-weight after fire spalling occurred.
• Early water curing probably decreased the porosity of the surface of the concrete affecting the resistance to water penetration at water suction, c.p. Chapter 7.
• For 2-4 kg/m³ of polypropylene fibre substantial decrease of the resistance to water penetration at water suction was observed.
• The decrease of resistance to water penetration shows that the fibres evaporate.
0.60
0.70
0.80
0.90
1.00
0 5 10Resistance to water penetration
after heating to 400 °C (s/m²·10^6)
Rel
ativ
e w
eigt
h af
ter f
ire
c/p=0.58(u=0.034) c/p=0.73(u=0.053)
c/p=0.80(u=0.039) c/p=0.87(u=0.069)
c/p=1(u=0.034)
Water curing:
Air curing:
2 kg/m³
4 kg/m³
0 kg/m³
Figure 8.27 - Relative weight after fire spalling versus resistance to water penetration after heating to 400 °C and measuring at 20 °C. u = moisture content..
8.10.5 Conditions after heating to 600 °C At 600 °C both the quartzite transformation and the release of carbon-dioxide from the limestone powder has taken place leaving large porosity in the concrete and thus decreasing the resistance to water penetration at water suction substantially. Figure 8.28 shows the fire spalling versus the resistance to water penetration at water suction after heating to 600 °C. The observations were as follows: • The resistance to water penetration at water
suction, m, was the same for air-cured concrete as for water-cured concrete at the same amount of fire spalling.

77
• For air-cured and for water-cured concrete maximum m = 0.7 s/m²·106 was found to give more than 85%-weight after fire spalling occurred.
• For 2-4 kg/m³ of polypropylene fibre the concrete did not show any difference in the resistance to water penetration at water suction compared with no fibres.
0.60
0.70
0.80
0.90
1.00
0.00 0.50 1.00Resistance to water penetration
after heating to 600 °C (s/m²·10^6)
Rel
ativ
e w
eigt
h af
ter f
ire
c/p=0.58(u=0.034) c/p=0.73(u=0.053)
c/p=0.80(u=0.039) c/p=0.87(u=0.069)
c/p=1(u=0.034)
Water curing:
Air curing:
0 kg/m³
2 kg/m³
4 kg/m³
Figure 8.28 - Relative weight after fire spalling versus resistance to water penetration after heating to 600 °C and measuring at 20 °C. u = moisture content.
8.10.6 Summary of influence of resistance to water penetration at water suction Figures 8.29-30 show a summary of the development of relative resistance to water penetration at water suction. The following equations were evaluated for the relative weight after fire, Figures 8.31-32: WA = 8.27·T(-0.36)·(m)(-0.000124·T-0.27) (8.12) WB = 106·T (-0.731) ·(m)(0.00053·T-0.52 (8.13) m denotes resistance to water penetration at
water suction on fire spalling (s/m²·106) B denotes air curing of concrete B T denotes temperature (°C) A denotes water curing of concrete A
0.00 0.20 0.40 0.60 0.80 1.00 1.20
40AG0
40AK0
40AK2
40AK4
40BR0
55BK0
70BG0
70BK0
Relative resistance to water penetration after heating
100 °C 200 °C 400 °C 600 °C
Figure 8.29 - Development of relative resistance to water penetration.
0.00
0.20
0.40
0.60
0.80
1.00
1.20
1.40
0 200 400 600
Temperature (°C)
Rel
ativ
e re
sist
ance
to w
ater
pen
etra
tion
40AG0 40AK0 40AK240AK4 40BR0 55BK070BG0 70BK0
Figure 8.30 - Development of relative resistance to water penetration at water suction at different temperatures.

78
100
200
400
600
812
16
0.60
0.80
1.00
Rela
tive
wei
ght
(air
curin
g)
T (°C)m
(s/m²·10^6)
Figure 8.31 - Calculations with equation (8.13). m = resistance to water penetration (s/m²·106).
261014100
200
400
0.60
0.80
1.00
Rela
tive
wei
ght
m (s/m²·10^6)
T (°C)
Figure 8.32 - Calculations with equation (8.12). m = resistance to water penetration (s/m²·106).
8.11 Amount of fibres to prevent fire spalling of 200-mm square reinforced columns
8.11.1 Calculation based on the cement content and the fibre content A synthesis was required for the amount of fibres in combination with w/c and the cement-powder ratio, c/p. Figure 8.33 shows the weight after fire spalling independent of type of curing and cement type versus c/p, w/c and amount of fibres [94]. From Figure 8.33 the following equation was estimated for the relative weight of concrete without fibres after fire, W (no fibres): W = (-5.29·(c/p)² + 6.80·(c/p) - 1.62)·(w/c)+0.115·exp(2.11·c/p) (8.14) Figure 8.34 and Table 8.12 show the resulting weight after fire of concrete without fibres as a result of equation (8.13). For concrete with 2 kg/m³ polypropylene fibres the results shown in Table 8.13 were obtained from equation (8.13) and Figure 8.33. Figure 8.35 shows the weight after fire of concrete with 2 kg/m³ fibres based on results in Figure 8.33 combined with equation (8.13) and Table 8.13. Figure 8.36 and Table 8.14 show the required amount of fibres in order to limit the amount of fire spalling of SCC to that of normal concrete without fibres, based on Figures 8.34-35. It is shown in Table 8.14 that the c/p-ratio substantially affected the fibre requirement. From Figures 8.34-36 and Table 8.14 the following equation for the amount of 32 µm fibres, ppfnormal, to limit the fire spalling of SCC to the same level of normal concrete without fibres was obtained ( kg/m³): ppfnormal=(28·(c/p)²-26·(c/p)-2.4)·ln(w/c)+ 45·(c/p)²- 68·(c/p)+23 > 0 (8.15) Table 8.12 - Weight after fire of concrete without fibres as a result of equation (8.13). c/p= w/c 0.50 0.60 0.70 0.80 0.90 1.00 0.40 0.51 0.63 0.72 0.80 0.85 0.90 0.50 0.56 0.69 0.78 0.84 0.88 0.89 0.60 0.60 0.74 0.83 0.88 0.90 0.88 0.70 0.65 0.80 0.89 0.93 0.92 0.87 Table 8.13 - Weight after fire of concrete with 2 kg/m³ fibres as a result of equation (8.13). c/p= w/c 0.50 0.60 0.70 0.80 0.90 1.00 0.40 0.62 0.74 0.83 0.91 0.96 1 0.50 0.68 0.81 0.90 0.96 1 1 0.60 0.73 0.87 0.94 1 1 1 0.70 0.79 0.94 1 1 1 1

79
0.60
0.70
0.80
0.90
1.00
0.40 0.50 0.60 0.70w/c
Wei
ght a
fter
fire
spal
ling
c/p=0.5-pf=4 c/p=0.6-pf=0c/p=0.6-pf=2 c/p=0.6-pf=4c/p=0.75-pf=0 c/p=0.75-pf=2c/p=0.75-pf=4 c/p=0.85-pf=0c/p=1-pf=0
c/p=0.6c/p=0.75
c/p=0.6-pf=2c/p=1
Figure 8.33 – Relative weight after fire spalling versus cement-powder ratio, c/p, w/c, and amount of fibres, ppf (kg/m³) [94]. Table 8.14 - Fibres to obtain the same weight of SCC after fire spalling like for normal concrete (kg/m³). c/p = w/c 0.60 0.70 0.80 0.90 1.00 0.40 5.8 4.0 2.6 1.5 0.50 4.1 2.5 1.4 0.8 0.60 2.7 1.2 0.70 1.4
0.400.500.600.70
0.60
0.70
0.80
0.90
0.0
2.0
4.0
6.0
Fibr
es (n
orm
al,k
g/m
³)
w/cc/p
Figure 8.36 - Fibres in order to limit the fire spalling of SCC to the same level of normal concrete without fibres versus the cement-powder ratio, c/p, and the water-cement ratio, w/c.
The lowest observed weight of normal concrete after fire was 85% of the original weight. Therefore an alternative estimation of the amount of fibres was done in this case based on 85% remaining weight after fire compared with the original one, Table 8.15 and Figure 8.37. The following equation was obtained in order to simulate 85% remaining weight: ppf85%=(-35·(c/p)²+34.9·(c/p)-16.7)·ln(w/c)-25·(c/p)+11.7 > 0 (8.16) c/p denotes the cement-powder ratio ppf85% denotes the amount of 32 µm fibres in
order to obtain 85% weight of the original one after fire spalling (kg/m³)
w/c denotes the water-cement ratio Table 8.15 - Fibres to obtain 85% remaining weight after fire spalling (kg/m³). c/p = w/c 0.60 0.70 0.80 0.90 1.00 0.40 4.2 2.4 1.0 0.50 2.0 0.60 0.9 0.70
0.40
0.50
0.60
0.70
0.60
0.70
0.80
0.90
0.0
2.0
4.0
6.0
Fibr
es (1
5%
spal
ling,
kg/m
³)
w/cc/p
Figure 8.37 - Fibres based on 85% remaining weight after fire compared with the original one.
8.11.2 Calculation based on the Portland cement content and the fibre content Another synthesis was done for the amount of fibres combined with the water-Portland cement ratio, w/Pc, and the Portland cement-powder ratio, Pc/p, Figure 8.38 [94]. From Figure 8.38 the following equation was estimated for the relative weight of concrete without fibres after fire:

80
W = (-0.336·(Pc/p)² -0.375·(Pc/p) +0.762)·(w/Pc) + 0.182·exp(1.67·Pc/p) - 0.02 (8.17) w/Pc denotes the water-Portland cement ratio Pc/p denotes the Portland cement-powder ratio W denotes the relative weight of concrete
without fibres after fire Figure 8.39 and Table 8.16 show the weight after fire of concrete without fibres based on equation (8.16). For concrete with 2 kg/m³ polypropylene fibres results shown in Table 8.17 and Figure 8.40 were obtained. Figure 8.38 gave the amount of 32 µm fibre required for the same fire spalling of SCC like for normal, Figure 8.41 and Table 8.18: ppfnormal =(13·(Pc/p)-12.3)·ln(w/Pc)-2.69·(Pc/p)² +2.65·(Pc/p) – 0.2 > 0 (8.18) ppfnormal 32 µm fibres to obtain the same weight
after fire of SCC for like normal (kg/m³)
w/Pc denotes the water-Portland cement ratio Pc/p denotes Portland cement-powder ratio.
0.60
0.70
0.80
0.90
1.00
0.40 0.60 0.80w/Pc
Wei
ght a
fter f
ire s
palli
ng
Pc/p=0.4-ppf=4 Pc/p=0.5Pc/p=0.5-ppf=2 Pc/p=0.5-ppf=4Pc/p=0.70 Pc/p=0.7-ppf=2Pc/p=0.7-ppf=4 Pc/p=0.85Pc/p=1
Pc/p=0.5Pc/p=0.7
Pc/p=0.5-pf=2Pc/p=0.85
Figure 8.38 – Relative weight after fire spalling versus cement-powder ratio, Pc/p, w/Pc, and amount of fibres (kg/m³) [94].
0.40
0.50
0.60
0.70
0.800.
500.
600.
700.
85
0.0
2.0
4.0
6.0
Fibr
e (n
orm
al,k
g/m
³)
w/PcPc/p
Figure 8.41 - Fibre amount required for the same fire spalling of SCC like for normal concrete. Figure 8.42 and Table 8.19 show fibres to limit fire spalling at 15% of original weight (kg/m³): ppf85%=(-43·(Pc/p)²+72·(Pc/p)-31)·ln(w/Pc) -14·(Pc/p)²+18.7·(Pc/p)-6.2 (8.19) ppf85% denotes the amount of 32 µm fibres to
obtain 85% weight after fire of SCC of the original one (kg/m³).
w/Pc denotes the water-Portland cement ratio Pc/p denotes Portland cement-powder ratio

81
0.40
0.50
0.60
0.70
0.800.
500.
600.
700.
85
0.0
2.0
4.0
6.0
Fibr
e (1
5%
spal
ling,
kg/m
³)
w/PcPc/p
Figure 8.42 - Fibres in order to limit the amount of fire spalling to 15% of the original weight. Table 8.16 - Weight after fire of concrete without fibres as a result of equation (8.15). Pc/p = w/Pc 0.50 0.60 0.70 0.85 1.00 0.40 0.61 0.66 0.72 0.83 0.98 0.50 0.66 0.70 0.75 0.85 0.99 0.60 0.71 0.74 0.79 0.87 0.99 0.70 0.76 0.79 0.82 0.89 1.00 0.80 0.81 0.83 0.85 0.91 1.00 Table 8.17 - Weight after fire of concrete with 2 kg/m³ fibres as a result of equation (8.16). Pc/p = w/Pc 0.50 0.60 0.70 0.85 1.00 0.40 0.70 0.75 0.81 0.92 1 0.50 0.77 0.81 0.85 0.95 1 0.60 0.83 0.86 0.90 0.99 1 0.70 0.89 0.91 0.95 1 1 0.80 0.95 0.97 0.99 1 1 Table 8.18 - Amount of fibres to limit the amount of fire spalling to that of normal concrete (kg/m³). Pc/p = w/Pc 0.50 0.60 0.70 0.85 1.00 0.40 5.4 4.5 3.3 1.1 0.50 4.5 3.8 2.8 0.9 0.60 3.6 3.0 2.3 0.7 0.70 2.2 1.9 1.4 0.80 1.7 1.4 1.1
Table 8.19 - Amount of fibres to limit the fire spalling to 15% of the original weight (kg/m³). Pc/p = w/Pc 0.50 0.60 0.70 0.85 1.00 0.40 4.7 3.8 2.6 0.50 3.6 2.9 1.9 0.60 2.6 2.0 1.2 0.70 1.4 1.0 0.80
8.11.3 Comparison between results with equations and experiments It was important to compare the results with equations (8.14) and (8.17) and the experiments. Figure 8.43 and 8.44 show the calculated weight of the concrete versus the measured weight after fire spalling. Equation (8.17) showed the highest significance probably since it was based on the Portland cement content.
0.7
0.8
0.9
1
0.7 0.8 0.9 1
Measured relative weigth after fire
Estim
ated
rela
tive
wei
gth
afte
r fir
e
Figure 8.43 – With equation (8.14) calculated weight of the concrete versus the measured weight after fire spalling.
0.7
0.8
0.9
1
0.7 0.8 0.9 1
Measured relative weigth after fire
Estim
ated
rela
tive
wei
gth
afte
r fir
e
Figure 8.44 – With equation (8.17) calculated weight of the concrete versus the measured weight after fire spalling.

82
8.12 Evaluation of equations
8.12.1 General It was important to evaluate the equations ion order to confirm the validity and the limits of application. Reference are given to main Chapters.
8.12.2 Previous research Tensile strength after heating: Table 8.20 shows an evaluation of equation (2.1): fct,T/fct,20=-0.000001·T2-0.0003·T+0.95 (2.1) fct,T denotes split tensile strength at elevated
temperature (=1 at 20 °C) fct,20 denotes tensile strength at 20 °C T denotes temperature (20 < T < 800 °C) Table 8.20 - An evaluation of equation (2.1): Temperature (°C) fct,T/fct,20 fct,T20/fct,20 100 0.91 0.99 200 0.85 0.91 300 0.77 0.81 400 0.67 0.69 500 0.55 0.56 600 0.41 0.41 700 0.25 0.25 800 0.07 0.07 Table 8.20 shows an evaluation of equation (2.2): fct,T20/fct,20=-0.0000008·T2- 0.0006·T+ 1.06 (2.2) fct,T20 denotes split tensile strength at 20 °C after
cooling from the elevated temperature fct,20 denotes tensile strength at 20 °C T denotes temperature (20 < T < 800 °C) Creep at varying temperatures and temperature gradients:
Table 8.21 shows the temperature development with ISO 834 fire, equation (2.3): T = 345·log(480·t+1)+20 (2.3)
t denotes time (h)
T denotes fire temperature (°C)
The torsional creep is shown in Table 8.22: Cto=(0.0013·T-0.040)·ln(t)+ 0.0000056·T² + 0.0023·T + 0.06 (2.4) Cto denotes torsional creep (rad/mm) t denotes elapsed time (h) T denotes temperature (20 < T < 400 °C)
Table 8.21 - The temperature development with ISO 834 fire, equation (2.3). Time (h) T (°C) 0.1 603 0.2 705 0.3 766 0.4 809 0.5 842 0.6 869 0.7 892 0.8 912 0.9 930 1 945 Table 8.22 - The torsional creep according to equation (2.4).
Time (h) T (°C) 1 2 3 4 20 0.1 0.1 0.1 0.1 100 0.3 0.4 0.4 0.5 200 0.7 0.9 1.0 1.0 300 1.3 1.5 1.6 1.7 400 1.9 2.2 2.4 2.5 Explosive fire spalling of normal concrete: Table 8.23 shows the critical moisture level at fire spalling of concrete, equation (2.5): u = 0.000617·σ³ + 0.0341·σ² - 0.638·σ + 7 (2.5) u denotes moisture content (%) σ denotes stress (0 < σ < 25 MPa) Table 8.23 - The critical moisture levels at fire spalling of concrete, equation (2.5). Stress (MPa) Moisture content (%) 1 6.4 2 5.9 3 5.4 4 5.0 5 4.6 10 3.4 15 3.0 20 2.9 25 2.7
8.12.3-4 Material and methods No equations are available.
8.12.5 Analysis Grading of particles in fresh concrete: The particle grading of fresh NC was foreseen, Table 8.24 and equation (5.1). Table 8.25 shows the particle grading of the fresh SCC that was studied in the project, equation (5.1). s = a·db {0.125 < d < 0.7·dmax} (5.1) s denotes particle passing through

83
a 38% b constant according to Table 5.1 d particle diameter (0.1 < d < 10 mm) K cube strength of concrete (MPa) Table 5.1 - Constant b in equation (5.1) K 25 60 90 120 150 b 0.32 0.24 0.20 0.18 0.16 Table 8.24 - Grading of particle in fresh NC, equation (5.1). K = 150-mm cube strength. d (mm) K25 K60 K90 K120 K150 0.125 0.20 0.23 0.25 0.26 0.27 0.25 0.24 0.27 0.29 0.30 0.30 0.5 0.30 0.32 0.33 0.34 0.34 1 0.38 0.38 0.38 0.38 0.38 2 0.47 0.45 0.44 0.43 0.42 4 0.59 0.53 0.50 0.49 0.47 5.6 0.66 0.57 0.54 0.52 0.50 11.2 0.82 0.68 0.62 0.59 0.56 K = 150-mm cube strength. Table 8.25 - Particle grading of fresh SCC that was studied in the project, equation (5.1). d SCC0-
K30 SCC0-K60
SCC2-K30
SCC2-K60
SCC4-K30
SCC4-K60
0.13 0.27 0.29 0.28 0.30 0.31 0.33 0.25 0.32 0.34 0.33 0.35 0.38 0.39 0.50 0.39 0.40 0.40 0.41 0.46 0.47 1 0.47 0.47 0.48 0.48 0.55 0.55 2 0.57 0.56 0.57 0.56 0.66 0.65 4 0.68 0.66 0.69 0.66 0.80 0.77 5.6 0.75 0.71 0.75 0.71 0.88 0.83 11.2 0.90 0.84 0.90 0.84 1.00 0.98 K = cube strength. SCC2 = Self-Compacting Concrete (2 kg/m³ polypropylene fibres. Effect of fibres and filler on strength: Table 8.26 shows the effect of fibres on strength, equation (5.2): fc28ppf = fc280·(1-0.023·ppf) (5.2) ppf denotes amount of polypropylene fibre (0
< pp f <4 kg/m³) fc28ppf denotes 28-day strength (fibre, MPa) fc280 denotes 28-day strength (no fibre, 30 <
fc280 < 80 MPa) Table 8.27 shows the effect of fibres, eq. (5.3): fc28f = fc280 + f·0.07 (5.3) f denotes filler (0 < f < 250 kg/m³) fc28f denotes 28-day strength with filler (MPa) fc280 denotes 28-day strength (no filler, MPa)
Table 8.26 - Effect of fibres on strength, equation (5.2). Strength (MPa)
Fibres (kg/m³)
1 2 3 4 30 29.3 28.6 27.9 27.2 40 39.1 38.2 37.2 36.3 40 39.1 38.2 37.2 36.3 60 58.6 57.2 55.9 54.5 70 68.4 66.8 65.2 63.6 80 78.2 76.3 74.5 72.6 Table 8.27 shows the effect of fibres, equation (5.3). Strength Filler (kg/m³) (MPa) 50 100 150 200 30 33.5 37 40.5 44 40 43.5 47 50.5 54 40 43.5 47 50.5 54 60 63.5 67 70.5 74 70 73.5 77 80.5 84 80 83.5 87 90.5 94 Elastic modulus, strength and strain at maximum strength: The following formula was obtained for the relative hot properties at elevated temperature, Table 8.28, equation (5.6): r = c · T² + e ·T + g (5.6) c,e,g constants for hot and residual properties
of concrete at and after elevated temperatures given in Table 5.4.
r denotes residual and hot relative properties of concrete at and after elevated temperatures.
T denotes temperature (20 < T < 800 °C). Table 5.4 – Constants in equation (5.2). Property Constant Hot Residual
a 0.0000013 0.0000008 c - 0.00221 -0.00196
E-modulus
g 1.04 1.06 a -0.0000012 -0.0000005 c - 0.000131 - 0.000729
Strength
g 0.99 1.01 a -0.0000022 0.0000035 c 0.00279 - 0.000301
Strain
g 0.95 1 Table 8.28 shows the relative hot properties at elevated temperature, equation (5.6). Table 2.29 shows the relative residual properties after treatment at elevated temperature, equation (5.6).
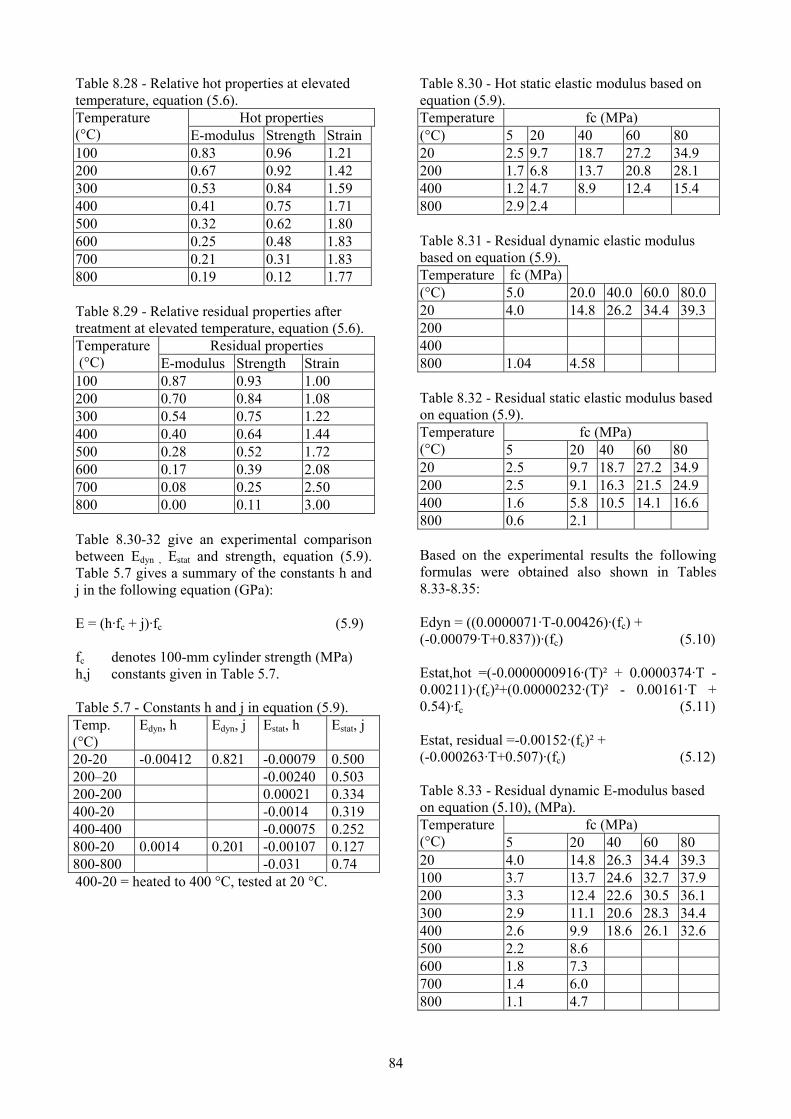
84
Table 8.28 - Relative hot properties at elevated temperature, equation (5.6).
Hot properties Temperature (°C) E-modulus Strength Strain 100 0.83 0.96 1.21 200 0.67 0.92 1.42 300 0.53 0.84 1.59 400 0.41 0.75 1.71 500 0.32 0.62 1.80 600 0.25 0.48 1.83 700 0.21 0.31 1.83 800 0.19 0.12 1.77 Table 8.29 - Relative residual properties after treatment at elevated temperature, equation (5.6).
Residual properties Temperature (°C) E-modulus Strength Strain 100 0.87 0.93 1.00 200 0.70 0.84 1.08 300 0.54 0.75 1.22 400 0.40 0.64 1.44 500 0.28 0.52 1.72 600 0.17 0.39 2.08 700 0.08 0.25 2.50 800 0.00 0.11 3.00 Table 8.30-32 give an experimental comparison between Edyn , Estat and strength, equation (5.9). Table 5.7 gives a summary of the constants h and j in the following equation (GPa): E = (h·fc + j)·fc (5.9) fc denotes 100-mm cylinder strength (MPa) h,j constants given in Table 5.7. Table 5.7 - Constants h and j in equation (5.9). Temp. (°C)
Edyn, h Edyn, j Estat, h Estat, j
20-20 -0.00412 0.821 -0.00079 0.500 200–20 -0.00240 0.503 200-200 0.00021 0.334 400-20 -0.0014 0.319 400-400 -0.00075 0.252 800-20 0.0014 0.201 -0.00107 0.127 800-800 -0.031 0.74 400-20 = heated to 400 °C, tested at 20 °C.
Table 8.30 - Hot static elastic modulus based on equation (5.9). Temperature fc (MPa) (°C) 5 20 40 60 80 20 2.5 9.7 18.7 27.2 34.9 200 1.7 6.8 13.7 20.8 28.1 400 1.2 4.7 8.9 12.4 15.4 800 2.9 2.4 Table 8.31 - Residual dynamic elastic modulus based on equation (5.9). Temperature fc (MPa) (°C) 5.0 20.0 40.0 60.0 80.0 20 4.0 14.8 26.2 34.4 39.3 200 400 800 1.04 4.58 Table 8.32 - Residual static elastic modulus based on equation (5.9).
fc (MPa) Temperature (°C) 5 20 40 60 80 20 2.5 9.7 18.7 27.2 34.9 200 2.5 9.1 16.3 21.5 24.9 400 1.6 5.8 10.5 14.1 16.6 800 0.6 2.1 Based on the experimental results the following formulas were obtained also shown in Tables 8.33-8.35: Edyn = ((0.0000071·T-0.00426)·(fc) + (-0.00079·T+0.837))·(fc) (5.10) Estat,hot =(-0.0000000916·(T)² + 0.0000374·T - 0.00211)·(fc)²+(0.00000232·(T)² - 0.00161·T + 0.54)·fc (5.11) Estat, residual =-0.00152·(fc)² + (-0.000263·T+0.507)·(fc) (5.12) Table 8.33 - Residual dynamic E-modulus based on equation (5.10), (MPa).
fc (MPa) Temperature (°C) 5 20 40 60 80 20 4.0 14.8 26.3 34.4 39.3 100 3.7 13.7 24.6 32.7 37.9 200 3.3 12.4 22.6 30.5 36.1 300 2.9 11.1 20.6 28.3 34.4 400 2.6 9.9 18.6 26.1 32.6 500 2.2 8.6 600 1.8 7.3 700 1.4 6.0 800 1.1 4.7
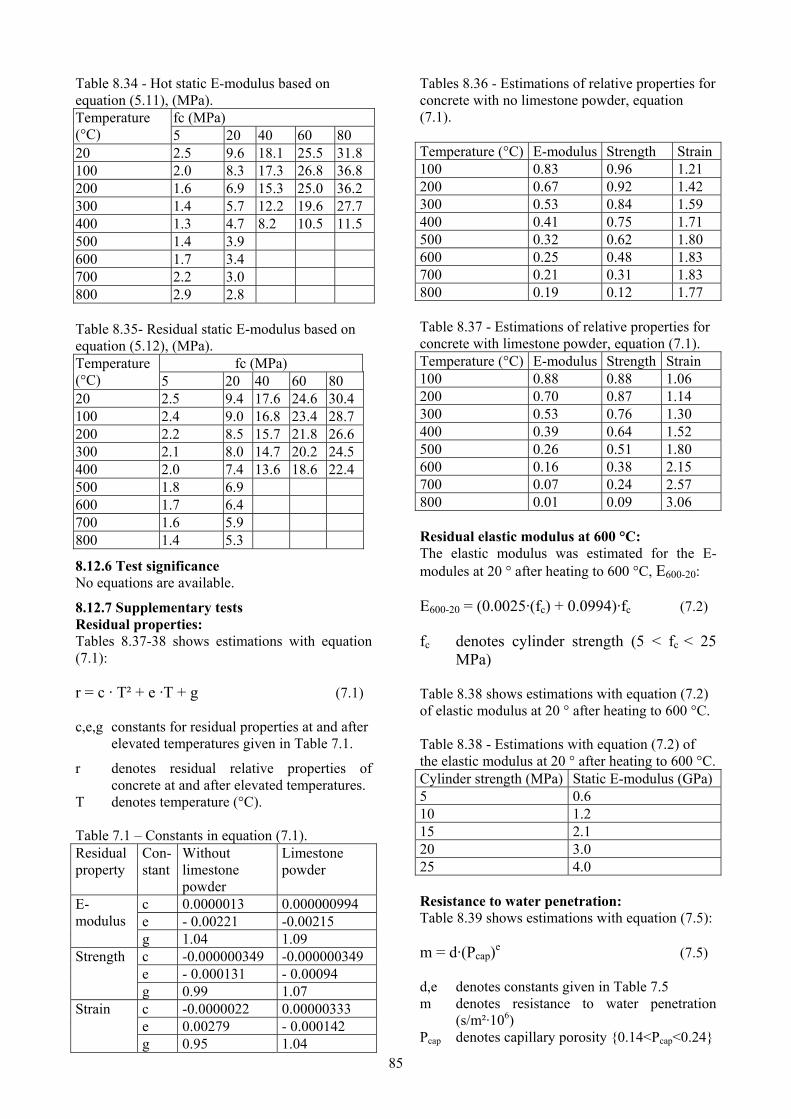
85
Table 8.34 - Hot static E-modulus based on equation (5.11), (MPa).
fc (MPa) Temperature (°C) 5 20 40 60 80 20 2.5 9.6 18.1 25.5 31.8 100 2.0 8.3 17.3 26.8 36.8 200 1.6 6.9 15.3 25.0 36.2 300 1.4 5.7 12.2 19.6 27.7 400 1.3 4.7 8.2 10.5 11.5 500 1.4 3.9 600 1.7 3.4 700 2.2 3.0 800 2.9 2.8 Table 8.35- Residual static E-modulus based on equation (5.12), (MPa).
fc (MPa) Temperature (°C) 5 20 40 60 80 20 2.5 9.4 17.6 24.6 30.4 100 2.4 9.0 16.8 23.4 28.7 200 2.2 8.5 15.7 21.8 26.6 300 2.1 8.0 14.7 20.2 24.5 400 2.0 7.4 13.6 18.6 22.4 500 1.8 6.9 600 1.7 6.4 700 1.6 5.9 800 1.4 5.3
8.12.6 Test significance No equations are available.
8.12.7 Supplementary tests Residual properties: Tables 8.37-38 shows estimations with equation (7.1): r = c · T² + e ·T + g (7.1) c,e,g constants for residual properties at and after
elevated temperatures given in Table 7.1.
r denotes residual relative properties of concrete at and after elevated temperatures.
T denotes temperature (°C). Table 7.1 – Constants in equation (7.1). Residual property
Con-stant
Without limestone powder
Limestone powder
c 0.0000013 0.000000994 e - 0.00221 -0.00215
E-modulus
g 1.04 1.09 c -0.000000349 -0.000000349 e - 0.000131 - 0.00094
Strength
g 0.99 1.07 c -0.0000022 0.00000333 e 0.00279 - 0.000142
Strain
g 0.95 1.04
Tables 8.36 - Estimations of relative properties for concrete with no limestone powder, equation (7.1). Temperature (°C) E-modulus Strength Strain 100 0.83 0.96 1.21 200 0.67 0.92 1.42 300 0.53 0.84 1.59 400 0.41 0.75 1.71 500 0.32 0.62 1.80 600 0.25 0.48 1.83 700 0.21 0.31 1.83 800 0.19 0.12 1.77 Table 8.37 - Estimations of relative properties for concrete with limestone powder, equation (7.1). Temperature (°C) E-modulus Strength Strain 100 0.88 0.88 1.06 200 0.70 0.87 1.14 300 0.53 0.76 1.30 400 0.39 0.64 1.52 500 0.26 0.51 1.80 600 0.16 0.38 2.15 700 0.07 0.24 2.57 800 0.01 0.09 3.06 Residual elastic modulus at 600 °C: The elastic modulus was estimated for the E-modules at 20 ° after heating to 600 °C, E600-20: E600-20 = (0.0025·(fc) + 0.0994)·fc (7.2) fc denotes cylinder strength (5 < fc < 25
MPa) Table 8.38 shows estimations with equation (7.2) of elastic modulus at 20 ° after heating to 600 °C. Table 8.38 - Estimations with equation (7.2) of the elastic modulus at 20 ° after heating to 600 °C. Cylinder strength (MPa) Static E-modulus (GPa) 5 0.6 10 1.2 15 2.1 20 3.0 25 4.0 Resistance to water penetration: Table 8.39 shows estimations with equation (7.5): m = d·(Pcap)e (7.5) d,e denotes constants given in Table 7.5 m denotes resistance to water penetration
(s/m²·106) Pcap denotes capillary porosity {0.14<Pcap<0.24}

86
Table 8.39 - Estimations of resistance to water penetration with equation (7.5) (s/m²·106). Porosity Normal - air SCC - air SCC - water 0.12 18.5 0.14 7.7 20.9 0.16 3.6 9.1 7.0 0.18 1.8 4.4 2.1 0.20 1.0 2.3 0.7 0.22 0.6 1.2 0.3 0.24 0.4 0.7 0.1
8.12.8 Discussion Temperature of saturation: Table 8.40 shows estimations with equation (8.1): Tsat =115·(1.07-RH )·exp((2.52-0.95·RH)·w/c)) (8.1) w/c denotes water-cement ratio (0.35 < w/c <
0.75) RH denotes RH before fire (0.30 < RH < 0.90) Tsat denotes temperature of saturation (°C). Table 8.40 - Estimations of temperature of saturation with equation (8.1) (°C). RH before heating w/c 0.35 0.45 0.55 0.65 0.75 0.35 178 148 120 94 69 0.40 199 165 133 103 76 0.45 222 183 147 114 83 0.50 247 203 162 125 91 0.55 225 179 138 99 0.60 250 198 151 109 0.65 219 166 119 0.70 242 183 130 0.75 268 201 143 Relative weight after fire spalling: Table 8.41 shows the relative weight of the concrete A with type I cement (water curing), equation (8.2): WA = 2.39·(w/p) - 0.019 (8.2) w/p denotes water-powder ratio (0.25 < w/p <
0.40) WA denotes weight after fire spalling concrete A Table 8.41 - The relative weight of the concrete A with type I cement (water curing), equation (8.2). w/p Relative weight after fire0.25 0.58 0.30 0.70 0.35 0.82 0.40 0.94
Parameter study: Table 8.42 shows estimations with equation (8.3) of a parameter study of the weight after fire spalling of concrete A with type I cement without fibres: n = k·(1-W)+ m (8.3) c denotes cement content k, m denotes constants given in Table 8.2 f denotes filler content n denotes parameter in study p denotes powder content (cement + filler) W denotes weight after fire spalling Table 8.2 – Parameters in equation (8.3). Parameter, n k m Aggregate 11-16 mm/(10·p) -0.234 0.177 c/p -1.060 1.070 f/p 1.060 -0.070 w/p -0.411 0.411 Table 8.42 - Estimations with equation (8.3) of a parameter study of the weight after fire spalling of concrete A with type I cement without fibres Relative weight Aggr 11-16 mm/(10·p) c/p f/p w/p 0.60 0.08 0.65 0.35 0.250.70 0.11 0.75 0.25 0.290.80 0.13 0.86 0.14 0.330.90 0.15 0.96 0.04 0.37 Tables 8.43 -44 show estimations with equation (8.4) of a parameter study of the weight after fire spalling of concrete B with filler cement type II without fibres: s = q·(1-W)+ r (8.4) c denotes cement content f denotes filler content p denotes powder content (cement + filler) q, r denotes constants given in Table 8.3 s denotes parameter in study W denotes weight after fire spalling Table 8.3 – Parameters in equation (8.4). Parameter, s q r Aggregate /(10xp) -1.23 0.609 Aggregate 0-8 mm /(10xp) -0.917 0.394 Aggregate 8-11 mm /(10xp) -0.323 0.151 c/p -1.59 0.943 f/p 1.87 0.110 Moisture 0.0286 0.747 w/p -1.30 0.659

87
Table 8.43 - Estimations with equation (8.4) of a parameter study of the weight after fire spalling of concrete B with filler cement type II without fibres. Relative weight
Aggr/(10·p)
Aggr 0-8 mm/(10·p)
Aggr 8-11 mm/(10·p)
0.70 0.24 0.12 0.06 0.75 0.30 0.16 0.07 0.80 0.36 0.21 0.09 0.85 0.42 0.26 0.10 0.90 0.49 0.30 0.12 0.95 0.55 0.35 0.14 Table 8.44 - Estimations with equation (8.4) of a parameter study of the weight after fire spalling of concrete B with filler cement type II without fibres. Relative weight c/p f/p Moisture w/p 0.70 0.47 0.67 0.76 0.27 0.75 0.55 0.58 0.75 0.33 0.80 0.63 0.48 0.75 0.40 0.85 0.70 0.39 0.75 0.46 0.90 0.78 0.30 0.75 0.53 0.95 0.86 0.20 0.75 0.59 Effect of polypropylene fibres: Table 8.45 shows the effect of polypropylene fibres on the weight of the concrete A at w/p ≈ 0.29 after fire exposure calculated with equation (8.6): WA,w/p≈0.29= 0.82·(ppf)0.11 {0.2<f<4 kg/m³} (8.6) ppf denotes fibre (0.2 < f < 4 kg/m³) w/p denotes water-powder ratio (0.25 <
w/p < 0.40) WA,w/p≈0.29 denotes weight after fire of concrete
A with Type I cement w/p≈0.29. Table 8.45 - Effect of polypropylene fibres on the weight of the concrete A at w/p ≈ 0.29 after fire exposure calculated with equation (8.6). Fibres (kg/m³) Relative weight after fire0.2 0.69 1 0.82 2 0.88 3 0.93 4 0.96 Table 8.46 shows in the same way the relative weight of concrete B with type II cement, WB, versus fibre content and w/p based on equation (8.7):
WB = (1.5·(w/p)+0.32)·(ppf)(-0.19·(w/p)+0.11) (8.7) ppf denotes plastic fibres {0.2 < ppf < 4 kg/m³} w/p denotes the water-powder ratio WB denotes weight after fire spalling of
concrete B {0.30< w/p< 0.40} Table 8.46 - Relative weight of concrete B with type II cement, WB, versus fibre content and w/p based on equation (8.7).
w/p Fibres (kg/m³) 0.3 0.35 0.4 0.2 0.71 0.79 0.87 1 0.77 0.85 0.92 2 0.80 0.87 0.94 3 0.82 0.89 0.96 4 0.83 0.90 0.96 Effect of porosity on fire spalling: Table 8.47 shows the effect of porosity and temperature on weight after fire spalling based on equation (8.10): Wfs = (-1.02·10-6·(T)²+0.000734·T+0.232)· (Pcap)(-2.22·10^-6·(T)^2+0.00144·T-0.644) (8.10) Pcap denotes capillary porosity at suction T denotes temperature at heating (°C) Wfs denotes relative weight after fire spalling of
air-cured SCC with c/p=0.58. Table 8.47 - Effect of porosity and temperature on weight after fire spalling based on equation (8.10). Porosity Temperature (°C) Pcap 100 200 400 600 0.14 0.82 0.81 0.83 0.95 0.16 0.77 0.76 0.79 0.88 0.18 0.72 0.72 0.75 0.82 0.2 0.68 0.69 0.72 0.78 0.22 0.65 0.66 0.69 0.73 0.24 0.62 0.64 0.66 0.70 Effect of resistance to water penetration on fire spalling: Tables 8.48-49 shows the effect of resistance to water penetration and temperature on the relative weight after fire spalling based on equation (8.11): Wi = h·(m)j (8.11) i = A denotes air curing; = W denotes water
curing h,j denotes constants given in Table 8.11.
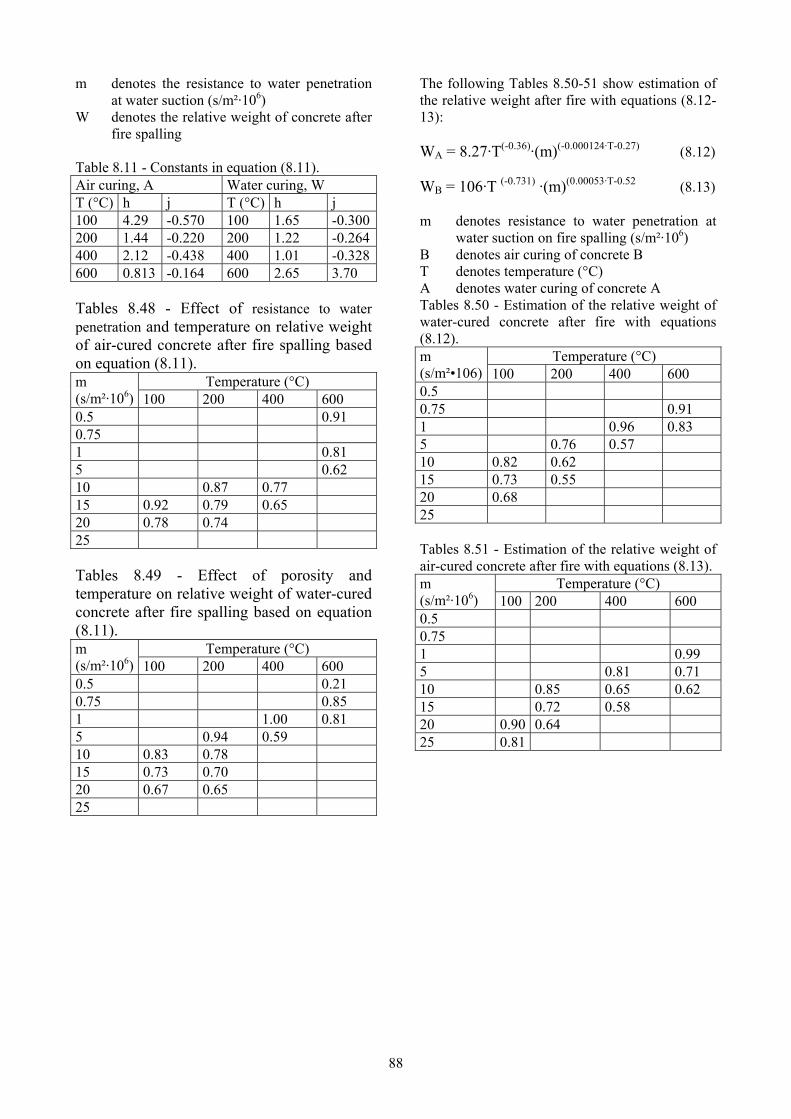
88
m denotes the resistance to water penetration at water suction (s/m²·106)
W denotes the relative weight of concrete after fire spalling
Table 8.11 - Constants in equation (8.11). Air curing, A Water curing, W T (°C) h j T (°C) h j 100 4.29 -0.570 100 1.65 -0.300200 1.44 -0.220 200 1.22 -0.264400 2.12 -0.438 400 1.01 -0.328600 0.813 -0.164 600 2.65 3.70 Tables 8.48 - Effect of resistance to water penetration and temperature on relative weight of air-cured concrete after fire spalling based on equation (8.11).
Temperature (°C) m (s/m²·106) 100 200 400 600 0.5 0.91 0.75 1 0.81 5 0.62 10 0.87 0.77 15 0.92 0.79 0.65 20 0.78 0.74 25 Tables 8.49 - Effect of porosity and temperature on relative weight of water-cured concrete after fire spalling based on equation (8.11).
Temperature (°C) m (s/m²·106) 100 200 400 600 0.5 0.21 0.75 0.85 1 1.00 0.81 5 0.94 0.59 10 0.83 0.78 15 0.73 0.70 20 0.67 0.65 25
The following Tables 8.50-51 show estimation of the relative weight after fire with equations (8.12-13): WA = 8.27·T(-0.36)·(m)(-0.000124·T-0.27) (8.12) WB = 106·T (-0.731) ·(m)(0.00053·T-0.52 (8.13) m denotes resistance to water penetration at
water suction on fire spalling (s/m²·106) B denotes air curing of concrete B T denotes temperature (°C) A denotes water curing of concrete A Tables 8.50 - Estimation of the relative weight of water-cured concrete after fire with equations (8.12).
Temperature (°C) m (s/m²•106) 100 200 400 600 0.5 0.75 0.91 1 0.96 0.83 5 0.76 0.57 10 0.82 0.62 15 0.73 0.55 20 0.68 25 Tables 8.51 - Estimation of the relative weight of air-cured concrete after fire with equations (8.13).
Temperature (°C) m (s/m²·106) 100 200 400 600 0.5 0.75 1 0.99 5 0.81 0.71 10 0.85 0.65 0.62 15 0.72 0.58 20 0.90 0.64 25 0.81

89
0.40 0.50 0.60 0.70
0.600.700.800.901.00
0.50
0.60
0.70
0.80
0.90
1.00
Rel
ativ
e w
eigt
h af
ter f
ire s
palli
ng
(no
fibre
s)
Water-cement ratio
c/p
Figure 8.34 – Resulting weight after fire of concrete without fibres as a result of equation (8.13).
0.40 0.50 0.60 0.70
0.600.
700.800.
901.00 0.50
0.60
0.70
0.80
0.90
1.00
Rel
ativ
e w
eigt
h af
ter f
ire s
palli
ng
(2 k
g/m
³ fib
res)
Water-cement ratio
c/p
Figure 8.35 - Weight after fire of concrete with 2 kg/m³ fibres based on results in Figure 8.33 combined with equation (8.13) and Table 8.12.
0.40 0.50 0.60 0.70 0.80
0.500.600.700.851.00
0.50
0.60
0.70
0.80
0.90
1.00
Rel
ativ
e w
eigt
h af
ter
fire
spal
ling
(no
fibre
s)
Water-Portland cement ratioPc/p
Figure 8.39 – Resulting weight after fire of concrete without fibres as a result of equation (8.15).
0.40 0.50 0.60 0.70 0.80
0.500.600.700.851.00
0.50
0.60
0.70
0.80
0.90
1.00
Rel
ativ
e w
eigt
h af
ter f
ire
spal
ling
(2 k
g/m
³ fib
res)
Water-Portland cement ratioPc/p
Figure 8.40 - Weight after fire of concrete with 2 kg/m³ fibres based on results in Figure 8.39 combined with equation (8.16) and Table 8.16.

90
9. CONCLUSIONS AND SYNTHESES
9.1 General This report describes experimental studies of the mechanical performance of Self-Compacting Concrete, SCC, under compressive loading at fire temperatures. The SCC contains different amounts of polypropylene fibre, different types of cement and air content, preconditioned either in the air or in water. The result of the studies was compared with the corresponding properties of normal concrete, with the same w/c and air content. Half a year’s or one year’s age applied at the time of testing. The strength development of the concrete was followed in parallel. Seven SCCs with w/c = 0.40, 0.55 or 0.70 and one normal concrete, NC, with w/c = 0.40 were studied for compressive strength in a fire temperature oven. The temperatures were 200 °C, 400 °C and 800 °C. Both testing at elevated temperature and after cooling took place. Elastic modulus, ultimate strain at maximum strength, dynamic modulus and relative humidity, RH, were studied in parallel. Supplementary tests of were performed, after cooling from 600 °C, of strength, elastic modulus, ultimate strain at maximum strength. Supplementary tests were also performed on capillary suction, porosity and resistance to water penetration at water suction. The results of the laboratory tests were compared with results of full-scale tests on twelve SCCs with w/c = 0.40, 0.55 or 0.70 and 4 NCs with w/c = 0.40, 0.55 or 0.70 on fire spalling carried out in a high-temperature oven. The same concrete was studied in the laboratory and in full-scale tests. The concrete was air-cured at an ambient RH = 60%, or water-cured from demoulding until testing. The effects of increased amount of polypropylene fibres, age, different types of cement and air content, capillary suction, porosity, moisture content, hydration losses, preconditioning either in the air or in water, were studied.
9.2 Mix proportions obtained at LTH One fundamental point was the way to produce concrete with polypropylene fibre. Therefore the principles of the mix proportions are given even though it may seem too detailed. These results are based on concrete mix proportions defined by the grading curves of the fresh SCC. More fine materials were required in SCC than in NC in order to incorporate 4 kg/m³ of fibres in the mixed proportions. With 2 kg/m³ more traditional mix proportions of SCC were used. However, with 4 kg/m³ of polypropylene fibres the workability decreased rapidly in the concrete.
9.3 Mechanical properties obtained at LTH Glass or limestone filler additives increased strength substantially at normal temperature even though the cement content was somewhat lower in SCC than in NC. Probably a more efficient packing of the particles was the reason for the enlarged strength. Strength was increased by 0.07 MPa per kg/m³ increasing amount of filler added. Additives of polypropylene fibres decreased strength by 2.3% per kg/m³ increasing amount of fibre added. Water-cured cylinders of SCC, 100 mm in diameter, without polypropylene fibres, exhibited spalling at 480 °C/h heating rate. At 240 °C/h heating rate cylinders of SCC, 100 mm in diameter, without polypropylene fibres, exhibited no spalling. Once spalling was avoided, SCC and NC behaved similarly at high temperature except at 800 °C at which temperature SCC with limestone powder did not show any residual strength at all after cooling down to 20 °C, Figure 9.1. Figure 9.2 shows the properties of SCC with limestone powder. Comparison with HPC shows greater strength between 100 °C and 200 °C of SCC than that of HPC, Figure 9.3. Greater loss of the elastic modulus was obtained than seen before, Figure 9.4.
0.00
0.50
1.00
1.50
2.00
2.50
3.00
0 200 400 600 800Temperature (°C)
Rel
ativ
e pr
oper
ty
Hot E-modulusHot strengthHot strainResidual E-modulusResidual strengthResidual strain
Figure 9.1 – Relative properties of concrete at/after elevated temperature except for residual property with limestone powder at 800 °C.
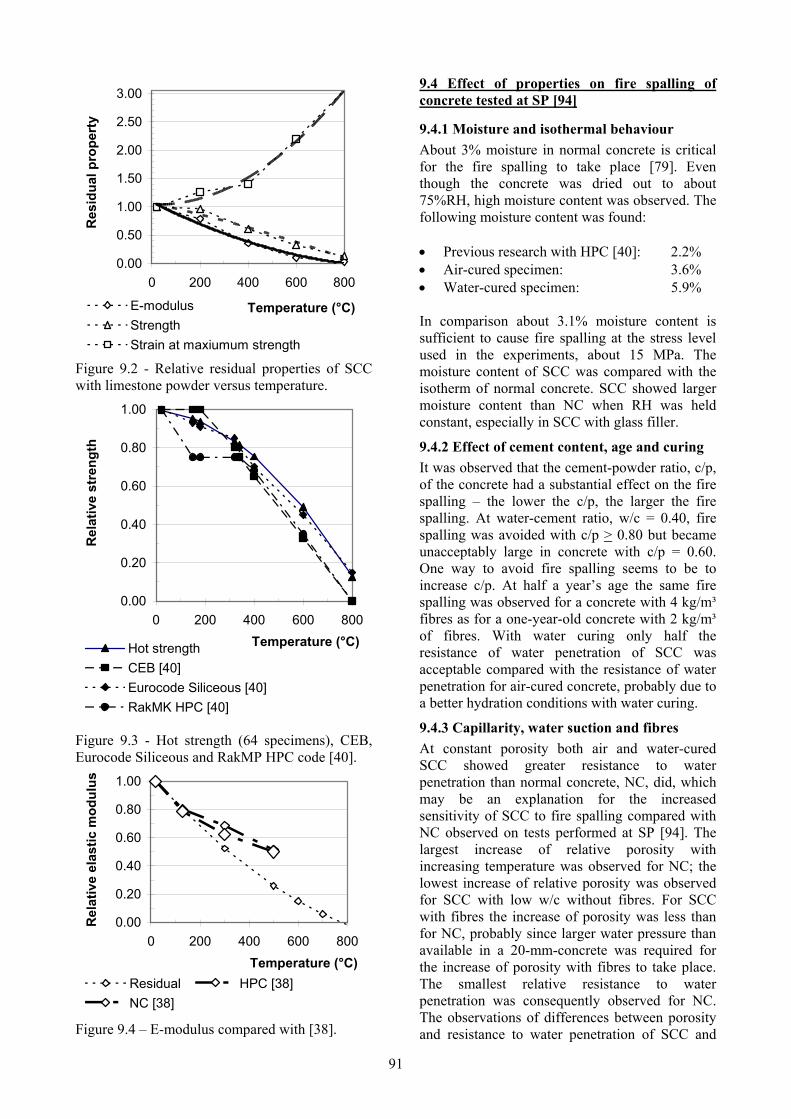
91
0.00
0.50
1.00
1.50
2.00
2.50
3.00
0 200 400 600 800
Temperature (°C)
Res
idua
l pro
pert
y
E-modulusStrengthStrain at maxiumum strength
Figure 9.2 - Relative residual properties of SCC with limestone powder versus temperature.
0.00
0.20
0.40
0.60
0.80
1.00
0 200 400 600 800Temperature (°C)
Rel
ativ
e st
reng
th
Hot strengthCEB [40]Eurocode Siliceous [40]RakMK HPC [40]
Figure 9.3 - Hot strength (64 specimens), CEB, Eurocode Siliceous and RakMP HPC code [40].
0.00
0.20
0.40
0.60
0.80
1.00
0 200 400 600 800Temperature (°C)
Rel
ativ
e el
astic
mod
ulus
Residual HPC [38]NC [38]
Figure 9.4 – E-modulus compared with [38].
9.4 Effect of properties on fire spalling of concrete tested at SP [94]
9.4.1 Moisture and isothermal behaviour About 3% moisture in normal concrete is critical for the fire spalling to take place [79]. Even though the concrete was dried out to about 75%RH, high moisture content was observed. The following moisture content was found: • Previous research with HPC [40]: 2.2% • Air-cured specimen: 3.6% • Water-cured specimen: 5.9% In comparison about 3.1% moisture content is sufficient to cause fire spalling at the stress level used in the experiments, about 15 MPa. The moisture content of SCC was compared with the isotherm of normal concrete. SCC showed larger moisture content than NC when RH was held constant, especially in SCC with glass filler.
9.4.2 Effect of cement content, age and curing It was observed that the cement-powder ratio, c/p, of the concrete had a substantial effect on the fire spalling – the lower the c/p, the larger the fire spalling. At water-cement ratio, w/c = 0.40, fire spalling was avoided with c/p > 0.80 but became unacceptably large in concrete with c/p = 0.60. One way to avoid fire spalling seems to be to increase c/p. At half a year’s age the same fire spalling was observed for a concrete with 4 kg/m³ fibres as for a one-year-old concrete with 2 kg/m³ of fibres. With water curing only half the resistance of water penetration of SCC was acceptable compared with the resistance of water penetration for air-cured concrete, probably due to a better hydration conditions with water curing.
9.4.3 Capillarity, water suction and fibres At constant porosity both air and water-cured SCC showed greater resistance to water penetration than normal concrete, NC, did, which may be an explanation for the increased sensitivity of SCC to fire spalling compared with NC observed on tests performed at SP [94]. The largest increase of relative porosity with increasing temperature was observed for NC; the lowest increase of relative porosity was observed for SCC with low w/c without fibres. For SCC with fibres the increase of porosity was less than for NC, probably since larger water pressure than available in a 20-mm-concrete was required for the increase of porosity with fibres to take place. The smallest relative resistance to water penetration was consequently observed for NC. The observations of differences between porosity and resistance to water penetration of SCC and
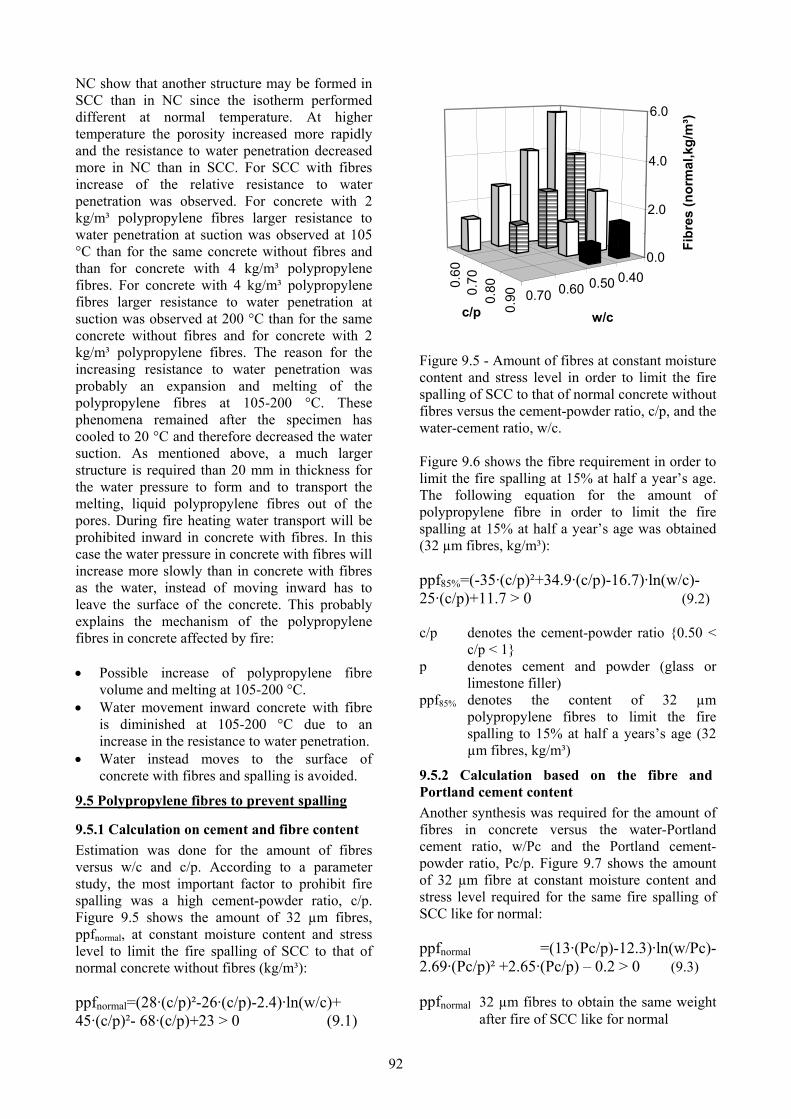
92
NC show that another structure may be formed in SCC than in NC since the isotherm performed different at normal temperature. At higher temperature the porosity increased more rapidly and the resistance to water penetration decreased more in NC than in SCC. For SCC with fibres increase of the relative resistance to water penetration was observed. For concrete with 2 kg/m³ polypropylene fibres larger resistance to water penetration at suction was observed at 105 °C than for the same concrete without fibres and than for concrete with 4 kg/m³ polypropylene fibres. For concrete with 4 kg/m³ polypropylene fibres larger resistance to water penetration at suction was observed at 200 °C than for the same concrete without fibres and for concrete with 2 kg/m³ polypropylene fibres. The reason for the increasing resistance to water penetration was probably an expansion and melting of the polypropylene fibres at 105-200 °C. These phenomena remained after the specimen has cooled to 20 °C and therefore decreased the water suction. As mentioned above, a much larger structure is required than 20 mm in thickness for the water pressure to form and to transport the melting, liquid polypropylene fibres out of the pores. During fire heating water transport will be prohibited inward in concrete with fibres. In this case the water pressure in concrete with fibres will increase more slowly than in concrete with fibres as the water, instead of moving inward has to leave the surface of the concrete. This probably explains the mechanism of the polypropylene fibres in concrete affected by fire: • Possible increase of polypropylene fibre
volume and melting at 105-200 °C. • Water movement inward concrete with fibre
is diminished at 105-200 °C due to an increase in the resistance to water penetration.
• Water instead moves to the surface of concrete with fibres and spalling is avoided.
9.5 Polypropylene fibres to prevent spalling
9.5.1 Calculation on cement and fibre content Estimation was done for the amount of fibres versus w/c and c/p. According to a parameter study, the most important factor to prohibit fire spalling was a high cement-powder ratio, c/p. Figure 9.5 shows the amount of 32 µm fibres, ppfnormal, at constant moisture content and stress level to limit the fire spalling of SCC to that of normal concrete without fibres (kg/m³): ppfnormal=(28·(c/p)²-26·(c/p)-2.4)·ln(w/c)+ 45·(c/p)²- 68·(c/p)+23 > 0 (9.1)
0.400.500.600.70
0.60
0.70
0.80
0.90
0.0
2.0
4.0
6.0
Fibr
es (n
orm
al,k
g/m
³)
w/cc/p
Figure 9.5 - Amount of fibres at constant moisture content and stress level in order to limit the fire spalling of SCC to that of normal concrete without fibres versus the cement-powder ratio, c/p, and the water-cement ratio, w/c. Figure 9.6 shows the fibre requirement in order to limit the fire spalling at 15% at half a year’s age. The following equation for the amount of polypropylene fibre in order to limit the fire spalling at 15% at half a year’s age was obtained (32 µm fibres, kg/m³): ppf85%=(-35·(c/p)²+34.9·(c/p)-16.7)·ln(w/c)-25·(c/p)+11.7 > 0 (9.2) c/p denotes the cement-powder ratio {0.50 <
c/p < 1} p denotes cement and powder (glass or
limestone filler) ppf85% denotes the content of 32 µm
polypropylene fibres to limit the fire spalling to 15% at half a years’s age (32 µm fibres, kg/m³)
9.5.2 Calculation based on the fibre and Portland cement content Another synthesis was required for the amount of fibres in concrete versus the water-Portland cement ratio, w/Pc and the Portland cement-powder ratio, Pc/p. Figure 9.7 shows the amount of 32 µm fibre at constant moisture content and stress level required for the same fire spalling of SCC like for normal: ppfnormal =(13·(Pc/p)-12.3)·ln(w/Pc)-2.69·(Pc/p)² +2.65·(Pc/p) – 0.2 > 0 (9.3) ppfnormal 32 µm fibres to obtain the same weight
after fire of SCC like for normal

93
w/Pc denotes the water-Portland cement ratio Pc/p denotes Portland cement-powder ratio
0.40
0.50
0.60
0.70
0.60
0.70
0.80
0.90
0.0
2.0
4.0
6.0
Fibr
es (1
5%
spal
ling,
kg/m
³)w/cc/p
Figure 9.6 - Fibres based on 85% remaining weight after fire compared with the original one.
0.40
0.50
0.60
0.70
0.800.
500.
600.
700.
85
0.0
2.0
4.0
6.0
w/PcPc/p
Figure 9.7 - Fibre amount at constant moisture content and stress level required for the same fire spalling of SCC like for normal concrete
Figure 9.8 shows the amount of fibres, ppf, to limit the fire spalling to 15% of that before fire at half a year’s age (32 µm fibres, kg/m³): ppf85%=(-43·(Pc/p)²+72·(Pc/p)-31)·ln(w/Pc) -14·(Pc/p)²+18.7·(Pc/p)-6.2 (9.4) ppf85% denotes the amount of 32 µm fibres to
obtain 85% weight after fire of SCC of the original one (kg/m³).
w/Pc denotes the water-Portland cement ratio Pc/p denotes Portland cement-powder ratio
0.40
0.50
0.60
0.70
0.800.
500.
600.
700.
85
0.0
2.0
4.0
6.0
Fibr
e (1
5%
spal
ling,
kg/m
³)
w/PcPc/p
Figure 9.8 - Required amount of fibres in order to limit the amount of fire spalling to 15% of the original weight.

94
REFERENCES
1. Nilsson, M., Petersson, Ö., The First Bridge Made of SCC. “Första bron utförd i själv-kompakterande betong.” Väg- och Vatten-byggaren 2/98 (1998) 28-31. (In Swedish.)
2. Söderlind, L., Full-scale Tests of SCC for Dwelling Houses. RILEM Symposium on SCC. Ed.: Skarendahl and Petersson (1999) 723-728.
3. Trägårdh, J., Very Good Frost Resistance of SCC – A case Study of the Stäket Tunnel. “Mycket god frostbeständighet i självkom-pakterande betong– en fallstudie från Stä-kettunneln.” Bygg & Teknik. 2001/07, 26-27.
4. Bergholtz, A., Lundgren, S., Concrete Inner Vault in the Grind Tunnel, “Motgjuten betonginkädnad i tunnel vid Grind”, Swed-ish Road Administration and Scandiacon-sult Sverige AB respectively, Rock Me-chanics Meeting, Swedish Rock Engineer-ing and National Group of International So-ciety for Rock Mechanics, ISSN 0281-4714, 2000, 227-236.
5. Tunnel 99, Swedish Road Administration, 1999:138.
6. Tunnel 95, Swedish Road Administration, 1995:32.
7. Persson, B., Mix Proportions and Strength of SCC for Production of High Strength Poles, Piles and Pillars. Contribution to “1. Münchener Baustoffseminar Selbstverdich-tender Beton” 9 oktober 2001. Ed.: Peter Schiessl. 2001, 31-39.
8. Persson, B., High Performance SCC. Pro-ceedings of the 6th International Sympo-sium on Utilization of High Strength/High Performance Concrete. University of Leip-zig. Ed.: König, G., Dehn, F., Faust, T., Leipzig. 2002, 1273-1290.
9. Persson, B., SCC with High Performance. Proceedings of the 18th Symposium on Nordic Concrete Research. Nordic Research Projects, Elsinore, Ed.: Bager, D., Glavind, M., Publisher: The Norwegian Concrete As-sociation. Oslo. 2002, 327-330.
10. Persson, B., SCC, with High Performance, HP, Proceedings of the Congress on Chal-lenges of Concrete Construction, Dundee, Ed.: Dhir, R. K., Publisher: The University of Dundee, Dundee, 2002, 16 pp.
11. Anderberg, Y., Oredsson, J., Rise, G., High Performance Concrete Structures – Design Handbook. Svensk Byggtjänst, Stockholm, 2000, 49-58.
12. Persson, B., An International Workshop on High-Performance Concrete. “Internatio-
nellt arbetsmöte beträffande högpresterande betong.” Betong 2/96. 1996. Stockholm, 27-29. (In Swedish.)
13. Diedrichs, U., Jumppanen, U.-M., Schnei-der, U., High Temperature Properties and Spalling Behaviour of High Strength Con-crete. Weimar. Red.: F.H. Wittmann and P. Schwesinger. Freiburg and Unterengstrin-gen. 1995, 129-143.
14. Oredsson, J., Application to the Develop-ment Fund of the Swedish Construction In-dustry, SBUF: “Fire Resistance of SCC”, Skanska Perfab Ltd, 2000-04-14.
15. Malhotra, H.L., The Effect of Temperature on the Compressive Strength of Concrete, Magazine of Concrete Research, Vol. 28, 1956, 85.
16. Weigler, H., Fischer, R., Concrete at Tem-peratures between 100 °C and 750 °C. "Beton bei Temperaturen von 100 °C bis 750 °C." Beton 2, 1968.
17. Abrams, M.S., Compressive Strength of Concrete at Temperature to 1600 °F (871 °C), PCA, Ser. 1387-1, 1968.
18. Thelandersson, S., Effect of the Tempera-tures on Tensile Strength of Concrete, Bul-letin 26, Div. Structural Mechanics and Concrete Construction, Reprint from nord-isk Betong 1972:2, 1972, 28 pp.
19. Nekrassow, K., Fire Resistance concrete. “Hetzebeständiger Beton.” Bauverlag, Wiesbaden – Berlin, 1961.
20. Nekrassow, K., Influence of Temperature on the Physical-Mechanical Properties of Concrete, "Einfluss hoher Temperaturen auf die physikalisch-mechanischen Eigenschaf-tens des Betons, Symposium Feuerwider-standsfähigkeit von Spannbeton, Bauverlag GmbH, Wiesbaden-Berlin, 1966, 67-74.
21. Jönsson, G., Lassen, C., Experimental In-vestigation of the Temperature Dependence of the Tensile Strength for Concrete in Temperature Associated with Fires. “Expe-rimentell undersökning för betong av drag-hållfasthetens temperaturberoende vid för brand aktuellt temperaturområde.” Div. Structural Mechanics and Concrete Con-struction. 1968.
22. Nilsson, L.O., Temperature Effects in Rela-tive Humidity Measurements on Concrete – Some Preliminary Studies. The Moisture Group. Report 1987:1. BFR. 1987, 84.
23. Persson, B., Compatibility between Floor Material and Concrete – Effect of Produc-tion Methods on Volatile Organic Com-pound, Moisture and Carbonation. “Kompa-
95
tibilitet mellan golvmaterial och betong – Effekt av produktionsmetoder på emissio-ner, fukt och karbonatisering.” Report TVBM-7149 (assignment for Svenska Byggbranschens Utvecklingsfond, SBUF, PEAB AB, Bostik AB, EssBetong KB, Tar-kett Sommer AB, Swerock AB, Svensk Glasåtervinning AB, ECOBETON A/S, Norge). Division of Building Materials. Lund Institute of Technology. Lund Univer-sity. Lund. 2000, 133 pp. (In Swedish.)
24. Thelandersson, S., Mechanical Behaviour of Concrete under Torsional Loading at Tran-sient, High-Temperature Conditions, Bulle-tin 46, Div. Structural Mechanics and Con-crete Construction, 1974, 25-35.
25. Persson, B., Quasi-instantaneous and Long-term Deformations of High-Performance Concrete with Some Related Properties. Doctoral Thesis. Report TVBM-1016. Divi-sion of Building Materials. Lund Institute of Technology. Lund University, Lund, 1998, 500 pp.
26. ASTM E 104-85. Standard Practice for Maintaining Constant Relative Humidity by Means of Aqueous Solutions. ASTM. Philadelphia, (1985), 33-34, 637.
27. Alvaredo, A. M., Wittmann F. H. Shrinkage as Influenced by Strain Softening and Crack Formation. Proceedings of the Fifth Interna-tional RILEM Symposium on Creep and Shrinkage in Barcelona. 1993. E & FN Spon. London, 1993, 103-114.
28. Lennon, T., Bailey, C., Clayton, N., The Performance of High Grade Concrete Col-umns in Fire, Symposium on Utilization of High Strength/High Performance Concrete. University of Leipzig. Ed.: König, G., Dehn, F., Faust, T., Leipzig. 2002, 341-353.
29. Clayton, N., Lennon, T., Effect of Polypro-pylene Fibres on Performance in Fire of High Grade Concrete, Building Research Establishment. publication 395. 2000.
30. DD ENV 1992-1-1. Design of Concrete Structures, British Standard Institution, London, 1992.
31. DD ENV 1991-1: 1996. Basis of Design and Actions in Structures, British Standard Institution, London, 1996.
32. PrEN 1991-1-2, Eurocode 1 – Actions on Structures: part 1.2: General Action – Ac-tion on Structures Exposed to Fire, Euro-pean Committee for Standardisation, Brus-sels.
33. BS6399 Part 1:1996, Loading of Buildings Part 1, Code of Practise for Daeda and Im-posed Loads, British Standard Institution, London, 1996.
34. Natural Fire Concept, Full Scale Tests, Im-plementation in the Eurocodes and Devel-opment of a userfriendly design tool, Te-chincal Report 5, Profil Arbed Recherches, 2000.
35. Noumowe, N. A., Debicki, G., Effect of Elevated Temperature from 200 to 600 °C on the Permeability of HPC, Symposium on Utilization of High Strength/High Perform-ance Concrete. University of Leipzig. Ed.: König, G., Dehn, F., Faust, T., Leipzig. 2002,431-444.
36. Noumowe, N. A., Clastres, P., Debicki, G., Costaz, J.-L., Transient Heating Effect on High Strength Concrete, Nuclear Engineer-ing and Design, No 166, Elsevier, 1966.
37. Noumowe, N. A., Clastres, P., Debicki, G., Bolvin, M., High Temperature Effect on HPC: Strength and Porosity, Third CAN-MET/ACI International Conference on Du-arbility of Concrete, Nice, 1994, 157-172.
38. Noumowe, N. A., Clastres, P., Debicki, G., Costaz, J.-L., Thermal Stresses and Water Vapour Pressure of HPC at High Tempera-ture, Symposium on Utilization of High Strength/High Performance Concrete, Ed.: de Larrard, F., Lacroix, R., Paris, 1996, 561-570.
39. Noumowé, A. N., Effet de Hautes Tempéra-tures (20-600 °C) sur le Béton, Cas par-ticulier du Béton à Hautes Performances, Thése de Doctorat de l’INSA, Lyon, 1995, 232 pp.
40. Phan, L., High-Strength Concrete at High Temperarture – An Overview, Symposium on Utilization of High Strength/High Per-formance Concrete, Ed.: de Larrard, F., La-croix, R., Paris, 1996, 501-518.
41. Phan, L.T., Carino, N.J., Mechanical Prop-erties od High Strength Concrete at Ele-vated Temperartures, NISTIR 6726, Gaithersburg, 2001.
42. Phan, L.T., Carino, N.J., Review of Me-chanical Properties of HSC at elevated tem-peratures, Materials in Civil engineering, ACI, Vol. 10, 1998, 58-64.
43. Phan, L.T., Carino, N.J., Effects of Test Conditions and Mixture Proportions on Be-haviour of High-Strength Concrete Exposed to High Temperatures, ACI Materials Jour-nal, ACI, Vol. 99, 2002, 54-66.
44. Phan, L. T., Lawson, J. R., Davis, F. R., Ef-fects of Elevated Temperature Exposure on Heating Characteristics, Spalling and Re-sidual Properties of HPC, Materials and Structures, Vol. 34, 2001, 83-91.

96
45. Persson, B., Tunnel Through Water-distributing Sediments – Without Injection in Advance. “Tunnel genom vattenförande sediment – utan föregående injektering.” Bygg & Teknik 1/99. Stockholm. 1999, 28-29 (In Swedish.)
46. Persson, B., Japan Society for the Promo-tion of Science Fellowship for Research in Japan. Research Report 9803:12. Division of Building Materials. Lund Institute of Technology. Lund University. Lund. 2000, 3 pp.
47. Sakata, K., Personal communication. Oka-yama University, 1998.
48. DAfStb-Richtlinie ”Selbstverdichtender Be-ton”, Beuth Verlag, Berlin, 2001.
49. Harald Müller. Universität Karlsruhe. Per-sonal information. 2002.
50. Andersson, R., Sjökvist, L.-G., SCC for the Element Industry – Technical Analyses. “Självkompakterande betong i prefabrice-ringsindustrin – en teknisk och ekonomisk analys.” Report TVBM-5039. Division of Building Materials. Lund Institute of Tech-nology. Lund University. Lund. 1999, 48 pp. (In Swedish with English summary.)
51. Dieden, C., SCC for House Production – Composition, strength and Shrinkage. “Självkompakterande husbyggnadsbetong – sammansättning, hållfasthet och krymp-ning.” Report TVBM-5040. Division of Bu-ilding Materials. Lund Institute of Technol-ogy. Lund University. Lund. 1999, 50 pp. (In Swedish with English summary.)
52. Pujol, A. (Hugas), Mix Proportions and Properties of SCC. Report TVBM-5041. Division of Building Materials. Lund Insti-tute of Technology. Lund University. Lund. 1999, 56 pp.
53. Charkas, M., and Fayli, W., SCC with Glass Filler – Studies on Aspects on Materials and Production. “Material- och produktionstek-niska studier av självkompakterande be-tongmed glasfiller.” Report TVBM-5042. Division of Building Materials. Lund Insti-tute of Technology. Lund University. Lund. 1999, 80 pp. (In Swedish with English summary.)
54. Boubitsas, D., Paulou, K., SCC for Marine Environment. “Självkompakterande betong för havsmiljö.” TVBM-5048. Lund Institute of Technology. Lund University. Lund. 2000, 55 pp. (In Swedish with English summary.)
55. Kakazoukis, N., Rheology of SCC – Results of Different Testing Methods. “Reologiska egenskaper hos självkompakterande be-tong– En undersökning av olika provnings-
metoder. TVBM-5049. Lund Institute of Technology. Lund University. Lund. 2000, 35 pp. (In Swedish with English summary.)
56. Persson, B., Strength and Shrinkage of SCC. Proceedings of an International RILEM Workshop on Shrinkage in Con-crete. Paris. 2000. Ed. by V Baroghel-Bouny and P-C Aïtcin. 2000, 81-99.
57. Persson, B., A Comparison between De-formations of SCC and Corresponding Properties of NC. Cement and Concrete Re-search. 31. 2001, 193-198.
58. Persson, B., SCC - Chloride Ingress and Frost Resistance. Nordic Mini Seminar. fib Commission 5.5. Gothenburg. 2001.
59. Persson, B., Chloride Migration Coefficient of SCC. Nordic Seminar on Durability of Exposed Concrete Containing Secondary Cementitious Materials. Hirtshals. Ed.: D. Bager. 2001, 20 pp.
60. Persson, B., The Bridge System between Honshu and Shikoku: Japanese Record Bridges. “Brosystemet mellan Honshu och Shikoku: Japanska rekordbroar.” Bygg & Teknik 2/99. Stockholm. 1999, 56-60 (In Swedish.)
61. Persson, B., Japanese Research on Strength and Elastic Modulus in Wall Made of SCC. “Japanska försök avseende hållfasthet och E-modul i väggar av vibreringsfri betong.” Betong 2/99. Stockholm. 1999, 16-17. (In Swedish.)
62. Persson, B., Production and Some Properti-es of SCC. ”Produktion av och vissa egen-skaper hos Självkompakterande betong.” Bygg & Teknik 7/99. Stockholm. 1999, 26-28 (In Swedish.).
63. Persson, B., Modern Concrete and Filigree Form Work Conditions for a Record Con-struction in Malmö. “Modern betong och fi-ligranform förutsättningarna för ett rekord-bygge i Malmö.” Husbyggaren 6/99. 1999, 34-43 (In Swedish.)
64. Persson, B., Glass Filler Concrete without Superplasticiser in a Rapid-constructed Building in Malmö. “Flytmedelsfri betong med glasfillerinblandning i snabbyggt malmöhus” Husbyggaren 1/2000. 2000, 26-29 (In Swedish.)
65. Persson, B., SCC – A Quiet Revolution for the Building Industry. “Självkompakterande betong – en tyst revolution inom byggan-det.” Husbyggaren 2/2000. 2000, 20-24 (In Swedish.)
66. Persson, B., The Cheapest Dwelling House in Sweden was Built in Concrete. ”Sveriges billigaste bostadshus byggdes i betong. Be-tong 2/2001, 14-15 (In Swedish).

97
67. Persson, B., SCC Offers a Short Fabrication Cycle and a Rational Production “Själv-kompakterande betong ger kort omloppstid och rationell produktion.” Husbyggaren 6/2001, 10-13. (In Swedish.)
68. Persson, B., Assessment of Chloride Migra-tion Coefficient, Salt Frost Resistance, In-ternal Frost Resistance and Sulphate Resis-tance of SCC. Report TVBM-3100 (as-signment for SBUF and Skanska AB, Malmö). Division of Building Materials. Lund Institute of Technology. Lund Univer-sity. Lund. 2001, 86 pp.
69. Persson, B., Strength of Concrete for Tun-nel Elements. Working Report 0009:10 (as-signment for Swerock AB, Helsingborg). Division of Building Materials. Lund Insti-tute of Technology. Lund University. Lund. 2000, 13 pp. (In Swedish.)
70. Persson, B., Air Void Structure of Con-cretes KN, KO and RO within the Durabil-ity Project of SBUF (the Swedish Board of Building Research and the Development Foundation of the Swedish Contractors). “Luftporstruktur hos betongerna KN, KO och RO inom SBUF:s beständighetspro-jekt”. Report U00.15 (assignment for Skanska Asfalt och Betong AB, Malmö). Division of Building Materials. Lund Insti-tute of Technology. Lund University. Lund. 2000, 23 pp. (In Swedish.)
71. Persson, B., Self-compacting Bridge Con-crete with Mixed Filler. “Självkompakte-rande brobetong med blandfiller”. Report U00.14 (assignment for Skanska Asfalt och Betong AB, Malmö). Division of Building Materials. Lund Institute of Technology. Lund University. Lund. 2000, 8 pp. (In Swedish.)
72. Persson, B., Japan Society for the Promo-tion of Science Fellowship for Research in Japan. Research Report 9803:12. Division of Building Materials. Lund Institute of Technology. Lund University. Lund. 2000, 3 pp.
73. Persson, B., Shrinkage and Strength of SCC with Different Kinds of Filler. Report U00.13 (assignment for Svensk Glasåterv-inning AB, Hammar). Division of Building Materials. Lund Institute of Technology. Lund University. Lund. 2000, 22 pp.
74. Persson, B., Evaluation of Present and Re-maining Research on SCC with Glass filler. “Utvärdering av föreliggande forskningsin-satser samt återstående forskningsbehov be-träffande självkompakterande betongmed glasfillerinblandning.” Report U00.10 (as-signment for Svensk Glasåtervinning AB,
Hammar). Division of Building Materials. Lund Institute of Technology. Lund Univer-sity. Lund. 2000, 6 pp. (In Swedish.)
75. Persson, B., Chloride Penetration and Frost Resistance of Self-compactiong Concrete. “Frostbeständighet och kloridinträngning hos självkompakterande anläggningsbe-tong.” Report U00.05 (assignment for Skanska Sverige AB). Division of Building Materials. Lund Institute of Technology. Lund University. Lund. 2000, 5 pp.
76. Persson, B., Self-Compacting Construction Concrete - Workability and Deformations. “Självkompakterande anläggningsbetong - gjutbarhet och deformationer ”. Report U99.23 (assignment for Skanska Asfalt and Betong Ltd. Farsta). Division of Building Materials. Lund Institute of Technology. Lund University. Lund. 1999, 14 pp. (In Swedish.)
77. Persson, B., Workability of SCC with Vis-cocrete 3. “Gjutbarhet hos självkompakte-rande betong med Viscocrete 3. Report U99.11. (assignment for Sika Ltd. Järfälla). Division of Building Materials. Lund Insti-tute of Technology. Lund University. Lund. 1999, 1 pp. (In Swedish.)
78. Persson, B., SCC. “Självkompakterande be-tong.” Report U98.07 (assignment for Sydsten Ltd. Malmö). Division of Building Materials. Lund Institute of Technology. Lund University. Lund. 1998, 1 p. (In Swedish.)
79. Khoury, G. A., Passive Fire Protection in Tunnels. Imperial College. Concrete. 2002, 26 pp.
80. Blontrock, H., Taerwe, L., Exploratory Study on SCC. Proceedings of the 6th In-ternational Symposium on Utilization of High Strength/High Performance Concrete. University of Leipzig. Ed.: König, G., Dehn, F., Faust, T., Leipzig. 2002, 659-666.
81. Persson, B., Does plastic fibres prevent fire spalling even in SCC? ”Förebygger plastfib-rer brandspjälkning även hos Självkompak-terande betong?” Husbyggaren 2/2002, 26-30 (In Swedish.)
82. Persson, B. Mechanical Performance of Self-Compacting Concrete under Compres-sive Loading at Transient, High Tempera-ture Conditions - with Some Interrelated Properties. Report 0204:02. Division of Building Materials. Lund Institute of Tech-nology. Lund University. Lund. 2002, 91 pp.
83. Persson, B. Self-Compacting Concrete at High Temperature Report 0212:02. Division of Building Materials. Lund Institute of

98
Technology. Lund University. Lund. 2002, 148 pp.
84. Rodenstam, S., Summary after re-optimisation. “Sammanställning av recept-optimering.” Nordkalk, Malmö, 2001, 31 pp. (In Swedish)
85. Persson, B., Ideal Distribution of Particles in High-Performance Concrete. “Ideal par-tikelfördelning i högpresterande betong.” Betong 95/3. 1995. Stockholm, 6-8, 39. (In Swedish with English summary.)
86. Dreux, D., Guide pratique du béton. Collec-tion de l’Institute Technique du Bâtiment et des Travaux Public, Paris, 1970.
87. Persson, B., Experiences after visit at LCPC. Division of Building Materials. Lund Institute of Technology. Lund Univer-sity. Lund. 1995.
88. Larrard, F., Personal communication, LCPC, Paris, 1995.
89. Neville, A.M., Brooks, J. J., Concrete Tech-nology, Longman, Singapore, 1987 (up-dated 1999), 70.
90. Abrams, M.S., Compressive Strength of Concrete at Temperatures of 1600 °F (871 °C). Symposium on the Effect of Tempera-ture on Concrete. ACI SP-25. Detroit. 1971.
91. Thelandersson, S., Concrete Structures at High Temperatures – a overview. “Betong-konstruktioner vid höga temperaturer - en översikt. VAST. Stockholm. 1974. Bulletin no 43. Div. Structural Mechanics and Con-crete Construction, 1974.
92. Xu, A., Structure of Hardened Cement-fly Ash Systems and Their Related Properties. Report P-92:7. Division of Building Materi-als. Chalmers University of Technology. Gothenburg. 1992. Pp. IV: 15-19.
93. ASTM C 215-85 (1985). Standard Test Method for Fundamental Transverse, Lon-gitudinal, and Torsional Frequencies of Concrete Specimens. ASTM. Philadelphia. 1985, 119-122.
94. Boström, L., The Performance of Some SCC when Exposed to Fire. Report 2002:23. Fire Technology. Swedish Na-tional Testing and Research Institute, 37 pp.
95. Persson, B., Hydration, Structure and Strength of High-Performance Concrete.
“Högpresterande betongs hydratation, struk-tur och hållfasthet.” Report TVBM-1009. Division of Building Materials. Lund Insti-tute of Technology. Lund University. Lund. 1992. 400 pp.
96. Bertil Persson. Flooring on Concrete – A Synthesis as Concerns Moisture, Chemical Volatile Compound and Adhesion. “Golv-system på betong – fuktpåverkan, kemisk emission och vidhäftning.” Report TVBM-7165. Div. Building Materials. Lund Insti-tute of Technology. Lund, 2003, 157 pp.
97. Boström, L., SCC with plastic fibres with-stands fire. “Självkompakterande betong med plastfibrer klarar brand.” Brandposten no 26. SP. 2002, 15 (In Swedish).
98. Boström, L., SCC with plastic fibres with-stands fire. “Självkompakterande betong med plastfibrer klarar brand.” Betong 3/2002, 32. (In Swedish).
99. Boström, L., SCC Exposed to Fire, “ Själv-kompakterande betong utsatt för brand.” Bygg & Teknik. 2002/06, 36-38 (In Swed-ish).
100. Persson, B., Resistance of Self-compacting Concrete with Limestone Powder. “Håll-barhet hos självkompakterande betong med kalkstensfiller.” Bygg & Teknik 07/2002, 35-38.
101. Anderberg, A., Personal communication. Fire Safe Design, Lund. 2002.
102. TorkaS 2.0. Calculation of RH in concrete. SBUF. 2002.
103. Persson, B., Chloride Migration Coefficient of Self-Compacting Concrete. RILEM Ma-terials and Structures. 2001, 20 pp. (Ac-cepted for publication).
104. Lillieblad, J., Personal communication. A-betong, Växjö. 2002.
105. Wickström, U., Personal communication. SP. Borås. 2002.
106. Nilsson, L. O., Hygroscopic Moisture in Concrete – Drying, Measurements & Re-lated Material Properties. Report TVBM-1003. Div. Building Materials. Lund Insti-tute of Technology. Lund, 1980.
107. Boström, L. Personal communication. SP. Borås. 2003.

99
APPENDICES
Appendices 1 – Constructions in SCC
Appendices 2 – Previous research
Appendices 3 – Material and methods
Appendices 4 – Results
Appendices 5 - Analysis
Appendices 6 – Statistical analysis and sources of error
Appendices 7 – Supplementary tests
Appendix 8 – Discussion

100
Appendices 1 –Constructions in SCC
Appendix 1.1 – Stäket tunnel in SCC at Bålsta
Appendix 1.2 – Part of pile in SCC of high -strength
Appendix 1.1 – Stäket tunnel in SCC at Bålsta
Appendix 1.2 – Part of pile in SCC of high -strength
Photo: Giovanni Terrasi.

101
Appendices 2 – Previous research
Appendix 2.1 – Mix proportions studied in the Swedish spalling project
Appendix 2.2 - Forces, stresses, compliance and shrinkage of columns S32.
Appendix 2.3 – Stresses and compliance (millionths/MPa), etcetera for columns S37.
Appendix 2.4 – Mix proportions and other properties of HPC in tests of permeability after high temperature (kg/m³)
Appendix 2.5 – Mix proportions and other properties of HPC in tests of thermal stresses and water vapour pressure (kg/m³)
Appendix 2.6 – Mix proportions and other properties of HPC in rapid heating tests (kg/m³)

102
Appendix 2.1 – Mix proportions studied in the Swedish spalling project. Material/ mix 3230 3240 3730 3740 3750 Coarse aggregate 12-16 mm 425 425 425 380 380 Coarse aggregate 8-12 mm 425 425 425 380 380 Coarse aggregate 4-8 mm 325 325 325 190 190 Gravel 0-8 mm 775 775 775 790 790 Fibre 1-4 1-4 0-2 0-2 0-2 Cement, c, low-alkali (302 m2/kg Blaine) 500 500 500 480 480 Silica fume, s (fineness 17.5 m2/g) 35 35 35 33 33 Superplasticiser, melamine formaldehyde 10 10 10 4.8 4.8 w/c 0.32 0.32 0.37 0.35 0.35 w/b 0.30 0.30 0.35 0.33 0.33 s/c 0.07 0.07 0.07 0.07 0.07 Density 2500 2500 2500 2390 2390 Age at loading (h) 69 65 48 71 92 Strength at loading (150-mm cube, MPa) 57-69 62-72 42-46 49-55 56-62 Strength at 28 days’ age (MPa) 62-88 100-105 77-88 81-89 85-88
Appendix 2.2 - Forces, stresses, compliance and shrinkage of columns S32. Property/column 3231 3232 32341) 3241 3242 32441)
Force (kN) in strands at 100 s 1082 1108 1102 1512 1601 1596 10 d after prestressing 972 1010 974 1236 1353 1364 200 d after prestressing 908 919 886 1120 1266 1170 Stress (MPa) in HPC after 100 s 28 29 28 39 42 42 10 d after prestressing 25 26 25 32 35 36 200 d after prestressing 23 23.7 22.6 28.9 32.5 30.1 Compliance (millionths/MPa) after 100s 31.4 26.7 27.8 35.9 27.2 27.6 10 d after prestressing 54 45 53 71 54 53 200 d after prestressing 68.5 66 64.9 91.7 67.5 82.7 Elastic effect (millionths/MPa) at 10d 2.5 2.4 2.5 4 3.7 3.2 200 d after prestressing 1.9 2.3 2.2 2.2 1.6 3.6 Reduction of compliance (millionths/MPa) for shrinkage after 10 d
8.5 (22)
8.5 (22)
8.5 (22)
7 (16)
6 (14.5)
6 (14)
200 d after prestressing 17 (32)
17 (32)
17 (32)
13 (25)
12 (23)
13 (24)
Resulting creep compliance (millionths/MPa) at 10d
17 (4) 11 (-2)
19 (6) 32 (23)
25 (16)
22 (14)
200 d after prestressing 23 (8) 24 (9) 22 (7) 45 (33)
31 (20)
46 (35)
Estimated creep compliance 10 d after prestressing
12.7 (20.6)
9.2 (14.8)
8.8 (15.2)
23.2 (38.9)
20.2 (33.7)
18.9 (31.6)
200 d after prestressing (millionths/MPa)
21.0 (32.3)
16.5 (25.2)
15.2 (25.6)
31.7 (53.4)
28.8 (47.4)
27.4 (44.9)
1) average of 2 columns, d= loading time (days); s= seconds; (....)= drying shrinkage.

103
Appendix 2.3 – Stresses and compliance (millionths/MPa), etcetera for columns S37. Property/column 3730 3731 37321) 3740 3741 37421) 3750 3751 37521) Force (kN) after 100 s 857 888 910 1111 1130 1136 1327 1347 1319 10 d after prestressing 713 750 769 907 950 924 1116 1188 1097 200 d after prestressing 639 655 684 813 856 826 968 1052 956 Stress (MPa) at 100 s 22 23 23 29 30 30 34 35 34 10 d after prestressing 18 19 20 24 25 24 29 31 28 200 d after prestressing 16 17 18 21 22 21 25 27 25 Compliance at 100s 43 35 31 36 33 32 36 33 37 10 d after prestressing 84 72 66 71 63 68 74 59 78 200 d of prestressing 113 106 95 94 84 91 110 88 114 Elastic effect at 10d 4.3 4.2 3.9 4.1 4 4.8 3.5 2.7 4.2 200 d after prestressing 2.6 2.5 2.4 3 3 3 3.3 3.3 2.6 Reduction for shrinkage after 10 d (mill./MPa)
8 (22)
8 (21)
7 (20) 6 (17)
6 (16)
6 (17) 5 (14)
5 (13)
5 (14)
200 d after prestressing 15 (47)
15 (47)
14 (46)
12 (38)
11 (36)
12 (38)
10 (32)
9 (30)
10 (32)
Resulting compliance (millionths/MPa, 10 d)
37 (23)
33 (20)
31 (18)
33 (22)
28 (18)
35 (24)
37 (28)
24 (16)
40 (31)
200 d after prestressing 58 (24)
59 (27)
52 (20)
51 (23)
43 (18)
50 (24)
67 (45)
49 (28)
70 (48)
Estimated creep compliance after 10 d
26.6 (46)
28.5 (49)
27.2 (47)
25.3 (44)
23.7 (41)
24.9 (43)
24.1 (42)
21.1 (37)
20.3 (35)
200 d after prestressing (millionths/MPa)
40.8 (68)
42.9 (72)
41.6 (69)
38.7 (65)
37.1 (62)
38.1 (65)
37.0 (63)
33.9 (57)
32.9 (55)
1) average of 2 columns; d= loading time (days); s= seconds; (....)= drying shrinkage.
Appendix 2.4 – Mix proportions and other properties of HPC in tests of permeability after high temperature (kg/m³) Concrete B2 B3 B4 Coarse aggregate 8-20 mm 815 815 Medium aggregate 4-10 mm 318 318 Sand 0-5 mm 782 782 782 Cem I 52.5 450 450 450 Silica fume 45 45 45 Water 150 150 150 Superplasticiser 12 12 12 Polypropylene fibres 2 Light weigth aggregate 494 w/b 0.30 0.30 0.30 Density 2569 2571 1930 Compressive strength (MPa) 70 72 45 Splitting tensile strength (MPa) 4.8 4.9 3.0 Permeability (x10-12 m² at 1.5 bars) – 20 °C 0.0015 0.0013 0.0033- 200 °C 0.0055 0.0102 0.003 - 600 °C 3.6 2.89 0.174

104
Appendix 2.5 – Mix proportions and other properties of HPC in tests of thermal stresses and water vapour pressure (kg/m³) Concrete Normal (NC) HPCGravel 13-24 mm 784 815 Fine gravel 5-13 mm 316 318 Lime stone sand 0-5 mm 772 782 Lime stone filler 0 57 Cement CPJ 55 PM 350 266 Silica fume 0 40 Plasticiser 12.2 0 Water reducer 0 9.1 Retarder 0 0.9 Water 195 161 w/b 0.56 0.53w/c 0.56 0.61w/p 0.56 0.44Compressive strength (MPa) 38.1 61.1Tensile splitting strength (MPa) 3.6 4 Tensile direct strength (MPa) 3 3.5
Appendix 2.6 – Mix proportions and other properties of HPC and NC in rapid heating tests (kg/m³) Mix proportion HPC1 HPC2 HPC3 NC4Coarse aggregate 846 846 846 854 Fine aggregate 734 734 734 868 Cement 596 596 662 376 Silica fume 66 66 0 0 Superplasticiser 0.4 0.35 0.15 0 Water 133 199 194 213 Density 2376 2408 2436 2311w/b 0.20 0.30 0.29 0.57 w/c 0.22 0.33 0.29 0.57 w/p 0.22 0.33 0.29 0.57 Aggregate content 0.66 0.66 0.65 0.75 Slump (mm) 240 230 35 76 Air content (%) 3.2 2.8 2 2.5 Moisture content (%) 5 6.1 6.3 7.3 Compressive strength (MPa), 28-d 75 66 53 41 58-d 87 80 59 42 400-d 98 81 72 47 Dynamic modulus (GPa), 58-d 34 37 37 34 400-d 47 44 44 37

105
Appendices 3 – Material and methods
Appendix 3.1 – Chemical composition and physical properties of cements (%)
Appendix 3.2 - The grading of the aggregates, filler and cements
Appendix 3.3 – Details of water -cooled oven
Appendix 3.4 – Details of water -cooled oven with specimen
Appendix 3.5 – Details of water -cooled oven with LVDTs before testing
Appendix 3.6 – Details of water -cooled oven with connected LVDTs after testing

106
Appendix 3.1 – Chemical composition and physical properties of cements (%). Components Byggcement, CEM II/A -L 42.5 R
Skövde Cement Degerhamn Std, CEM I 42.5 BV/SR/LA
CaO 63.4 65 SiO2 19.4 21.6 Al2O3 3.5 3.5 Fe2O3 2.6 4.4 K2O 1.4 0.58 Na2O 0.30 0.05 MgO 2.9 0.78 SO3 3.4 2.07 Ignition losses 7.0 0.47 CO2 4.4 0.14 Clinker minerals: C2S 12.6 21 C3S 51 57 C3A 7 1.7 C4AF 6 13 Water demand 28.2% 25% Initial setting time 151 min. 145 min. Density 3065 kg/m3 3214 kg/m3 Specific surface 475 m2/kg 305 m2/kg
Appendix 3.2 - The grading of the aggregates, filler and cements
0
20
40
60
80
100
0.00
1
0.00
4
0.01
6
0.06
3
0.25
0
1.00
0
4.00
0
8.00
0
16.0
00
Sieve width (µm)
Mat
eria
l pas
sing
(%)
Byggcement, CEM II/A-L 42R SkövdeCement Degerhamn Std,CEM I 42.5 BV/SR/LA Limestone powder Limus 40
Glass filler 1999
Natural gneiss 0-8 mm
Crushed gneiss 8-11 mm
Crushed gneiss 11-16 mm

107
Appendix 3.3 – Details of water -cooled oven Appendix 3.4 – Details of water -cooled oven with specimen
Appendix 3.5 – Details of water -cooled oven with LVDTs before testing
Appendix 3.6 – Details of water -cooled oven with connected LVDTs after testing

108
Appendices 4 – Results
Appendix 4.1 – Time schedule
Appendix 4.2 –Mix proportions and properties for concretes optimised by LTH (kg/m³ dry weight)
Appendix 4.3 –Mix proportions and properties for concretes optimised by NORDKALK and SGÅ (kg/m³ dry weight)
Appendix 4.4 –Difference between mix proportions and properties of concretes optimised by LTH and by Nordkalk and SGÅ (kg/m³ dry weight)
Appendix 4.5 –Difference between cost of concretes optimised by LTH and by Nordkalk and SGÅ (SEK/m³)
Appendix 4.6 – Mix proportions and properties of concrete cast in Bollebygd (kg/m³ dry weight)
Appendix 4.7 – Strength development of concrete cast at LTH (MPa)
Appendix 4.8 – Strength development of concrete cast at SPAB, Bollebygd (MPa)
Appendix 4.9 – Stress/strain results of concrete 40AG0 at 20 °C.
Appendix 4.10 – Stress/strain results of concrete 40AG0 at 200 °C – 20 °C.
Appendix 4.11 – Stress/strain results of concrete 40AG0 at 200 °C – 200 °C.
Appendix 4.12 – Stress/strain results of concrete 40AG0 at 400 °C – 20 °C.
Appendix 4.13 – Stress/strain results of concrete 40AG0 at 400 °C – 400 °C.
Appendix 4.14 – Stress/strain results of concrete 40AG0 at 800 °C – 20 °C.
Appendix 4.15 – Stress/strain results of concrete 40AG0 at 800 °C – 800 °C.
Appendix 4.16 – Stress/strain results of concrete 40AK0 at 20 °C.
Appendix 4.17 – Stress/strain results of concrete 40AK0 at 200 °C – 20 °C.
Appendix 4.18 – Stress/strain results of concrete 40AK0 at 200 °C – 200 °C.
Appendix 4.19 – Stress/strain results of concrete 40AK0 at 400 °C – 20 °C.
Appendix 4.20 – Stress/strain results of concrete 40AK0 at 400 °C – 400 °C.
Appendix 4.21 – Stress/strain results of concrete 40AK0 at 800 °C – 800 °C.
Appendix 4.22 – Stress/strain results of concrete 40AK2 at 20 °C.
Appendix 4.23 – Stress/strain results of concrete 40AK2 at 200 °C – 20 °C.
Appendix 4.24 – Stress/strain results of concrete 40AK2 at 200 °C – 200 °C.
Appendix 4.25 – Stress/strain results of concrete 40AK2 at 400 °C – 20 °C.
Appendix 4.26 – Stress/strain results of concrete 40AK2 at 400 °C – 400 °C.
Appendix 4.27 – Stress/strain results of concrete 40AK2 at 800 °C – 800 °C.
Appendix 4.28 – Stress/strain results of concrete 40AK4 at 20 °C.
Appendix 4.29 – Stress/strain results of concrete 40AK4 at 200 °C – 20 °C.
Appendix 4.30 – Stress/strain results of concrete 40AK4 at 200 °C – 200 °C.
Appendix 4.31 – Stress/strain results of concrete 40AK4 at 400 °C – 20 °C.
Appendix 4.32 – Stress/strain results of concrete 40AK4 at 400 °C – 400 °C.
Appendix 4.33 – Stress/strain results of concrete 40AK4 at 800 °C – 800 °C.
Appendix 4.34 – Stress/strain results of concrete 40BR0 at 20 °C.
Appendix 4.35 – Stress/strain results of concrete 40BR0 at 200 °C – 20 °C.
Appendix 4.36 – Stress/strain results of concrete 40BR0 at 200 °C – 200 °C.

109
Appendix 4.37 – Stress/strain results of concrete 40BR0 at 400 °C – 20 °C.
Appendix 4.38 – Stress/strain results of concrete 40BR0 at 400 °C – 400 °C.
Appendix 4.39 – Stress/strain results of concrete 40BR0 at 800 °C – 20 °C.
Appendix 4.40 – Stress/strain results of concrete 40BR0 at 800 °C – 800 °C.
Appendix 4.41 – Stress/strain results of concrete 55BK0 at 20 °C.
Appendix 4.42 – Stress/strain results of concrete 55BK0 at 200 °C – 20 °C.
Appendix 4.43 – Stress/strain results of concrete 55BK0 at 200 °C – 200 °C.
Appendix 4.44 – Stress/strain results of concrete 55BK0 at 400 °C – 20 °C.
Appendix 4.45 – Stress/strain results of concrete 55BK0 at 400 °C – 400 °C.
Appendix 4.46 – Stress/strain results of concrete 55BK0 at 800 °C – 800 °C.
Appendix 4.47 – Stress/strain results of concrete 70BG0 at 20 °C.
Appendix 4.48 – Stress/strain results of concrete 70BG0 at 200 °C – 20 °C.
Appendix 4.49 – Stress/strain results of concrete 70BG0 at 200 °C – 200 °C.
Appendix 4.50 – Stress/strain results of concrete 70BG0 at 400 °C – 20 °C.
Appendix 4.51 – Stress/strain results of concrete 70BG0 at 400 °C – 400 °C.
Appendix 4.52 – Stress/strain results of concrete 70BG0 at 800 °C – 20 °C.
Appendix 4.53 – Stress/strain results of concrete 70BG0 at 800 °C – 800 °C.
Appendix 4.54 – Stress/strain results of concrete 70BK0 at 20 °C.
Appendix 4.55 – Stress/strain results of concrete 70BK0 at 200 °C – 20 °C.
Appendix 4.56 – Stress/strain results of concrete 70BK0 at 200 °C – 200 °C.
Appendix 4.57 – Stress/strain results of concrete 70BK0 at 400 °C – 20 °C.
Appendix 4.58 – Stress/strain results of concrete 70BK0 at 400 °C – 400 °C.
Appendix 4.59 – Stress/strain results of concrete 70BK0 at 800 °C – 800 °C.
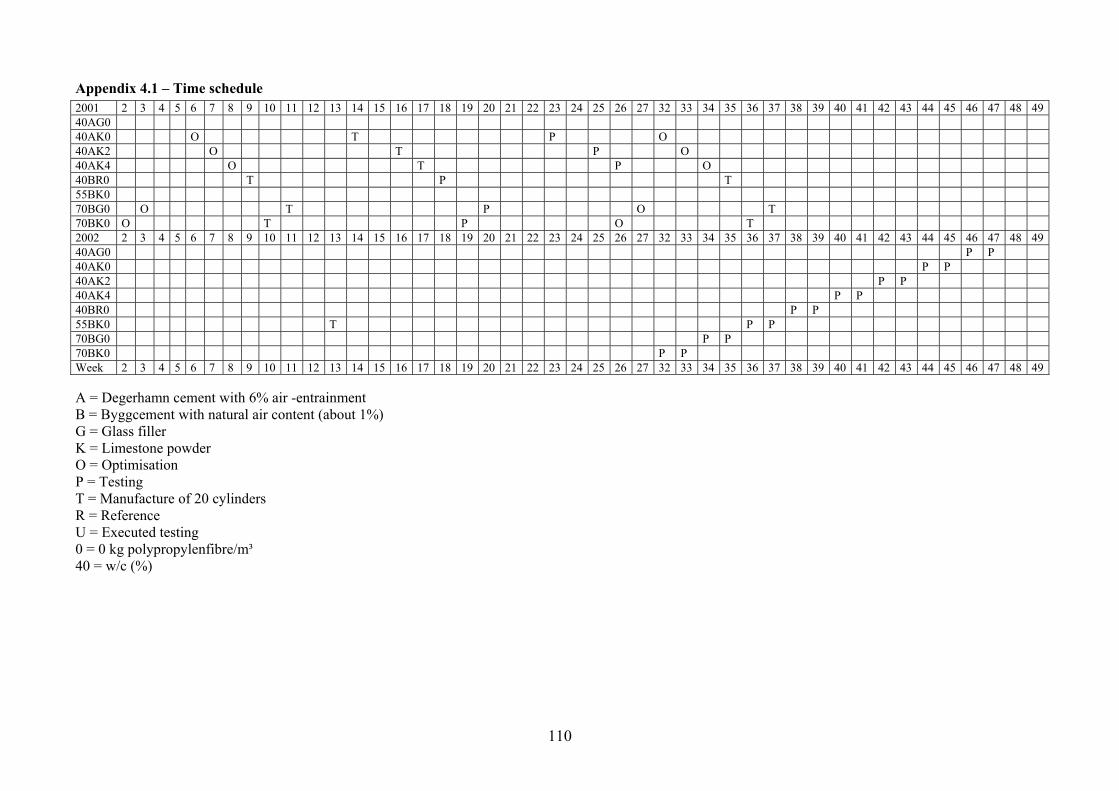
110
Appendix 4.1 – Time schedule 2001 2 3 4 5 6 7 8 9 10 11 12 13 14 15 16 17 18 19 20 21 22 23 24 25 26 27 32 33 34 35 36 37 38 39 40 41 42 43 44 45 46 47 48 49 40AG0 40AK0 O T P O 40AK2 O T P O 40AK4 O T P O 40BR0 T P T 55BK0 70BG0 O T P O T 70BK0 O T P O T 2002 2 3 4 5 6 7 8 9 10 11 12 13 14 15 16 17 18 19 20 21 22 23 24 25 26 27 32 33 34 35 36 37 38 39 40 41 42 43 44 45 46 47 48 49 40AG0 P P 40AK0 P P 40AK2 P P 40AK4 P P 40BR0 P P 55BK0 T P P 70BG0 P P 70BK0 P P Week 2 3 4 5 6 7 8 9 10 11 12 13 14 15 16 17 18 19 20 21 22 23 24 25 26 27 32 33 34 35 36 37 38 39 40 41 42 43 44 45 46 47 48 49 A = Degerhamn cement with 6% air -entrainment B = Byggcement with natural air content (about 1%) G = Glass filler K = Limestone powder O = Optimisation P = Testing T = Manufacture of 20 cylinders R = Reference U = Executed testing 0 = 0 kg polypropylenfibre/m³ 40 = w/c (%)

111
Appendix 4.2 –Mix proportions and properties for concretes optimised at LTH (kg/m³ dry weight) Date: 2001 -08 -30 Concrete 40AG
0 40AK 0
40AK 2
40AK 4
40BK 0
40BR 0
55BK 0
55BK 2
55BK 4
55BR 0
70BG 0
70BK 0
70BK 2
70BK 4
70BR 0
Crushed stone 12 -16 202 225 112 0 238 1045 236 118 0 455 229 238 119 0 371 Crushed stone 8 -11 407 363 341 318 384 0 365 342 318 362 373 377 300 223 366 Gravel 0 -8 972 996 1072 1147 1052 772 1058 1132 1205 1035 1001 1069 1163 1256 1134 Glass filler 163 0 322 0 0 Limestone powder 0 117 142 167 131 0 244 239 234 0 0 315 288 260 0 Byggcement 0 0 0 0 451 454 311 342 373 348 250 248 272 295 278 Degerhamn cement 436 433 447 460 Air -entrainment agent 1.199 0.550 1.22 1.883 Water 174 173 179 184 181 182 171 188 205 192 175 173 190 207 195 Superplasticiser (wet) 8.09 4.68 7.7 10.67 12.00 2.73 8.16 10.14 12.14 2.09 12.01 6.63 8.9 11,1 0,00 Plastic fibre 2 4.000 2 4.00 2 4 0 Superplast (%) 1.4 0.85 1.3 1.7 2 0.6 1.5 1.75 2 2.1 1.2 1.6 2 Air content (%) 6 5.9 5.7 Density 2364 2355 2323 2290 2450 2455 2400 2373 2347 2394 2362 2430 2372 2313 2345 Slump flow (mm) 740 740 600 695 160 665 600 695 740 600 T500 (s) 10 6 10 8 8 8 13 5 7 Notations: A = Degehamn cement (6% air), B = Byggcement (about 1 % air), G = Glass filler, K = Limestone powder, R = reference, 0 = 0 kg polypropylenfibre/m³ , 40 = w/c (%)

112
Appendix 4.3 –Mix proportions and properties for concretes optimised by Nordkalk (kg/m³ dry weight) Date: 2001 -08 -30 Concrete 40AG
0 40AK 0
40AK 2
40AK 4
40BK 0
40BR 0
55BK 0
55BK 2
55BK 4
55BR 0
70BG 0
70BK 0
70BK 2
70BK 4
70BR 0
Crushed stone 12 -16 620 582 583 548 603 1045 615 572 533 455 559 631 590 254 371 Crushed stone 8 -11 0 0 0 0 0 0 0 0 0 362 0 0 0 0 366 Gravel 0 -8 1036 1018 1017 958 1054 772 1075 1000 931 1035 1183 1109 1027 1190 1134 Glass filler 62 80 0 0 Limestone powder 0 146 184 232 130 0 149 216 291 0 0 189 229 331 0 Byggcement 0 0 0 0 447 454 346 365 377 348 321 268 298 306 278 Degerhamn cement 427 402 441 454 Air -entrainment agent 0.235 0.13 0.132 0.136 Water 171 161 176 182 179 182 190 201 207 192 225 188 209 214 195 Superplasticiser (wet) 4.05 4.82 8.2 9.35 9.78 2.73 5.57 7.05 7.76 2.09 5.3 9.41 4.89 6.57 0 Plastic fibre 2 4 2 4 2 4 0 Superplast (%) 1 1.2 1.85 2.06 2.2 0.6 1.61 1.93 2.06 1.65 3.5 1.64 2.15 Air content (%) 7 - - Density 2314 2310 2405 2378 2423 2455 2385 2368 2356 2394 2374 2394 2357 2301 2345 Slump flow (mm) 700 705 710 650 685 160 685 710 655 695 705 705 620 T500 (s) 7 5 8 8 6 6 5 6 2 3 3 6 Notations: A = Degehamn cement (6% air), B = Byggcement (about 1 % air), G = Glass filler, K = Limestone powder, R = reference, 0 = 0 kg polypropylenfibre/m³ , 40 = w/c (%)
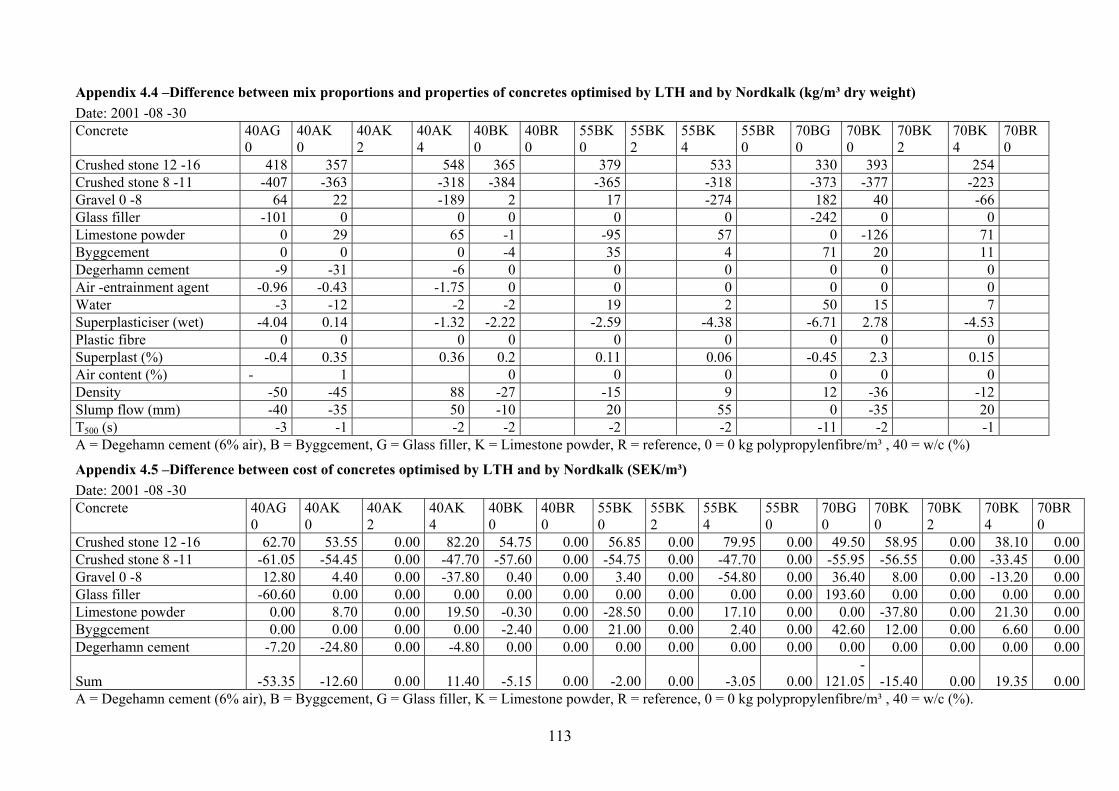
113
Appendix 4.4 –Difference between mix proportions and properties of concretes optimised by LTH and by Nordkalk (kg/m³ dry weight) Date: 2001 -08 -30 Concrete 40AG
0 40AK 0
40AK 2
40AK 4
40BK 0
40BR 0
55BK 0
55BK 2
55BK 4
55BR 0
70BG 0
70BK 0
70BK 2
70BK 4
70BR 0
Crushed stone 12 -16 418 357 548 365 379 533 330 393 254 Crushed stone 8 -11 -407 -363 -318 -384 -365 -318 -373 -377 -223 Gravel 0 -8 64 22 -189 2 17 -274 182 40 -66 Glass filler -101 0 0 0 0 0 -242 0 0 Limestone powder 0 29 65 -1 -95 57 0 -126 71 Byggcement 0 0 0 -4 35 4 71 20 11 Degerhamn cement -9 -31 -6 0 0 0 0 0 0 Air -entrainment agent -0.96 -0.43 -1.75 0 0 0 0 0 0 Water -3 -12 -2 -2 19 2 50 15 7 Superplasticiser (wet) -4.04 0.14 -1.32 -2.22 -2.59 -4.38 -6.71 2.78 -4.53 Plastic fibre 0 0 0 0 0 0 0 0 0 Superplast (%) -0.4 0.35 0.36 0.2 0.11 0.06 -0.45 2.3 0.15 Air content (%) - 1 0 0 0 0 0 0 Density -50 -45 88 -27 -15 9 12 -36 -12 Slump flow (mm) -40 -35 50 -10 20 55 0 -35 20 T500 (s) -3 -1 -2 -2 -2 -2 -11 -2 -1 A = Degehamn cement (6% air), B = Byggcement, G = Glass filler, K = Limestone powder, R = reference, 0 = 0 kg polypropylenfibre/m³ , 40 = w/c (%)
Appendix 4.5 –Difference between cost of concretes optimised by LTH and by Nordkalk (SEK/m³) Date: 2001 -08 -30 Concrete 40AG
0 40AK 0
40AK 2
40AK 4
40BK 0
40BR 0
55BK 0
55BK 2
55BK 4
55BR 0
70BG 0
70BK 0
70BK 2
70BK 4
70BR 0
Crushed stone 12 -16 62.70 53.55 0.00 82.20 54.75 0.00 56.85 0.00 79.95 0.00 49.50 58.95 0.00 38.10 0.00 Crushed stone 8 -11 -61.05 -54.45 0.00 -47.70 -57.60 0.00 -54.75 0.00 -47.70 0.00 -55.95 -56.55 0.00 -33.45 0.00 Gravel 0 -8 12.80 4.40 0.00 -37.80 0.40 0.00 3.40 0.00 -54.80 0.00 36.40 8.00 0.00 -13.20 0.00 Glass filler -60.60 0.00 0.00 0.00 0.00 0.00 0.00 0.00 0.00 0.00 193.60 0.00 0.00 0.00 0.00 Limestone powder 0.00 8.70 0.00 19.50 -0.30 0.00 -28.50 0.00 17.10 0.00 0.00 -37.80 0.00 21.30 0.00 Byggcement 0.00 0.00 0.00 0.00 -2.40 0.00 21.00 0.00 2.40 0.00 42.60 12.00 0.00 6.60 0.00 Degerhamn cement -7.20 -24.80 0.00 -4.80 0.00 0.00 0.00 0.00 0.00 0.00 0.00 0.00 0.00 0.00 0.00
Sum -53.35 -12.60 0.00 11.40 -5.15 0.00 -2.00 0.00 -3.05 0.00 -
121.05 -15.40 0.00 19.35 0.00 A = Degehamn cement (6% air), B = Byggcement, G = Glass filler, K = Limestone powder, R = reference, 0 = 0 kg polypropylenfibre/m³ , 40 = w/c (%).
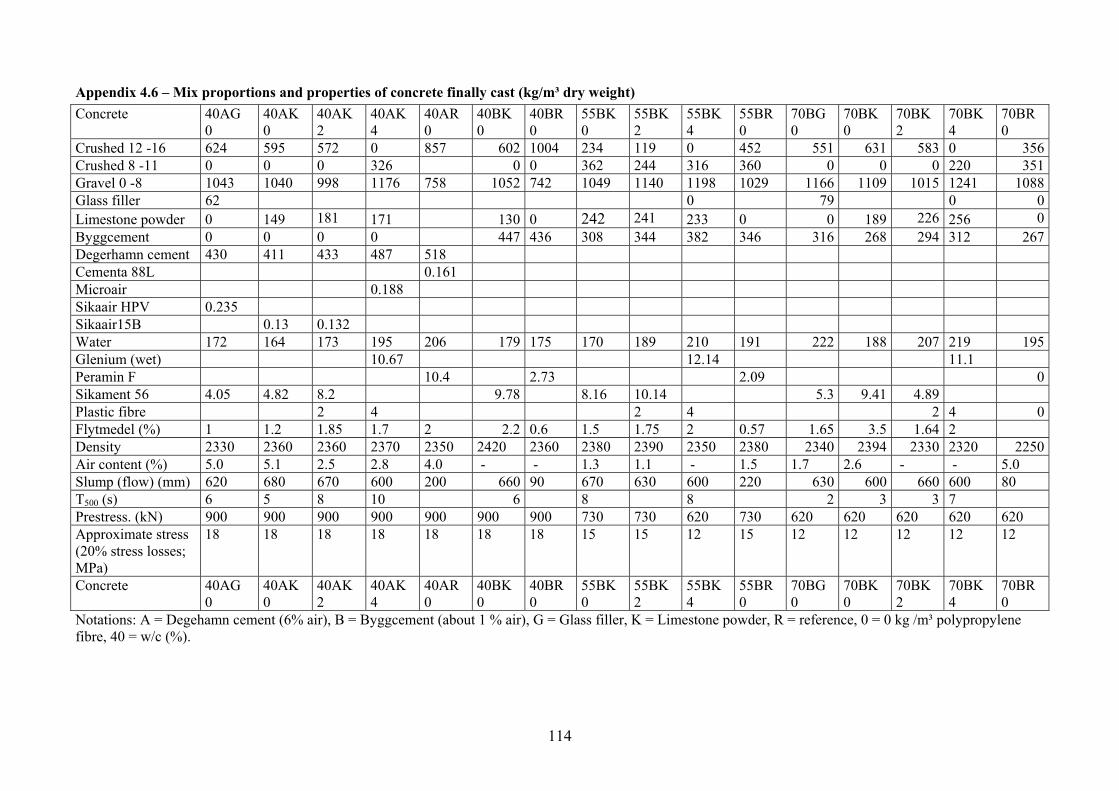
114
Appendix 4.6 – Mix proportions and properties of concrete finally cast (kg/m³ dry weight) Concrete 40AG
0 40AK 0
40AK 2
40AK 4
40AR 0
40BK 0
40BR 0
55BK 0
55BK 2
55BK 4
55BR 0
70BG 0
70BK 0
70BK 2
70BK 4
70BR 0
Crushed 12 -16 624 595 572 0 857 602 1004 234 119 0 452 551 631 583 0 356 Crushed 8 -11 0 0 0 326 0 0 362 244 316 360 0 0 0 220 351 Gravel 0 -8 1043 1040 998 1176 758 1052 742 1049 1140 1198 1029 1166 1109 1015 1241 1088 Glass filler 62 0 79 0 0 Limestone powder 0 149 181 171 130 0 242 241 233 0 0 189 226 256 0 Byggcement 0 0 0 0 447 436 308 344 382 346 316 268 294 312 267 Degerhamn cement 430 411 433 487 518 Cementa 88L 0.161 Microair 0.188 Sikaair HPV 0.235 Sikaair15B 0.13 0.132 Water 172 164 173 195 206 179 175 170 189 210 191 222 188 207 219 195 Glenium (wet) 10.67 12.14 11.1 Peramin F 10.4 2.73 2.09 0 Sikament 56 4.05 4.82 8.2 9.78 8.16 10.14 5.3 9.41 4.89 Plastic fibre 2 4 2 4 2 4 0 Flytmedel (%) 1 1.2 1.85 1.7 2 2.2 0.6 1.5 1.75 2 0.57 1.65 3.5 1.64 2 Density 2330 2360 2360 2370 2350 2420 2360 2380 2390 2350 2380 2340 2394 2330 2320 2250 Air content (%) 5.0 5.1 2.5 2.8 4.0 - - 1.3 1.1 - 1.5 1.7 2.6 - - 5.0 Slump (flow) (mm) 620 680 670 600 200 660 90 670 630 600 220 630 600 660 600 80 T500 (s) 6 5 8 10 6 8 8 2 3 3 7 Prestress. (kN) 900 900 900 900 900 900 900 730 730 620 730 620 620 620 620 620 Approximate stress (20% stress losses; MPa)
18 18 18 18 18 18 18 15 15 12 15 12 12 12 12 12
Concrete 40AG 0
40AK 0
40AK 2
40AK 4
40AR 0
40BK 0
40BR 0
55BK 0
55BK 2
55BK 4
55BR 0
70BG 0
70BK 0
70BK 2
70BK 4
70BR 0
Notations: A = Degehamn cement (6% air), B = Byggcement (about 1 % air), G = Glass filler, K = Limestone powder, R = reference, 0 = 0 kg /m³ polypropylene fibre, 40 = w/c (%).

115
Appendix 4.7 – Strength development of concrete cast at LTH (MPa) Concrete 40AK0 40AK2 40AK4 40AK4-
new 40BK0 40BR0 55BK0 55BK0-
new 70BG0LTH 70BG0SGÅ 70BK0LTH 70BK0NKK
Date 21.5.01 2.5.02 11.6.01 28.5.02 9.5.01 2.4.01 9.5.01 20.6.02 10.5.01 14.8.01 19.4.01 7.5.01 1 days 17.5 13.5 10 15.5 41 44 29 18 15.5 21 19.5 19
17 17.5 10 15 40 44.5 30 19.5 16 21 20 20.5 1 days, av. 17.25 15.5 10 15.25 40.5 44.25 29.5 18.75 15.75 21 19.75 19.75
7 days 56 32.5 38.5 54.5 73 77 55 44.5 36 27 38 43 59 44.5 40 53 74.5 76.5 56 44 36.5 28 40.5 41
7 days, av. 57.5 38.5 39.25 53.75 73.75 76.75 55.5 44.25 36.25 27.5 39.25 42 28 days 80.5 64 42 67.5 91 85 72.5 53.5 54 33 52.5 60
75 68.75 42.5 63.5 92.5 85 71 51 55.5 38 55 58 28 days, av. 77.75 66.375 42.25 65.5 91.75 85 71.75 52.25 54.75 35.5 53.75 59
90 days 77 67 43 71 89.5 86 73 58 40 53 57 71 67 43.5 75 85.5 92.5 71 57 55.5 58
90 days, av. 74 67 43.25 73 87.5 89.25 72 53 57.5 40 54.25 57.5 Notations: A = Degerhamn cement (6% air), B = Byggcement (1% air), G = Glass filler, K = Limestone powder, R = reference, SGÅ = Svensk Glasåtervinning; NKK = Nordkalk; 0 = 0 kg polypropylenfibre/m³, 40 = w/c (%).

116
Appendix 4.8 – Strength development of concrete cast for SP at SPAB, Bollebygd (MPa)
Concrete Age Prestressing strength (MPa) Age (days) Cube 1 (MPa) Cube 1 (MPa) Av. (MPa) Density (kg/m³) 40AG0 2d 32.4 28 80.0 80.4 80.2 2380 40AK0 2d 36.0 28 88.4 88.4 88.4 2390 40AK2 2d 34.7 28 87.6 87.1 87.4 2420 40AK4 3d 44.4 28 84.4 78.2 81.3 2380 40AR0 3d 42.2 28 75.6 74.7 75.2 2400 40BK0 3d 60.4 28 80.9 78.7 79.8 2420 40BR0 3d 52.9 28 74.7 74.7 74.7 2460 55BK0 - - 28 68.9 67.1 68.0 2360 55BK2 - - 28 64.0 62.2 63.1 2370 55BK4 5d 48.9 28 65.8 64.9 65.4 2330 55BR0 - - 28 63.6 62.7 63.2 2390 70BG0 40h 22.2 28 48.0 48.0 48.0 2320 70BK0 7d 42.7 28 55.6 55.6 55.6 2390 70BK2 5d 30.2 28 39.1 40.0 39.6 2340 70BK4 5d 37.8 28 53.3 52.9 53.1 2320 70BR0 7d 30.2 28 40.4 40.9 40.7 2270 Notations: A = Degehamn cement (6% air), B = Byggcement (about 1 % air), G = Glass filler, K = Limestone powder, R = reference, 0 = 0 kg polypropylenfibre/m³ , 40 = w/c (%)

117
Appendix 4.9 – Stress/strain results of concrete 40AG0 at 20 °C.
y = 31.022x - 4.9635
0
10
20
30
40
50
60
70
80
0 5 10 15 20 25 30 35 40
Deformation (‰)
Stre
ss (M
Pa)
SBUFBRAND40AGO-20-20-1 Serie2
y = 26.984x - 20.238
0
10
20
30
40
50
60
70
80
0 5 10 15 20 25 30 35 40
Deformation (‰)
Stre
ss (M
Pa)
SBUFBRAND40AGO-20-20-2 Serie2

118
Appendix 4.10 – Stress/strain results of concrete 40AG0 at 200 °C – 20 °C.
y = 22.368x - 35.789
0
10
20
30
40
50
60
70
80
0 5 10 15 20 25 30 35 40
Deformation (‰)
Stre
ss (M
Pa)
SBUFBRAND40AGO-200-20-1 Serie2
y = 25.455x - 31.818
0
10
20
30
40
50
60
70
80
0 5 10 15 20 25 30 35 40
Deformation (per mil)
Stre
ss (M
Pa)
SBUFBRAND40AG0-200-20-2

119
Appendix 4.11 – Stress/strain results of concrete 40AG0 at 200 °C – 200 °C.
y = 15.741x - 28.333
0
10
20
30
40
50
60
70
80
0 5 10 15 20 25 30 35 40
Deformation (‰)
Stre
ss (M
Pa)
SBUFBRAND40AGO-200-20-1 Serie2
y = 25.455x - 31.818
0
10
20
30
40
50
60
70
80
0 5 10 15 20 25 30 35 40
Deformation (per mil)
Stre
ss (M
Pa)
SBUFBRAND40AG0-200-20-2
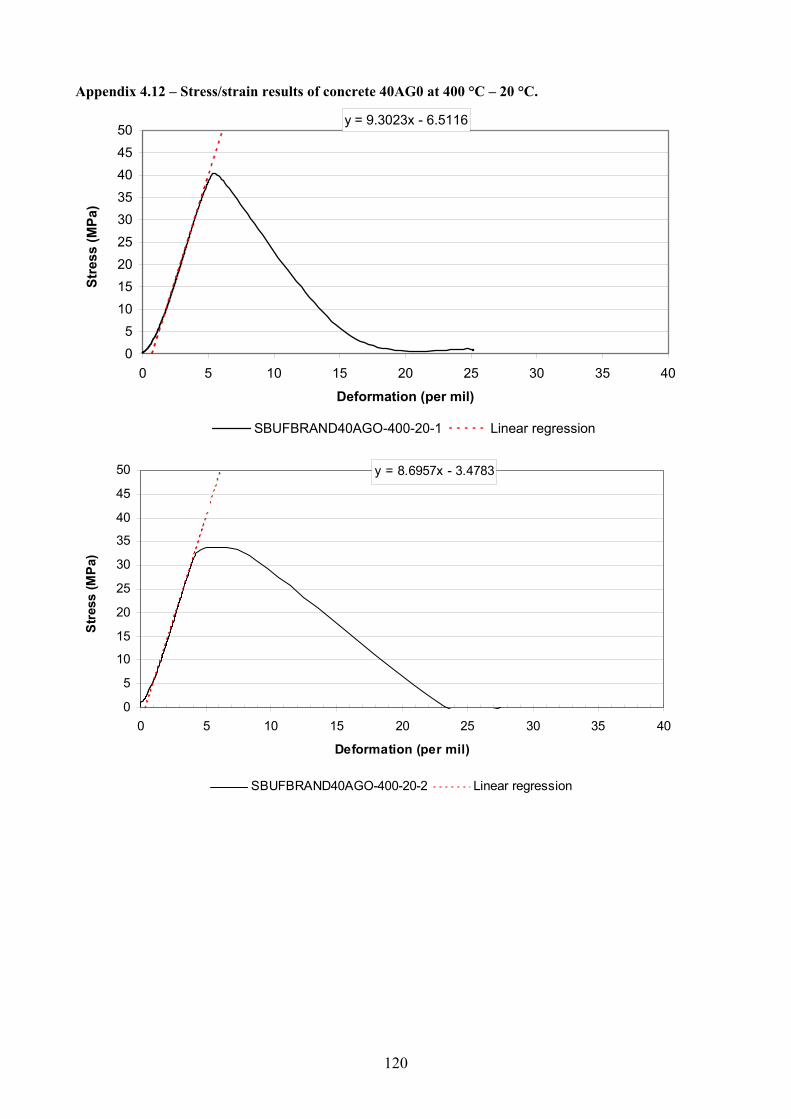
120
Appendix 4.12 – Stress/strain results of concrete 40AG0 at 400 °C – 20 °C.
y = 9.3023x - 6.5116
05
101520253035404550
0 5 10 15 20 25 30 35 40
Deformation (per mil)
Stre
ss (M
Pa)
SBUFBRAND40AGO-400-20-1 Linear regression
y = 8.6957x - 3.4783
0
5
10
15
20
25
30
35
40
45
50
0 5 10 15 20 25 30 35 40
Deformation (per mil)
Stre
ss (M
Pa)
SBUFBRAND40AGO-400-20-2 Linear regression
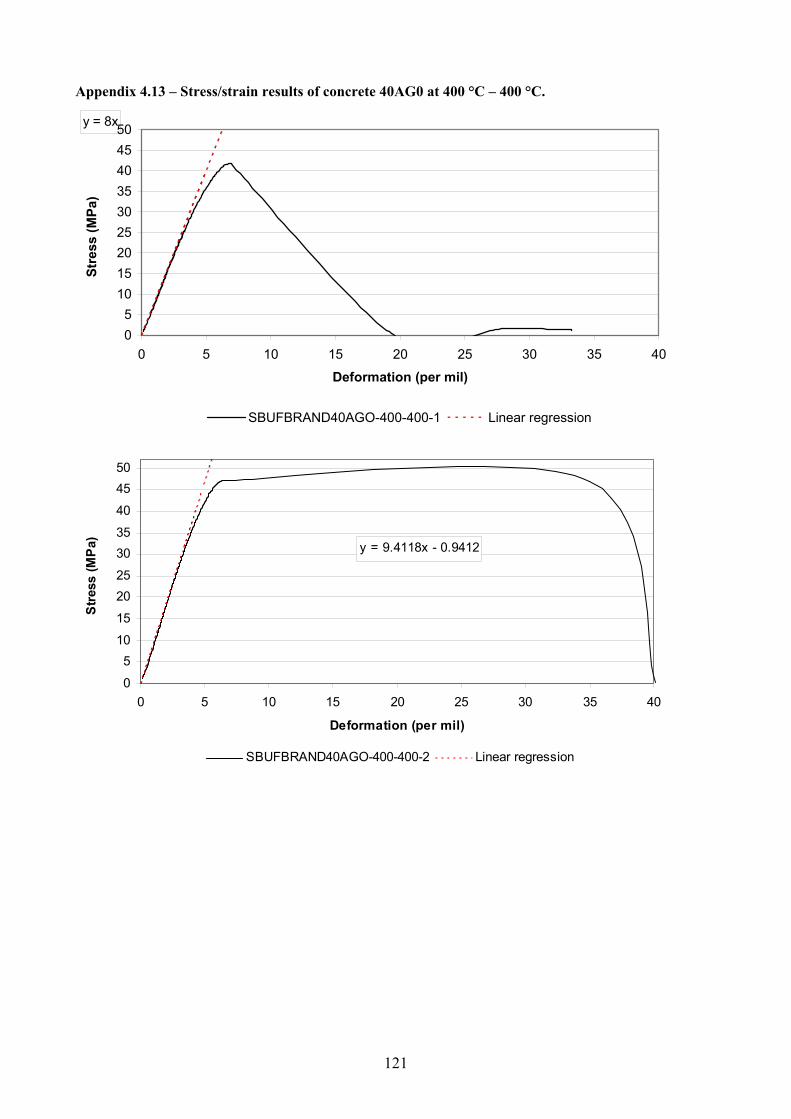
121
Appendix 4.13 – Stress/strain results of concrete 40AG0 at 400 °C – 400 °C.
y = 8x
05
101520253035404550
0 5 10 15 20 25 30 35 40
Deformation (per mil)
Stre
ss (M
Pa)
SBUFBRAND40AGO-400-400-1 Linear regression
y = 9.4118x - 0.9412
0
510
15
2025
3035
40
4550
0 5 10 15 20 25 30 35 40
Deformation (per mil)
Stre
ss (M
Pa)
SBUFBRAND40AGO-400-400-2 Linear regression

122
Appendix 4.14 – Stress/strain results of concrete 40AG0 at 800 °C – 20 °C.
y = 1.3187x - 1E-15
0
2
4
6
8
10
12
0 5 10 15 20 25 30 35 40Deformation (per mil)
Stre
ss (
MPa
)
SBUFBRAND800-20-1
y = 1.3187x - 1E-15
0
2
4
6
8
10
12
0 5 10 15 20 25 30 35 40Deformation (per mil)
Stre
ss (
MPa
)
SBUFBRAND40AG0-800-20-2

123
Appendix 4.15 – Stress/strain results of concrete 40AG0 at 800 °C – 800 °C.
y = 4.5455x
0
2
4
6
8
10
12
0 5 10 15 20 25 30 35 40
Deformation (‰)
Stre
ss (M
Pa)
SBUFBRAND40AGO-800-800-1 Serie2
y = 4.2553x + 1E-15
0
2
4
6
8
10
12
0 5 10 15 20 25 30 35 40
Deformation (‰)
Stre
ss (M
Pa)
sbufbrand40AGO-800-800-2 Serie2

124
Appendix 4.16 – Stress/strain results of concrete 40AK0 at 20 °C.
y = 22.973x - 35.608
0
10
20
30
40
50
60
70
80
0 5 10 15 20 25 30 35 40
Deformation (‰)
Stre
ss (M
Pa)
SBUFBRAND40AK0-20-20-1 Serie2
y = 25.602x - 17.41
0
10
20
30
40
50
60
70
80
0 5 10 15 20 25 30 35 40
Deformation (‰)
Stre
ss (M
Pa)
SBUFBRAND40AK0-20-20-2 Serie2

125
Appendix 4.17 – Stress/strain results of concrete 40AK0 at 200 °C – 20 °C.
y = 20.631x - 26.408
0
20
40
60
80
0 5 10 15 20 25 30 35 40
Deformation (‰)
Stre
ss (M
Pa)
SBUFBRAND40AK0-200-20-1 Serie2
y = 20.631x - 49.102
0
20
40
60
80
0 5 10 15 20 25 30 35 40
Deformation (‰)
Stre
ss (M
Pa)
SBUFBRAND40AK0-200-20-2 Serie2

126
Appendix 4.18 – Stress/strain results of concrete 40AK0 at 200 °C – 200 °C.
y = 22.269x - 24.941
0
10
20
30
40
50
60
70
80
0 5 10 15 20 25 30 35 40
Deformation (per mil)
Stre
ss (M
Pa)
SBUFBRAND40AK0-200-200-1 Linjär (Serie3)
y = 17.966x - 11.678
0
10
20
30
40
50
60
70
80
0 5 10 15 20 25 30 35 40
Deformation (per mil)
Stre
ss (M
Pa)
SBUFBRAND40AK0-200-200-2 Linjär (Serie3)
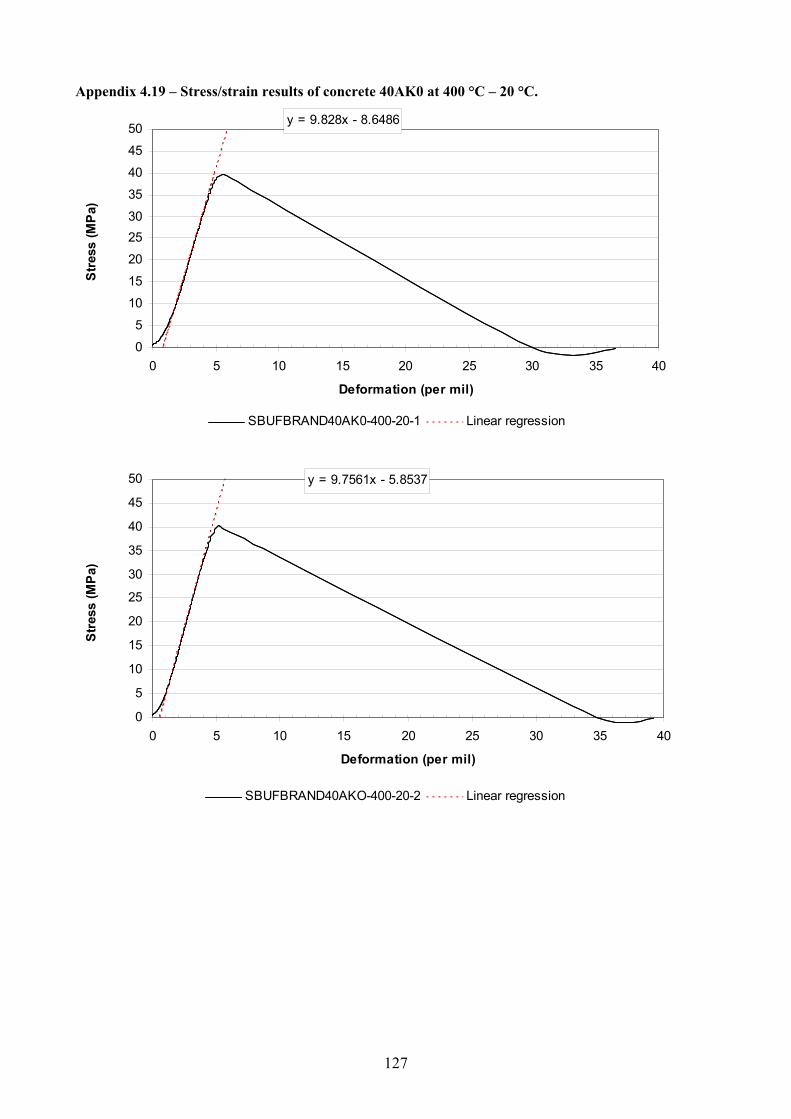
127
Appendix 4.19 – Stress/strain results of concrete 40AK0 at 400 °C – 20 °C.
y = 9.828x - 8.6486
0
5
10
15
20
2530
35
40
45
50
0 5 10 15 20 25 30 35 40
Deformation (per mil)
Stre
ss (M
Pa)
SBUFBRAND40AK0-400-20-1 Linear regression
y = 9.7561x - 5.8537
0
5
10
15
20
25
30
35
40
45
50
0 5 10 15 20 25 30 35 40
Deformation (per mil)
Stre
ss (M
Pa)
SBUFBRAND40AKO-400-20-2 Linear regression

128
Appendix 4.20 – Stress/strain results of concrete 40AK0 at 400 °C – 400 °C.
y = 10x - 2
05
101520253035404550
0 5 10 15 20 25 30 35 40
Deformation (per mil)
Stre
ss (M
Pa)
SBUFBRAND40AK0-400-400-1 Linear regression
y = 11.11x - 0.56
05
101520253035404550
0 5 10 15 20 25 30 35 40
Deformation (per mil)
Stre
ss (M
Pa)
SBUFBRAND40AK0-400-400-2 Linear regression

129
Appendix 4.21 – Stress/strain results of concrete 40AK0 at 800 °C – 800 °C.
y = 4.5455x
0
2
4
6
8
10
12
0 5 10 15 20 25 30 35 40
Deformation (‰)
Stre
ss (M
Pa)
SBUFBRAND40AKO-800-800-1 Serie2
y = 4.3478x - 1E-15
0
2
4
6
8
10
12
0 5 10 15 20 25 30 35 40
Deformation (‰)
Stre
ss (M
Pa)
SBUFBRAND40AKO-800-800-2 Serie2

130
Appendix 4.22 – Stress/strain results of concrete 40AK2 at 20 °C.
y = 28.333x - 59.5
0
10
20
30
40
50
60
70
80
0 5 10 15 20 25 30 35 40Deformation (‰)
Stre
ss (M
Pa)
SBUFBRAND40AK2-20-20-1 Serie2
y = 32.692x - 13.077
0
10
20
30
40
50
60
70
80
0 5 10 15 20 25 30 35 40 45 50
Deformation (‰)
Stre
ss (M
Pa)
SBUFBRAND40AK2-20-20-2 Serie2

131
Appendix 4.23 – Stress/strain results of concrete 40AK2 at 200 °C – 20 °C.
y = 20.988x - 13.642
0
10
20
30
40
50
60
70
80
0 5 10 15 20 25 30 35 40Deformation (‰)
Stre
ss (M
Pa)
SBUFBRAND40AK2-200-20-1
y = 20.988x - 13.642
0
10
20
30
40
50
60
70
80
0 5 10 15 20 25 30 35 40Deformation (‰)
Stre
ss (M
Pa)
SBUFBRAND40AK2-200-20-2

132
Appendix 4.24 – Stress/strain results of concrete 40AK2 at 200 °C – 200 °C.
y = 22.083x - 4.4167
0
10
20
30
40
50
60
70
80
0 5 10 15 20 25 30 35 40
Deformation (per mil)
Stre
ss (M
Pa)
SBUFBRAND40AK2-200-200-1 Linjär (Serie3)
y = 24.091x - 7.2273
0
10
20
30
40
50
60
70
80
0 5 10 15 20 25 30 35 40
Deformation (per mil)
Stre
ss (M
Pa)
sbufbrand40AK2-200-200-2 Linjär (Serie3)

133
Appendix 4.25 – Stress/strain results of concrete 40AK2 at 400 °C – 20 °C.
y = 11.73x - 5.1613
05
101520253035404550
0 5 10 15 20 25 30 35 40
Deformation (per mil)
Stre
ss (M
Pa)
SBUFBRAND40AK2-400-20-1 Linear regression
y = 12.5x - 10
05
101520253035404550
0 5 10 15 20 25 30 35 40
Deformation (per mil)
Stre
ss (M
Pa)
sbufbrand40AK2-400-20-2 Linear regression
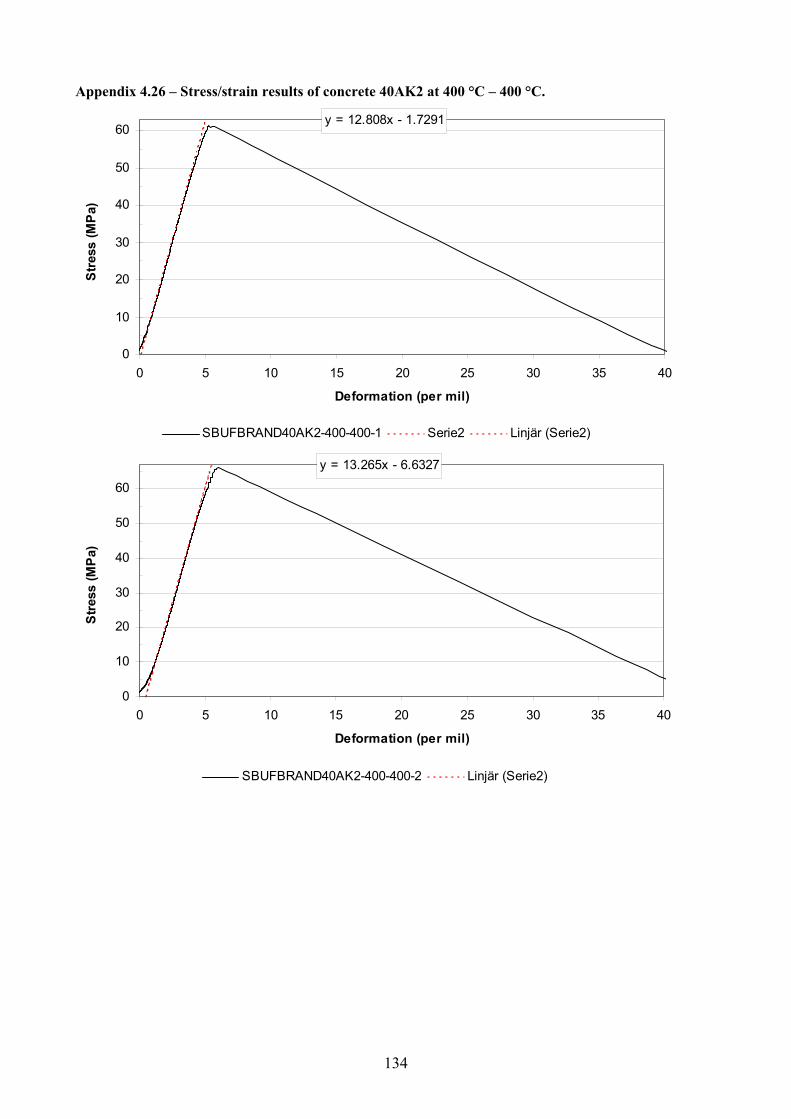
134
Appendix 4.26 – Stress/strain results of concrete 40AK2 at 400 °C – 400 °C.
y = 12.808x - 1.7291
0
10
20
30
40
50
60
0 5 10 15 20 25 30 35 40
Deformation (per mil)
Stre
ss (M
Pa)
SBUFBRAND40AK2-400-400-1 Serie2 Linjär (Serie2)
y = 13.265x - 6.6327
0
10
20
30
40
50
60
0 5 10 15 20 25 30 35 40
Deformation (per mil)
Stre
ss (M
Pa)
SBUFBRAND40AK2-400-400-2 Linjär (Serie2)
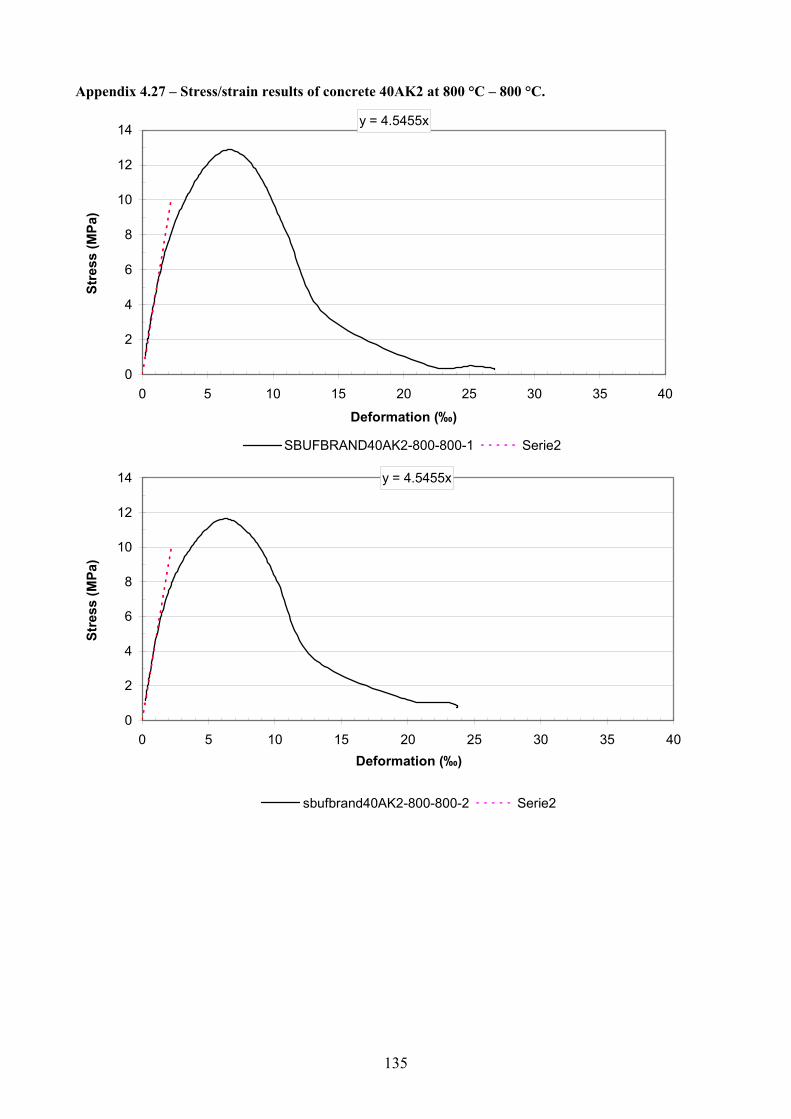
135
Appendix 4.27 – Stress/strain results of concrete 40AK2 at 800 °C – 800 °C.
y = 4.5455x
0
2
4
6
8
10
12
14
0 5 10 15 20 25 30 35 40
Deformation (‰)
Stre
ss (M
Pa)
SBUFBRAND40AK2-800-800-1 Serie2
y = 4.5455x
0
2
4
6
8
10
12
14
0 5 10 15 20 25 30 35 40Deformation (‰)
Stre
ss (M
Pa)
sbufbrand40AK2-800-800-2 Serie2

136
Appendix 4.28 – Stress/strain results of concrete 40AK4 at 20 °C.
y = 25.758x - 18.03
0
10
20
30
40
50
60
70
80
0 5 10 15 20 25 30 35 40Deformation (‰)
Stre
ss (M
Pa)
SBUFBRAND40AK4-20-20-1 Serie2
y = 26.646x - 22.915
0
10
20
30
40
50
60
70
80
0 5 10 15 20 25 30 35 40Deformation (‰)
Stre
ss (M
Pa)
sbufbrand40AK4-20-20-2 Serie2

137
Appendix 4.29 – Stress/strain results of concrete 40AK4 at 200 °C – 20 °C.
y = 23.288x - 33.767
0
10
20
30
40
50
60
70
80
0 5 10 15 20 25 30 35 40Deformation (‰)
Stre
ss (M
Pa)
SBUFBRAND40AK4-200-20-1 Linjär (Serie2)
y = 25.074x - 17.802
0
10
20
30
40
50
60
70
80
0 5 10 15 20 25 30 35 40Deformation (‰)
Stre
ss (M
Pa)
SBUFBRAND40AK4-200-20-2 Linjär (Serie2)

138
Appendix 4.30 – Stress/strain results of concrete 40AK4 at 200 °C – 200 °C.
y = 23.42x - 7.9628
0
10
20
30
40
50
60
70
80
0 5 10 15 20 25 30 35 40
Deformation (‰)
Stre
ss (M
Pa)
SBUFBRAND40AK4-200-200-1 Linjär (Serie2)
y = 21.212x - 21.212
0
10
20
30
40
50
60
70
80
0 5 10 15 20 25 30 35 40
Deformation (‰)
Stre
ss (M
Pa)
SBUFBRAND40AK4-200-200-2 Linjär (Serie2)

139
Appendix 4.31 – Stress/strain results of concrete 40AK4 at 400 °C – 20 °C.
y = 9.828x - 7.1744
05
101520253035404550
0 5 10 15 20 25 30 35 40
Deformation (per mil)
Stre
ss (M
Pa)
SBUFBRAND40AK4-400-20-1 Linear regression
y = 10.959x - 12.055
05
101520253035404550
0 5 10 15 20 25 30 35 40
Deformation (per mil)
Stre
ss (M
Pa)
sbufbrand40AK4-400-20-2 Linear regression
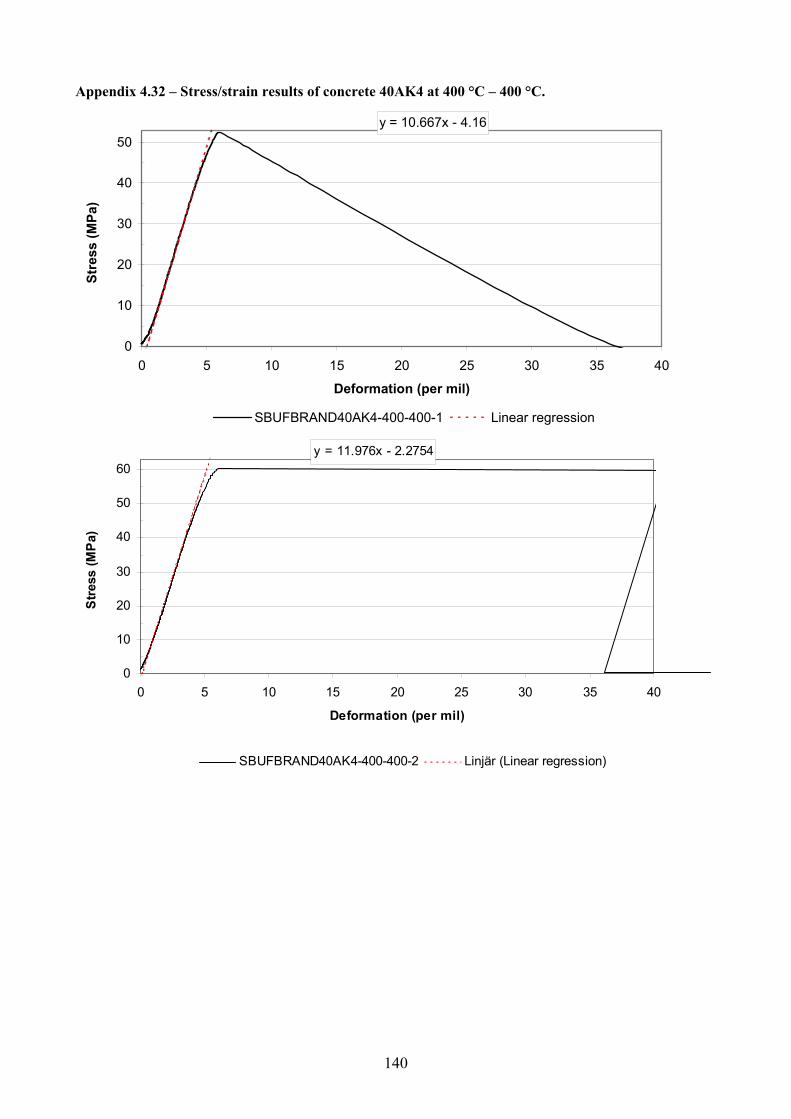
140
Appendix 4.32 – Stress/strain results of concrete 40AK4 at 400 °C – 400 °C.
y = 10.667x - 4.16
0
10
20
30
40
50
0 5 10 15 20 25 30 35 40
Deformation (per mil)
Stre
ss (M
Pa)
SBUFBRAND40AK4-400-400-1 Linear regression
y = 11.976x - 2.2754
0
10
20
30
40
50
60
0 5 10 15 20 25 30 35 40
Deformation (per mil)
Stre
ss (M
Pa)
SBUFBRAND40AK4-400-400-2 Linjär (Linear regression)

141
Appendix 4.33 – Stress/strain results of concrete 40AK4 at 800 °C – 800 °C.
y = 5x
0
2
4
6
8
10
12
0 5 10 15 20 25 30 35 40Deformation (‰)
Stre
ss (M
Pa)
SBUFBRAND40AK4-800-800-1 Serie2
y = 3.7037x
0
2
4
6
8
10
12
0 5 10 15 20 25 30 35 40
Deformation (‰)
Stre
ss (M
Pa)
SBUFBRAND40AK4-800-800-2 Serie2

142
Appendix 4.34 – Stress/strain results of concrete 40BR0 at 20 °C.
y = 31.25x - 8.4375
0
10
20
30
40
50
60
70
80
0 5 10 15 20 25 30 35 40
Deformation (per mil)
Stre
ss (M
Pa)
SBUFBRAND40BR0-020-020-1 Linjär (Linear regression)
y = 32.922x - 8.8889
0
10
20
30
40
50
60
70
80
0 5 10 15 20 25 30 35 40
Deformation (per mil)
Stre
ss (M
Pa)
SBUFBRAND40BR0-020-020-2 Linjär (Linear regression)

143
Appendix 4.35 – Stress/strain results of concrete 40BR0 at 200 °C – 20 °C.
y = 20x - 32
0
10
20
30
40
50
60
70
80
0 5 10 15 20 25 30 35 40
Deformation (per mil)
Stre
ss (M
Pa)
SBUFBRAND40BRO-200-20-1 Linjär (Linear regression)
y = 23.188x - 22.493
0
10
20
30
40
50
60
70
80
0 1 2 3 4 5 6
Deformation (per mil)
Stre
ss (M
Pa)
SBUFBRAND40BRO-200-20-2 Linjär (Linear regression)

144
Appendix 4.36 – Stress/strain results of concrete 40BR0 at 200 °C – 200 °C.
y = 21.622x - 41.081
0
10
20
30
40
50
60
70
80
0 5 10 15 20 25 30 35 40
Deformation (per mil)
Stre
ss (M
Pa)
SBUFBRAND40BRO-200-20-1 Linjär (Linear regression)
y = 20.253x - 51.646
0
10
20
30
40
50
60
70
80
0 5 10 15 20 25 30 35 40
Deformation (per mil)
Stre
ss (M
Pa)
SBUFBRAND40BR0-200-200-2 Linjär (Linear regression)

145
Appendix 4.37 – Stress/strain results of concrete 40BR0 at 400 °C – 20 °C.
y = 9.8765x - 6.4198
0
10
20
30
40
50
0 5 10 15 20 25 30 35 40Deformation (per mil)
Stre
ss (M
Pa)
SBUFBRAND40BR0-400-20-1 Linjär (Linear regression)
y = 10.39x - 11.429
0
10
20
30
40
50
0 5 10 15 20 25 30 35 40
Deformation (per mil)
Stre
ss (M
Pa)
SBUFBRAND40BR0-400-20-2 Linjär (Linear regression)

146
Appendix 4.38 – Stress/strain results of concrete 40BR0 at 400 °C – 400 °C.
y = 11.594x + 1.1594
0
10
20
30
40
50
60
0 5 10 15 20 25 30 35 40
Deformation (per mil)
Stre
ss (M
Pa)
SBUFBRAND40BR0-400-400-1 Linjär (Linear regression)
y = 11.594x + 1.1594
0
10
20
30
40
50
60
0 5 10 15 20 25 30 35 40
Deformation (per mil)
Stre
ss (M
Pa)
SBUFBRAND40BR0-400-400-2 Linjär (Linear regression)
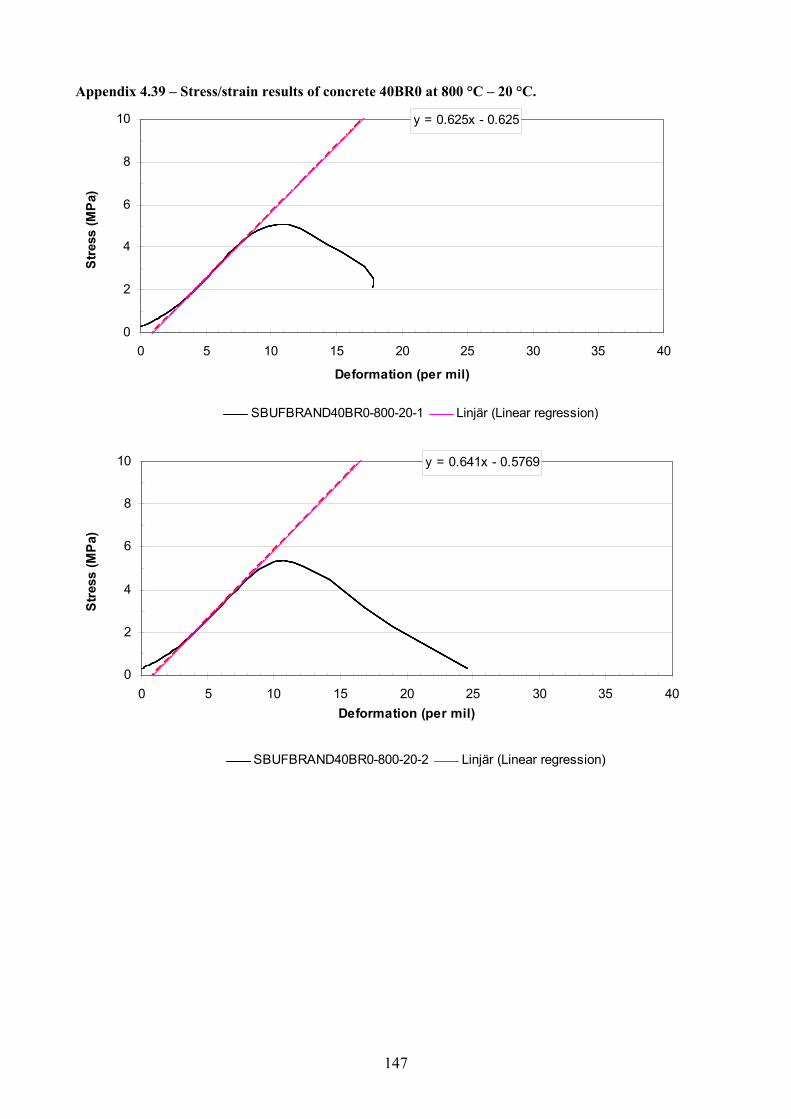
147
Appendix 4.39 – Stress/strain results of concrete 40BR0 at 800 °C – 20 °C.
y = 0.625x - 0.625
0
2
4
6
8
10
0 5 10 15 20 25 30 35 40
Deformation (per mil)
Stre
ss (M
Pa)
SBUFBRAND40BR0-800-20-1 Linjär (Linear regression)
y = 0.641x - 0.5769
0
2
4
6
8
10
0 5 10 15 20 25 30 35 40Deformation (per mil)
Stre
ss (M
Pa)
SBUFBRAND40BR0-800-20-2 Linjär (Linear regression)

148
Appendix 4.40 – Stress/strain results of concrete 40BR0 at 800 °C – 800 °C.
y = 3.125x + 1.25
0
2
4
6
8
10
0 5 10 15 20 25 30 35 40
Deformation (per mil)
Stre
ss (M
Pa)
SBUFBRAND40BR0-800-800-1 Linjär (Linear regression)
y = 3.125x + 1.25
0
2
4
6
8
10
0 5 10 15 20 25 30 35 40
Deformation (per mil)
Stre
ss (M
Pa)
SBUFBRAND40BR0-800-800-2 Linjär (Linear regression)

149
Appendix 4.41 – Stress/strain results of concrete 55BK0 at 20 °C.
y = 22.472x - 10.787
0
20
40
60
80
0 5 10 15 20 25 30 35 40
Deformation (per mil)
Stre
ss (M
Pa)
SBUFBRAND55BK0-20-20-1 Linjär (Linear regression)
y = 21.053x - 6.3158
0
20
40
60
80
0 5 10 15 20 25 30 35 40
Deformation (per mil)
Stre
ss (M
Pa)
sbufbrand55BK0-20-20-2 Linjär (Linear regression)
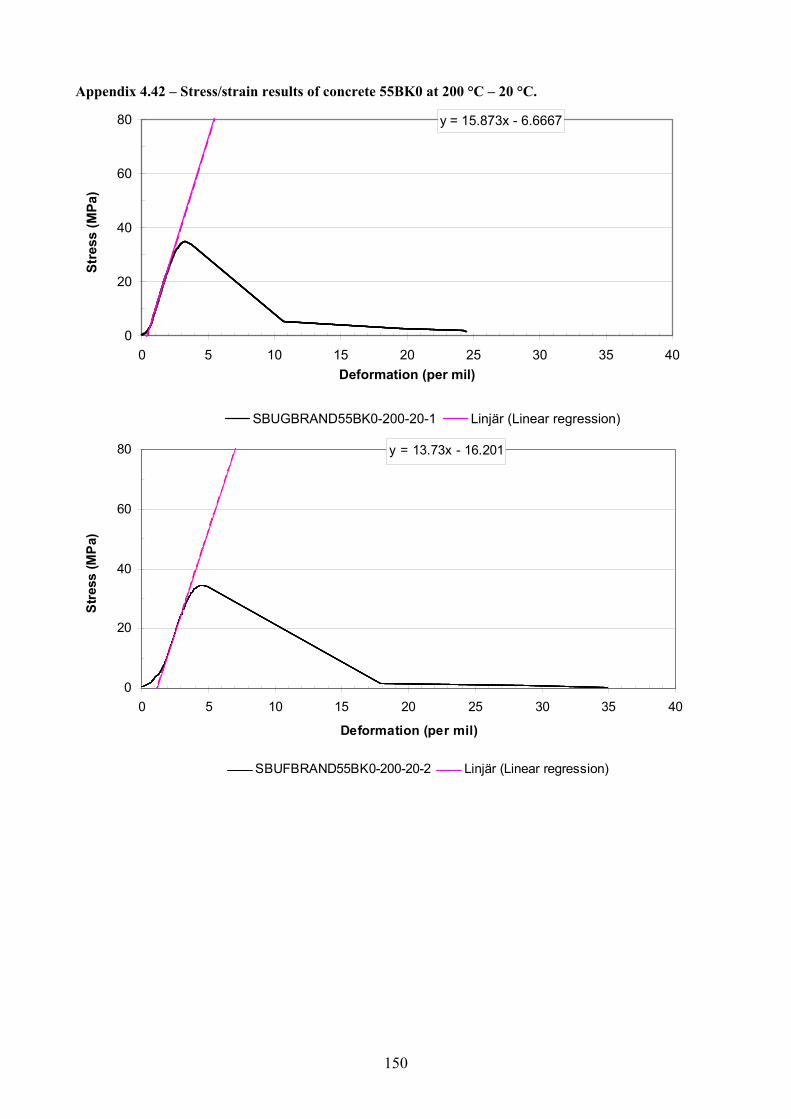
150
Appendix 4.42 – Stress/strain results of concrete 55BK0 at 200 °C – 20 °C.
y = 15.873x - 6.6667
0
20
40
60
80
0 5 10 15 20 25 30 35 40Deformation (per mil)
Stre
ss (M
Pa)
SBUGBRAND55BK0-200-20-1 Linjär (Linear regression)
y = 13.73x - 16.201
0
20
40
60
80
0 5 10 15 20 25 30 35 40
Deformation (per mil)
Stre
ss (M
Pa)
SBUFBRAND55BK0-200-20-2 Linjär (Linear regression)

151
Appendix 4.43 – Stress/strain results of concrete 55BK0 at 200 °C – 200 °C.
y = 15x
0
20
40
60
80
0 5 10 15 20 25 30 35 40
Deformation (per mil)
Stre
ss (M
Pa)
SBUFBRAND55BK0-200-200-1 Linjär (Linear regression)
y = 15x - 3.75
0
20
40
60
80
0 5 10 15 20 25 30 35 40
Deformation (per mil)
Stre
ss (M
Pa)
SBUFBRAND55BK0-200-200-2 Linjär (Linear regression)

152
Appendix 4.44 – Stress/strain results of concrete 55BK0 at 400 °C – 20 °C.
y = 6.772x - 2.0316
0
10
20
30
40
0 5 10 15 20 25 30 35 40Deformation (per mil)
Stre
ss (M
Pa)
SBUFBRAND55BK0-400-20-1 Linjär (Linear regression)
y = 6.1856x - 7.1134
0
10
20
30
40
0 5 10 15 20 25 30 35 40Deformation (per mil)
Stre
ss (M
Pa)
SBUFBRAND55BK0-400-20-2 Linjär (Linear regression)

153
Appendix 4.45 – Stress/strain results of concrete 55BK0 at 400 °C – 400 °C.
y = 7.1429x + 0.7143
0
10
20
30
40
0 5 10 15 20 25 30 35 40
Deformation (per mil)
Stre
ss (M
Pa)
SBUFBRAND55BK0-400-400-1 Linjär (Linear regression)
y = 8.3333x + 1.6667
0
10
20
30
40
0 5 10 15 20 25 30 35 40
Deformation (per mil)
Stre
ss (M
Pa)
SBUFBRAND55BK0-400-400-2 Linjär (Linear regression)

154
Appendix 4.46 – Stress/strain results of concrete 55BK0 at 800 °C – 800 °C.
y = 3.003x + 0.991
0
1
2
3
4
5
6
0 5 10 15 20 25 30 35 40
Deformation (per mil)
Stre
ss (M
Pa)
SBUFBRAND55BK0-800-800-2 Linjär (Linear regression)
y = 1.8018x + 0.991
0
1
2
3
4
5
0 5 10 15 20 25 30 35 40
Deformation (per mil)
Stre
ss (M
Pa)
SBUFBRAND55BK0-800-800-2 Linjär (Linear regression)

155
Appendix 4.47 – Stress/strain results of concrete 70BG0 at 20 °C.
y = 16.901x - 1.6901
0
10
20
30
40
0 5 10 15 20 25 30 35 40
Deformation (per mil)
Stre
ss (M
Pa)
SBUFBRAND70BG0-020-020-1 Linjär (Linear regression)
y = 14.286x - 17.857
0
10
20
30
40
0 1 2 3 4 5 6
Deformation (per mil)
Stre
ss (M
Pa)
SBUFBRAND70BG0-020-020-2 Linjär (Linear regression)

156
Appendix 4.48 – Stress/strain results of concrete 70BG0 at 200 °C – 20 °C.
y = 13.187x - 14.505
0
10
20
30
40
0 5 10 15 20 25 30 35 40
Deformation (per mil)
Stre
ss (M
Pa)
SBUFBRAND70BGO-200-20-1 Linjär (Linear regression)
y = 13.544x - 9.4808
0
10
20
30
40
0 5 10 15 20 25 30 35 40Deformation (per mil)
Stre
ss (M
Pa)
SBUFBRAND70BGO-200-20-2 Serie2

157
Appendix 4.49 – Stress/strain results of concrete 70BG0 at 200 °C – 200 °C.
y = 12.632x - 25.895
0
10
20
30
40
0 5 10 15 20 25 30 35 40Deformation (per mil)
Stre
ss (M
Pa)
SBUFBRAND70BGO-200-200-1 Serie2 Linjär (Serie2)
y = 13.333x - 18.667
0
10
20
30
40
0 5 10 15 20 25 30 35 40Deformation (per mil)
Stre
ss (M
Pa)
SBUFBRAND70BGO-200-200-2 Serie2

158
Appendix 4.50 – Stress/strain results of concrete 70BG0 at 400 °C – 20 °C.
y = 4.8193x - 2.1687
0
5
10
15
20
0 5 10 15 20 25 30 35 40Deformation (per mil)
Stre
ss (M
Pa)
SBUFBRAND70BGO-400-20-1 Linjär (Serie2)
y = 5.4054x - 2.4324
0
5
10
15
20
0 5 10 15 20 25 30 35 40Deformation (per mil)
Stre
ss (M
Pa)
SBUFBRAND70BGO-400-20-2 Linjär (Serie2)
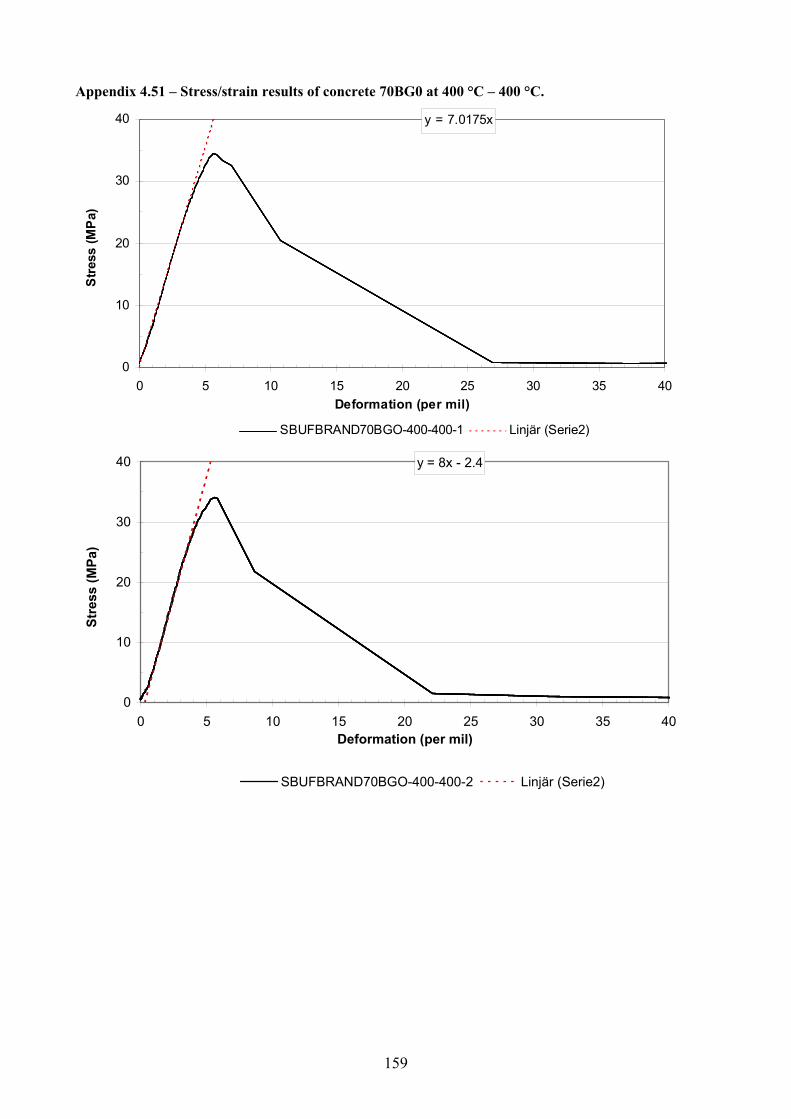
159
Appendix 4.51 – Stress/strain results of concrete 70BG0 at 400 °C – 400 °C.
y = 7.0175x
0
10
20
30
40
0 5 10 15 20 25 30 35 40Deformation (per mil)
Stre
ss (M
Pa)
SBUFBRAND70BGO-400-400-1 Linjär (Serie2)
y = 8x - 2.4
0
10
20
30
40
0 5 10 15 20 25 30 35 40Deformation (per mil)
Stre
ss (M
Pa)
SBUFBRAND70BGO-400-400-2 Linjär (Serie2)

160
Appendix 4.52 – Stress/strain results of concrete 70BG0 at 800 °C – 20 °C.
y = 0.5x + 0.5
0
1
2
3
4
5
0 5 10 15 20 25 30 35 40Deformation (per mil)
Stre
ss (M
Pa)
SBUFBRAND70BG0-800-20-1 Serie2 Linjär (Serie2)
y = 0.5102x + 0.2551
0
1
2
3
4
5
0 5 10 15 20 25 30 35 40Deformation (per mil)
Stre
ss (M
Pa)
SBUFBRAND70BG0-800-20-2 Linjär (Serie2)

161
Appendix 4.53 – Stress/strain results of concrete 70BG0 at 800 °C – 800 °C.
y = 1.5385x + 1.3077
0
1
2
3
4
5
0 5 10 15 20 25 30 35 40Deformation (per mil)
Stre
ss (M
Pa)
SBUFBRAND70BG0-800-800-1 Linjär (Serie2)
y = 1.6667x + 1.2
0
1
2
3
4
5
0 5 10 15 20 25 30 35 40Deformation (per mil)
Stre
ss (M
Pa)
SBUFBRAND70BG0-800-800-2 Linjär (Serie2)
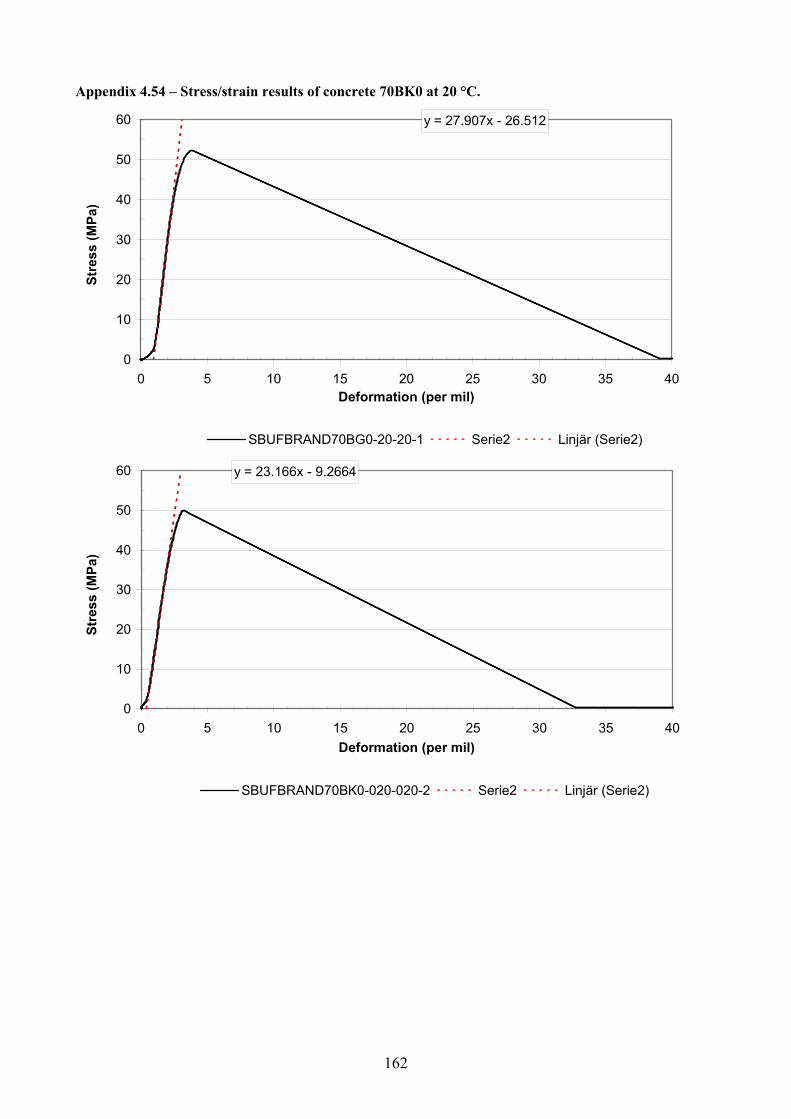
162
Appendix 4.54 – Stress/strain results of concrete 70BK0 at 20 °C.
y = 27.907x - 26.512
0
10
20
30
40
50
60
0 5 10 15 20 25 30 35 40Deformation (per mil)
Stre
ss (M
Pa)
SBUFBRAND70BG0-20-20-1 Serie2 Linjär (Serie2)
y = 23.166x - 9.2664
0
10
20
30
40
50
60
0 5 10 15 20 25 30 35 40Deformation (per mil)
Stre
ss (M
Pa)
SBUFBRAND70BK0-020-020-2 Serie2 Linjär (Serie2)

163
Appendix 4.55 – Stress/strain results of concrete 70BK0 at 200 °C – 20 °C.
y = 19.048x - 54.286
0
10
20
30
40
50
60
0 5 10 15 20 25 30 35 40Deformation (per mil)
Stre
ss (M
Pa)
SBUFBRAND70BKO-200-20-1 Linjär (Serie2)
y = 20.339x - 36.61
0
10
20
30
40
50
60
0 5 10 15 20 25 30 35 40Deformation (per mil)
Stre
ss (M
Pa)
SBUFBRAND70BKO-200-20-2 Serie2 Linjär (Serie2)

164
Appendix 4.56 – Stress/strain results of concrete 70BK0 at 200 °C – 200 °C.
y = 18.182x - 18.545
0
10
20
30
40
50
60
0 5 10 15 20 25 30 35 40Deformation (per mil)
Stre
ss (M
Pa)
SBUFBRAND70BK0-200-200-1 Linjär (Serie2)
y = 16.76x - 17.095
0
10
20
30
40
50
60
0 5 10 15 20 25 30 35 40Deformation (per mil)
Stre
ss (M
Pa)
SBUFBRAND70BK0-200-200-2 Serie2 Linjär (Serie2)

165
Appendix 4.57 – Stress/strain results of concrete 70BK0 at 400 °C – 20 °C.
y = 11.321x - 2.2642
0
10
20
30
40
50
60
0 5 10 15 20 25 30 35 40Deformation (per mil)
Stre
ss (M
Pa)
SBUFBRAND70BK0-400-20-1 Linjär (Serie2)
y = 10.619x - 5.8407
0
10
20
30
40
50
60
0 5 10 15 20 25 30 35 40Deformation (per mil)
Str
ess
(MP
a)
SBUFBRAND70BK0-400-20-2 Linjär (Serie2)

166
Appendix 4.58 – Stress/strain results of concrete 70BK0 at 400 °C – 400 °C.
y = 14.118x + 2.1176
0
10
20
30
40
50
60
0 5 10 15 20 25 30 35 40Deformation (per mil)
Stre
ss (M
Pa)
SBUFBRAND70BK0-400-400-1 Linjär (Serie2)
y = 9.375x - 7.9688
0
10
20
30
40
50
60
0 5 10 15 20 25 30 35 40Deformation (per mil)
Stre
ss (M
Pa)
SBUFBRAND70BK0-400-400-2 Linjär (Serie2)

167
Appendix 4.59 – Stress/strain results of concrete 70BK0 at 800 °C – 800 °C.
y = 3.3333x + 1.3333
0
5
10
15
20
0 5 10 15 20 25 30 35 40Deformation (per mil)
Stre
ss (M
Pa)
SBUFBRAND70BK0-800-800-1 Serie2 Linjär (Serie2)
y = 3.2787x + 1.3115
0
5
10
0 5 10 15 20 25 30 35 40Deformation (per mil)
Stre
ss (M
Pa)
SBUFBRAND70BK0-800-800-2 Serie2 Linjär (Serie2)

168
Appendices 5 - Analysis
Appendix 5.1 – Ideal distribution of particles in NC
Appendix 5.2 – Particle grading of fresh concrete optimised by LTH
Appendix 5.3 – Particle grading of fresh concrete optimised by Nordkalk and SGÅ
Appendix 5.4 – Results of residual properties after cooling at 20 °C and RH = about 40%.
Appendix 5.5 – Results of hot properties at elevated temperatures.
Appendix 5.6 – Properties at 20 °C
Appendix 5.7 – Properties at 20 °C after heating to 200 °C.
Appendix 5.8 - Edyn , Estat and compressive strength after heating to 200 °C.
Appendix 5.9 – Properties at 20 °C after heating to 400 °C.
Appendix 5.10 – Properties after heating to 400 °C.
Appendix 5.11 – Properties at 20 °C after heating to 800 °C.
Appendix 5.12 – Properties after heating to 800 °C.
Appendix 5.13 - Edyn and Estat versus compressive strength at 20 °C.
Appendix 5.14 - Edyn and Estat versus compressive strength at 20 °C after heating to 200 °C.
Appendix 5.15 - Edyn and Estat versus compressive strength after heating to 200 °C.
Appendix 5.16 - Edyn and Estat at 20 °C versus compressive strength after heating to 400 °C.
Appendix 5.17 - Edyn and Estat versus compressive strength after heating to 400 °C.
Appendix 5.18 - Edyn and Estat at 20 °C versus compressive strength after heating to 800 °C.
Appendix 5.19 - Edyn and Estat after heating to 800 °C.
Appendix 5.20 – Moisture losses at high temperatures of present study and [38,91].
Appendix 5.21 – RH before heating in cylinders of present study and of columns 200x200 mm [91].
Appendix 5.1 – Ideal distribution of particles in NC
0102030405060708090
100
0.00
1
0.00
2
0.00
4
0.00
8
0.01
6
0.03
2
0.06
3
0.12
5
0.25
0
0.50
0
1.00
0
2.00
0
4.00
0
5.60
0
8.00
0
11.2
00
16.0
00
Sieve width (µm)
Mat
eria
l pas
sing
(%)
K25 K60 K90 K120 K150

169
Appendix 5.2 – Particle grading of fresh concrete optimised by LTH.
0.00
0.10
0.20
0.30
0.40
0.50
0.60
0.70
0.80
0.90
1.00
0.001 0.010 0.100 1.000 10.000
Sieve dimension (mm)
Mat
eria
l pas
sing
thro
ugh
40AG0 40AK0 40AK4 40BK0 40BR0 55BK055BK4 55BR0 70BG0 70BK0 70BK4 70BR0

170
Appendix 5.3 Grading of fresh concrete optimised by Nordkalk and SGÅ
0.00
0.10
0.20
0.30
0.40
0.50
0.60
0.70
0.80
0.90
1.00
0.001 0.010 0.100 1.000 10.000
Sieve dimension (mm)
Mat
eria
l pas
sing
thro
ugh
40AG0 40AK0 40AK2 40AK4 40BK0 55BK055BK2 55BK4 70BG0 70BK0 70BK2 70BK4

171
Appendix 5.4 – Results of residual properties after cooling at 20 °C and RH = about 40%. Residual E-modulus (GPa) 40AG0 40AK0 40AK2 40AK4 40BR0 55BK0 70BG0 70BK0
20.00 31.00 25.60 28.33 25.76 31.25 21.05 16.90 27.9120.00 27.00 23.00 32.70 26.65 32.92 22.47 14.29 23.17
200.00 22.40 20.60 25.80 23.29 20.00 13.73 13.18 19.05200.00 24.60 21.00 19.30 25.07 23.19 15.87 13.54 20.34400.00 9.30 9.83 11.70 9.83 9.88 6.19 4.82 11.32400.00 8.70 9.76 12.50 11.00 10.39 6.77 5.41 10.62800.00 1.32 0.00 0.00 0.00 0.63 0.00 0.50 0.00800.00 1.32 0.00 0.00 0.00 0.64 0.00 0.51 0.00
On average residual E-modulus (GPa) 40AG0 40AK0 40AK2 40AK4 40BR0 55BK0 70BG0 70BK020 °C 29.00 24.30 30.52 26.21 32.09 21.76 15.60 25.54200 °C 23.50 20.80 22.55 24.18 21.60 14.80 13.36 19.70400 °C 9.00 9.80 12.10 10.42 10.14 6.48 5.12 10.97800 °C 1.32 0.00 0.00 0.00 0.64 0.00 0.51 0.00Residual strain (‰) 40AG0 40AK0 40AK2 40AK4 40BR0 55BK0 70BG0 70BK0
20.00 2.74 3.57 4.88 3.40 3.38 3.73 3.37 3.8620.00 3.24 6.50 3.49 3.63 3.07 3.81 4.43 3.29
200.00 4.43 4.34 3.91 4.56 5.31 4.44 4.51 5.83200.00 4.35 3.47 7.85 4.03 4.45 3.32 5.15 4.68400.00 5.41 5.59 4.90 4.84 5.60 5.76 5.55 4.05400.00 5.30 5.21 5.60 4.95 5.84 4.61 5.10 4.34800.00 10.00 0.00 0.00 0.00 10.50 0.00 9.76 0.00800.00 9.51 0.00 0.00 0.00 10.80 0.00 10.50 0.00
On average residual strain (‰) 40AG0 40AK0 40AK2 40AK4 40BR0 55BK0 70BG0 70BK020 °C 2.99 5.04 4.19 3.52 3.23 3.77 3.90 3.58200 °C 4.39 3.91 5.88 4.30 4.88 3.88 4.83 5.26400 °C 5.36 5.40 5.25 4.90 5.72 5.19 5.33 4.20800 °C 9.76 0.00 0.00 0.00 10.65 0.00 10.13 0.00Residual strength (MPa) 40AG0 40AK0 40AK2 40AK4 40BR0 55BK0 70BG0 70BK0
20.00 60.40 57.90 65.50 59.70 73.24 45.30 38.20 52.3720.00 60.30 56.60 74.60 58.67 69.65 45.90 35.10 50.00
200.00 57.75 56.10 77.30 60.40 57.39 34.51 32.10 41.80200.00 71.66 53.90 76.50 67.70 65.37 35.02 44.56 47.10400.00 40.30 39.77 45.70 37.20 39.92 22.42 18.85 36.00400.00 33.80 40.35 47.20 38.20 40.47 23.00 18.92 33.36800.00 11.46 0.00 0.00 0.00 5.10 0.00 4.81 0.00800.00 11.53 0.00 0.00 0.00 5.34 0.00 4.13 0.00
On average residual strength (MPa) 40AG0 40AK0 40AK2 40AK4 40BR0 55BK0 70BG0 70BK020 °C 60.35 57.25 70.05 59.19 71.45 45.60 36.65 51.19200 °C 64.71 55.00 76.90 64.05 61.38 34.77 38.33 44.45400 °C 37.05 40.06 46.45 37.70 40.20 22.71 18.89 34.68800 °C 11.50 0.00 0.00 0.00 5.22 0.00 4.47 0.00 Relative residual E-modulus 40AG0 40AK0 40AK2 40AK4 40BR0 55BK0 70BG0 70BK020 °C 1.00 1.00 1.00 1.00 1.00 1.00 1.00 1.00200 °C 0.81 0.86 0.74 0.92 0.67 0.68 0.86 0.77400 °C 0.31 0.40 0.40 0.40 0.32 0.30 0.33 0.43800 °C 0.05 0.02 0.03 Relative residual strain 40AG0 40AK0 40AK2 40AK4 40BR0 55BK0 70BG0 70BK020 °C 1.00 1.00 1.00 1.00 1.00 1.00 1.00 1.00200 °C 1.47 0.78 1.41 1.22 1.51 1.03 1.24 1.47400 °C 1.79 1.07 1.25 1.39 1.77 1.38 1.37 1.17800 °C 3.26 0.00 0.00 0.00 3.30 0.00 2.60 0.00Relative residual strength 40AG0 40AK0 40AK2 40AK4 40BR0 55BK0 70BG0 70BK020 °C 1.00 1.00 1.00 1.00 1.00 1.00 1.00 1.00200 °C 1.07 0.96 1.10 1.08 0.86 0.76 1.05 0.87400 °C 0.61 0.70 0.66 0.64 0.56 0.50 0.52 0.68800 °C 0.19 0.00 0.00 0.00 0.07 0.00 0.12 0.00

172
Appendix 5.5 – Results of hot properties at elevated temperatures. Hot E-modulus (MPa) 40AG0 40AK0 40AK2 40AK4 40BR0 55BK0 70BG0 70BK0 20.00 31 25.6 28.33 25.76 31.25 21.05 16.90 27.91 20.00 27 23 32.7 26.65 32.92 22.47 14.29 23.17 200.00 16.6 22.27 22.1 23.42 20 15.00 12.63 18.18 200.00 21.25 18 24.1 21.21 23.19 15.00 13.33 16.76 400.00 8 10 12.81 10.67 9.88 8.33 7.02 14.11 400.00 9.41 11.11 13.27 11.98 10.39 7.14 8.00 9.38 800.00 4.55 4.54 4.55 5 0.63 1.80 1.67 1.91 800.00 4.26 4.35 4.55 5 0.64 3.13 1.54 3.28 On average hot E-modulus (MPa) 40AG0 40AK0 40AK2 40AK4 40BR0 55BK0 70BG0 70BK0 20 °C 29.00 24.30 30.52 26.21 32.09 21.76 15.60 25.54 200 °C 18.93 20.14 23.10 22.32 21.60 15.00 12.98 17.47 400 °C 8.71 10.56 13.04 11.33 10.14 7.74 7.51 11.75 800 °C 4.41 4.45 4.55 5.00 0.64 2.47 1.61 2.60 Hot strain (‰) 40AG0 40AK0 40AK2 40AK4 40BR0 55BK0 70BG0 70BK0 20.00 2.74 3.57 4.88 3.4 3.38 3.73 3.37 3.86 20.00 3.24 6.5 3.49 3.63 3.07 3.81 4.43 3.29 200.00 5.33 4 3.43 2.95 5.31 3.91 6.48 4.71 200.00 5.51 3.66 6.55 4.44 4.45 3.74 5.55 4.67 400.00 6.91 6.34 5.28 5.92 5.6 5.67 5.61 4.14 400.00 6.41 6.49 6.06 6.03 5.84 5.55 5.56 5.59 800.00 5.59 6.91 6.52 4.55 10.5 5.81 6.84 9.58 800.00 4.87 6.7 6.43 4.55 10.8 6.48 7.11 2.77 On average hot strain (‰) 40AG0 40AK0 40AK2 40AK4 40BR0 55BK0 70BG0 70BK0 20 °C 2.99 5.04 4.19 3.52 3.23 3.77 3.90 3.58 200 °C 5.42 3.83 4.99 3.70 4.88 3.83 6.02 4.69 400 °C 6.66 6.42 5.67 5.98 5.72 5.61 5.59 4.87 800 °C 5.23 6.81 6.48 4.55 10.65 6.15 6.98 6.18 Hot strength (MPa) 40AG0 40AK0 40AK2 40AK4 40BR0 55BK0 70BG0 70BK0 20.00 60.4 57.9 65.5 59.7 73.24 45.30 38.20 52.37 20.00 60.3 56.6 74.6 58.67 69.65 45.90 35.10 50.00 200.00 52.9 55.9 65.1 57.95 57.39 40.50 43.60 51.70 200.00 63.49 49.9 65.4 65.2 65.37 41.26 43.10 50.60 400.00 41.73 48.15 61.53 52.38 39.92 35.42 34.60 42.25 400.00 47.1 52.18 66 60.3 40.47 33.20 34.10 40.11 800.00 9.11 11.36 12.9 8.55 5.1 3.80 3.66 15.27 800.00 6.59 11.23 11.64 8.55 5.34 6.15 3.86 4.78 On average hot strength (MPa) 40AG0 40AK0 40AK2 40AK4 40BR0 55BK0 70BG0 70BK0 20 °C 60.35 57.25 70.05 59.19 71.45 45.60 36.65 51.19 200 °C 58.20 52.90 65.25 61.58 61.38 40.88 43.35 51.15 400 °C 44.42 50.17 63.77 56.34 40.20 34.31 34.35 41.18 800 °C 7.85 11.30 12.27 8.55 5.22 4.98 3.76 10.03 Relative hot E-modulus 40AG0 40AK0 40AK2 40AK4 40BR0 55BK0 70BG0 70BK0 20 °C 1.00 1.00 1.00 1.00 1.00 1.00 1.00 1.00 200 °C 0.65 0.83 0.76 0.85 0.72 0.52 0.45 0.60 400 °C 0.30 0.43 0.43 0.43 0.40 0.27 0.26 0.41 800 °C 0.15 0.18 0.15 0.19 0.11 0.09 0.06 0.09 Relative hot strain 40AG0 40AK0 40AK2 40AK4 40BR0 55BK0 70BG0 70BK0 20 °C 1.00 1.00 1.00 1.00 1.00 1.00 1.00 1.00 200 °C 1.81 0.76 1.19 1.05 1.90 1.28 2.01 1.57 400 °C 2.23 1.27 1.35 1.70 1.73 1.88 1.87 1.63 800 °C 1.75 1.35 1.55 1.29 2.01 2.06 2.33 2.07 Relative hot strength 40AG0 40AK0 40AK2 40AK4 40BR0 55BK0 70BG0 70BK0 20 °C 1.00 1.00 1.00 1.00 1.00 1.00 1.00 1.00 200 °C 0.96 0.92 0.93 1.04 1.06 0.68 0.72 0.85 400 °C 0.74 0.88 0.91 0.95 0.86 0.57 0.57 0.68 800 °C 0.13 0.20 0.18 0.14 0.10 0.08 0.06 0.17

173
Appendix 5.6 – Properties at 20 °C Concrete 40AG0 40AK0 40AK2 40AK4 40BR0 55BKO 70BG0 70BK0 20 °C Specimen 1 (20 °C) Date 28/08/2002 28/08/2002 28/08/2002 28/08/2002 13/06/2002 28/08/2002 13/06/2002 13/06/2002 Weight (g) 3633 3604 3824 3765 3819 3641 3485 3742 FRF (kHz) 6.54 6.44 7.02 6.87 6.55 6.2 5.53 6.26 fc (MPa) 60.44 57.88 65.46 59.69 73.24 45.90 38.20 52.37 Ult. load. (kN) 474.70 454.59 514.12 468.81 575.23 360.50 300.02 411.31 RH -cal. (%) 97 97 94 68 68 71Specimen 2 (20 °C) Date 28/08/2002 28/08/2002 28/08/2002 28/08/2002 13/06/2002 28/08/2002 13/06/2002 13/06/2002 Weight (g) 3637 3578 3804 3711 3790 3613 3504 3705 FRF (kHz) 6.48 6.41 6.95 6.84 6.6 6.21 5.57 6.25 fc (MPa) 60.29 56.58 74.62 58.67 69.65 45.30 35.07 50.02 Ult. load. (kN) 473.52 444.38 586.07 460.79 547.03 355.79 275.44 392.86 RH -cal. (%) 97 93 97 68 66 65On average 20 °C Weight (g) 3635 3591 3814 3738 3804.5 3627 3494.5 3723.5 FRF (kHz) 6.51 6.425 6.985 6.855 6.575 6.205 5.55 6.255 fc (MPa) £60.37 £57.23 £70.04 £59.18 £71.45 £45.60 £36.64 £51.20 RH -cal. (%) 97 95.0 95.5 67.5 67.0 67.8Concrete 40AG0 40AK0 40AK2 40AK4 40BR0 55BKO 70BG0 70BK0 fc1 (MPa) 60.44 57.88 65.46 59.69 73.24 45.90 38.20 52.37 Edyn1 (GPa) 33.25 31.99 40.33 38.03 35.06 29.95 22.81 31.38 Estat1 (GPa) 31 25.7 28.33 25.76 31.25 22.47 16.9 27.91Concrete 40AG0 40AK0 40AK2 40AK4 40BR0 55BKO 70BG0 70BK0 fc2 (MPa) 60.29 56.58 74.62 58.67 69.65 45.30 35.07 50.02 Edyn2 (GPa) 32.68 31.46 39.32 37.15 35.33 29.82 23.26 30.97 Estat2 (GPa) 27 23 32.7 26.65 32.92 21.05 14.29 23.17

174
Appendix 5.7 – Properties at 20 °C after heating to 200 °C.
Concrete 40AG0 40AK0 40AK2 40AK4 40BR0 55BKO 70BG0 70BK0 200 °C Specimen 1 (20 °C) Date 30/08/2002 30/08/2002 30/08/2002 30/08/2002 04/07/2002 30/08/2002 04/07/2002 04/07/2002 Weight (g) 3685 3570 3812 3715 3730 3628 3463 3591 FRF (kHz) 6.56 6.4 6.97 6.67 4.79 6.17 4.47 5.37 T (°C) 20 20 20 20 20 20 20 20 Ult. load. (kN) 453.49 440.30 607.04 474.38 450.82 275.05 252.11 328.22 fc (MPa) 57.74 56.06 77.29 60.40 57.40 35.02 32.10 41.79Specimen 2 (20 °C) Date 30/08/2002 30/08/2002 30/08/2002 30/08/2002 04/07/2002 30/08/2002 04/07/2002 04/07/2002 Weight (g) 3749 3562 3798 3784 3696 3640 3387 3624 FRF (kHz) 6.84 6.39 6.75 6.6 5.1 6.2 4.52 5.25 T (°C) 20 20 20 20 20 20 20 20 Ult. load. (kN) 562.82 423.09 600.99 531.48 513.42 271.04 350.05 369.61 fc (MPa) 71.66 53.87 76.52 67.67 65.37 34.51 44.57 47.06On average 20 °C Weight (g) 3717 3566 3805 3749.5 3713 3634 3425 3607.5 FRF (kHz) 6.7 6.395 6.86 6.635 4.945 6.185 4.495 5.31 T (°C) 20 20 20 20 20 20 20 20 fc (MPa) 64.70 54.97 76.91 64.04 61.39 34.77 38.34 44.43Concrete 40AG0 40AK0 40AK2 40AK4 40BR0 55BKO 70BG0 70BK0 fc1 (MPa) 57.74 56.06 77.29 60.40 57.40 35.02 32.10 41.79 Edyn1 (GPa) 33.94 31.29 39.63 35.37 18.31 29.56 14.81 22.16 Estat1 (GPa) 22.4 20.63 25.8 23.29 20 15.87 13.18 19.05Concrete 40AG0 40AK0 40AK2 40AK4 40BR0 55BKO 70BG0 70BK0 fc2 (MPa) 71.66 53.87 76.52 67.67 65.37 34.51 44.57 47.06 Edyn2 (GPa) 37.54 31.13 37.03 35.27 20.57 29.94 14.81 21.38 Estat2 (GPa) 24.6 21 19.3 25.08 23.19 13.73 13.54 20.34

175
Appendix 5.8 - Edyn , Estat and compressive strength after heating to 200 °C. Concrete 40AG0 40AK0 40AK2 40AK4 40BR0 55BKO 70BG0 70BK0 200 °C Specimen 1 (200 °C) Date 05/09/2002 05/09/2002 05/09/2002 05/09/2002 02/07/2002 05/09/2002 11/07/2002 09/07/2002 Weight (g) 3750 3737 3751 3733 3695 3636 3428 3612 FRF (kHz) 6.92 6.74 6.87 6.73 5.11 6.19 4.54 5.27 T (°C) 200 200 200 Ult. load. (kN) 415.16 439.27 511.22 455.14 495.67 324.06 342.36 406.29 fc (MPa) 52.86 55.93 65.09 57.95 63.11 41.26 43.59 51.73Specimen 2 (200 °C) Date 05/09/2002 05/09/2002 05/09/2002 05/09/2002 03/07/2002 05/09/2002 11/07/2002 09/07/2002 Weight (g) 3657 3510 3773 3755 3731 3689 3491 3589 FRF (kHz) 6.57 6.27 6.9 6.78 5.05 6.27 4.53 5.25 T (°C) 200 200 200 Ult. load. (kN) 498.65 391.91 513.34 512.08 514.59 318.09 338.59 397.49 fc (MPa) 63.49 49.90 65.36 65.20 65.52 40.50 43.11 50.61On average 200 °C Weight (g) 3703.50 3623.50 3762.00 3744.00 3713.00 3662.50 3459.50 3600.50 FRF (kHz) 6.75 6.51 6.89 6.76 5.08 6.23 4.54 5.26 T (°C) 200.00 200.00 200.00 fc (MPa) 58.18 52.92 65.23 61.58 64.32 40.88 43.35 51.17Concrete 40AG0 40AK0 40AK2 40AK4 40BR0 55BKO 70BG0 70BK0 fc1 (MPa) 52.86 55.93 65.09 57.95 63.11 41.26 43.59 51.73 Estat1 (GPa) 16.6 22.27 22.1 23.47 21.62 15 12.63 18.18Concrete 40AG0 40AK0 40AK2 40AK4 40BR0 55BKO 70BG0 70BK0 fc2 (MPa) 63.49 49.90 65.36 65.20 65.52 40.50 43.11 50.61 Estat2 (GPa) 21.25 18 24.1 21.21 20.25 15 13.33 16.76

176
Appendix 5.9 – Properties at 20 °C after heating to 400 °C. Concrete 40AG0 40AK0 40AK2 40AK4 40BR0 55BKO 70BG0 70BK0 Specimen 1 (20 °C) Date 13/09/2002 13/09/2002 16/09/2002 16/09/2002 16/09/2002 16/09/2002 17/09/2002 17/09/2002 Weight (g) 3610 3563 3753 3786 3820 3646 3548 3683 FRF (kHz) 6.53 6.34 6.83 6.75 6.47 6.22 5.6 6.26 T (°C) 25 25 22 22 22 22 22 22 Ult. load. (kN) 316.59 312.35 359.08 292.09 313.53 180.64 148.13 282.74 fc (MPa) 40.31 39.77 45.72 37.19 39.92 23.00 18.86 36.00Specimen 2 (20 °C) Date 13/09/2002 13/09/2002 16/09/2002 16/09/2002 16/09/2002 16/09/2002 17/09/2002 17/09/2002 Weight (g) 3626 3582 3848 3774 3830 3632 3532 3675 FRF (kHz) 6.52 6.33 6.96 6.8 6.54 6.28 5.61 6.23 T (°C) 25 25 22 22 22 22 22 22 Ult. load. (kN) 265.15 316.91 370.71 299.63 316.99 176.09 148.68 262.01 fc (MPa) 33.76 40.35 47.20 38.15 40.36 22.42 18.93 33.36On average 20 °C Weight (g) 3618 3572.5 3800.5 3780 3825 3639 3540 3679 FRF (kHz) 6.525 6.335 6.895 6.775 6.505 6.25 5.605 6.245 T (°C) 25 25 22 22 22 22 22 22 fc (MPa) 37.04 40.06 46.46 37.67 40.47 22.71 18.90 34.68After cooling: FRF (kHz) 1 3.72 3.88 4.03 3.7 3.29 3.65 3.32 4.27 FRF (kHz) 2 3.69 3.79 4.05 3.84 3.49 3.72 3.45 4.15 Weight (g) 1 3338 3294 3507 3538 3658 3458 3405 3582 Weight (g) 2 3341 3319 3599 3528 3668 3452 3392 3573fc1 (MPa) 40.31 39.77 45.72 37.19 39.92 23.00 18.86 36.00 Edyn1 (GPa) 9.89 10.61 12.19 10.37 8.47 9.86 8.03 13.98 Estat1 (GPa) 9.3 9.83 11.7 9.83 9.87 6.77 4.82 11.32fc2 (MPa) 33.76 40.35 47.20 38.15 40.36 22.42 18.93 33.36 Edyn2 (GPa) 9.74 10.20 12.63 11.13 9.56 10.22 8.64 13.17 Estat2 (GPa) 8.7 9.76 12.5 11 10.39 6.19 5.41 10.62 Moisture loss: 0.92 0.93 0.93 0.93 0.96 0.95 0.96 0.97

177
Appendix 5.10 – Properties after heating to 400 °C. Concrete 40AG0 40AK0 40AK2 40AK4 40BR0 55BKO 70BG0 70BK0 400 °C Specimen 1 (400 °C) Date 11/11/2002 06/11/2002 07/11/2002 08/11/2002 31/10/2002 29/10/2002 30/10/2002 28/10/2002 Weight (g) 3627 3658 3806 3727 3813 3628 3603 3682 FRF (kHz) 6.55 6.54 6.91 6.78 6.62 6.21 5.81 6.23 T (°C) Ult. load. (kN) 327.75 378.17 483.26 411.39 423.49 260.75 271.59 331.91 fc (MPa) 41.73 48.15 61.53 52.38 53.92 33.20 34.58 42.26Specimen 2 (400 °C) Date 11/11/2002 05/11/2002 07/11/2002 08/11/2002 01/11/2002 30/10/2002 31/10/2002 29/10/2002 Weight (g) 3631 3640 3878 3780 3822 3642 3600 3674 FRF (kHz) 6.56 6.54 7.13 6.93 6.59 6.28 5.79 6.15 T (°C) Ult. load. (kN) 369.77 409.82 518.68 473.36 392.39 278.19 267.51 315.02 fc (MPa) 47.08 52.18 66.04 60.27 49.96 35.42 34.06 40.11On average 400 °C Weight (g) 3629 3649 3842 3753.5 3817.5 3635 3601.5 3678 FRF (kHz) 6.555 6.54 7.02 6.855 6.605 6.245 5.8 6.19 T (°C) fc (MPa) 44.41 50.17 63.79 56.33 51.94 34.31 34.32 41.19Concrete 40AG0 40AK0 40AK2 40AK4 40BR0 55BKO 70BG0 70BK0 fc1 (MPa) 41.73 48.15 61.53 52.38 53.92 33.20 34.58 42.26 Estat1 (GPa) 8 10 12.81 10.67 11.6 7.14 7.02 11.14Concrete 40AG0 40AK0 40AK2 40AK4 40BR0 55BKO 70BG0 70BK0 fc2 (MPa) 47.08 52.18 66.04 60.27 49.96 35.42 34.06 40.11 Estat2 (GPa) 9.4 11.11 13.27 11.98 11.59 8.33 8 9.38
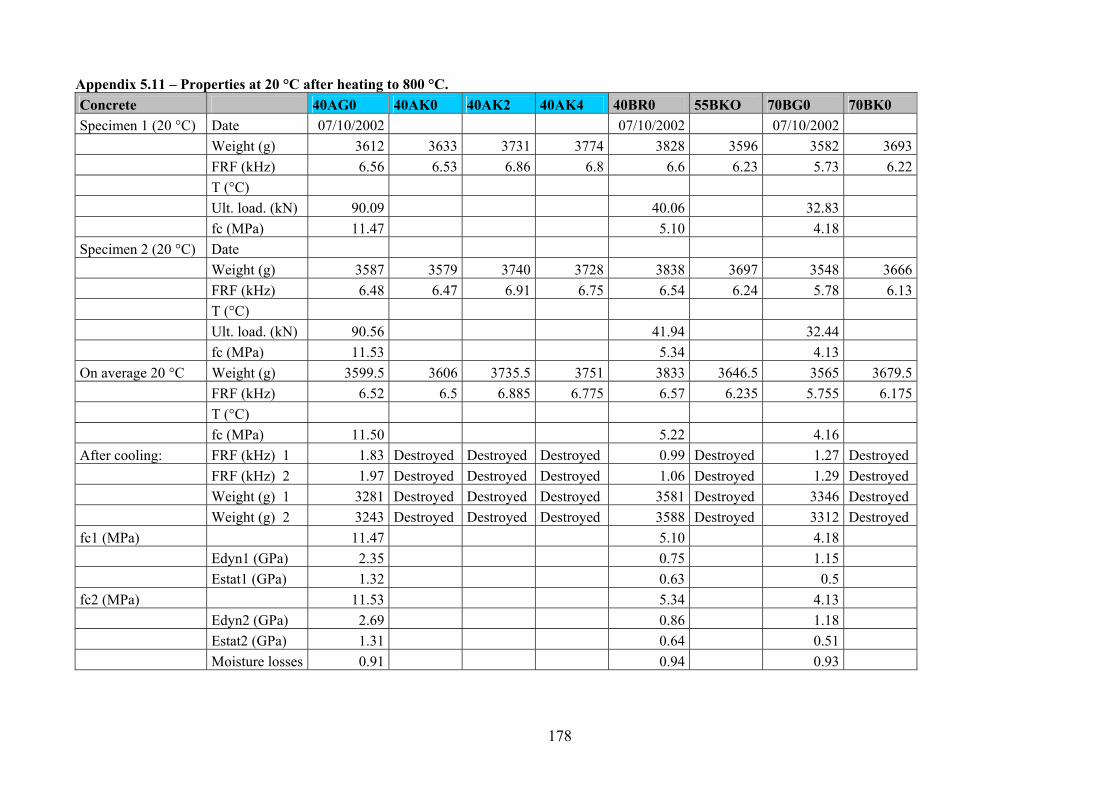
178
Appendix 5.11 – Properties at 20 °C after heating to 800 °C. Concrete 40AG0 40AK0 40AK2 40AK4 40BR0 55BKO 70BG0 70BK0 Specimen 1 (20 °C) Date 07/10/2002 07/10/2002 07/10/2002 Weight (g) 3612 3633 3731 3774 3828 3596 3582 3693 FRF (kHz) 6.56 6.53 6.86 6.8 6.6 6.23 5.73 6.22 T (°C) Ult. load. (kN) 90.09 40.06 32.83 fc (MPa) 11.47 5.10 4.18 Specimen 2 (20 °C) Date Weight (g) 3587 3579 3740 3728 3838 3697 3548 3666 FRF (kHz) 6.48 6.47 6.91 6.75 6.54 6.24 5.78 6.13 T (°C) Ult. load. (kN) 90.56 41.94 32.44 fc (MPa) 11.53 5.34 4.13 On average 20 °C Weight (g) 3599.5 3606 3735.5 3751 3833 3646.5 3565 3679.5 FRF (kHz) 6.52 6.5 6.885 6.775 6.57 6.235 5.755 6.175 T (°C) fc (MPa) 11.50 5.22 4.16 After cooling: FRF (kHz) 1 1.83 Destroyed Destroyed Destroyed 0.99 Destroyed 1.27 Destroyed FRF (kHz) 2 1.97 Destroyed Destroyed Destroyed 1.06 Destroyed 1.29 Destroyed Weight (g) 1 3281 Destroyed Destroyed Destroyed 3581 Destroyed 3346 Destroyed Weight (g) 2 3243 Destroyed Destroyed Destroyed 3588 Destroyed 3312 Destroyed fc1 (MPa) 11.47 5.10 4.18 Edyn1 (GPa) 2.35 0.75 1.15 Estat1 (GPa) 1.32 0.63 0.5 fc2 (MPa) 11.53 5.34 4.13 Edyn2 (GPa) 2.69 0.86 1.18 Estat2 (GPa) 1.31 0.64 0.51 Moisture losses 0.91 0.94 0.93

179
Appendix 5.12 – Properties after heating to 800 °C. Concrete 40AG0 40AK0 40AK2 40AK4 40BR0 55BKO 70BG0 70BK0 800 °C Specimen 1 (800 °C) Date 12/11/2002 29/11/2002 04/12/2002 06/12/2002 14/11/2002 21/11/2002 19/11/2002 25/02/2002 Weight (g) 3760 3648 3782 3722 3824 3620 3567 3677 FRF (kHz) 6.88 6.6 6.88 6.82 6.48 6.2 5.72 6.32 T (°C) 800 800 793 800 791 Ult. load. (kN) 71.79 89.22 101.08 67.23 43.90 48.30 28.75 119.93 fc (MPa) 9.14 11.36 12.87 8.56 5.59 6.15 3.66 15.27Specimen 2 (800 °C) Date 13/11/2002 03/12/2002 05/12/2002 15/11/2002 22/11/2002 20/11/2002 26/11/2002 Weight (g) 3810 3622 3876 3750 3811 3649 3620 3717 FRF (kHz) 6.93 6.58 7.17 6.95 6.55 6.15 5.8 6.26 T (°C) 800 800 800 800 817 Ult. load. (kN) 51.68 88.28 91.42 76.50 51.29 29.85 30.24 37.62 fc (MPa) 6.58 11.24 11.64 9.74 6.53 3.80 3.85 4.79On average 800 °C Weight (g) 3785 3635 3829 3736 3817.5 3634.5 3593.5 3697 FRF (kHz) 6.905 6.59 7.025 6.885 6.515 6.175 5.76 6.29 T (°C) 800 800 796.5 800 804 fc (MPa) 7.86 11.30 12.26 9.15 6.06 4.98 3.76 10.03Concrete 40AG0 40AK0 40AK2 40AK4 40BR0 55BKO 70BG0 70BK0 fc1 (MPa) 9.14 11.36 12.87 8.56 5.59 6.15 3.66 15.27 Estat1 (GPa) 4.55 4.54 4.55 5 3.13 3.13 1.67 3.33Concrete 40AG0 40AK0 40AK2 40AK4 40BR0 55BKO 70BG0 70BK0 fc2 (MPa) 6.58 11.24 11.64 9.74 6.53 3.80 3.85 4.79 Estat2 (GPa) 4.26 4.35 4.55 3.7 3.13 1.8 1.54 3.28

180
Appendix 5.13 - Edyn and Estat versus compressive strength at 20 °C.
y = -0.00396x2 + 0.81269xR2 = 0.73707
y = -0.00196x2 + 0.57717xR2 = 0.80286
y = -0.00427x2 + 0.82888xR2 = 0.86959
y = 0.00038x2 + 0.42416xR2 = 0.95556
0.00
10.00
20.00
30.00
40.00
0.00 20.00 40.00 60.00 80.00
Compressive strength (MPa)
Elas
tic m
odul
us (G
Pa) Edyn1 (GPa)
Estat1 (GPa)Edyn2 (GPa)Estat2 (GPa)Poly. (Edyn1 (GPa))Poly. (Estat1 (GPa))Poly. (Edyn2 (GPa))Poly. (Estat2 (GPa))
Appendix 5.14 - Edyn and Estat versus compressive strength at 20 °C after heating to 200 °C.
y = -0.00250x2 + 0.52315xR2 = 0.92342
y = -0.00229x2 + 0.48321xR2 = 0.67135
0.00
10.00
20.00
30.00
40.00
0.00 20.00 40.00 60.00 80.00
Compressive strength (MPa)
Elas
tic m
odul
us (G
Pa)
Edyn1 (GPa)Estat1 (GPa)Edyn2 (GPa)Estat2 (GPa)Poly. (Estat1 (GPa))Poly. (Estat2 (GPa))

181
Appendix 5.15 - Edyn and Estat versus compressive strength after heating to 200 °C.
y = 0.00085x2 + 0.30551xR2 = 0.74787
y = -0.000433x2 + 0.362619xR2 = 0.861474
0
10
20
30
40
0.00 20.00 40.00 60.00 80.00
Compressive strength (MPa)
Elas
tic m
odul
us (G
Pa)
Estat1 (GPa)Estat2 (GPa)Poly. (Estat1 (GPa))Poly. (Estat2 (GPa))
Appendix 5.16 - Edyn and Estat at 20 °C versus compressive strength after heating to 400 °C.
y = -0.00161x2 + 0.32213xR2 = 0.85390
y = -0.00120x2 + 0.31581xR2 = 0.89741
0.00
10.00
20.00
30.00
40.00
0.00 20.00 40.00 60.00 80.00
Compressive strength (MPa)
Elas
tic m
odul
us (G
Pa) Edyn1 (GPa)
Estat1 (GPa)Edyn2 (GPa)Estat2 (GPa)Poly. (Estat1 (GPa))Poly. (Estat2 (GPa))
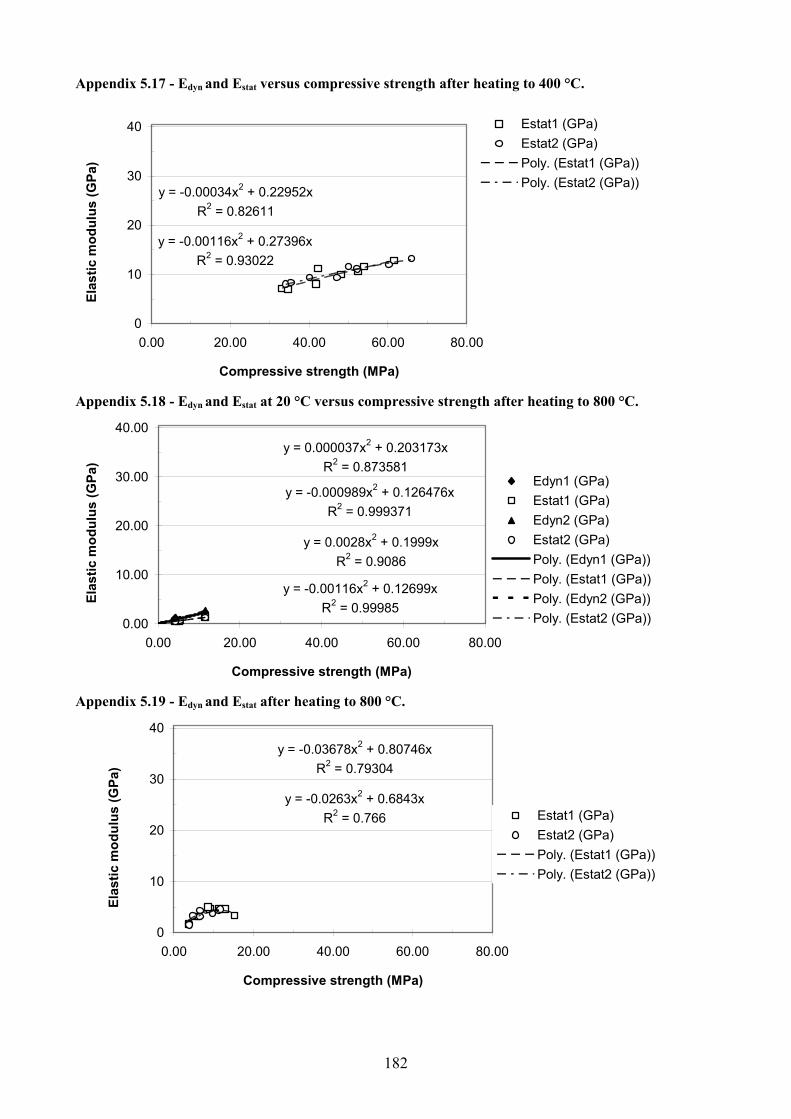
182
Appendix 5.17 - Edyn and Estat versus compressive strength after heating to 400 °C.
y = -0.00034x2 + 0.22952xR2 = 0.82611
y = -0.00116x2 + 0.27396xR2 = 0.93022
0
10
20
30
40
0.00 20.00 40.00 60.00 80.00
Compressive strength (MPa)
Elas
tic m
odul
us (G
Pa)
Estat1 (GPa)Estat2 (GPa)Poly. (Estat1 (GPa))Poly. (Estat2 (GPa))
Appendix 5.18 - Edyn and Estat at 20 °C versus compressive strength after heating to 800 °C.
y = 0.000037x2 + 0.203173xR2 = 0.873581
y = -0.000989x2 + 0.126476xR2 = 0.999371
y = 0.0028x2 + 0.1999xR2 = 0.9086
y = -0.00116x2 + 0.12699xR2 = 0.99985
0.00
10.00
20.00
30.00
40.00
0.00 20.00 40.00 60.00 80.00
Compressive strength (MPa)
Elas
tic m
odul
us (G
Pa)
Edyn1 (GPa)Estat1 (GPa)Edyn2 (GPa)Estat2 (GPa)Poly. (Edyn1 (GPa))Poly. (Estat1 (GPa))Poly. (Edyn2 (GPa))Poly. (Estat2 (GPa))
Appendix 5.19 - Edyn and Estat after heating to 800 °C.
y = -0.03678x2 + 0.80746xR2 = 0.79304
y = -0.0263x2 + 0.6843xR2 = 0.766
0
10
20
30
40
0.00 20.00 40.00 60.00 80.00
Compressive strength (MPa)
Elas
tic m
odul
us (G
Pa)
Estat1 (GPa)Estat2 (GPa)Poly. (Estat1 (GPa))Poly. (Estat2 (GPa))

183
Appendix 5.20 – Moisture losses at 20 °C after heating to high temperatures. Concrete HPC [40] NC [40] 40AG0 40AK0 40AK2 40AK4 40BR0 55BK0 70BG0 70BK0
20 1.000 1.000 1.000 1.000 1.000 1.000 1.000 1.000 1.000 1.000100 0.984 0.972 0.926 0.947 0.948 0.943 0.966 0.959 0.961 0.971130 300 0.951 0.934 400 0.923 0.926 0.935 0.935 0.958 0.949 0.960 0.972
450 0.923 0.913 800 0.906 0.000 0.000 0.000 0.935 0.000 0.934 0.000
Appendix 5.21 – RH before heating in cylinders of present study and of columns 200x200 mm [94].
Concrete 40AG0
40AK0
40AK2
40AK4
40AR0
40BK0
40BR0
55BK0
55BR0
70BG0
70BK0
70BR0
Column 89.0 89.0 93.0 73.0 77.0 73.0 77.0 76.0 77.0Cylinder 1 97.0 97.0 94.0 68.0 68.0 71.0 Cylinder 2 97.0 93.0 97.0 68.0 66.0 65.0 Cylinders, av. 97.0 95.0 95.5 67.5 67.0 67.8

184
Appendices 6 – Statistical analysis and sources of error
Appendix 6.1 – Stress/strain results of concrete 40BR0 at 200 °C – 200 °C.
Appendix 6.2 – Stress/strain results of concrete 70BG0 at 200 °C – 200 °C
Appendix 6.3 – Stress/strain results of concrete 70BK0 at 200 °C – 200 °C.
Appendix 6.4 – Statistical analysis of stress/strain tests

185
Appendix 6.1 – Stress/strain results of concrete 40BR0 at 200 °C – 200 °C.
y = 19.512x - 17.561
0
10
20
30
40
50
60
70
80
0 5 10 15 20 25 30 35 40
Deformation (per mil)
Stre
ss (M
Pa)
SBUFBRAND40BR0-200-200-3 Linjär (Linear regression)
Appendix 6.2 – Stress/strain results of concrete 70BG0 at 200 °C – 200 °C
y = 12.245x - 24.49
0
10
20
30
40
0 5 10 15 20 25 30 35 40Deformation (per mil)
Stre
ss (M
Pa)
SBUFBRAND70BGO-200-200-3 Serie2 Linjär (Serie2)
Appendix 6.3 – Stress/strain results of concrete 70BK0 at 200 °C – 200 °C. y = 22.642x - 46.415
0
10
20
30
40
50
60
0 5 10 15 20 25 30 35 40Deformation (per mil)
Stre
ss (M
Pa)
SBUFBRAND70BK0-200-200-3 Linjär (Serie2)

186
Appendix 6.4 – Accuracy of stress/strain tests
Elastic modulus (GPa) 1 2 3 Std Average Variance (%) 40BR0-200-200 21.62 20.25 19.51 0.87 20.46 4.2770BG0-200-200 12.63 13.33 12.25 0.45 12.74 3.5170BK0-200-200 18.18 16.76 22.64 2.51 19.19 13.05Strain at max strain (‰) 1 2 3 Std Average Variance (%) 40BR0-200-200 5.25 6.11 4.87 0.52 5.41 9.5970BG0-200-200 6.48 5.55 6.73 0.51 6.25 8.1270BK0-200-200 4.71 4.67 5.21 0.25 4.86 5.05Strength (MPa) 1 2 3 Std Average Variance (%) 40BR0-200-200 63.10 65.52 67.02 1.61 65.21 2.4870BG0-200-200 43.59 43.11 43.30 0.20 43.33 0.4670BK0-200-200 51.73 50.61 53.31 1.11 51.88 2.13

187
Appendices 7 – Supplementary tests
Appendix 7.1 - Stress/strain results of concrete 40AG0 at 600 °C – 20 °C.
Appendix 7.2 - Stress/strain results of concrete 40AK0 at 600 °C – 20 °C.
Appendix 7.3 - Stress/strain results of concrete 40AK2 at 600 °C – 20 °C.
Appendix 7.4 - Stress/strain results of concrete 40AK4 at 600 °C – 20 °C.
Appendix 7.5 - Stress/strain results of concrete 40BR0 at 600 °C – 20 °C.
Appendix 7.6 - Stress/strain results of concrete 55BK0 at 600 °C – 20 °C.
Appendix 7.7 - Stress/strain results of concrete 70BG0 at 600 °C – 20 °C.
Appendix 7.8 - Stress/strain results of concrete 70BK0 at 600 °C – 20 °C.
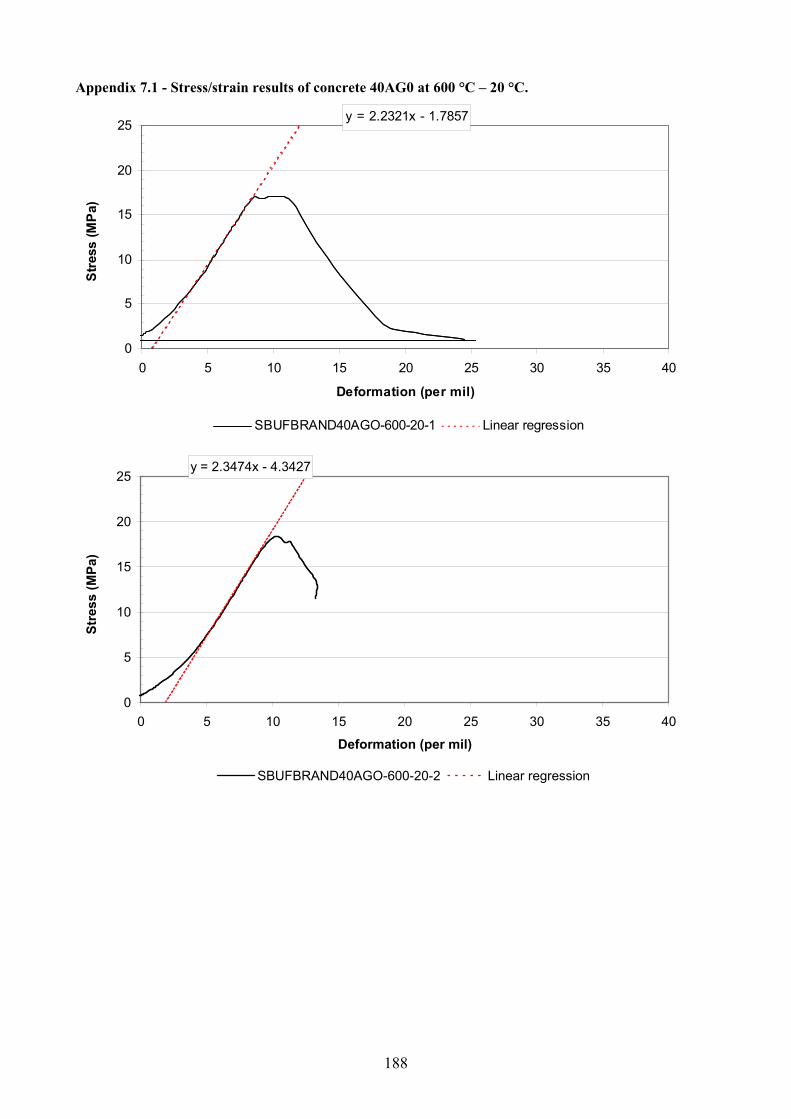
188
Appendix 7.1 - Stress/strain results of concrete 40AG0 at 600 °C – 20 °C.
y = 2.2321x - 1.7857
0
5
10
15
20
25
0 5 10 15 20 25 30 35 40
Deformation (per mil)
Stre
ss (M
Pa)
SBUFBRAND40AGO-600-20-1 Linear regression
y = 2.3474x - 4.3427
0
5
10
15
20
25
0 5 10 15 20 25 30 35 40
Deformation (per mil)
Stre
ss (M
Pa)
SBUFBRAND40AGO-600-20-2 Linear regression

189
Appendix 7.2 - Stress/strain results of concrete 40AK0 at 600 °C – 20 °C.
y = 2.2936x + 2.0642
0
5
10
15
20
25
0 5 10 15 20 25 30 35 40
Deformation (per mil)
Stre
ss (M
Pa)
SBUFBRAND40AKO-600-20-1 Linear regression
y = 2.3923x - 0.8373
0
5
10
15
20
25
0 5 10 15 20 25 30 35 40
Deformation (per mil)
Stre
ss (M
Pa)
SBUFBRAND40AKO-600-20-2 Linear regression

190
Appendix 7.3 - Stress/strain results of concrete 40AK2 at 600 °C – 20 °C.
y = 3.2051x + 2.5641
0
5
10
15
20
25
0 5 10 15 20 25 30 35 40
Deformation (per mil)
Stre
ss (M
Pa)
SBUFBRAND40AK2-600-20-1 Linear regression
y = 3.012x - 0.3012
0
5
10
15
20
25
0 5 10 15 20 25 30 35 40
Deformation (per mil)
Stre
ss (M
Pa)
SBUFBRAND40AK2-600-20-2 Linear regression

191
Appendix 7.4 - Stress/strain results of concrete 40AK4 at 600 °C – 20 °C.
y = 2.3364x + 2.3364
0
5
10
15
20
25
0 5 10 15 20 25 30 35 40
Deformation (per mil)
Stre
ss (M
Pa)
SBUFBRAND40AK4-600-20-1 Linear regression
y = 2.1796x - 3.2258
0
5
10
15
20
25
0 5 10 15 20 25 30 35 40
Deformation (per mil)
Stre
ss (M
Pa)
SBUFBRAND40AK4-600-20-2 Linear regression
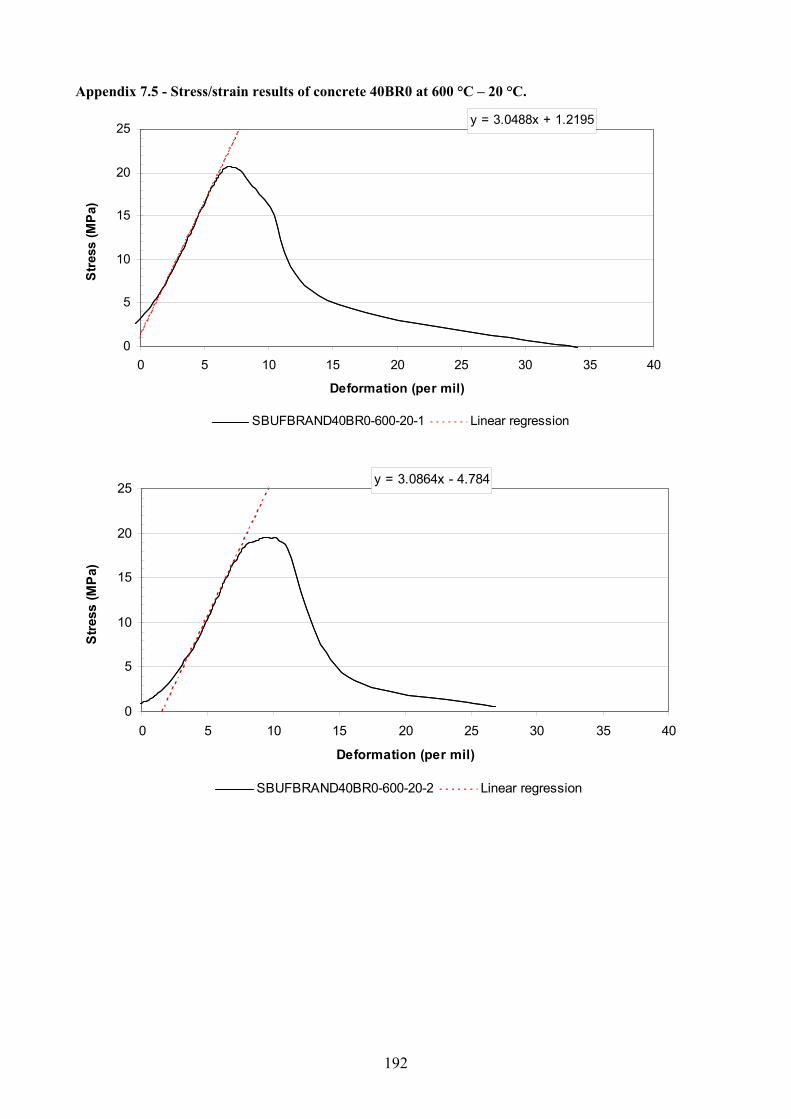
192
Appendix 7.5 - Stress/strain results of concrete 40BR0 at 600 °C – 20 °C.
y = 3.0488x + 1.2195
0
5
10
15
20
25
0 5 10 15 20 25 30 35 40
Deformation (per mil)
Stre
ss (M
Pa)
SBUFBRAND40BR0-600-20-1 Linear regression
y = 3.0864x - 4.784
0
5
10
15
20
25
0 5 10 15 20 25 30 35 40
Deformation (per mil)
Stre
ss (M
Pa)
SBUFBRAND40BR0-600-20-2 Linear regression

193
Appendix 7.6 - Stress/strain results of concrete 55BK0 at 600 °C – 20 °C.
y = 1.5133x - 0.8777
0
5
10
15
20
25
0 5 10 15 20 25 30 35 40
Deformation (per mil)
Stre
ss (M
Pa)
SBUFBRAND55BK0-600-20-1 Linear regression
y = 1.4793x + 1.6272
0
5
10
15
20
25
0 5 10 15 20 25 30 35 40
Deformation (per mil)
Stre
ss (M
Pa)
SBUFBRAND55BK0-600-20-2 Linear regression

194
Appendix 7.7 - Stress/strain results of concrete 70BG0 at 600 °C – 20 °C.
y = 2.00x + 2.00
0
5
10
15
20
25
0 5 10 15 20 25 30 35 40
Deformation (per mil)
Stre
ss (M
Pa)
SBUFBRAND70BG0-600-20-1 Linear regression
y = 2.00x + 2.00
0
5
10
15
20
25
0 5 10 15 20 25 30 35 40
Deformation (per mil)
Stre
ss (M
Pa)
SBUFBRAND70BG0-600-20-2 Linear regression

195
Appendix 7.8 - Stress/strain results of concrete 70BK0 at 600 °C – 20 °C.
y = 4.4643x + 8.0357
0
5
10
15
20
25
0 5 10 15 20 25 30 35 40
Deformation (per mil)
Stre
ss (M
Pa)
SBUFBRAND70BK0-600-20-1 Linear regression
y = 4.717x - 0.4717
0
5
10
15
20
25
0 5 10 15 20 25 30 35 40
Deformation (per mil)
Stre
ss (M
Pa)
SBUFBRAND70BK0-600-20-2 Linear regression
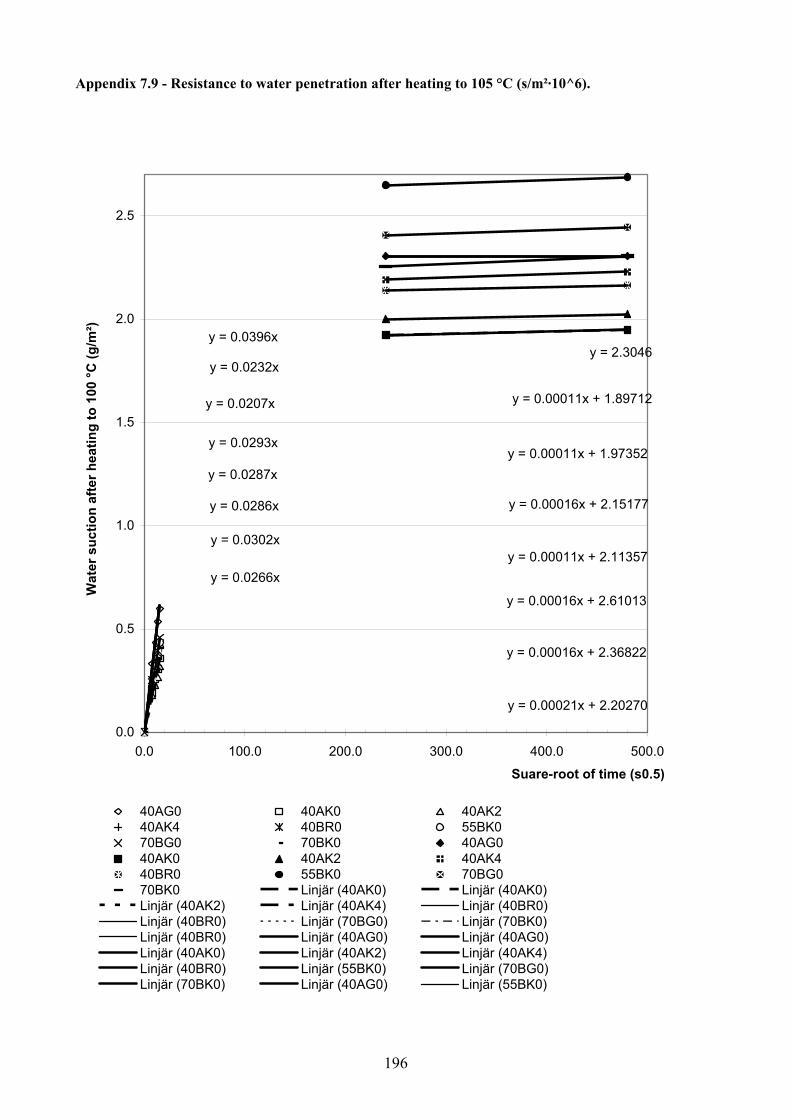
196
Appendix 7.9 - Resistance to water penetration after heating to 105 °C (s/m²·10^6).
y = 0.0396x
y = 0.0232x
y = 0.0207x
y = 0.0293x
y = 0.0287x
y = 0.0302x
y = 0.0266x
y = 2.3046
y = 0.00011x + 1.89712
y = 0.00011x + 1.97352
y = 0.00016x + 2.15177
y = 0.00011x + 2.11357
y = 0.00016x + 2.61013
y = 0.00016x + 2.36822
y = 0.00021x + 2.20270
y = 0.0286x
0.0
0.5
1.0
1.5
2.0
2.5
0.0 100.0 200.0 300.0 400.0 500.0
Suare-root of time (s0.5)
Wat
er s
uctio
n af
ter h
eatin
g to
100
°C (g
/m²)
40AG0 40AK0 40AK240AK4 40BR0 55BK070BG0 70BK0 40AG040AK0 40AK2 40AK440BR0 55BK0 70BG070BK0 Linjär (40AK0) Linjär (40AK0)Linjär (40AK2) Linjär (40AK4) Linjär (40BR0)Linjär (40BR0) Linjär (70BG0) Linjär (70BK0)Linjär (40BR0) Linjär (40AG0) Linjär (40AG0)Linjär (40AK0) Linjär (40AK2) Linjär (40AK4)Linjär (40BR0) Linjär (55BK0) Linjär (70BG0)Linjär (70BK0) Linjär (40AG0) Linjär (55BK0)
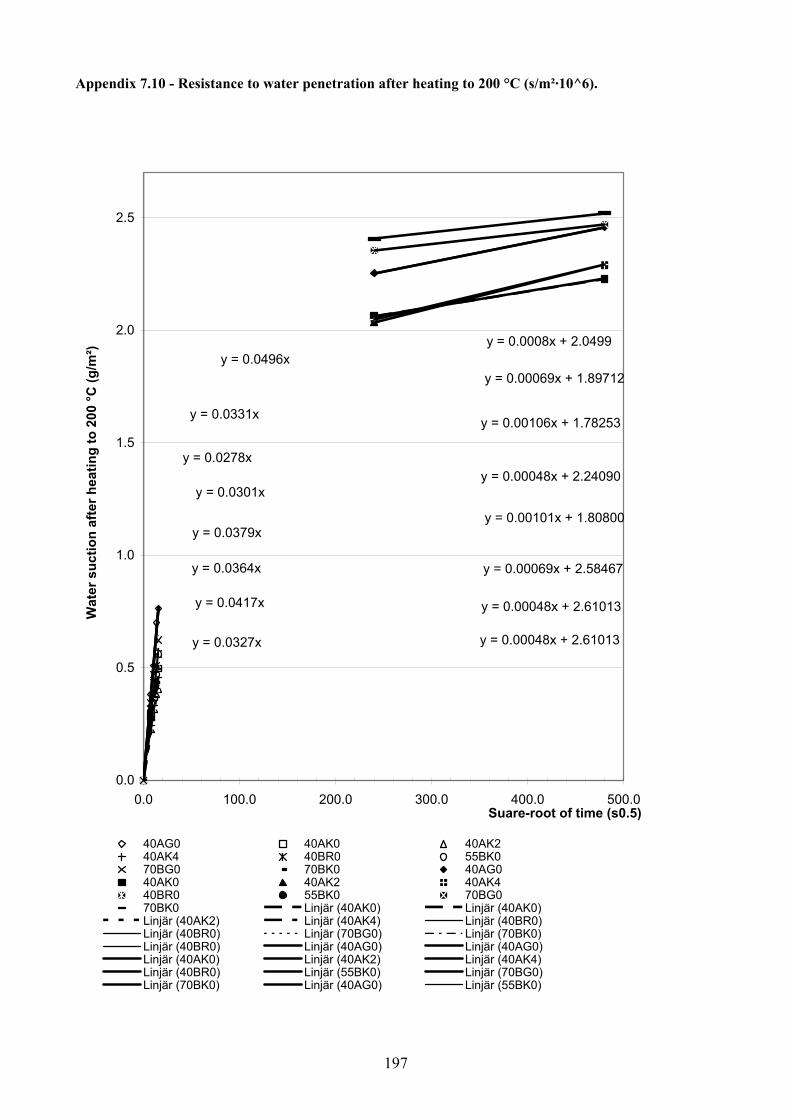
197
Appendix 7.10 - Resistance to water penetration after heating to 200 °C (s/m²·10^6).
y = 0.0496x
y = 0.0331x
y = 0.0278x
y = 0.0301x
y = 0.0379x
y = 0.0417x
y = 0.0327x
y = 0.0008x + 2.0499
y = 0.00069x + 1.89712
y = 0.00106x + 1.78253
y = 0.00101x + 1.80800
y = 0.00048x + 2.24090
y = 0.00048x + 2.61013
y = 0.00069x + 2.58467
y = 0.00048x + 2.61013
y = 0.0364x
0.0
0.5
1.0
1.5
2.0
2.5
0.0 100.0 200.0 300.0 400.0 500.0Suare-root of time (s0.5)
Wat
er s
uctio
n af
ter h
eatin
g to
200
°C (g
/m²)
40AG0 40AK0 40AK240AK4 40BR0 55BK070BG0 70BK0 40AG040AK0 40AK2 40AK440BR0 55BK0 70BG070BK0 Linjär (40AK0) Linjär (40AK0)Linjär (40AK2) Linjär (40AK4) Linjär (40BR0)Linjär (40BR0) Linjär (70BG0) Linjär (70BK0)Linjär (40BR0) Linjär (40AG0) Linjär (40AG0)Linjär (40AK0) Linjär (40AK2) Linjär (40AK4)Linjär (40BR0) Linjär (55BK0) Linjär (70BG0)Linjär (70BK0) Linjär (40AG0) Linjär (55BK0)

198
Appendix 7.11 - Resistance to water penetration after heating to 400 °C (s/m²·10^6).
y = 0.0895x
y = 0.0621x
y = 0.0792x
y = 0.0998x
y = 0.0633x
y = 0.0512x
y = 0.0448x
y = 0.0015x + 2.4191
y = 0.00101x + 2.08811
y = 0.00133x + 1.93532
y = 0.00143x + 2.12631
y = 0.00111x + 2.59740
y = 0.00064x + 3.17036
y = 0.00064x + 2.86478
y = 0.00048x + 2.61013
y = 0.049x
0.0
0.5
1.0
1.5
2.0
2.5
3.0
3.5
0.0 100.0 200.0 300.0 400.0 500.0Suare-root of time (s0.5)
Wat
er s
uctio
n af
ter h
eatin
g to
400
°C (g
/m²)
40AG0 40AK0 40AK240AK4 40BR0 55BK070BG0 70BK0 40AG040AK0 40AK2 40AK440BR0 55BK0 70BG070BK0 Linjär (40AK0) Linjär (40AK0)Linjär (40AK2) Linjär (40AK4) Linjär (40BR0)Linjär (40BR0) Linjär (70BG0) Linjär (70BK0)Linjär (40BR0) Linjär (40AG0) Linjär (40AG0)Linjär (40AK0) Linjär (40AK2) Linjär (40AK4)Linjär (40BR0) Linjär (55BK0) Linjär (70BG0)Linjär (70BK0) Linjär (40AG0) Linjär (55BK0)

199
Appendix 7.12 - Resistance to water penetration after heating to 600 °C (s/m²·10^6).
y = 0.1948x
y = 0.1619x
y = 0.2238x
y = 0.1905x
y = 0.1608x
y = 0.1771x
y = 0.1505x
y = 0.0019x + 3.1576
y = 0.00106x + 3.10670
y = 0.00080x + 3.08123
y = 0.00127x + 2.67380
y = 0.00064x + 2.89025
y = 0.00058x + 3.46320
y = 0.00085x + 3.32315
y = 0.00048x + 2.61013
y = 0.2042x
0.0
0.5
1.0
1.5
2.0
2.5
3.0
3.5
4.0
0.0 100.0 200.0 300.0 400.0 500.0Suare-root of time (s0.5)
Wat
er s
uctio
n af
ter h
eatin
g to
600
°C (g
/m²)
40AG0 40AK0 40AK240AK4 40BR0 55BK070BG0 70BK0 40AG040AK0 40AK2 40AK440BR0 55BK0 70BG070BK0 Linjär (40AK0) Linjär (40AK0)Linjär (40AK2) Linjär (40AK4) Linjär (40BR0)Linjär (40BR0) Linjär (70BG0) Linjär (70BK0)Linjär (40BR0) Linjär (40AG0) Linjär (40AG0)Linjär (40AK0) Linjär (40AK2) Linjär (40AK4)Linjär (40BR0) Linjär (55BK0) Linjär (70BG0)Linjär (70BK0) Linjär (40AG0) Linjär (55BK0)

200
Appendix 8 – Discussion of data from fire spalling tests [94,107]. Con-crete
We-ight w c f w/p RH
Mois-ture
Den-sity
12-16 mm
8-11 mm
0-8 mm
16 mm/p
11 mm/p
8 mm/p c/p f/p a/p
16 mm/p
11 mm/p
8 mm/p
Age (days)
40AG0 0.82 172 430 62 0.35 0.89 0.037 2330 624 1042 1.27 0.00 2.12 0.87 0.13 3.39 1.27 0.00 2.12 170 40AK0 0.68 164 411 149 0.29 0.89 0.037 2360 595 1041 1.06 0.00 1.86 0.73 0.27 2.92 1.06 0.00 1.86 170 40AK2 0.88 173 433 181 0.28 0.037 2360 572 1001 0.93 0.00 1.63 0.71 0.29 2.56 0.93 0.00 1.63 170 40AK4 0.94 195 487 171 0.30 0.037 2370 326 1191 0.00 0.50 1.81 0.74 0.26 2.31 0.00 0.50 1.81 170 40AR0 0.93 206 518 0 0.40 0.93 0.037 2350 857 769 1.65 0.00 1.48 1.00 0.00 3.14 1.65 0.00 1.48 170 40BR0 0.95 175 436 0 0.40 0.031 2420 602 1207 1.38 0.00 2.77 1.00 0.00 4.15 1.38 0.00 2.77 170 40BK0 0.76 179 447 130 0.31 0.73 0.031 2360 1004 600 1.74 0.00 1.04 0.77 0.23 2.78 1.74 0.00 1.04 170 55BK0-1 year 0.73 170 308 242 0.31 0.77 0.031 2380 234 362 1064 0.43 0.66 1.93 0.56 0.44 3.02 0.43 0.66 1.93 320 55BK2-1 year 0.85 189 344 241 0.32 0.031 2390 119 244 1253 0.20 0.42 2.14 0.59 0.41 2.76 0.20 0.42 2.14 320 55BK4 0.86 210 382 233 0.34 0.031 2350 316 1209 0.00 0.51 1.97 0.62 0.38 2.48 0.00 0.51 1.97 160 55BR0-1 year 0.86 192 348 0 0.55 0.73 0.031 2380 452 360 1028 1.30 1.03 2.95 1.00 0.00 5.29 1.30 1.03 2.95 320 70BG0 0.87 225 321 80 0.56 0.77 0.031 2340 551 1163 1.37 0.00 2.90 0.80 0.20 4.27 1.37 0.00 2.90 170 70BK0 0.82 188 268 189 0.41 0.76 0.031 2394 631 1118 1.38 0.00 2.45 0.59 0.41 3.83 1.38 0.00 2.45 170 70BK2 0.97 209 298 229 0.40 0.031 2330 583 1011 1.11 0.00 1.92 0.57 0.43 3.02 1.11 0.00 1.92 160 70BK4 0.86 214 306 331 0.34 0.031 2320 220 1249 0.00 0.35 1.96 0.48 0.52 2.31 0.00 0.35 1.96 160 70BR0 0.92 195 278 0 0.70 0.77 0.031 2250 351 356 1070 1.26 1.28 3.85 1.00 0.00 6.39 1.26 1.28 3.85 170