self-employment: a way to end unemployment? …ftp.iza.org/dp2561.pdfa way to end unemployment?...
TRANSCRIPT

IZA DP No. 2561
Self-Employment: A Way to End Unemployment?Empirical Evidence from German Pseudo-Panel Data
Daniela GlockerViktor Steiner
DI
SC
US
SI
ON
PA
PE
R S
ER
IE
S
Forschungsinstitutzur Zukunft der ArbeitInstitute for the Studyof Labor
January 2007

Self-Employment:
A Way to End Unemployment? Empirical Evidence from German
Pseudo-Panel Data
Daniela Glocker DIW Berlin
Viktor Steiner
Free University Berlin, DIW Berlin and IZA
Discussion Paper No. 2561 January 2007
IZA
P.O. Box 7240 53072 Bonn
Germany
Phone: +49-228-3894-0 Fax: +49-228-3894-180
E-mail: [email protected]
Any opinions expressed here are those of the author(s) and not those of the institute. Research disseminated by IZA may include views on policy, but the institute itself takes no institutional policy positions. The Institute for the Study of Labor (IZA) in Bonn is a local and virtual international research center and a place of communication between science, politics and business. IZA is an independent nonprofit company supported by Deutsche Post World Net. The center is associated with the University of Bonn and offers a stimulating research environment through its research networks, research support, and visitors and doctoral programs. IZA engages in (i) original and internationally competitive research in all fields of labor economics, (ii) development of policy concepts, and (iii) dissemination of research results and concepts to the interested public. IZA Discussion Papers often represent preliminary work and are circulated to encourage discussion. Citation of such a paper should account for its provisional character. A revised version may be available directly from the author.

IZA Discussion Paper No. 2561 January 2007
ABSTRACT
Self-Employment: A Way to End Unemployment? Empirical Evidence from German Pseudo-Panel Data*
This paper contributes to the policy-relevant question whether self-employment is a way out of (long-term) unemployment. We estimate the relationship between the entry rate into self-employment and previous (long-term) unemployment on the basis of pseudo-panel data for Germany in the period 1996-2002. The estimation method accounts for cohort fixed effects and measurement errors induced by the pseudo panel structure. We find that previous (long-term) unemployment significantly increases entry rates into self-employment for both men and women. These effects are quantitatively important, both in absolute terms and compared to other potential determinants of self-employment transitions, such as age, the level of vocational qualification and certain household characteristics. JEL Classification: J23, J64, C35 Keywords: self-employment, entrepreneurship, entry rate, start-ups, unemployment,
pseudo-panel, age and cohort effects Corresponding author: Viktor Steiner DIW Berlin Koenigin-Luise-Strasse 5 14195 Berlin Germany E-mail: [email protected]
* Viktor Steiner thanks the German Science Foundation (DFG) for funding under the project “Work Incentives, Earnings-Related Subsidies, and Employment in Low-Wage Labour Markets”.
1
1 Introduction
There is a flourishing literature on the determinants and economic effects of self-employment in
advanced market economies (for a recent summary see, e.g. Parker 2004). Theoretical and
empirical literature has identified various important factors influencing the self-employment
decision, among them labour and goods markets regulation, taxation, individual characteristics,
such as age, education, gender, ethnicity, and previous unemployment experience. In the
economic policy debate, self-employment is typically considered to contribute to labour market
flexibility and higher employment, and to lead to less unemployment.
The focus of this paper is on the impact of previous (long-term) unemployment on the entry
rate into self-employment. Two alternative hypotheses have been suggested to rationalize this
relationship: The so-called “unemployment push” hypothesis states that high unemployment may
reduce the opportunity to gain salaried employment and thus positively affect self-employment.
The “unemployment pull” hypothesis states that high unemployment may negatively affect
individual expectations about the success of self-employment, or reinforce credit constraints.
Whereas the former hypothesis would imply a positive relationship between the entry rate into
self-employment and unemployment, the latter hypotheses would imply a negative relationship.
From a policy perspective, it is of particular interest whether unemployment, in particular
long-term unemployment, acts as a pull or push factor on the self-employment transition. Market
imperfections and government regulations may prevent unemployed people to take this exit route
from unemployment. In particular, unemployed people may face severe credit constraints which
could be overcome by start-up subsidies by the government put into place in a number of OECD
countries, such as the “bridging allowance” and the “start-up subsidy” in Germany (see Pfeiffer
and Reize 2000, Almus 2004, Baumgartner and Caliendo 2007).

2
The relationship between the entry rate into self-employment (“start-up rate”) and the
incidence of (long-term) unemployment has been analysed in a number of empirical studies for
various OECD countries, with ambiguous results. Whereas time-series studies have tended to
find a positive relationship between measures of new firm formation, most of the studies based
on cross-section or panel data have found a negative relationship. Aside from measurement
issues, one possible reason for these differences is spurious correlation between business-start-
ups and unemployment. This seems likely to be the more severe, the higher the level of
aggregation. On the other hand, estimates of the impact of long-term unemployment on the entry
rate into self-employment based on cross-section or panel data may suffer from selection bias and
general sample attrition.
In this paper we use pseudo-panel data derived from the German Microcensus for the
period 1996-2002 and appropriate statistical methods to analyse empirically the impact of
previous (long-term) unemployment on the entry rate into self-employment. In the next section
we summarise hypotheses and the existing empirical evidence related to this relationship. In
section 3 we describe the construction of our pseudo panel used for analysing this relationship for
Germany, provide descriptive statistics on self-employment rates, and present our estimation
approach. To account for cohort fixed effects and measurement errors induced by the structure of
the pseudo panel used for the estimation, we apply the fixed effects estimator initially proposed
by Deaton (1985). Estimation results, summarised and discussed in section 4, show that previous
unemployment has significant positive effects on entry rates into self-employment for both men
and women. These effects are quantitatively important, both in absolute terms and compared to
other potential determinants of self-employment transitions, such as age, the level of vocational
qualification and certain household characteristics.
3
2 Hypotheses and Previous Literature
The focus of this paper is on the entry rate into self-employment, and its relationship to previous
unemployment, in particular. The share of self-employed people in the work force is determined
by the entry rate into and the exit rate from self-employment. If both entry and exits are first-
order Markov processes, the equilibrium level of self-employment in the economy is given by the
ratio between the entry rate and the sum of the entry and exit rates (see, e.g., Evans and Leighton
1989). Thus, a constant or slowly changing self-employment rate, as it is observed in most
developed economies, may disguise large gross flows into and out of self-employment. For
example, in Germany the self-employment rate has been hovering around 10 percent since the
mid-1990’s, while the average yearly flows into and out of self-employment in Germany
amounted to about 300 thousand people per year (see Hansch 2006). Furthermore, similar self-
employment rates between specific groups of people, like men and women, age groups, or
between regions and countries are compatible with very different levels of entry and exit rates.
For example, the relatively low entry rates into self-employment of older people may be more
than compensated by their relatively low exit rates, resulting in a similar self-employment rate of
younger people whose higher entry rate may be associated with a relatively high exit rate. To
gain a better understanding of the factors determining self-employment, it thus seems crucial to
differentiate between entry and exit rates into and from unemployment in the analysis.
In economic models of entrepreneurship the decision to become an entrepreneur is simply
one of occupational choice: the wage an individual expects to earn through salaried employment
is compared to expected earnings from entrepreneurship, with the probability of choosing self-
employment given as a function of the occupational earnings differential. Lucas (1978) assumed
people to differ in terms of (continuously distributed) innate entrepreneurial ability and showed
that the most able individuals choose to become self-employed, where the ability of the “marginal
4
entrepreneur“ is just sufficient to make her or him indifferent to working as an employee and the
most able entrepreneurs run the largest business. As the decision to become an entrepreneur is
driven by expected earnings, uncertainty about the future stream of income from both regular
employment and self-employment may influence occupational choice. Kihlstrom and Laffont
(1979) modelled entrepreneurial choice as trading off risk and returns. Individuals in this model
differ in risk aversion, which is distributed continuously across the workforce, with the least risk-
averse individuals becoming entrepreneurs and running the largest firms.
The impact of the earnings differential between self-employment and salaried employment
as well as the risk differential between these two incomes sources have been analysed in a
number of empirical studies.1 Most of these studies find that, accounting for selection effects, this
earnings differential is positive, on average, with a higher variance of earnings in self-
employment, and that a higher earnings differential increases the entry into self-employment. In
addition, the probability of becoming self-employed may also be affected by the level of a would-
be entrepreneur’s wealth in the presence of credit constraints. For the US, Evans and Leighton
(1989) and Evans and Jovanovic (1989) find a statistically significant positive relationship
between the start-up rate and individual wealth, which they interpret as evidence supporting the
credit-constraint hypothesis.2
Credit constraints may by reinforced in the presence of unemployment if unemployed
people have already run down financial wealth and are more constrained in the credit market than
employees. However, unemployment may also affect business start-ups because for reasons
completely unrelated to credit constraints: On the one hand, high unemployment may reduce the
1 See, e.g., Evans and Jovanovic (1989), Evans and Leighton (1989) for the US; Rees and Shah (1986) and Taylor
(1996) for Britain, and Pfeiffer and Pohlmeier (1992) for Germany. 2 However, as suggested by Cressy (2000), among others, a positive relationship between the start-up rate and
wealth may also derive from decreasing absolute risk aversion.
5
opportunity to gain dependent employment and thus positively affects self-employment. On the
other hand, high unemployment may negatively affect individual expectations about the success
of self-employment. In terms of the basic model of occupational choice discussed above, this
would affect alternative incomes in opposite ways, in addition to the effect unemployment may
have on credit constraints. Theoretically, the net effect of unemployment on start-ups is therefore
ambiguous.
Empirically, the relationship between self-employment and previous unemployment has
been investigated in a number of empirical studies for several OECD countries both at the
aggregate and the micro level. Reviewing the older literature, Storey (1991) concludes that time-
series studies tend to find a positive relationship between measures of new firm formation,
whereas studies based on cross-section or panel data tend to find a negative relationship. Apart
from measurement issues, one possible reason for these differences is the potential endogeneity
between business-start ups and unemployment, which seems likely to be the more severe, the
higher the level of aggregation (see, e.g., Acs, Audretsch and Evans 1994, Audretsch et al. 2006).
Using panel data for the US, Evans and Leighton (1989) find that persons who were
unemployed or in danger of becoming unemployed have a higher probability to become self-
employed than other persons. For Britain, Blanchflower und Oswald (1998) find a negative
relationship between die probability of becoming unemployed and the local unemployment rate.
Similarly, Taylor (1996) finds similar results using British panel data. Also using British panel
data, Bryson and White (1996) find that the duration of unemployment affects the entry rate into
self-employment. Using more recent waves of the same panel data set and simple transition
models, Martinez-Granado (2002) finds that, first, the aggregated unemployment rate has a
positive effect on the probability of becoming self-employed, which he interprets as “push
effect”, and, second, unemployed individuals are more likely to become self-employed, but this
effect is drastically reduced in case of long-term unemployment. Positive effects from individual
6
unemployment on the entry rate into self-employment are also reported by Foti and Vivarelli
(1994) for Italy, Alba-Ramirez (1994) and Carrasco (1999) for Spain, and Andersson and
Wadensjö (2006) for Sweden. For Germany, Wagner and Sternberg (2002) and Constant and
Zimmermann (2004) found a positive relationship between the entry rate into self-employment
and previous unemployment, whereas Reize (2000) finds no significant effect of the duration of
previous unemployment on the entry rate into unemployment.
In addition to the economic factors mentioned thus far, other potential determinants of self-
employment transitions have been identified in the literature, among them age, education, gender,
and ethnicity.3 From an economic perspective, age is of special interest because of lifecycle
effects on entry rates into self-employment. Evans and Leighton (1989) test the hypothesis that
that entry-rates follow a standard Markov process and find that the effect of age (or labour market
experience) on entry rates is not statistically significant. In contrast, in their comparison of entry
rates into self-employment of salaried workers in Germany and the US, Holtz-Eakin and Rosen
(2005) find that the entry rate first falls with age and then increases after the age of 50 in the US,
whereas for Germany the entry rate is strictly declining in age. Similar results are also reported in
other empirical studies for Germany (Caliendo, Fossen and Kritikos 2006, Fossen and Steiner
2006). However, these studies do not account for potential cohort effects which may distort the
age dependency of the entry rate into self-employment.
To summarise, previous empirical research for various OECD countries has established
various important factors determining the entry rate into self-employment. These include the
differential between earnings from self-employment and salaried employment, the risk
differential associated with these income sources, the degree of risk aversion, the presence of
credit constraints, and various personal characteristics, in particular age and previous
3 See, inter alia, Blanchflower and Oswald (1998), Holtz-Eakin and Rosen (2005), Constant and Zimmermann
(2004), Wagner (2003).
7
unemployment. However, most of these studies do not differentiate between short-term and
long-term unemployment, which may have very different effects on the entry rate into self-
employment, and do not account for its potential dependence on cohort effects.
3 Empirical Methodology
In contrast to most of the studies reviewed in the previous section, our empirical analysis of the
relationship between the entry rate into self-employment and unemployment is not based on
cross-section or panel data of individuals but on so-called “pseudo panel” data. In the following
we describe the construction of the pseudo panel used for our empirical analysis and discuss its
advantages and disadvantages compared to other data structures used in previous studies. In
section 3.2 we discuss measurement issues and present some descriptive statistics on self-
employment rates and start-up rates, and in section 3.3 we discuss the econometric specification
of the model and estimation issues.
3.1 Construction of Pseudo Panel
Our empirical analysis is based on a pseudo panel constructed from the “Mikrozensus”
(Microcensus, MZ) for the years 1996 to 2002. The MZ, which is the main general German
labour force survey, is a 1 % representative sample of the German population.4 The main
advantage of the MZ is its very large sample size, which allows one to analyse small subgroups
like people setting up their own business within a year. Its main disadvantage for the present
purpose is that it currently does not exist as a panel but only as a number of independent cross-
sections.5 However, since 1996 the MZ does contain information on an individual’s labour force
4 The scientific use file of the MZ used for the following analysis is a 70 percent subsample of this 1% sample.
5 Another possibility would have been to use the German Socio-Economic Panel (SOEP) which is a true (yearly)
panel with a much smaller data sample size. For a comparison of the MZ and the SOEP in the context of the
8
status the year before the current interview, which allows us to construct a pseudo-panel for the
purpose of analyzing labour force transitions as described below.
We restrict the observation period to the years 1996-2002 because in 2003 a very large
start-up subsidy for unemployed people was introduced which increased transitions into self-
employment (see Baumgartner, Caliendo and Steiner 2006). Given that there is no way to
distinguish these self-employment transitions from non-subsidised transitions in the MZ, we
cannot account for this and therefore restrict the observation period accordingly. In terms of
aggregate economic developments, our observation period covers a full economic cycle for the
whole of Germany with a modest upswing in the mid-nineties, a business cycle peak in
1999/2000, a recession in 2001/2002. Since the overall economic situation in East Germany is
still much different from West Germany, with a much higher unemployment rate in the east, we
differentiate the following analysis by region. Furthermore, to account for expected gender
differences in self-employment transitions we also report results separately for men and women.
The basic assumption underlying the construction of a pseudo panel is that individuals can
be unambiguously allocated to specific groups – also called cohorts – on the basis of some
common invariant individual characteristic(s), which implies that all individuals within a cohort
are behaving similarly over time (see, e.g., Deaton, 1985). Compared to a true panel, which is
defined by the time dimension (T) and the number of individuals (N), a pseudo panel can further
be differentiated along two additional dimensions, namely the number of observations within a
cohort (nc) and the number of cohorts (C). In allocating individuals to cohorts, there is a trade-off
between the number of individuals within a cohort and the number of cohorts: On the one hand,
in case a small number of cohorts is chosen to gain a larger number of observations per cohort,
analysis of self-employment transitions, see Fossen and Steiner (2006). In addition to its much larger sample size,
one advantage of using the MZ is that, in contrast to the SOEP, there is no sample attrition.

9
the danger arises that individuals within a cohort are rather heterogeneous, which could induce
inefficiency in estimation due to aggregation. On the other hand, if individuals in the sample are
allocated to a large number of cohorts there is the risk that – depending on sample size – only a
small number of observations remain for any given cohort which could induce biased estimators.
Thus, the challenge in construction a pseudo panel is to find the optimal choice between the
numbers of cohorts on the one hand, and cohort size on the other. Ideally, the optimal choice
would yield homogeneous cohorts of sufficient size.
Because of the very large sample size of the MZ, we can allocate individuals to cohorts
defined by both year of birth and gender. We consider individuals between 18 and 65 years of
age at the beginning of the observation period in 1996. Thus, we are analysing birth cohorts
1937-1978 by allocating each individual in the sample to a cohort defined by birth year and
gender. This allocation results in an average cohort size of about 3.000 individuals, which seems
a sufficiently large number to apply the asymptotic results referred to below. In the econometric
analysis, we differentiate the estimation by gender, but do not differentiate between East and
West Germany because migration between the two regions would violate our basic identifying
assumption that individuals can unambiguously be allocation to a particular cohort. We will
control for regional effects on start-up rates by including region of residence in addition to other
control variables in the estimation.
3.2 Data and Descriptive Statistics
In the following, the self-employment rate is defined as the ratio between self-employed people at
the date of interview in a particular year in the MZ relative to the labour force. The start-up rate
is defined as the ratio between the number of people who have been self-employed for less than

10
12 months at the date of interview in a particular year relative to the total labour force.6 The
reference period for most questions in the MZ is a week (mostly end of April each year).7 Given
this short reference period, long-term self-employment spells are overrepresented in the MZ, and
brief self-employment spells are underrepresented due to the well-known length bias inherent in
stock sampling (see Lancaster 1992: 185ff.). We also calculate the share of people who have been
unemployed at the date of interview in the previous years among all start-ups in a particular year.
Given that the retrospective information on an individual’s labour force status in the previous
year refers to a reference week (the end of April), short unemployment spells will be
underrepresented and long unemployment spells overrepresented in the sample as well. For our
purpose, this length-bias is an advantage because we are particularly interested in the impact of
long-term unemployment on the entry rate into self-employment.
For Germany as a whole, the average self-employment rate – defined as the number of self-
employed people relative to all employed people (dependently and self-employed) – hovers
around 9 percent in the observation period. Men living in West Germany have the highest self-
employment rate, amounting to an average value of almost 12 percent with little change over the
observation period. For women living in West Germany, the self-employment rate is only about
half the level of the male rate, and has also remained fairly stable in the observation period. In
East Germany, the self-employment rate of men increased from a little below 10 percent to
almost 12 percent in 2000, with a slight decline since then. For women living in East Germany,
the self-employment rate has slightly increased in the observation period and has reached roughly
the same level as the female rate in the west.
6 The retrospective question on last year’s labour force status was only asked to a 45% random sub-sample of the
Microcensus. Since selection into this sub-sample was at random, we do not expect selection bias resulting from
this sampling scheme. 7 Until the year 2004; starting in 2005 the MZ is conducted continuously during the year and the respective
questions thus refer to the “average” week (see Hansch 2006).

11
Table 1. Self-employment and start-up rates 1996-2002, by gender and region
1996 1997 1998 1999 2000 2001 2002
Self-employment rate (in %) West Germany Men 11.2 11.6 11.7 11.6 11.7 11.6 12.0 Women 6.1 6.2 6.4 6.3 6.2 6.0 6.2 East Germany Men 9.9 10.5 11.2 11.1 11.6 11.6 11.4 Women 5.2 5.6 5.9 5.7 5.9 6.1 6.4 Start-up rate (in %) West Germany Men 1.3 1.3 1.4 1.2 1.2 1.2 1.3 Women 0.8 1.0 1.0 0.9 0.8 0.8 0.8 East Germany Men 1.1 1.3 2.6 2.1 1.8 1.6 1.2 Women 0.7 0.8 1.2 1.3 1.1 1.0 0.9 Share of start-ups from unemployment (in %) West Germany Men 6.4 7.7 8.4 7.8 6.2 3.4 7.9 Women 2.2 6.5 7.2 3.1 6.5 6.1 6.9 East Germany Men 13.2 20.3 12.3 12.3 13.1 10.6 17.9 Women 25.8 18.7 9.2 4.1 16.2 20.0 15.2 Aggregate numbers (in 1,000) Self-employed Total 3,178 3,280 3,329 3,277 3,341 3,373 3,381 Start-ups Total 315 340 332 311 326 284 294
Notes: The self-employment rate is the ratio (in percent) of self-employed people to all people within the age limits of 18 and 65 years, the entry rate into self-employment (start-up rate) is the number of people who have been self-employed for less than a year at the date of interview relative to the labour force. Aggregate numbers are taken from Hansch (2006, Table 1).
Source: Microcensus 1996-2002, own calculations; Hansch (2006).
The stability of the self-employment especially in West Germany may suggest that self-
employment does not respond to the business cycle. This conclusion may be wrong, however,
since a constant share of self-employed people could also result from large and volatile flows into
and out of self-employment. Looking at the development of start-up rates in Table 1 shows,
however, that at least for West Germany this does not seem to be the case: for men living in West
Germany the start-up rate has been rather stable around a yearly average of 1.3 percent in the
observation period; the respective rate for women living in west Germany is 0.9 percent. For men
living in East Germany, the start-up rate has been increasing until the end of the 1990’s when it
peaked, but has been declining since then. A similar pattern can also be observed for women

12
living in East Germany (see Table 1). Regional differences in average start-up rates are relatively
small, both for men and women.
As shown in the lower part of Table 1, the share of start-ups from unemployment relative to
all start-ups varies in all groups in the observation period.8 In East Germany this share is roughly
double the west German rate in most years. In 1996, about a quarter of all women living in East
Germany who became self-employed in that year were unemployed in the year before, compared
to only about 2 percent of the respective group of women living in West Germany. For men
regional differences are also substantial, if less extreme. These differences may be related to the
much higher unemployment rate prevailing in East Germany relative to the west. However, it
could also be related to other factors, such as level of education and vocational qualification, age,
and household characteristics. In the empirical analysis below we will control for these factors in
order to identify the effect of previous unemployment on individual self-employment transitions.
3.3 Econometric Specification
Assuming the availability of individual-level panel data, we could specify the following linear
regression model:
(1) , it it i ity x kβ ε= + + with i = 1, ..., N and t = 1, ..., T,
where yit is an indicator variable with yit = 1 if individual i made a transition into self-
employment in period t, and yit = 0 otherwise; xit is a row vector of explanatory variables
including a dummy variable indicating whether or not individual i was unemployed in period t-1
and a set of control variables, β is a corresponding column vector of regression coefficient; ki is a
fixed (time-invariant) individual effect, and εit is a time-varying and individual-specific error
term.
13
Equation (1) is a fixed-effects linear probability model. Given the availability of true panel
data, unbiased estimates of the parameters could be obtained from a least-squares regression, in
principle.9 If estimated on the basis of a pseudo panel, equation (1) has to be aggregated over all
individuals within a specific cohort and thus refers to cohorts, indexed by c, rather than
individuals:
(2) ctct ct cty x kβ ε= + + , c = 1, ..., C; t = 1, ..., T
where cty is the observed mean of the dependent variable for cohort c at time t, and ctx now is a
row vector with the observed means of the explanatory variables x within cohort c at time t as
its elements; as before, β is a column vector of corresponding regression coefficients, and ctε is
the mean of individual-specific error terms within cohort c in period t. Note that the β
coefficients in (2) are the same as in (1) although measurement of the dependent and explanatory
variables differ between the two specifications.
The crucial difference between equations (1) and (2) concerns the mean cohort effect in
period t in the latter equation, ctk . In contrast to the individual fixed effect in equation (1), the
mean of the cohort effect is no longer necessarily constant over time, since the pseudo panel is
made up of individuals from independent cross sections. The cohort effect in a given period t is
thus composed of the „true“ unobserved cohort effect, *ctk , and an error term, *
itv , consisting of
two components: tν which measures the average deviation from *ctk , and ctν which measures
8 Note that unemployment is defined according to the concept used by the International Labour Organisation
(ILO), which differs from the definition used by the Federal Labour Agency. 9 Standard errors of estimated regression coefficients would be biased, though, due to heteroscedasticy of the error
term. Furthermore, there is no guarantee that the estimated probability of a self-employment transition,
conditional on x, falls within the unit interval. These complications need not concern us here, however, since the
linear probability model is only intended to motivate the following pseudo-panel estimator.

14
individual deviations from cohort means (Moffitt 1993: 103). The average cohort effect in period
t is therefore given by:
(3) ct c t ctk k ν ν∗
= + +
Given individuals are allocated to a particular cohort according to a time-invariant rule, e.g. year
of birth or gender, the error component ctv can be assumed to converge to zero in large cohorts,
and equation (3) approaches:
(4) ct c tk k ν∗
= +
Inserting this equation into (2) yields:
(5) ( )cct ct t cty x kβ ν ε∗
= + + +
Since we define cohorts by year of birth (and gender), g, the cohort effect is a function of this
variable which, in turn, is a function of the calendar year, t, and years of age: k(g) = k(t-a) =
k(t, a), with a: g = t – a.
Hence, if age is included in the vector of exogenous variables, ctx will be correlated with
*ck , and a pooled OLS regression will yield biased coefficient estimates. Conditioning on the
cohort effects and trying to eliminate them by the within-transformation of variables in equation
(5) does not work here because of the time-varying error component in the cohort effect. One
possibility to define away this problem is to assume that tν will average out in case of a
sufficiently large number of individuals in each cohort. However, as shown by Verbeek und
Nijman (1992), the bias of the fixed-effects estimator obtained from equation (5) under this
assumption could be substantial even for a large number of observations in each cohort.

15
An estimation approach which yields consistent and asymptotically efficient parameter
estimates was suggested by Deaton (1985). This approach, which we follow here, is also known
as "error-in-variables" method. Assuming the unobserved average cohort means were known,
unbiased parameter estimates could be obtained by fixed-effects estimation of eq. (5):
(6) cct ct D cty x kβ ε∗∗ ∗ ∗= + +
where cty∗ is the true mean of the self-employment rate of cohort c in time period t , ctx ∗ is a row
vector with the true means of the explanatory variable as its components, and βD is a column
vector of corresponding regression coefficients; ck∗ is the “true” time-invariant cohort effect, and
ctε ∗ is an error term assumed to be normally and independently distributed. Of course, the „true“
variable means are unobserved, and sample means are observed with measurement errors.
Assuming these errors are identically and independently normally distributed, we have
(Verbeek 1992: 306):
(7) 000 ~ ;
0
iidct ct
ct ct
y yN
x xσ σσ
∗
∗
′ − Σ−
Variances of measurement errors can be estimated from individual-level data. Since the number
of observations per cohort varies between 2,500 und 4,500 in our data set, we have adjusted
estimated variances for differences in sample size, as suggested in Deaton (1985: 117).
The Fixed Effects estimator adjusted for measurement errors is given by (Deaton 1985):
(8) [ ]1ˆ ˆ ˆX X CT X y CTβ τ τ σ−
′ ′= − ⋅ ⋅Σ − ⋅ ⋅
with τ = (T-1)/T
X := (C×K) matrix with K explanatory variables
y := (C×1) vector ˆ ˆ, σΣ := (K×K) matrix and (K×1) vector of estimated error variances.

16
Due to the within-transformation of each variable, one degree of freedom is lost, which is taken
care of by the adjustment factor τ (Verbeek 1993: 306). The elements of the matrix X’X are
defined as ( ) ( )1 1C Tc t ct c ct cx x x x′= = − −∑ ∑ , where ctx is a row vector of observed means of the
explanatory variables for cohort c in period t, and cx is a row vector of these means over time.
Note that variables, which are measured as a binary variable at the individual level, are measured
as averages or shares within a cohort in the pseudo panel. For example, the incidence of previous
individual unemployment aggregates to the average unemployment rate in the previous period
within a specific cohort. Likewise, a categorical variable like a dummy for higher education
would aggregate to the share of this education category in the respective cohort. Definitions and
descriptive statistics of explanatory variables included in the estimating equation are given in the
appendix.
4 Estimation Results
Estimated effects of explanatory variables on transition rates into self-employment based on
equation (8) are summarised for men and women in Table 2. Regression coefficients give the
change of the start-up rate to a change of the explanatory variable by one percentage point if the
latter is also measured as a share (in percent) within a cohort, such as the unemployment rate. In
case the explanatory variable is measured as mean value within the cohort, such as age, the
regression coefficient gives the change of the start-up rate to a change of the explanatory variable
by one unit.
In addition to age, we also include a set of cohort dummies in the estimation. Age, cohort
and calendar time effects are not separately identifiable due to the linear relationship between
them as described above. There are various possibilities to break up this linear dependence
between these effects. Following Boockmann and Steiner (2006), here we assume that year
17
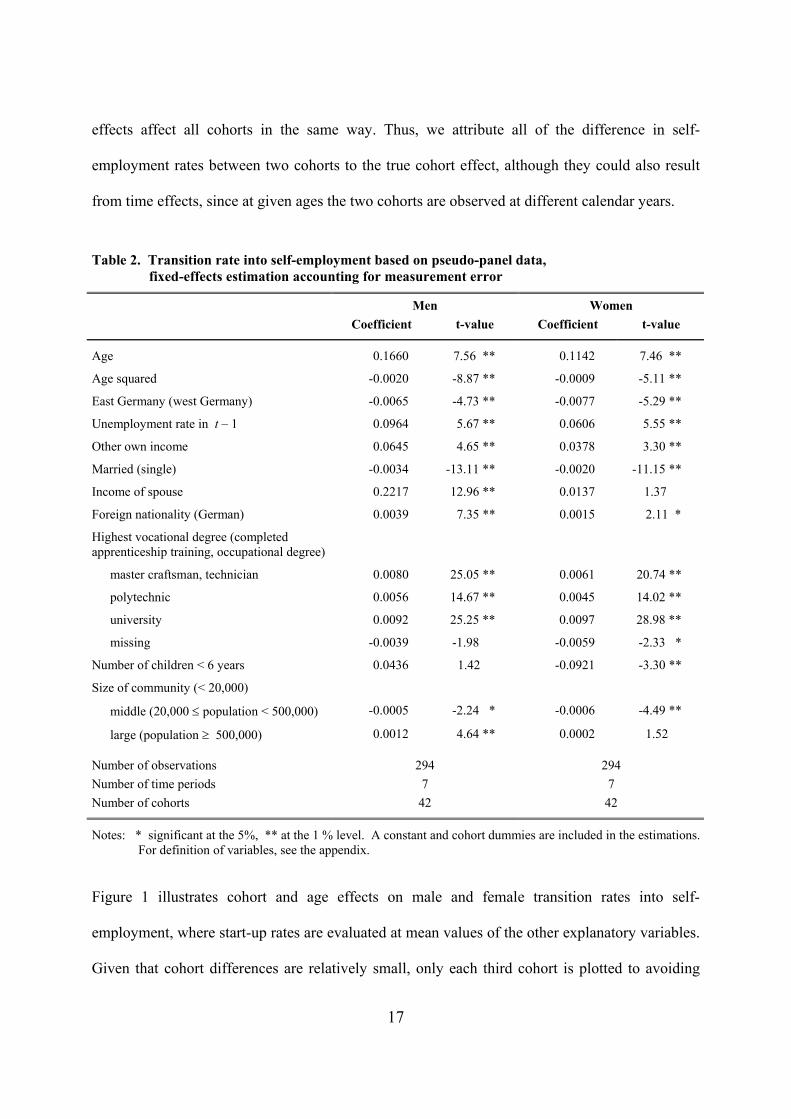
effects affect all cohorts in the same way. Thus, we attribute all of the difference in self-
employment rates between two cohorts to the true cohort effect, although they could also result
from time effects, since at given ages the two cohorts are observed at different calendar years.
Table 2. Transition rate into self-employment based on pseudo-panel data, fixed-effects estimation accounting for measurement error
Men Women Coefficient t-value Coefficient t-value
Age 0.1660 7.56 ** 0.1142 7.46 **
Age squared -0.0020 -8.87 ** -0.0009 -5.11 **
East Germany (west Germany) -0.0065 -4.73 ** -0.0077 -5.29 **
Unemployment rate in t – 1 0.0964 5.67 ** 0.0606 5.55 **
Other own income 0.0645 4.65 ** 0.0378 3.30 **
Married (single) -0.0034 -13.11 ** -0.0020 -11.15 **
Income of spouse 0.2217 12.96 ** 0.0137 1.37
Foreign nationality (German) 0.0039 7.35 ** 0.0015 2.11 *
Highest vocational degree (completed apprenticeship training, occupational degree)
master craftsman, technician 0.0080 25.05 ** 0.0061 20.74 **
polytechnic 0.0056 14.67 ** 0.0045 14.02 **
university 0.0092 25.25 ** 0.0097 28.98 **
missing -0.0039 -1.98 -0.0059 -2.33 *
Number of children < 6 years 0.0436 1.42 -0.0921 -3.30 **
Size of community (< 20,000)
middle (20,000 ≤ population < 500,000) -0.0005 -2.24 * -0.0006 -4.49 **
large (population ≥ 500,000) 0.0012 4.64 ** 0.0002 1.52
Number of observations 294 294 Number of time periods 7 7 Number of cohorts 42 42
Notes: * significant at the 5%, ** at the 1 % level. A constant and cohort dummies are included in the estimations. For definition of variables, see the appendix.
Figure 1 illustrates cohort and age effects on male and female transition rates into self-
employment, where start-up rates are evaluated at mean values of the other explanatory variables.
Given that cohort differences are relatively small, only each third cohort is plotted to avoiding

18
cluttering the picture.10 Cohort effects are given by the difference in start-up rates between
cohorts at a given age. To avoid cluttering the picture, only every third cohort is plotted in the
figure. For example, for men aged about 40 years the difference in start-up rates between cohorts
is almost 1 percentage point.
Overall, men aged between 35 and 40 years are the most likely to become self-employed,
with an average transition rate of about 1.6 percent. This result corresponds with intuition since at
this stage of their lifecycle they should have, on the one hand, acquired sufficient work
experience and sufficient financial means to start an own business. On the other hand, they are
still young enough to reap the gains from a successful start-up or, in case of an unsuccessful
undertaking, to try an alternative occupation. The relatively strong decline of the male start-up
rate after the age of 40 is also consistent with the lifecycle view of occupational choice. For
women, the relationship between start-up rates and age is similar to that of men, although female
start-up rates are only half the male rates; the highest rate of a bit less than 1 percent is obtained
by the age group between 30 and 40 years. For women, cohort effects are less pronounced than
those for men.
10 Although start-up rates in east Germany are, conditional on the other variables included in the model, somewhat
lower than in west Germany, we do not allow for regional differences of age and cohort effects on transition rates
into self-employment in the estimation, and do therefore not report separate estimates for the two regions in the
figure.

19
Figure 1. Age and cohort effects on the transitions rate into self-employment by gender
a) Men
b) Women
Note: For a given age and cohort, start-up rates are calculated for average values of the explanatory variables.
Source: Estimation results in Table 2.
0
.5
1
1.5
2
star
t-up
rate
(in
perc
ent)
20 30 40 50 60age (in years)
0
.5
1
1.5
2
star
t-up
rate
(in
perc
ent)
20 30 40 50 60age (in years)

20
Turning to the relationship between previous unemployment and the transition rate into self-
employment, we find both for men and women that the higher a cohort’s unemployment rate in
the previous year, the higher the transition rate into self-employment, and that these effects are
highly significant. For men, the self-employment transition rate is estimated to increase by
roughly 0.1 percentage points if the unemployment rate within a cohort rises by 1 percentage
point. For women, the effect of previous unemployment on self-employment transitions is only
about half the size estimated for men, but still substantial given the relatively small levels of
female self-employment rates (see Table 1).
The effect of previous unemployment on self-employment transitions is also substantial
relative to the effects estimated for some of the other explanatory variables included in the model.
For example, an increase in the share of male and female university graduates within a cohort by
ten percentage point would raise the transition rate into self-employment by a mere tenth of a
percentage points. A specialized vocational qualification obtained as a master craftsmen and
technician also has a relatively strong positive effect on the estimated transition rate into self-
employment, especially for men. These effects may be related to the fact that in Germany not
only do the professions, such as physicians, lawyers, and architects, require a university
education, but until recently (2005) a large number of crafts were restricted to self-employed with
a specialized vocational qualification as a master craftsman.
While higher unemployment rates prevailing in east Germany increase transition rates into
self-employment, the negative effect of the share of a cohort living in the east on transition rates
reflects the fact that, on average, self-employment rates are lower in east Germany than in the
west both for men and women. We also find that the average size of the community of residence
affects transition rates into self-employment, although in a non-linear fashion: transitions rates
tend to be higher in small and large communities relative to medium-sized ones.
21
Regarding personal and family characteristics we find that the larger the share of foreigners
in a cohort, the higher the self-employment transition rate, a result that has also been reported in
previous literature for Germany (see, e.g., Constant and Zimmermann, 2004). Married women
have a significantly lower self-employment transition rate than single women, and there is also a
significant negative effect of the number of children on female transition rates, other things equal.
Transition rates are also increasing in other household income and also in the spouse’s income.
Note, however, that these effects are difficult to interpret given the aggregation of individual
information within cohorts and also the fact that characteristics like vocational education may
proxy for differential earnings effects.
5 Conclusion
An important question in labour market policy evaluation concerns the empirical relationship
between previous unemployment and the transition rate into self-employment. Theoretical
literature has identified various channels through which unemployment may affect self-
employment transitions. On the one hand, high unemployment may reduce the opportunity to
gain dependent employment and thus positively affect self-employment, as suggested by the
“unemployment push” hypothesis. On the other hand, according to the “unemployment pull”
hypothesis, high unemployment may negatively affect individual expectations about the success
of self-employment and thereby the start-up rate, or reinforce credit constraints which may hinder
unemployed people to become self-employed. Previous empirical literature has yielded
ambiguous results concerning the relative importance of these two hypotheses. Given that long-
term unemployment tends to be heavily concentrated among older workers, the relationship
between the entry rate into self-employment and age is also of great policy relevance. Although
this relationship has been investigated in the empirical literature, cohort effects have been
neglected in most of these studies.

22
In this paper, we have analysed the relationship between previous unemployment and the
transition rate into self-employment for Germany using pseudo-panel data and a fixed-effects
estimator which accounts for cohort effects and measurement error. Estimation results show that
previous (long-term) unemployment has significant positive effects on entry rates into self-
employment for both men and women. These effects are quantitatively important, both in
absolute terms and compared to other potential determinants of self-employment transitions, such
as age, the level of vocational qualification and certain household characteristics. We have also
established that entry rates into self-employment are much higher for men than for women at
each age, and that accounting for cohort effects does not change the life-cycle pattern of entry
rates into self-employment for both groups, with relatively low entry rates of older people. From
a policy perspective, we may conclude that although long-term unemployment tends to push
people into self-employment, this effect is not particularly large for older people who make up a
disproportionate share of the long-term unemployed.

23
References
Acs, Z. J., D. B. Audretsch and D. S. Evans (1994): The determinants of variation in the selfemployment rates across countries and over time, CEPR Discussion Paper No. 871.
Alba-Ramirez, A. (1994): Self-employment in the midst of self-employment: the case of Spain and the United States, Applied Economics, 26, 189-204.
Almus, M. (2004): Job creation through public start-up subsidies, Applied Economics, 36, 2015-24.
Andersson, P. and E. Wadensjö (2006): Employees Who Become Self-Employed: Do Labour Income and Wages Have an Impact?, IZA Discussion Papers No. 1971, Bonn.
Audretsch, D. A., M. A. Carree, A. van Stel and R. Thurik (2005): Does Self-Employment Reduce Unemployment?, Discussion Papers on Entrepreneurship, Growth and Public Policy No. 07/05, Max Planck Institute of Economics, Jena.
Baumgartner, H. J. and M. Caliendo (2007): Turning unemployed into self-employed: effectiveness and efficiency of two programs in west Germany, DIW Discussion Paper, German Institute for Economic Research, Berlin.
Blanchflower, D.G. and A. Oswald.(1998): What Makes an Entrepreneur?, Journal of Labor Economics , 16, S.26-60.
Boockmann, Bernhard und Viktor Steiner (2006): Cohort effects and the returns to education in West Germany, Applied Economics, 38, 1135-1152.
Byrson, A. and M. White (1996): From unemployment to self-employment. PSI Papers, Policy Studies Institute, London.
Caliendo, Marco, Frank M. Fossen and Alexander S. Kritikos (2006): Risk Attitudes of Nascent Entrepreneurs – New Evidence from an Experimentally-Validated Survey, DIW Discussion Paper No. 600, German Institute for Economic Research, Berlin.
Carrasco, R. (1999): Transitions to and from self-employment in Spain: An empirical analysis, Oxford Bulleting of Economics and Statistics, 61, 315-346.
Constant, A. and K. F. Zimmermann (2004), The Making of Entrepreneurs in Germany: Are Native Men and Immigrants Alike?, IZA Discussion Paper No. 1440, Bonn.
Cressy, R. C. (2000): Credit rationing or entrepreneurial risk aversion? An alternative explanation of the Evans and Jovanovic finding, Economic Letters, 66, 235-40.
Deaton, A. (1985): Panel data from time series of cross-sections, Journal of Econometrics, 30, 109-126.
Evans, D. and L. S. Leighton (1989): Some empirical aspects of entrepreneurship, American Economic Review ,79, S.519-535.
Evans, D. and B. Jovanovic, B. (1989): An estimated model of entrepreneurial choice under liquidity constraints, Journal of Political Economy, 97, 808-827.
Fossen, F. M. and V. Steiner (2006): Income Taxes and Entrepreneurial Choice: Empirical Evidence from Germany, DIW Discussion Paper No. 582, German Institute for Economic Research, Berlin.
Foti, A. and M. Vivarelli (1994): An Econometric Test of the Self-Employment Model: The Case of Italy, Small Business Economics, 6, 81-94.
Greene, W. H. (2003): Econometric Analysis, 5th edition, New Jersey: Prentice Hall

24
Hansch, E. (2006): Existenzgründungen im Spiegel des Mikrozensus, Wirtschaft und Statistik, 5/2006, 495-504.
Holtz-Eakin, D. and H. S. Rosen (2005): Cash Constraints and Business Start-Ups: Deutschmarks Versus Dollars, Contributions to Economic Analysis & Policy, 4, 1-26.
Kihlstrom, R. E. and J.-J. Laffont (1979), “A General Equilibrium Entrepreneurial Theory of Firm Formation Based on Risk Aversion,” The Journal of Political Economy, 87, 719-748.
Lancaster, T. (1992): The Econometric Analysis of Transition Data, Econometric Society Monographs No. 17, Cambridge University Press.
Lucas, R.E. (1978): On the size distribution of business firms, Bell Journal of Economics, 9, 503-23.
Martinez-Granado, M. (2002): Self-Employment and Labour Market Transitions: A Multiple State Model, CEPR Discussion Papers 3661, London.
Meager, N. (1992): Does Unemployment lead to Self-Employment?, Small Business Economics, 4, 87-103
Moffitt, R. (1993): Identification and estimation of dynamic models with a time series of repeated cross-sections, Journal of Econometrics, 59, S.99-123.
Parker, S.C. (2004): The Economics of Self-Employment and Entrepreneurship, Cambridge University Press.
Pfeiffer, F. and Frank Reize (2000): Business Start-ups by the Unemployed - an Econometric Analysis Based on Firm Data, Labour Economics, 7, 629-663.
Pfeiffer, F. and W. Pohlmeier (1992): Income, uncertainty, and the probability of self-employment, Recherches Economiques de Louvain, 58, 265-281.
Rees, H. and A. Shah (1996): An empirical analysis of self-employment in the UK, Journal of Applied Econometrics, 1, 95-108.
Reize, F. (2000): Leaving Unemployment for Self-Employment, ZEW Discussion Paper No 00-26, Mannheim.
Storey, D. J. (1991): The birth of new firms – does unemployment matter? A review of the evidence, Small Business Economics, 3, 167-178.
Taylor, M. P. (1996): Earnings, independence or unemployment: why become self-employed?, Oxford Bulletin of Economics and Statistics 58, 53-266.
Verbeek, M. (1992): Pseudo Panel Data, in: Mátyás, László,The Econometrics of Panel Data: A handbook of the theory with application, 1st ed., Dordrecht, Kluwer: 303-315.
Verbeek, M. and T. Nijman (1992): Can cohort data be treated as genuine panel data?, Empirical Economics, 17, 9-23
Wagner, J. (2003): The impact of personal characteristics and the regional milieu on the transition form unemployment to self-employment: Empirical evidence for Germany, Jahrbücher für Nationalökonomie und Statistik, 223, 204-222.
Wagner, J. and R. Sternberg (2002): Personal and Regional Determinants of Entrepreneurial Activities: Empirical Evidence from the REM Germany, IZA Discussion Paper No. 624, Bonn.
25
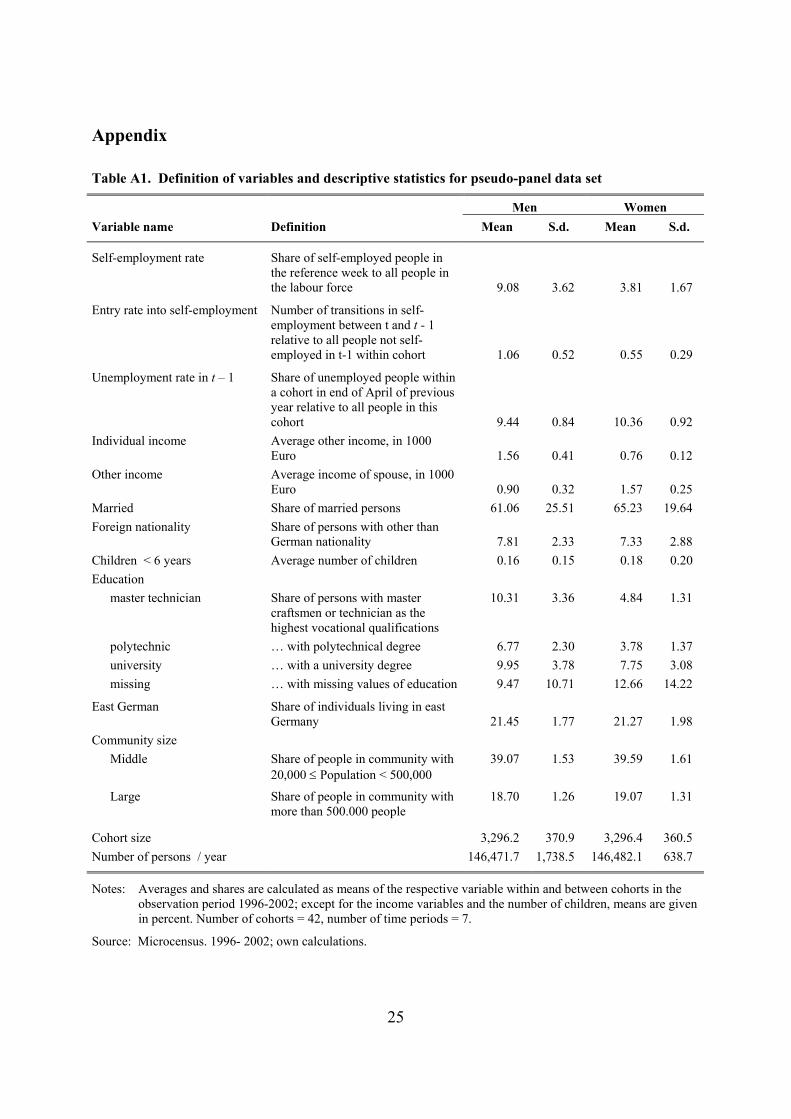
Appendix Table A1. Definition of variables and descriptive statistics for pseudo-panel data set
Men Women Variable name Definition Mean S.d. Mean S.d.
Self-employment rate Share of self-employed people in the reference week to all people in the labour force 9.08 3.62 3.81 1.67
Entry rate into self-employment Number of transitions in self-employment between t and t - 1 relative to all people not self-employed in t-1 within cohort 1.06 0.52 0.55 0.29
Unemployment rate in t – 1 Share of unemployed people within a cohort in end of April of previous year relative to all people in this cohort 9.44 0.84 10.36 0.92
Individual income Average other income, in 1000 Euro 1.56 0.41 0.76 0.12
Other income Average income of spouse, in 1000 Euro 0.90 0.32 1.57 0.25
Married Share of married persons 61.06 25.51 65.23 19.64 Foreign nationality Share of persons with other than
German nationality 7.81 2.33 7.33 2.88 Children < 6 years Average number of children 0.16 0.15 0.18 0.20 Education
master technician Share of persons with master craftsmen or technician as the highest vocational qualifications
10.31
3.36
4.84
1.31
polytechnic … with polytechnical degree 6.77 2.30 3.78 1.37 university … with a university degree 9.95 3.78 7.75 3.08 missing … with missing values of education 9.47 10.71 12.66 14.22
East German Share of individuals living in east Germany 21.45 1.77 21.27 1.98
Community size Middle Share of people in community with
20,000 ≤ Population < 500,000 39.07
1.53
39.59
1.61
Large Share of people in community with
more than 500.000 people 18.70
1.26
19.07
1.31
Cohort size 3,296.2 370.9 3,296.4 360.5 Number of persons / year 146,471.7 1,738.5 146,482.1 638.7
Notes: Averages and shares are calculated as means of the respective variable within and between cohorts in the observation period 1996-2002; except for the income variables and the number of children, means are given in percent. Number of cohorts = 42, number of time periods = 7.
Source: Microcensus. 1996- 2002; own calculations.