self ignition of hydrogen by various mechanisms · and hawksworth (2005), golub et al. (2006) and...
TRANSCRIPT

SYMPOSIUM SERIES NO. 156 Hazards XXII # 2011 Crown Copyright
SELF IGNITION OF HYDROGEN BY VARIOUS MECHANISMS†
P Hooker, M Royle, J Gummer, D Willoughby and J Udensi, Health and Safety Laboratory, Buxton, Derbyshire, UK
INTRODUCTIONWith the almost inevitable transition to some form ofhydrogen based economy, the potential for spontaneous orself ignition of hydrogen is clearly important. A numberof mechanisms have been suggested which may accountfor this phenomenon and there have been studies previouslyby others to a greater or lesser degree. This paper reportsthe results of studies to investigate selected potential mech-anisms for this behaviour:
. Sudden adiabatic compression in shock wave formation.
. Charging of a hydrogen jet leading to electrostatic igni-tion by corona discharge.
. Charging of particles within the hydrogen stream lead-ing to electrostatic ignition by corona discharge.
Health and Safety Laboratory (HSL) have performedexperiments in order to attempt to define conditions underwhich hydrogen can apparently self ignite and to confirmwhich mechanisms may account for this behaviour.
Experiments were performed to investigate:
. Ignition by adiabatic compression due to boundary layerfailure.
. The current and polarity necessary to ignite pre-mixedclouds of hydrogen/air by corona discharge.
. The charge produced by a hydrogen jet emerging intofree air both with and without entrained particleswithin the jet.
LITERATURE REVIEWThe first part of this project was a literature review,published separately (Gummer and Hawksworth 2007).The design of these experiments was based on Astburyand Hawksworth (2005), Golub et al. (2006) and Dryeret al. (2007).
In particular the work of Dryer gave a starting pointfor the experiments to investigate the ignition of suddenreleases of compressed hydrogen to atmosphere. In additionto being significant as probably the first piece of experimen-tal work to demonstrate ignition of releases into ‘normal’everyday type environments, it was important as it alsoidentified the influence of downstream obstructions on thepropensity to ignite hydrogen.
Corona discharges are a continuous electrostatic dis-charges occurring when sharp points are raised to a highpotential with respect to the surroundings, due to locallyintensified electric fields near to the point. The potential at
432
which a corona discharge will commence from a dischargepoint is given by the following equation:
Vo ¼ 18ffiffi
rp
(1)
where: Vo ¼ corona onset potential (kV)r ¼ radius of curvature of the discharge point
(cm)
It is generally accepted that corona discharges are incapableof igniting typical hydrocarbon/air mixtures, thoughthey have been implicated in the ignition of more sensitiveflammable atmospheres such as hydrogen/air mixtures,such as anecdotal evidence of ignition of hydrogen ventedfrom tall vent stacks.
EXPERIMENTAL PROGRAMME
PHASE 1 – DIFFUSION IGNITION TESTS
EXPERIMENTAL ARRANGEMENTThe work in this part of the programme involved testsusing a bursting disc assembly and down-stream geometrysimilar to that used by Dryer; a photograph of the assemblyis shown at Figure 1. The fitting marked A in the photographwas specially manufactured to take a Kistler pressure trans-ducer so that the pressure profile in the cavity immediatelydownstream of the bursting disc could be recorded as thedisc burst. A reducer B was used to connect variousfurther downstream fittings, labelled C to K in Table 1.Some experiments were carried out with no fittings (i.e.hydrogen released directly from source). All the exper-iments were performed outside with the hydrogen releasedto open atmosphere. The hydrogen for the tests was suppliedfrom HSL’s 1000 bar experimental hydrogen facility; aschematic of the set up is shown at Figure 2.
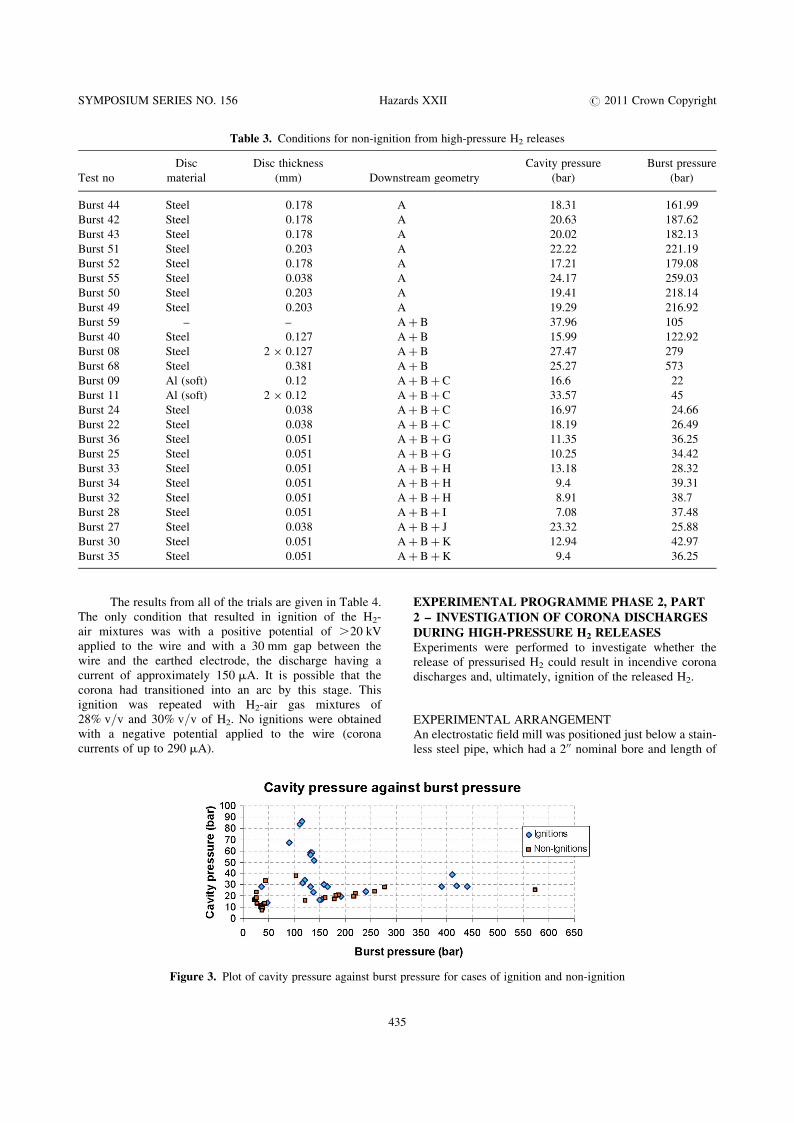
RESULTSA total of 85 tests were carried out using variations ondownstream geometries and pressures. A list of the geo-metries tested is given in Table 1. With no fittings to restrictor reflect the flow, there was no ignition up to 831 barg. Thelowest disc burst pressure at which an ignition was obtainedwas 35.5 bar; this corresponded to a transient cavitypressure (downstream of the bursting disc) of 28.6 bar.Examples of releases that resulted in ignition are given inTable 2, and examples of those that did not are given inTable 3. A plot of cavity pressure against burst pressurefor ignitions and non-ignitions is shown at Figure 3.
†# Crown Copyright 2011. This article is published with the permission of the Controller of HMSO and the Queen’s Printer for Scotland.
This publication and the work it describes were funded by the Health and Safety Executive (HSE). Its contents, including any opinions and/or
conclusions expressed, are those of the authors alone and do not necessarily reflect HSE policy.

SYMPOSIUM SERIES NO. 156 Hazards XXII # 2011 Crown Copyright
EXPERIMENTAL PROGRAMME PHASE 2, PART
1– IGNITION OF HYDROGEN/AIR MIXTURES
BY GENERATED CORONA DISCHARGEIn these experiments, corona discharges were generateddeliberately using a high voltage electrode in order toassess under what type of corona conditions hydrogen/airmixtures may be ignited.
EXPERIMENTAL ARRANGEMENTA cylindrical vessel of dimensions (1.22 m dia � 1.70 mlong) was used to investigate the conditions under whichH2-air mixtures may be ignited by corona discharges.
It was considered unlikely that in a well-earthed H2
handling system a situation would arise where two conduct-ing items were close to each other but at significantly dif-ferent potentials. Therefore, initially, a wire electrode(0.38 mm diameter nichrome) was positioned centrally inthe vessel, using the vessel walls (approximately half ametre away) as the “earthed” electrode. When no ignitions
Figure 1. Geometry downstream of bursting disk
Table 1. Details of downstream flow geometry components
used for burst disc experiments
Fitting ID Fitting type
A 1200 NPT pipe nipple 200 long with piezo transducer
B 1200 to 3/800 NPT female brass reducing union
C 3/800 NPT male to 1400 male Swagelok tube reducer
D 3/800 BSP plug (flat face) with 5.7 mm bore
E 3/800 BSP plug (flat face) with 6.7 mm bore
F 3/800 BSP plug (flat face) with 7.7 mm bore
G 3/800 BSP plug (flat face) with 8.7 mm bore
H 3/800 BSP plug (flat face) with 9.7 mm bore
I 3/800 BSP plug (flat face) with 10.7 mm bore
J 3/800 BSP plug (flat face) with 2.7 mm bore
K 3/800 BSP plug (flat face) with 9.2 mm bore
433
occurred with this arrangement, an additional electrode (ametal plate electrically bonded to the vessel) was placedapproximately 30 mm away from the corona point to gener-ate higher corona currents.
The relationship between the applied potential and themagnitude of the resulting corona current has been studiedby previous workers and a relationship of the followingtype has been proposed (Cross).
I ¼ KV(V� Vo) (2)
where: I ¼ corona current (A)V ¼ applied potential (V)
Vo ¼ corona onset potential (V)K ¼ a constant
The vessel was fitted with explosion relief consisting ofphysically weak electrically conducting plastic film thatwas physically and electrically bonded to the vessel toblock out external static electric fields. The vessel wasenclosed by a Faraday cage formed by an iron wire meshsupported on a frame. The current passing from the vesselto earth was measured using a Keithley Electrometer type6514 in order to determine the corona current directly asa current measurement. The analogue voltage output ofthe Keithley was fed into a National Instruments (NI) A/Dconverter, type USB 6229, with a 16 bit resolution. Thedata was logged and processed using the LabView SignalExpress software package. Very small background currents(about 100 pA) were detected from the test vessel, despitethe presence of the Faraday cage, due to dust impingement.However, these were several orders of magnitude lowerthan the corona currents being studied and so did not intro-duce a significant error.
Attempts were made to ignite known concentrationsof H2-air mixtures by inducing a corona discharge withinthe gas mixture. The H2 concentrations used in the testswere within a range around the concentration for whichthe lowest spark ignition energy is observed (i.e. 28% v/v)with a concentration of H2 between 26% v/v and 33% v/vin air being employed. The concentrations of the H2-airmixture at the inlet and exhaust ports of the vessel weredetermined in the following way. The oxygen concentrationwas sampled using a calibrated Servomex 570 O2 analyserand the H2 concentration was calculated by difference.Figure 4 shows a schematic of the experimental arrange-ment used for these tests.
RESULTSData obtained in these tests show that corona currentsappeared to vary with the square of the applied poten-tial as proposed by others. This is demonstrated inFigure 5. It is interesting to note that the corona currentwas higher in the hydrogen/air mixtures than it was inair, for both positive and negative potentials applied tothe wire.

SYMPOSIUM SERIES NO. 156 Hazards XXII # 2011 Crown Copyright
Figure 2. Simplified schematic of the spontaneous ignition high-pressure H2 test facility
Table 2. Conditions for diffusion ignition from high-pressure H2 releases
Test no
Disc
material
Disc thickness
(mm)
Downstream
geometry
Cavity
pressure
(bar)
Burst
pressure
(bar)
Burst 48 Steel 0.203 A 24.17 241.3
Burst 47 Steel 0.254 A 28.2 390.3
Burst 45 Steel 0.305 A 28.81 419.0
Burst 39 Steel 0.178 Aþ B 17.09 154.1
Burst 41 Steel 0.178 Aþ B 19.78 192.5
Burst 60 Steel 0.178 Aþ B 30.27 159.0
Burst 58 Steel 0.178 Aþ B 16.24 151.0
Burst 19 Steel 0.305 Aþ B 39.06 411.0
Burst 69 Steel 0.381 Aþ B 28.56 439.5
Burst 20 Steel 0.051 Aþ Bþ C 28.56 36.9
Burst 04 Steel 0.127 Aþ Bþ C 83.86 112.0
Burst 05 Steel 0.127 Aþ Bþ C 86.10 115.2
Burst 10 Al (hard) 0.25 Aþ Bþ C 67.50 91.0
Burst 13 Steel 0.127 Aþ BþD 58.23 132.7
Burst 12 Steel 0.127 Aþ BþD 58.47 135.1
Burst 14 Steel 0.127 Aþ Bþ E 56.64 132.7
Burst 15 Steel 0.127 Aþ Bþ F 51.64 139.4
Burst 29 Steel 0.051 Aþ BþG 12.70 39.3
Burst 26 Steel 0.051 Aþ BþG 14.04 46.6
Burst 16 Steel 0.127 Aþ BþG 33.81 121.1
Burst 37 Steel 0.127 Aþ BþG 31.25 116.8
Burst 17 Steel 0.127 Aþ BþH 28.56 132.1
Burst 38 Steel 0.178 Aþ Bþ I 28.08 165.7
Burst 21 Steel 0.127 Aþ Bþ I 23.32 137.6
Burst 31 Steel 0.051 Aþ BþK 12.70 39.3
434
SYMPOSIUM SERIES NO. 156 Hazards XXII # 2011 Crown Copyright
Table 3. Conditions for non-ignition from high-pressure H2 releases
Test no
Disc
material
Disc thickness
(mm) Downstream geometry
Cavity pressure
(bar)
Burst pressure
(bar)
Burst 44 Steel 0.178 A 18.31 161.99
Burst 42 Steel 0.178 A 20.63 187.62
Burst 43 Steel 0.178 A 20.02 182.13
Burst 51 Steel 0.203 A 22.22 221.19
Burst 52 Steel 0.178 A 17.21 179.08
Burst 55 Steel 0.038 A 24.17 259.03
Burst 50 Steel 0.203 A 19.41 218.14
Burst 49 Steel 0.203 A 19.29 216.92
Burst 59 – – Aþ B 37.96 105
Burst 40 Steel 0.127 Aþ B 15.99 122.92
Burst 08 Steel 2 � 0.127 Aþ B 27.47 279
Burst 68 Steel 0.381 Aþ B 25.27 573
Burst 09 Al (soft) 0.12 Aþ Bþ C 16.6 22
Burst 11 Al (soft) 2 � 0.12 Aþ Bþ C 33.57 45
Burst 24 Steel 0.038 Aþ Bþ C 16.97 24.66
Burst 22 Steel 0.038 Aþ Bþ C 18.19 26.49
Burst 36 Steel 0.051 Aþ BþG 11.35 36.25
Burst 25 Steel 0.051 Aþ BþG 10.25 34.42
Burst 33 Steel 0.051 Aþ BþH 13.18 28.32
Burst 34 Steel 0.051 Aþ BþH 9.4 39.31
Burst 32 Steel 0.051 Aþ BþH 8.91 38.7
Burst 28 Steel 0.051 Aþ Bþ I 7.08 37.48
Burst 27 Steel 0.038 Aþ Bþ J 23.32 25.88
Burst 30 Steel 0.051 Aþ BþK 12.94 42.97
Burst 35 Steel 0.051 Aþ BþK 9.4 36.25
The results from all of the trials are given in Table 4.The only condition that resulted in ignition of the H2-air mixtures was with a positive potential of .20 kVapplied to the wire and with a 30 mm gap between thewire and the earthed electrode, the discharge having acurrent of approximately 150 mA. It is possible that thecorona had transitioned into an arc by this stage. Thisignition was repeated with H2-air gas mixtures of28% v/v and 30% v/v of H2. No ignitions were obtainedwith a negative potential applied to the wire (coronacurrents of up to 290 mA).
435
EXPERIMENTAL PROGRAMME PHASE 2, PART
2 – INVESTIGATION OF CORONA DISCHARGES
DURING HIGH-PRESSURE H2 RELEASESExperiments were performed to investigate whether therelease of pressurised H2 could result in incendive coronadischarges and, ultimately, ignition of the released H2.
EXPERIMENTAL ARRANGEMENTAn electrostatic field mill was positioned just below a stain-less steel pipe, which had a 200 nominal bore and length of
Figure 3. Plot of cavity pressure against burst pressure for cases of ignition and non-ignition

SYMPOSIUM SERIES NO. 156 Hazards XXII # 2011 Crown Copyright
Figure 4. Schematic of the experimental arrangement used for ignition of H2-Air mixtures from generated corona discharges
2.5 m, to measure the electric field in the direction of theH2 release. Fine wires (0.38 mm diameter nichrome) wereplaced at various positions in an attempt to promotecorona discharges.
H2 was released from the high-pressure H2 facility,for a duration of four seconds from a starting nominalpressure of 200 barg (i.e. typical pressure for commerciallyavailable cylinders). The released gas was directed into astainless steel pipe with 2-inch nominal bore and length of2.5 m. In some cases, powder was placed inside the pipeto be dispersed by the H2 flow in order to increase the elec-trostatic effects. Two different dusts were used: a poly-propylene plastic powder consisting of coarse (1–2 mm)and fine particles of a few hundred microns, and a fine(ca. 10 mm) iron (III) oxide powder (rust).
An Industrial Developments Bangor (IDB) Model422 electric field meter was used to measure the electric
43
field. The amount of charge on the dispersed dust wasinferred by measuring the charge (of opposite polarity)transferred to the pipe. A Keithley Electrometer type 6514was used to measure the voltage accumulated on a 1 mFcapacitor connected to a 2.5 m pipe – to assess the chargetransfer between the pipe and the powder. In some exper-iments, an alternative system was used to measure thecharge on the powder; a John Chubb Instruments JCI178charge-measuring device was used to measure the chargeon the pipe directly. The analogue voltage outputs ofthese instruments were fed into an NI A/D converter,type USB 6229, with a 16-bit resolution and coupled toa PC driven by NI software (Signal Express andLabView). For corona detection, the corona wires wereconnected to earth via a 500-ohm resistor and the voltagegenerated across the resistor was used as the input tothe high frequency Techtronic TDS784D oscilloscope; an
Figure 5. Corona current versus potential applied to the wire electrode
6

SYMPOSIUM SERIES NO. 156 Hazards XXII # 2011 Crown Copyright
Table 4. Summary of ignition tests on hydrogen/air mixtures by corona discharges
Test
run
Hydrogen
conc’n
(% v/v) Electrode configuration
Max. potential
of corona
wire (kV)
Max.
corona
current
(mA)
Ignition
(Y/N) Comments
1 28.4 0.38 mm nichrome wire in centre of vessel 228 216.7 N
2 29.8 0.38 mm nichrome wire in centre of vessel 228 218.2 N
3 30.3 0.38 mm nichrome wire in centre of vessel þ28 þ14.0 N
4 32.2 0.38 mm nichrome wire in centre of vessel 228 218.5 N
5 32.2 0.38 mm nichrome wire in centre of vessel þ28 � þ13 N
6 25.5 0.38 mm nichrome wire in centre of vessel 228 216.2 N
7 28.4 0.38 mm nichrome wire in centre of vessel þ28 þ13.4 N
8 30.0 0.38 mm nichrome wire, earthed plate
30 mm away
228 �2290 N
9 30.0 0.38 mm nichrome wire, earthed plate
30 mm away
þ20 þ150 Y Ignition occurred as potential
increased just above
þ20 kV; electrometer
damaged by current surge
10 28.0 0.38 mm nichrome wire, earthed plate
30 mm away
228 �2290 N
11 28.0 0.38 mm nichrome wire, earthed plate
30 mm away
þ20 þ150 Y Ignition occurred as potential
increased just above
þ20 kV
image of the scope trace was saved to disc as required.The response of the oscilloscope to laboratory generatedcorona discharges was assessed before the trials toensure that the system was capable in principle of detectingsuch discharges and to establish a typical trace for suchan event.
A schematic of the experimental arrangement isshown at Figure 6.
437
RESULTSNo charges generated were sufficient to ignite hydrogen airmixtures in the experiments with dust dispersions of up to160 g of iron oxide or polypropylene in hydrogen releasesfrom 200 bar storage. However, there was some evidencethat corona discharges may have been generated at the wireelectrodes placed close to the dispersed hydrogen, althoughthis was only evident when powder was also dispersed.
Figure 6. Schematic of the experimental arrangement used for investigating corona discharges during high-pressure H2 releases

SYMPOSIUM SERIES NO. 156 Hazards XXII # 2011 Crown Copyright
Figure 7. Arrangement to investigate electrostatic field/discharges during hydrogen release
CONCLUSIONSFor the first phase of experimental programme, the follow-ing conclusions were made for diffusion ignition testsinvolving bursting discs and pipe work downstream of aboundary failure:
. No ignitions were observed below a cavity pressure of8.8 barg.
. Ignitions were always observed above a cavity pressureof 27.5 barg.
. Releases of H2 to atmosphere with no restrictive andreflective downstream geometry present resulted in noignitions up to a burst pressure of 831 bar.
. Tests which included reflective downstream geometryalways produced ignitions at disc burst pressuresabove 260 bar.
. The lowest burst pressure for ignition was 35.5 barwith a reflective geometry configuration and vent area
43
of 17.3 mm2 and soft ductile bursting discs were lesslikely to produce an ignition than a non-ductile disc.
. Whether ignition occurs appears to be related to the risetime of the pressure pulse produced by the disc failing.The rise time is related to the burst pressure and alsothe extent of downstream constriction after the burstingdisc.
. When H2 leaked into cavity before a burst, no ignitionsoccurred.
. No ignitions were observed when weakened pipes wereused for open geometry tests at pressures of up to 417bar.
In the second phase of the experimental programmethe following conclusions for tests involving corona dis-charges were attained:
. H2-air mixtures were ignited by corona dischargesgenerated by raising a fine wire to a high potential.
Figure 8. Arrangement to investigate electrostatic field/discharges during hydrogen release and dust dispersion
8
SYMPOSIUM SERIES NO. 156 Hazards XXII # 2011 Crown Copyright
. Ignitions occurred with positive corona discharges at acurrent of approximately þ150 mA and potential ofþ20 kV for a wire point and plate electrode systemwith a 30 mm separation.
. No ignition was observed with negative currents of up toapproximately –290 mA and potential of –28 kV.
. Dispersion of dusts up to 160 g with H2 released from200 barg did not appear to generate hazardous electricfields, in terms of incendive corona discharges.
. Ignition can be produced by corona discharges of thetype that might be produced where fine points may beat a potential of several tens of kV above the surround-ing atmosphere. Such situations could be expected at thetop of tall vent stacks, tens of metres above ground, inthe presence of large atmospheric electric fields (e.g.during snow fall). Such incendive corona dischargesappear to be unlikely in horizontal releases of H2 closeto ground level.
NOMENCLATURE
Vo ¼ corona onset potential (kV)r ¼ radius of curvature of the discharge point (cm)I ¼ corona current (A)
V ¼ applied potential (V)
439
REFERENCESAstbury, G. R., and S. J. Hawksworth, 2005, Spontaneous
ignition of hydrogen leaks: A review of postulated mechan-
isms: Proceedings of International Conference on Hydrogen
Safety.
Astbury, G. R., 2007. Venting of low pressure hydrogen gas –
A critique of the literature. Process safety and environmental
protection, 85, 289–304.
Bradburn, F., and D. McBrien, 1983, Discussion of
Hydrogen Vent Ignitions, Technical Visit report No.
TVR194.
Cross, J. “Electrostatics Priciples, Problems and Appli-
cations”,
Dryer, F. L., M. Chaos, Z. Zhao, J. N. Stein, J. Y. Alpert, and
C. J. Homer, 2007, Spontaneous Ignition of Pressurized
Releases of Hydrogen and Natural Gas into Air: Combustion
Science and Technology, v. 179, p. 663–694.
Golub, V. V., T. V. Bazhenova, M. V. Bragin, M. F.
Ivanov, and V. V. Volodin, 2006, Hydrogen Auto-Ignition
During Accidental or Technical Opening of High
Pressure Tank: Proceedings of the 6th International Sym-
posium on Hazards, Prevention and Mitigation of Industrial
Explosions.
Gummer, J., and S. H. Hawksworth, 2007, Spontaneous
Ignition of Hydrogen: Literature Review, Health and
Safety Laboratory.