self-propelled systems for versatile applications
TRANSCRIPT

The Pennsylvania State University
The Graduate School
Eberly College of Science
SELF-PROPELLED SYSTEMS FOR VERSATILE APPLICATIONS
A Dissertation in
Chemistry
by
Vinita Yadav
2015 Vinita Yadav
Submitted in Partial Fulfillment of the Requirements
for the Degree of
Doctor of Philosophy
May 2015

The dissertation of Vinita Yadav was reviewed and approved* by the following:
Ayusman Sen Distinguished Professor of Chemistry Dissertation Advisor Chair of Committee Thomas E. Mallouk Evan Pugh Professor of Chemistry, Physics, Biochemistry and Molecular Biology Associate Head of the Chemistry Department Associate Director, Penn State MRSEC Director, Center for Solar Nanomaterials
John Badding Professor of Chemistry Associate Head for Equity and Diversity Director of Graduate Recruiting
James H. Adair Professor of Materials Science and Engineering Biomedical Engineering and Pharmacology Barbara J. Garrison Head of the Chemistry Department Shapiro Professor of Chemistry
*Signatures are on file in the Graduate School

iii
ABSTRACT
A decade ago, the first examples of self-propelled motion at the nano and
microscale by synthetic objects were discovered. This was the first step towards the
design of autonomous nano and micro-machines and robots. Nature has been using
nanoscale motors and pumps to power its numerous creations and this has inspired the
scientific community to emulate such systems. The focus of this thesis is on colloidal
systems - both biological and inorganic, whose constituents move and respond to each
other and their surroundings through a specific mechanism: diffusiophoresis.
This thesis begins with an introduction on diffusiophoresis - the electrolyte and
non-electrolyte versions along with other competing or complementing propulsion
mechanism reported for colloidal systems.
The first system discussed in this thesis is an inorganic scheme that displays a
one of its kind ‘on/off’ switch that controls colloidal transport. Additional built-in levels of
regulation allow for both rectification and amplification of particle motion.
A biological system is discussed next that utilizes the phenomenon of electrolyte
diffusiophoresis to detect and repair cracks in bones. This represents one of the few
viable examples of utilizing nanomotors towards a medical treatment. Repair of
damaged tissues has also been expanded to curing dental ailments. Dental caries or
bacterial cavities can also be detected and cured using the same underlying mechanism.
This approach also offers the first explanation on why fluoride treatment works for
general dental well-being.
Restoration of biological cracks has also been expanded onto polymerized
surfaces. The mechanism involved varies from diffusiophoresis, in that it is density

iv
driven rather than being electric field driven. Complete repair of cracked surfaces is
observed in real time.
Diffusiophoretic motion is then applied to polymeric systems where a fluoride ion
triggered colloidal pump is designed. The pump is a versatile starting ground that is
expanded into designing a bacteria scavenging material as well as systems that show
first signs of memory.
This thesis concludes with perhaps the most exciting chapter that brings new
light to enzymatic cascades, the intricate systems that allow for the perpetuity of life on
earth. Earlier work done on enzyme substrate interactions is expanded to solve the
mechanistic mystery behind cascades that has eluded enzymologists and biologists for
long.

v
TABLE OF CONTENTS
List of Figures…………………………………………………………........………...…..viii
List of Tables……………………………………………………………………….…......xvi
List of Multimedia Files………………………………………………………….…...…...xvii
Acknowledgements…………………………………………………………...................xix
Chapter 1 Difusiophoresis- An Introduction ........................................................ 1
1.1 Reynolds Number and Brownian Motion ..................................................... 1 1.2 Role of Debye Length in Phoretic Transport .............................................. 4 1.3 Mechanisms of Motility ............................................................................... 6
1.3.1 Self-Electrophoresis .......................................................................... 7 1.3.2 Self-Diffusiophoresis ......................................................................... 11 1.3.3 Electrolyte Diffusiophoresis ............................................................... 11 1.3.4 Non-Electrolyte Self-Diffusiophoresis ................................................ 14 1.3.5 Self-Electrophoresis vs Electrolyte Self-Diffusiophoresis .................. 15 1.3.6 Enzyme motors ................................................................................. 16 1.3.7 Chemotaxis ....................................................................................... 17 1.3.8 Enzyme Pumps ................................................................................. 20
1.4 Other Mechanisms...................................................................................... 22 1.4.1 Bubble Propulsion ............................................................................. 22 1.4.2 Magnetically-driven Motors ............................................................... 24 1.4.3 Acoustically-powered Motors ............................................................ 27
1.5 Conclusion .................................................................................................. 29 1.6 References ................................................................................................. 30
Chapter 2 Triggered “On/Off” Micro-Pumps and Colloidal Photo-Diode ........... 36
2.1. Introduction ................................................................................................ 36 2.2 Design of Smart Micro-Pumps .................................................................... 36 2.3 Propulsion Mechanism ............................................................................... 37 2.4 Switchable Photoacid Pump ....................................................................... 39
2.4.1 Experimental Set-Up ......................................................................... 39 2.4.2 ‘On/Off’ Pump in Action ..................................................................... 39 2.4.3 Separation of Diffusiophoretic and Electroosmotic Motion ................ 42 2.4.4 Self- Assembled Patterns ................................................................. 44
2.5 pH Controlled Polymer Pump ..................................................................... 46 2.6. Photo-Colloidal Diode ................................................................................ 50
2.6.1 Experimental Set-Up ......................................................................... 51 2.6.2 Spatial and Temporal Regulation of Colloidal Transport ................... 52
2.7 Conclusion .................................................................................................. 54 2.8 Acknowledgement ...................................................................................... 54 2.9 References ................................................................................................. 55

vi
Chapter 3 Bone-Crack Detection, Targeting and Repair Using Ion Gradients .. 57
3.1. Introduction ................................................................................................ 57 3.2 Motivation ................................................................................................... 57 3.3 Generation of Local Electric Fields ............................................................. 58 3.4 Experimental Design ................................................................................... 61 3.5 Diffusiophoresis led Damage Detection ...................................................... 62 3.6 Disfussiophoresis Guided Targeted Protein delivery ................................... 66
3.6.1 Fluorescence Microscopy analysis .................................................... 66 3.6.2 Raman Spectroscopy Analysis ......................................................... 66
3.7 Targeted Drug Delivery ............................................................................... 69 3.7.1 Synthesis of Alendronate Nanoparticle ............................................. 69 3.7.2 Drug load Calculation........................................................................ 69 3.7.3 Particle Characterization ................................................................... 70 3.7.4 Drug Delivery and Cell Proliferation Assay ........................................ 72
3.8 Expansion of the detection and repair technique ........................................ 75 3.8.1 Present therapeutic techniques ......................................................... 75 3.8.2 Detection using FDA approved diagnostic dye .................................. 77 3.8.3 Mechanism of Fluoride treatment ...................................................... 79
3.9 Application on Synthetic Surfaces- Polymer Repair .................................... 81 3.9.1. Motivation ........................................................................................ 81
3.9.2 Density Driven Flows ........................................................................ 82 3.9.3 Synthesis of repair agents ................................................................ 83 3.9.4 Polymer Repair ................................................................................. 83 3.9.5 Enzymatic repair ............................................................................... 85
3.10. Conclusion ............................................................................................... 89 3.11. Acknowledgements .................................................................................. 89 3.12 References ............................................................................................... 90
Chapter 4 A Self-Powered Polymeric Material that Responds Autonomously and Continuously to Fleeting Stimuli ............................................................ 94
4.1 Introduction ................................................................................................. 94 4.2. Experimental Design .................................................................................. 94 4.3. Results and Discussion ............................................................................. 97
4.3.1 Colorimetric Analysis ........................................................................ 99 4.3.2. Stimuli Responsive Pumping Behaviour........................................... 101 4.3.3 Memory based Pumping in the Absence of Stimuli ........................... 103
4.4 Difusiophoretic Pumping- Scavenger Design .............................................. 107 4.5 Conclusion .................................................................................................. 110 4.6 Acknowledgements..................................................................................... 111 4.7 References ................................................................................................. 112
Chapter 5 Substrate-driven Chemotatic Assembly in Enzyme Cascades ......... 114
5.1 Introduction ................................................................................................. 114 5.2 Motivation ................................................................................................... 115 5.3 Experimental Design ................................................................................... 115
5.3.1 Microfluidic device fabrication ........................................................... 117

vii
5.3.2 Fluorescent tagging of HK and Ald.................................................... 118 5.3.3 Fluorescence Correlation Spectroscopy............................................ 120 5.3.4 Statistical Significance Analysis of FCS data .................................... 123 5.3.5 Confocal Microscope Imaging ........................................................... 123 5.3.6. Detailed Investigation into Hexokinase Chemotaxis Behavior .......... 124 5.3.7 Substrate Triggered Chemotaxis ...................................................... 124 5.3.8 Binding Affinity VS Turnover Rate ..................................................... 127 5.3.9 Enzyme activity assays ..................................................................... 127 5.3.9 Investigation into Aldolase Chemotaxis ............................................. 128 5.3.10 Why Chemotaxis? Enhanced Diffusion Model ................................. 128 5.3.11 Inadequacy of the Diffusion Model to Explain Chemotaxis .............. 129
5.4. Enzyme Cascade Investigation ................................................................. 133 5.4.1 Cascade In-situ ................................................................................. 136 5.4.1.1 Progress Curve Simulation ............................................................ 136 5.4.2 Competitive Substrates ..................................................................... 139
5.5. Chemotaxis and Metabolons ..................................................................... 139 5.5.1. Chemotaxis in Cytosolic Conditions ................................................. 142
5.6 Conclusion .................................................................................................. 143 5.7 Acknowledgements .................................................................................... 143 5.8 References ................................................................................................. 144
Chapter 6 Bringing discipline into enzyme motors ............................................. 145
6.1. Introduction ................................................................................................ 145 6.2 Motivation ................................................................................................... 145 6.3. Experimental Design .................................................................................. 146
6.3.1 Test Subject 1: Catalase ................................................................... 147 6.3.2 Test Subject: Urease ........................................................................ 149
6.4 Results and Discussion .............................................................................. 155 6.5 Conclusions ................................................................................................ 156 6.6 References ................................................................................................. 158
Chapter 7 Conclusions.......................................................................................... 159

viii
LIST OF FIGURES
Figure 1-1. The electric double layer of a charged particle in a polar solution. The counter ions from the solution come near the charged particle surface to neutralize the charge and this fluid layer remains diffused around the particle. The ζ-potential is the electric potential at the shear plane or outer edge of the Stern layer. A non-spherical charged surface behaves the same way.............................................................................................……5
Figure 1-2. Propulsion of bimetallic Au-Pt rods in hydrogen peroxide solution powered
by self-electrophoresis. Catalytic redox reaction on the two metallic ends generates the local electric field…………………………………...........…….8
Figure 1-3. An immobilized bimetallic surface can generate fluid flow in its vicinity by
the generating a local electric field in the same manner as a bimetallic motor. The schematic describes electrochemical conversion of hydrogen peroxide on the two metallic surfaces- gold and silver, the generated electric field and the directional motion imparted to positively charged carboxyl functionalized polystyrene (carboxy-PS) and negatively charged amidine functionalized polystyrene (amidine-PS) particles…………..…...10
Figure 1-4. Schematic depiction of diffusiophoretic motion. The difference in diffusivity
of the ions generated from the source causes a local electric field. The double layer around the particles as well as the wall responds to the thus formed electric field leading to electrophoretic and electroosmotic motion respectively. In the example in the Figure above, the anion diffuses faster than the cation generating an electric field from right to left. The electrophoretic motion of a negatively charged particle is from left to right. Correspondingly, the electroosmotic flow along the negatively charged wall is from right to left. The concentration gradient also leads to thickness gradient of double layers on the surfaces of the particle and wall, and in-turn a pressure difference that propels particles from left to right.......…..13
Figure 1-5. Collective behavior demonstrated by synthetic motors. Au-Pt bimetallic
nanomotors chemotax towards the source of hydrogen peroxide fuel (the gel in the upper left side), as depicted by an increase in the number of rods over time………………….……………………………………………..………18
Figure 1-6.Schematic depiction of fabrication and functioning of enzymatic
micropumps. (a) Au patterned on a PEG-coated glass surface is functionalized with a quaternary ammonium thiol, which electrostatically binds to the negatively charged groups on the enzyme. Triggered fluid pumping is initiated by introducing enzyme specific substrate. (b) Cascading fluid pumping is observed when enzyme catalase is actuated by production of its substrate in situ by enzyme glucose oxidase and its substrate glucose enabling microfluidic regulation and logic…...…………21

ix
Figure 1-7. Bubble propulsion mechanism. Oxygen microbubbles are generated through decomposition of hydrogen peroxide. As the bubbles detach from the motors, the associated recoil force pushes motors in the opposite direction………………………………………………….………………...……23
Figure 1-8. Magnetic manipulation of cage-like micromotors for transportation of cells.
(a) SEM image of a hexahedral microrobot after cell culture and (b) an enlarged SEM image. Confocal microscope images of the (c) hexahedral and (d) cylindrical microrobots after staining of the cells…………………..26
Figure 1-9. Acoustic powered self-propelled motors. (a) Propagation and assembly of
bimetallic rods under acoustic fields. (b) Navigation of an acoustically-powered motor towards a HeLa cell under magnetic field-guidance…….28
Figure 2-1. A schematic depiction of PAG pumping mechanism. The negative surface
charge of the glass creates a positive double layer, which in response to the generated ions causes an inward electroosmotic flow. The negatively charged tracers (S-PS particles) move opposite to the direction of the electric field, competing against the electroosmotic flow while the positively charged tracers (NH2-PS particles) move along the electric field direction aided by the electroosmotic flow……………………………………………..38
Figure 2-2. Optical microscope images of particle motion. (a) and (b) show the
distribution of the positively charged tracers (NH2-PS) around the photoacid (PAG-1) microcrystallites with UV off (control) and after 1 min of UV illumination respectively. (c) and (d) display the same for the negatively charged tracers (S-PS). Each of the tracer particles seen is 2 µm. (Also see Supporting Video 2-1 and 2-2)…………….……..…….….41
Figure 2-3. Velocity distribution histograms obtained for (a) NH2-PS particles and (b)
S-PS particles using the PAG pump……………………………………...….43 Figure 2-4. Patterns induced by PAG pumping. (a) Control image, NH2-PS particle
distribution around a single photoacid crystallite with UV off. (b) Self-assembled NH2-PS particle pattern with UV on. Each of the tracer particles seen is 2 µm……………………………………………………………….……44
Figure 2-5. A schematic depiction of the pattern. The pump pulls the NH2-PS particles
out from the large reservoirs (10 x 10 mm2) into the micro-channels (4 x 1 mm2), towards the PAG chambers (1 x 1 mm2) on either side of the channel...………………………………………………………………………..45
Figure 2-6. Schematic depiction of PFA-S pumping mechanism. The local electric field
points outwards away from the polymer film and the negatively charged tracers COOH-PS particles move inwards, towards film………..…………46
Figure 2-7. Optical microscope images of PFA-S film pumping away HOOC-PS tracers
(6 µm). (a) Image taken 0 s after exposure to 1 M HCl in deionized water at 25 °C, and (b) 1200 s after exposure. ……………………………………47

x
Figure 2-8. Velocity distribution histograms of HOOC-PS tracers as a function of the
acid concentration for the PFA-S pump……………………………………..48 Figure 2-9. Velocity distribution histograms of HOOC-PS tracers at 100 to 1100 µm
away from the PFA-S pump upon addition of 1 M HCl to the PFA-S film at 25 °C, demonstrating long range pumping……………...…………………..49
Figure 2-10. Schematic depiction of source (PAG)-drain (PFA-S) based colloidal photo-
diode indicating both the rectification and the direction of movement of S-PS particles…………………………………………………………….……….50
Figure 2-11.Spatial and temporal regulation of velocity (S-PS particles) attained using
the source-drain photo-diode. Distance is measured from edge of the PAG and time is measured from when the UV is turned on. For velocity vs time plot, distance = 150 µm; for velocity vs distance, time = 20 s…………….53
Figure 3-1. Schematic depiction of ion gradient-induced electric field and the resultant
particle migration. The length of the arrows next to the ions represent their relative mobilities. The generated electric field points outwards away from the crack. Accordingly, the negatively charged particles move towards and positively charged particles move away from the crack……………..…….60
Figure 3-2. Increasing quantum dot intensity within the crack on bone surface (a) and
PDMS surface (b) demonstrating an effective damage detection scheme. Scale bar is 60 µm. Right panel shows calculated intensities inside the damage (averaged over entire damaged area) for HOOC Q-Dots, amine Q-Dots and control, using Image J software, for bone surface (c) and PDMS surface (d)………………………………………………………………63
Figure 3-3. Analysis of the crack detection scheme using confocal microscopy.
Intensity study within the crack on bone surface (a) and PDMS surface (b) using amine functionalized quantum dots. Control images showing no intensity change on bone (c) & PDMS (d). Scale bar is 130 µm……...….65
Figure 3-4. (a) Raman spectra obtained on the bone and enzyme separately, overlaid
with one collected on the bone exposed to the enzyme. (b) Raman spectra at increasing distances from the crack depicting the preferential enzyme migration towards the crack…………………………………………………..68
Figure 3-5. Electron microscopy analysis of drug loaded particles: SEM images of
PLGA nanoparticles coated with Au/Pd sputter coating for visualization...............................................................................................71
Figure 3-6. Increasing fluorescence intensity within the crack indicates active migration
of Nile-red tagged drug loaded PLGA particles to the crack site demonstrating an effective drug delivery protocol. Scale bar is 100 µm..............................................................................................................72

xi
Figure 3-7. Proliferation of MG-63 cells treated with PLGA nanoparticles containing 10-
6, 10-8 and 10-10 M alendronate for 48 hours, expressed as percentage optical density relative to the negative control of 100%, using a colorimetric MTS cell proliferation assay. (Graph expressed as Mean ± SD; Significance (*P < 0.05) compared with negative control group (medium alone))…………………………………………….……………………………..74
Figure 3-8.Damage detection in cracked teeth. Negatively charged amine
functionalized quantum dots move in towards the crack leading to an increase in fluorescence intensity (a) while positively charged carboxyl functionalized quantum dots move away from the crack leading to decrease in fluorescence intensity (c). Images (b) & (d) are the bright field images of the tested crack……………………………….……………………76
Figure 3-9. (a) Increasing fluorescein intensity within the dental crack in a tooth slice
leads to detection. (b) Fluorescence intensity analysed inside the damage (averaged over entire damaged area) through Image J……………...……77
Figure 3-10. Damage detection on a whole tooth using fluorescein dye………..….…..78 Figure 3-11.EDS measurements at increasing distances from the crack, show a
decreasing fluoride signal……………………………………………….…….79 Figure 3-12. EDS maps generated at the crack site show a heavy deposition of sodium
and fluoride at the crack site. The presence of the crack can be noted by the scarcity of calcium, phosphate and oxygen at the same site, the primary components of hydroxyapatite Scale bar is 400 µm………….….80
Figure 3-13.ESEM images of polymer deposition at the damage site. The strategy
works well for both single (a, b) and multiple cracks (c, d). (a, c) The image of cut polymer with no salt after 1 hr. exposure to emulsions. (b, d) PDMS/CaCl2 in inverted setup after 1 hr. exposure to emulsions…….….84
Figure 3-14.Schematic of a surface healing system using a salt/PDMS film. The urease
enzymes (blue) and urea molecules (grey) move over the crack due to density driven flows. While this occurs, the urea is converted by the urease to carbonate ions (pH~10.3). The carbonate ions then react with the leaching calcium ions forming solid calcium carbonate…………………...85
Figure 3-15. (a) ESEM images showing the control (left) and sample (right) where the
crack was exposed to the urease-urea mixture without and with the underlying calcium chloride layer, respectively. Scale bar is 100µm. (b) XRD Analysis of the crack site confirming the presence of calcite (red bars-standard) and aragonite (blue bars-standard). The amorphous halo at lower two-theta values is due to PDMS……………………………………...87
Figure 3-16.(a)SEM image of the precipitated material within the crack showing
aragonite and calcite like morphology. Scale bar is 20 µm. (b) Carbonate vibration bands61 around 1460 (symmetric stretching) and 880 (out-of-

xii
plane bending) cm-1 confirms the presence of the precipitated calcium carbonate……………………………………………………….….……………88
Figure 4-1. Schematic depiction of polymer microsphere pump that induces the
movement of fluid that surrounds the pump in response to a specific stimulus, even after the stimulus has been removed. The blue arrows represent the direction of fluid movement, and the sizes of the arrows illustrate an approximation of the relative magnitude of fluid flow when the signal is present or absent. When the UV light is off, a self-propagating reaction enables the microsphere to continue generating a concentration gradient of products that drive the pumping response. The signal transduction reagents (fluoride ion) translate the first reaction with UV light to initiation of the self-propagating reaction. The byproduct of the reactions (3) is yellow/orange in color and, thus, turns the microsphere from colorless to yellow to orange over the course of the pumping response………………………………………………………………………...96
Figure 4-2. Structures and reactions of reagents 1 and 2 that are grafted onto a 300
µm-diameter TentaGel microsphere. (a) A microsphere that contains a 1:1 ratio of reagents 1 and 2. (b) Exposure of this microsphere to UV light causes the activity-based detection reagent (1) to release fluoride, compound 3, and protons (exist as pyridinium ions). (c) The released fluoride then reacts with 2 to initiate a self-propagating reaction that amplifies fluoride, 3, and protons (exist as pyridinium ions). The gradient of these small molecules causes fluid movement around the microsphere (i.e., pumping). The notation “n” refers to the number of cycles of the autoinductive reaction in (c)……………………………………….………....98
Figure 4-3. Colorimetric response of a TentaGel microsphere that contained 100% of
2. (a) The procedure for testing the autoinductive, self-propagating reaction that is mediated by 2. The product of the autoinductive reaction is 3 (Figure 4-2c), which turns the microspheres a yellow/orange color (b). (c) This color reflects the extent of the autoinductive reaction,15,19 and can be quantified by photographing the microspheres and using image processing software to measure the intensity of color. Exposure of the microspheres to substoichiometric quantities of fluoride (relative to the loading level of the microspheres) reveals sigmoidal kinetics characteristic of autoinductive reactions.15,19 Note that the scale of the x-axis changes after the break………………………………………….……………………..100
Figure 4-4. Average pumping speeds caused by TentaGel microspheres exposed to
365 nm light. (a) The pumping action can be switched on and off for a microsphere functionalized with 1 only (blue data), whereas no pumping was observed for microspheres functionalized with only 2 (orange data). In contrast, the pumping speed could be varied (but not turned off) for microspheres functionalized with both 1 and 2 by turning on and off the UV light (black data). The pumping speeds reflect the averages of measurements acquired over 30 s intervals that span the length of the data bars. (b) Continuous pumping also is possible using microspheres

xiii
that are functionalized with 1 and 2 once the microspheres are exposed to UV light for 20 min. For both (a) and (b), the average pumping speeds were obtained by tracking the distance that 30 tracer beads traveled over time………………………………………………………..……………………102
Figure 4-5. Optical microscope images of the microsphere functionalized with reagent
1 alone, triggered with UV light that induces motion to the surrounding (a) negatively charged polystyrene particles at 5X magnification. A zone of exclusion can clearly be seen around the microsphere where tracer particles have been pushed away. (b) Positively charged particles were pulled in towards the microsphere, eventually getting trapped inside at 20X magnification. The imaged polystyrene particles are each 2 µm in diameter………………………………………………….…………………….108
Figure 4-6. (a) Electron microscope images of the polystyrene particles trapped within
the microsphere. (b) Shows a zoomed in image of the chipped part confirming the particles to be trapped inside the permeable body and not just on the surface of the microsphere. The scale bar is 50 µm.………109
Figure 5-1.The glycolysis cycle.7 The first four enzymes, hexokinase (HK),
phosphogluco isomerase (Iso), phosphofructokinase (PFK) and aldolase (Ald) were examined for their ability to undergo chemotactic assembly..................................................................................................117
Figure 5-2. Photo-lithographically fabricated flow based microfluidic gradient generator
for studying enzyme chemotaxis. The length of the channels is either 20 or 40 mm, width 360 μm, and the height is 100 μm. Considering laminar flow, the width of each channel is 120 µm. Fluorescence intensities were analyzed along a vertical line as shown in the figure leaving off 20 µm next to the sidewalls……………………………………….……………….………118
Figure 5-3. Fluorescence correlation spectroscopy (FCS) results showing an enhanced
diffusion coefficient for Ald (a) and HK (b) in the presence of their respective substrates…………………………….…………………….…….123
Figure 5-4.Chemotactic response observed for hexokinase (HK). HK shows
chemotactic shift only in presence of a gradient of its substrate, D-glucose (D-Glu) and is unaffected by the presence of L-glucose (L-Glu). Also, hexokinase shows a greater chemotactic shift towards its substrate of choice D-glucose (D-Glu) compared to mannose (Mann) which it phosphorylates at a significantly lower rate. Experimental conditions: Starting enzyme concentration = 200 nM (100%) Flow rate = 200µl/h, distance = 30 mm, interaction time = 6.48 s; Percentage of enzyme migration into the left D-glucose channel is 4.59 ± 0.4 % and towards the right D-glucose channel is 4.54 ± 0.3 %. Percentage of enzyme migration into mannose channel is 2.85 ± 0.5 %. Inset on the top and bottom shows a clearer migration towards preferred channels. Note that the percent enzyme migration into adjoining buffer channels due Brownian diffusion alone is ~ 2%...........................................................................................127

xiv
Figure 5-5. Substrate-induced enzyme focusing. The normal diffusional spreading of HK (1 µM) towards the flanking channels that contain buffer is reduced if the composition in the middle channel is switched from HK in buffer to HK in 70 mM D-glucose. The net reduction in area is 13.4 ± 3.0%. Experimental conditions: Flow rate = 100µl/h, distance = 18 mm, interaction time = 7.78 s………………………………………….………….131
Figure 5-6. Cofactor-induced enzyme focusing. The enzyme (1 µM) switches from an
equilibrium distribution to a non-equilibrium one when cofactors ATP (50 mM) and MgCl2 (100 mM) are introduced in the middle channel. This is analogous to reported cellular responses in the cytosol where enzyme association is regulated by oxygenation and phosphorylation requirements. Experimental conditions: Flow rate = 30µl/h, distance = 19 mm, interaction time = 24.7 s…………………………………………………………………..132
Figure 5-7. Restricted chemotaxis in the absence of substrate gradient. The normal
diffusional spreading of HK (200 nM) towards the flanking substrate channels is reduced if the substrate is also introduced within the middle channel flowing the enzyme. Experimental conditions: Flow rate = 100µl/h, distance = 20 mm, interaction time = 8.64 s………………………….……133
Figure 5-8. (a) Experimental set-up to study the chemotactic response of Ald (green
channel) towards the channel that generates its substrate in situ. (b) Fluorescence intensity measured across the channels plotted against the width of the channels. The dotted lines represent the approximate center channel boundaries. When compared to Ald’s movement towards buffer, the enzyme shows enhanced migration into the channel that generates its substrate in situ. (c) Experimental set up that allows the entire enzymatic reaction cascade to occur in-situ. Substrate (D-glucose) for enzyme 1, HK (red channel), was provided in the middle channel to trigger the cascade. (d) Ald (green bars) shows time-delayed chemotactic response compared to HK (red bars) as expected based on the sequence of reactions. When mannose was introduced along with D-glucose, HK shows reduced chemotaxis (orange bars) corresponding to slower rate of mannose phosphorylation……………………………………….………………………135
Figure 5-9. (a) While Ald chemotaxes towards its substrate gradient (Figure 5-7b), HK
flowing along with its substrate in its own channel, shows no movement into the adjacent channel. (b) Control experiments performed for studying the chemotactic response of Ald towards its substrate precursors. Ald shows no movement towards the channel flowing the recipe for its substrate when any one of the ingredients is missing……………………136
Figure 5-10. The simulated substrate and product progress curves through the first four
enzymes in the glycolytic cascade, assuming steady state concentrations.........................................................................................139

xv
Figure 5-11. Linear relationships between fluorescence intensity (arbitrary units) and concentration for both HK and Ald. This enables directly correlating fluorescence intensity to the concentration of enzyme………..…………141
Figure 5-12. D-glucose gradient-driven sequential movement of HK and Ald for the
entire enzymatic reaction cascade was observed even in Ficoll PM 70 (20% w/v) induced crowded environment mimicking cytosolic crowding conditions in cell. Ald (red bars) shows a time delayed chemotactic migration towards substrate channel compared to HK (blue bars) corresponding to the cascade reaction sequence……………...…………143
Figure 6-1. Photo- lithographically fabricated flow based microfluidic gradient generator
for studying enzyme chemotaxis. The length of the horizontal channels is 20 mm, width 360 μm and height is 100 μm……………………………….147
Figure 6-2. Shift in fluorescence intensity observed for catalase. The enzyme diffuses
away from the inhibitor (NaCN) and towards the substrate (H2O2) (Note the blue graph’s shift towards left when compared to the control (red))….…149
Figure 6-3. No shift in fluorescence intensity observed for Urease. Pyrochatechol is
unable to completely inhibit urease within the 4.32 s in the microfluidic channel, due to the slow inhibition rate. As a result, no shift is observed……………………………………………………………………….151
Figure 6-4. Diffusion based microfluidic gradient generation device designed using
Adobe illustrator, printed on acrylic surface using a CO2 laser printer and then cast on PDMS using soft lithography………………….…….………..152
Figure 6-5. Normalized fluorescence intensity measured across the substrate and
substrate + inhibitor channels in the microfluidic device. A) The fluorescence intensity within substrate (urea) and the S+I (urea + catechol) channel. The enzyme diffuses much faster and further into the substrate channel compared to the S+I channel. In case of S+I channel most of the enzyme concentration (fluorescence maxima) stays close to the starting position. B) Control experiment performed contained the substrate urea in both reservoirs and the fluorescence intensity indicates similar enzyme diffusion in both channels……………………………………………………154
Figure 6-6. Normalized fluorescence intensity measured across the substrate and
substrate + inhibitor channels in the microfluidic device over 5 hours. The fluorescence intensity within the (a) substrate (urea) and (b) the S+I (urea + catechol) channel. The enzyme diffuses much faster and further into the substrate channel compared to the S+I channel. In case of S+I channel most of the enzyme concentration (fluorescence maxima) stays close to the starting position…………………………………………….…………….155
Figure 6-7. Normalized fluorescence intensity measured in the buffer channel over
time. Only Brownian diffusion is observed…………………….…….……..157

xvi
LIST OF TABLES
Table 4-1. Average pumping speeds caused by TentaGel microspheres exposed to a on and off cycle of 365 nm light. Speeds correspond to the data represented in Figure 4-4a…………………..……………………………...…………...………105
Table 4-2. Average tracer particle speeeds caused by TentaGel microspheres exposed 20 min of continous UV exposure. Speeds correspond to the data represented in Figure 4-4b………………………………..……………………106
Table 5-1. Distance from the start of the channel converted into time spent inside the channel for specified channel geometry.................................................119
Table 5-2. Concentration of enzyme (HK or Ald) migrated into the central channel (containing either buffer only or 10 mM D-glucose + buffer) at specified time periods (see Figure 5-7c). The starting concentration of both enzymes was 200 nM……………………………………………………..……………………..142
xvii
LIST OF MULTIMEDIA FILES
Supporting Video 2-1. PAG pumping using amine functionalized tracer particles with UV on and off at 50X magnification……………………………….…..41
Supporting Video 2-2. PAG pumping using COOH functionalized tracer particles with UV
on and off at 50X magnification……………………………………41
Supporting Video 2-3. PAG pumping resulting in self-assembled patterns using amine functionalized tracer particles with UV on and off at 50X magnification………………………………….……………………. 44
Supporting Video 2-4. PAG pumping causing colloidal transport through micro-channels using amine functionalized tracer particles. Video captured at 5X magnification with the UV turned on-off-on. Video speeded 5 times using Virtualdub software……………………………….…..45
Supporting Video 2-5. PFA-S pumping using COOH functionalized tracer particles at pH 1 at 5X magnification. Video speeded 25 times using Virtualdub software…………………………………………………….………..46
Supporting Video 2-6. PFA-S control using COOH functionalized tracer particles at pH 7 at 5X magnification. Video speeded 25 times using Virtualdub software……………………………………………...……………….46
Supporting Video 2-7. PAG and PFA-S photo-diode’s colloidal transport using sulfate functionalized tracer particles with UV on at 5X magnification; Video captured in between the PAG and PFA-S films, showing both films along with transport direction. Video speeded 5 times using Virtualdub software……………………..……………………52
Supporting Video 4-1. 2 µm-diameter amine-functionalized polystyrene tracer particles showing directional fluid pumping when exposed to UV; moving in towards the bead functionalized with 100% reagent 1. The motion ceases as UV is turned off; 50X magnification………103
Supporting Video 4-2. 2 µm-diameter amine-functionalized polystyrene tracer particles showing only Brownian motion when exposed to UV in the presence of the bead functionalized with 100% reagent 2; 5X magnification……………………………………………………….103
Supporting Video 4-3. Microspheres functionalized with 50% each of reagent 1 and 2 initiate directional fluid pumping upon UV exposure. The pumping continues even when the UV is turned off; 50X magnification…………………………………………………….…104
Supporting Video 4-4. Continuous pumping using microspheres functionalized with 50% each of reagent 1 and 2; 50X magnification. Video captured from all sides of the bead………………………………….……………104

xviii
Supporting Video 4-5. Diffuiophoretic pumping using microsphere functionalized with 100% reagent 1 in aqueous solution. Amine functionalized polystyrene tracer particles with UV on at 50X magnification are seen to move towards and even inside the bead…………..…107
Supporting Video 4-6. Diffuiophoretic pumping using microsphere functionalized with 100% reagent 1 in aqueous solution. Sulfate functionalized polystyrene tracer particles with UV on at 50X magnification are seen to move away from the bead creating exclusion zones……………………………………………………….……….107

xix
ACKNOWLEDGEMENTS
First and foremost, I would like to thank my advisor Professor Ayusman Sen for
his constant guidance and support throughout my Ph.D. His willingness to devote his
time to hear out all my crazy ideas, his valuable suggestions every time I was stuck in a
project have certainly helped me bring my projects to completion. His lucid approach to
routine glitches and witty responses to any problem, big or small, have helped to always
keep the mood light and support a productive work environment. Besides technical
guidance, I have also learnt some efficient life lessons on dealing with both difficult
situations and difficult people in a light and positive manner. I would also like to thank
both him and Mrs. Sen for hosting the wonderful Christmas parties and delightful dinner
conversations.
I would also like to thank Professor Tom Mallouk for his approachable nature, his
inclination to attend to, and solve problems and sharing his curious ideas on enzyme
chemotaxis. Many thanks to Professor Adair for laying the early foundations of colloidal
chemistry during my graduate career and Professor Badding for providing his
constructive feedback on topics outside my area of expertise. A big thank you to my
funding source MRSEC for providing me the resources to have some fun both inside and
outside the lab!
I would like to thank my parents Lata and Suraj Yadav and my friend, husband
and confidante Rahul Thakar for their constant support and encouragement. I truly could
not have made it without them. Their belief in me and their constant motivation have
made me a better professional and a better person. The innumerable sessions of
scientific discussions with Rahul and scientific explanations to my parents have
undoubtedly made me a better speaker and presenter. I would also acknowledge my

xx
adorable little nephews Rudra and Yuvraj, Skype sessions with them have been great
stress busters!
I thank each of my lab mates, coworkers and collaborators for everything I learnt
from them and for keeping everyday interesting, specifically Ryan Pavlick for showing
me how things are done and Samudra Sengupta for being the comic relief, Wentao
Duan for being my problem solver, Hua Zhang for his interpretation of Bollywood, Matt
Baker for showing me there is always another side, Scott Biltek for the frequent
experimental abuses and Weiran Yang for the early Chinese lessons. I would also thank
Xi Zhao for letting me explore my mentoring and sometimes managerial skills,
continuous Chinese, Japanese and Korean lessons but more importantly for the
relentless laugh riots. A big thank you also goes out to the Penn state gym; an
irreplaceable part of my everyday graduate life survival. Outside of my lab, I would also
like to thank all my friends & family- M.L. Thakur, Vipin, Trupti, Mansi, Sriram, Kar,
Trivedy, Manasi, Naomi, Ravish and Gaurika, for keeping the summers active and the
winters warm but mostly for making the last four years memorable.

xxi
Dedicated to Mum; to me she’s perfection..... …..And to Rahul; my anchor, my rock

1
Chapter 1
Difusiophoresis- An Introduction
“Science is not only a disciple of reason but, also, one of romance and passion" - Stephen Hawking
Nano and microscale propulsion is ubiquitous in nature.1-4 Unicellular organisms
like bacteria are not only motile but can also sense food and toxin gradients, then
interact and communicate amongst themselves and respond accordingly.2 The ability to
sense one’s environment, advance towards food and away from toxins, and to
communicate is as vital to a bacterium’s survival as to a blue whale. However, as one
goes down the length scale, the applicable laws of physics change.5 As the radius of an
object scales down, the decrease in volume is greater than the decrease in surface area.
This implies volume dependent forces like inertia, which dominate higher up the scale,
lose relevance as we scale down. Instead, it is the surface forces that need to be
channeled in order to induce motion.6 This thesis focuses on motion at the nano and
micro-scale, the physics that governs this motion and the myriad feasible applications.
1.1 Reynolds Number and Brownian Motion
Reynold’s number (Re) refers to a dimensionless quantity often invoked when
performing scaling of fluid dynamics problems. It is defined as the ratio of the inertial and
viscous forces and helps to characterize fluid patterns under different fluid conditions:
𝑅𝑅𝑅𝑅 = 𝜌𝜌𝜌𝜌𝜌𝜌 ⁄ 𝜂𝜂 (1.1)

2
where ρ is the density of the fluid, V is the mean velocity relative to the fluid, 𝜌𝜌 is the
characteristic linear dimension or the travelled length of the fluid and η is the dynamic
viscosity of the fluid. Laminar flows occur at low Reynolds numbers, where viscous
forces are dominant, and are characterized by smooth, constant fluid motion while
turbulent flows occur at high Reynolds numbers and are dominated by inertial forces.
This principle is often used in designing microfluidic devices. It also helps to determine
which of the two forces - inertial or viscous would dominate. Bacteria and other
unicellular organisms are the finest examples of low Reynolds number swimmers (Re =
10-4). For comparison, an average sized human being has a Reynolds’s number of 104.
Inducing motion at low Reynolds number also requires introducing asymmetry in the
object to evade reciprocal motion, in accordance with the scallop theorem.7
Low Reynolds number represents the first challenge to nano and microscale
motion. However, it is not the only one. We know from classical statistical mechanics
that every molecule moves randomly in all three dimensions with an average kinetic
energy of KT/2; K being the Boltzmann constant and T the absolute temperature.
Therefore, micro-scale objects are subject to the rapid thermal “bumping” by solvent
molecules, and are driven into motion when collisions are uneven. This effect creates
what is known as Brownian diffusion where the objects diffuse and wander around in a
solution resulting in translational Brownian diffusion. Thermal “bumping” also causes an
object to rotate and randomly change orientation, known as rotational Brownian
diffusion. In contrast, active diffusion involves directed motion and requires an input of
energy.
Translational particle diffusion caused due to Brownian motion can be calculated
using Equation 1.2,

3
𝐷𝐷𝑡𝑡 = 𝑘𝑘𝑘𝑘 ⁄ 6𝛱𝛱𝜂𝜂𝛱𝛱 (1.2)
while the rotational particle diffusion is given by Equation 1.3
𝐷𝐷𝑟𝑟 = 𝑘𝑘𝑘𝑘 ⁄ (8𝛱𝛱𝜂𝜂𝛱𝛱3 ) (1.3)
where 𝐷𝐷𝑡𝑡 is the translational diffusion coefficient and 𝐷𝐷𝑟𝑟 is the rotational diffusion
coefficient of the particle, k is the Boltzmann constant, T is the absolute temperature, η is
the viscosity of fluid through which the particle moves and 𝛱𝛱 is the radius of such a
particle.
To examine the nature of particle motion, mean-squared-displacement (MSD)
over different time intervals (τ) is calculated by analyzing the trajectories of particles. For
several idealized types of motions, the MSD has been shown to increase as a function of
τ raised to some power, α. 8
MSD = Kτ α (1.4)
K is a constant whose value depends on the diffusion coefficient of the particle. For
particles undergoing a purely diffusive, two-dimensional random Brownian walk, K
equals four times the diffusion coefficient of the particles, and MSD increases linearly
with τ (i.e., α = 1).9 Since “normal” Brownian diffusion is by far the most commonly
observed motion, systems in which α does not equal 1 are often deemed as having
“anomalous” diffusive behavior. Values greater than 1 correspond to “superdiffusive”
systems, and values less than 1 correspond to “subdiffusive” systems.10, 11, 12 For
example, for the Brownian motion of an inert colloid suspended in a solvent, during a
given time interval τ, the MSD of the particle does indeed go as τ except when that time
interval is very small, e.g., time interval between collisions. At these very small

4
timescales, the particle may appear to be undergoing what is defined as ballistic motion
as it traverses its mean-free-path between solvent collisions.9 For particles that migrate
along a linear trajectory with a constant ballistic velocity, α is simply 2. On the other
hand, labelled messenger RNA molecules in a living E.coli cell undergo “subdiffusion”
with α around 0.7.12
Inducing directed motion at the nano and micron scale requires overcoming
these randomizing events and the following sections discuss mechanisms that have
been employed to accomplish the same.
1.2 Role of Debye Length in Phoretic Transport
One of the first mechanisms identified for autonomous motion was
electrophoresis. In this context, Anderson recognized a critical concept, the slip velocity,
at the solid-liquid interface and the role it plays in fluid dynamics, thus, laying down the
foundation for such phoretic transport mechanism.13 At low Reynold’s number, where
surface forces dominate, it is often processes occurring within this thin interfacial layer
that control the fluid dynamics. In a solution, the charge on a particle's surface is
balanced by a diffuse cloud of counter ions (Figure 1-114). The thickness of the double
layer is defined as the Debye screening length (K-1) and is dependent on the
concentration of ions in the surrounding fluid. The charge density within the cloud at a
distance y, ρe(y), decays exponentially in y at distances of the order of the Debye
screening length from the surface. Taken together, the surface charge and the diffuse
cloud, called the "double layer," are a neutral body. The Debye length plays an important
role in controlling the behavior of colloidal particles and is given by Equation 1.5,

5
𝐾𝐾2 = (2𝑍𝑍2 𝑅𝑅2 𝑐𝑐∞) ⁄ 𝜀𝜀𝑘𝑘𝑘𝑘 (1.5)
where 𝑍𝑍 is the absolute value of the valency of the ion, e is the charge on an electron,
and c is the concentration of the ions 𝜀𝜀 is defined as the dielectric constant of the
material, k is the Boltzmann constant, T is the absolute temperature.
14Figure 1-1. The electric double layer of a charged particle in a polar solution. The
counter ions from the solution come near the charged particle surface to neutralize the
charge and this fluid layer remains diffused around the particle. The ζ-potential is the
electric potential at the shear plane or outer edge of the Stern layer. A non-spherical
charged surface behaves the same way.

6
While low ionic strengths lead to high Debye lengths resulting in colloidal
stability, a high ionic strength solution implies a small Debye length, which leads to short
range van der Waals forces dominating and leads to particle aggregation.
Phoretic transport is defined as the movement of colloidal particles by a field that
interacts with the surface of each particle;13, 14, 15, 16 for instance, electrophoresis involves
an electric field gradient, thermophoresis involves a thermal gradient17-19 and
diffusiophoresis involves a gradient of ionic or non-ionic chemical species.20-22 Other
mechanisms like propulsion based on Marangoni effect,23-26 bubble propulsion,27-30 as
well as propulsion under magnetic31-38 or acoustic fields39-40 have also been identified.
1.3 Mechanisms of Motility
The generation of the propulsive force, asymmetry and, hence, motion can arise
from a variety of mechanisms, including ones that are based on chemical concentration
gradients such as self-electrophoresis and self-diffusiophoresis, and ones that are based
on the gradients of external fields. Motors and pumps are the two major synthetic
machines of interest, and both generate mechanical forces and cause directional
transport by converting energy from chemical fuels,21, 27, 28, 30, 41-49 or external fields
including magnetic,32, 33, 35, 50 electric,51, 52 light,53-56 acoustic,39, 57, 58 and thermal18, 19, 59.
Immobilized “motors” can transfer their force to the surrounding fluid; in effect,
functioning as micropumps. Unlike motors that propel themselves, pumps do not move
themselves, but induce the movement to nearby fluids and inert tracer particles. The
motors require a gradient (e.g. chemical concentration, temperature, surface tension, or
pressure) along the surface to induce motion. They are mostly designed as rods or
spheres with asymmetry in composition (e.g., Janus particles with active material on one

7
side and inert material on the other),27 activity (different chemical reaction rates at the
two ends)60 or shape (concave on one end and convex on the other).38 Early micropump
designs were based on the generation of local electric fields.44, 53, 61-64 Recent designs
include polymeric or enzymatic micropumps that pump fluids by generating chemical
concentration gradients.65-68
1.3.1 Self-Electrophoresis
Electrophoresis is a phenomenon that describes transport of charged species in
a liquid medium (mostly aqueous solution) under an electric field. In an electric field (E),
charged particles migrate with velocity (U) governed by the Smoluchowski equation for
particles with thin double layers.13, 69
U = ζpε
µE (1.6)
Here ζp is the zeta potential of the particle surface, which is related to the surface
charge, ε and µ are the permittivity and dynamic viscosity of the medium, respectively.
Unlike conventional electrophoresis that requires an external electric field, redox
reactions occurring at different parts of a particle surface can result in an ion
concentration gradient and hence local electric field that leads to the motion of the object
itself. This process is called self-electrophoresis, and has been exploited in various
synthetic micro- and nanomachine systems over the past decade.
The first such system was discovered60, 70 using gold (Au)-platinum (Pt) nanorods
(2-3 μm long and ~300 nm in diameter) that move autonomously in dilute hydrogen
peroxide (H2O2) (a few wt.%) with the Pt end leading at a speed of ~ 10 μm/s.

8
In self-electrophoresis, the charged microparticle moves in a self-generated
electric field as a result of an asymmetric distribution of ions. For example, in the case of
the Au-Pt bimetallic nanomotors, the oxidation of H2O2 occurs at the anode (Pt) end and
reduction of H2O2 at the cathode (Au) end lead to a proton concentration gradient
oriented from the Pt end to the Au end. Since the protons are positively charged, the
asymmetric distribution results in an electric field with the same direction (Figure 1-2).60
The negatively charged nanorod therefore moves with the Pt end forward, an effect
similar to traditional electrophoresis.
60Figure 1-2. Propulsion of bimetallic Au-Pt rods in hydrogen peroxide solution powered
by self-electrophoresis.60 Catalytic redox reaction on the two metallic ends generates the
local electric field.
9
The discovery of bimetallic motors has inspired the design of other synthetic
machines, including motors that are based on different shapes,71, 72 fuels41, 43 and power
sources.73
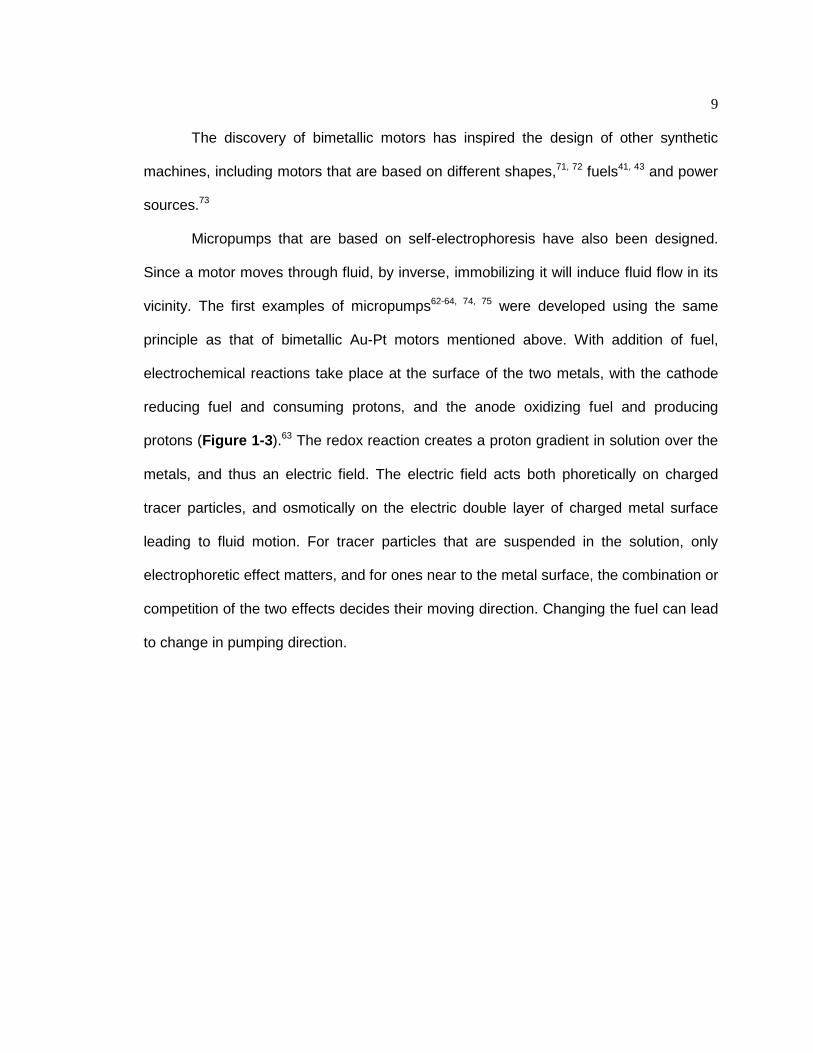
Micropumps that are based on self-electrophoresis have also been designed.
Since a motor moves through fluid, by inverse, immobilizing it will induce fluid flow in its
vicinity. The first examples of micropumps62-64, 74, 75 were developed using the same
principle as that of bimetallic Au-Pt motors mentioned above. With addition of fuel,
electrochemical reactions take place at the surface of the two metals, with the cathode
reducing fuel and consuming protons, and the anode oxidizing fuel and producing
protons (Figure 1-3).63 The redox reaction creates a proton gradient in solution over the
metals, and thus an electric field. The electric field acts both phoretically on charged
tracer particles, and osmotically on the electric double layer of charged metal surface
leading to fluid motion. For tracer particles that are suspended in the solution, only
electrophoretic effect matters, and for ones near to the metal surface, the combination or
competition of the two effects decides their moving direction. Changing the fuel can lead
to change in pumping direction.

10
63Figure 1-3. An immobilized bimetallic surface can generate fluid flow in its vicinity by
the generating a local electric field in the same manner as a bimetallic motor.63 The
schematic describes electrochemical conversion of hydrogen peroxide on the two
metallic surfaces- gold and silver, the generated electric field and the directional motion
imparted to positively charged carboxyl functionalized polystyrene (carboxy-PS) and
negatively charged amidine functionalized polystyrene (amidine-PS) particles.

11
1.3.2 Self-Diffusiophoresis
Similar to self-electrophoresis, self-diffusiophoresis is a mechanism that also
originates from chemical concentration gradients that are produced by surface chemical
reactions. Self-diffusiophoresis can be classified into two categories: electrolyte and non-
electrolyte self-diffusiophoresis, depending on whether the chemical species contributing
to the gradient are charged or uncharged, respectively.
1.3.3 Electrolyte Diffusiophoresis
Electrolyte self-diffusiophoresis is more commonly exploited in the synthetic
motor and pump systems. It operates when a gradient of electrolytes is formed across a
charged surface. For diffusiophoresis near a wall, there are two effects contributing to
the movement of a particle: an electrophoretic effect and a chemophoretic effect, and the
speed of the diffusiophoretic movement can be approximated by Equation (1.7),13
𝑼𝑼 = 𝜵𝜵𝜵𝜵𝜵𝜵𝟎𝟎
��𝑫𝑫+−𝑫𝑫−
𝑫𝑫++𝑫𝑫−� (𝒌𝒌𝑩𝑩𝑻𝑻𝒆𝒆
) 𝜺𝜺(𝜻𝜻𝒑𝒑−𝜻𝜻𝒘𝒘)𝜼𝜼
������������������𝑬𝑬𝑬𝑬𝒆𝒆𝜵𝜵𝑬𝑬𝑬𝑬𝑬𝑬𝒑𝒑𝑬𝑬𝑬𝑬𝑬𝑬𝒆𝒆𝑬𝑬𝑬𝑬𝜵𝜵 𝑻𝑻𝒆𝒆𝑬𝑬𝑻𝑻
+ 𝜵𝜵𝜵𝜵𝜵𝜵𝟎𝟎
�(𝟐𝟐𝜺𝜺𝒌𝒌𝑩𝑩𝟐𝟐 𝑻𝑻𝟐𝟐
𝜼𝜼𝒆𝒆𝟐𝟐 )�𝑬𝑬𝒍𝒍(𝟏𝟏 − 𝜸𝜸𝒘𝒘𝟐𝟐 ) − 𝑬𝑬𝒍𝒍�𝟏𝟏 − 𝜸𝜸𝒑𝒑
𝟐𝟐��� ���������������������������𝑪𝑪𝑬𝑬𝒆𝒆𝑻𝑻𝑬𝑬𝒑𝒑𝑬𝑬𝑬𝑬𝑬𝑬𝒆𝒆𝑬𝑬𝑬𝑬𝜵𝜵 𝑻𝑻𝒆𝒆𝑬𝑬𝑻𝑻
(1.7)
where U is the particle velocity, D+ and D- are the diffusion coefficients of the cation and
anion respectively, Z is the absolute value of the valences of the ions, e is the charge of
an electron, kB is the Boltzmann constant, T is the absolute temperature, ∈ is the
dielectric permittivity of the solution, η is the viscosity of the solution, ζ𝑃𝑃 is the zeta
potential of the particle, ζ𝑤𝑤 is the zeta potential of the wall, γ = tanh(Zeζ𝑃𝑃/4kT), 𝜵𝜵𝜵𝜵 is the
concentration gradient and c0 is the bulk concentration of ions at the particle location, as

12
if the particle was not there. The electroosmotic component, caused due to the wall
double layer, is given by a similar equation, with the particle zeta potential replaced by
the wall zeta potential.
The two parts of the equation signify the two components of diffusiophoresis, as
shown in Figure 1-4.76 The first half signifies electrophoresis. The electric field in this
case originates from the difference in diffusion between the cation and anion which
contributes to the ion gradient in a given direction. This difference leads to a net electric
field, which acts both electrophoretically on the nearby particles and electroosmotically
on the ions adsorbed in the double layer of the wall. The electroosmotic component
leads to fluid movement near the walls. Depending on the charge of the particle, the
electrophoretic and electroosmotic components can augment or allay each other. In
case of competition between the two, the zeta potential of particle or wall dominates and
leads to reduced velocities. However, when both electroosmotic and electrophoretic
motion are in the same direction, an enhancement in particle speed is observed.
Interplay between the osmotic and phoretic components can also lead to schooling and
exclusion patterns.
The second component is the chemophoretic effect. The concentration gradient
of the electrolytes causes a gradient in the thickness of the electric double layer, and
thus a “pressure” difference along the wall is created. As a result, the solution will flow
from the area of higher electrolyte concentration to that of lower concentration, known as
the chemophoretic effect.

13
76Figure 1-4. Schematic depiction of diffusiophoretic motion. The difference in diffusivity
of the ions generated from the source causes a local electric field. The double layer
around the particles as well as the wall responds to the thus formed electric field leading
to electrophoretic and electroosmotic motion respectively. In the example in the figure
above, the anion diffuses faster than the cation generating an electric field from right to
left. The electrophoretic motion of a negatively charged particle is from left to right.
Correspondingly, the electroosmotic flow along the negatively charged wall is from right
to left. The concentration gradient also leads to thickness gradient of double layers on
the surfaces of the particle and wall, and in-turn a pressure difference that propels
particles from left to right.

14
Also, as the thickness of electric double layers is influenced by ionic strength, the
concentration gradient of the electrolytes causes a gradient in the thickness of the
electric double layer. Higher “pressure” at thinner double layers drives fluid flow from the
area of higher electrolyte concentration to that of lower concentration, known as the
chemophoretic effect. In most cases, chemophoretic effect is negligible and
diffusiophoretic transport is governed by the electrophoretic effect, unless the diffusivities
of the cations and the anions are very similar.
The combination of electrophoretic and chemophoretic effects leads to an overall
diffusiophoretic flow, which powers the movement of particles. Electrolyte
diffusiophoresis, however, is not effective in high ionic strength media because of the
collapse of the double layer on the particle surface, as discussed in the previous section.
1.3.4 Non-Electrolyte Self-Diffusiophoresis
Non-electrolyte diffusiophoresis is caused by a gradient of uncharged solutes
and has no dependence on surface charge. This mechanism is able to function in high
ionic strength media, unlike, electrolyte diffusiophoretic transport, which is suppressed
by high electrolyte concentration and, as a result, synthetic machines powered by the
later mechanism cannot operate in highly concentrated ionic media. On the other hand,
in a low ionic strength medium, electrolyte diffusiophoresis is a more powerful
mechanism resulting in higher speeds. This is shown qualitatively by considering that the
chemophoretic component of electrolyte diffusiophoresis has similar origins as non-
electrolyte diffusiophoresis. Both of these mechanisms occur by the chemical species
responsible for the gradient being attracted to the surface either by electrostatic (ionic) or
through van der Waals (non-ionic) interactions. If these two effects are comparable, the
15
electrolyte diffusiophoresis is stronger because it has an additional electric field term
(Equation 1.7).
Although the propulsive forces generated here are generally weaker than from
the electrolyte analog, non-electrolyte diffusiophoresis based on neutral solute gradients
remains effective in powering motion at high ionic strength. Such systems can prevail in
high salt or low polarity solvents. This propulsion mechanism is observed in much fewer
systems and one example is discussed in chapter 4 and is based on a depolymerization
system in organic solvents.
1.3.5 Self-Electrophoresis vs Electrolyte Self-Diffusiophoresis
Self-electrophoresis and electrolyte self-diffusiophoresis are two most commonly
exploited mechanisms for the design of synthetic micro- and nanomachines. Both
mechanisms are based on surface chemical reactions, and the generation of chemical
gradients and local electric fields. The differences between the two mechanisms and the
associated systems can be summarized in three major points. First, electric fields
generated by self-electrophoretic motors are more localized and do not spread as far as
those from electrolyte self-diffusiophoretic systems. As a result, interactions between the
self-electrophoretic motors are short range, and only lead to assembly of doublets or
triplets, while electrolyte self-diffusiophoretic interactions can lead to formation of
collective patterns like “schools”. Secondly, interactions between self-electrophoretic
motors are anisotropic and highly influenced by the relative position or orientation
between the motors. This is significantly different from the case of electrolyte self-
diffusiophoretic motors, which emits and receives chemical signals in an isotropic

16
manner. Lastly, formation of electric fields requires self-electrophoretic systems to be
conductive77, which is not necessary for the electrolyte self-diffusiophoretic counterparts.
In addition to phoretic transport mechanisms, recently discovered biologically
relevant enzymatic motors78 and their collective chemotaxis behavior has brought a new
elixir of life to the field of nanomachines.
1.3.6 Enzyme motors
It has been demonstrated that like other chemically-driven motors, enzymes are
also able to power their own motion by turnover of their respective substrates.78 This is
manifested in the form of substrate-dependent enhancement in diffusivity, as measured
at the single molecule level using fluorescence correlation spectroscopy (FCS). The
observed diffusion enhancement disappears upon the addition of an inhibitor. The
precise mechanism for the turnover-induced enhanced diffusivity remains to be
established. However, a number of mechanistic possibilities have been suggested in the
literature. In one proposal, enzymes propel themselves in solution during substrate
turnover by going through a sequence of non-reciprocal conformational changes during
the substrate binding and product release steps.79 Alternatively, Kapral et al. have
suggested that molecular-scale catalysts can propel themselves through the production
of products that can interact with the catalyst via Lennard-Jones interaction potentials.80
Spatially asymmetric catalysis can lead to inhomogeneous distribution of products. This
non-homogeneous product distribution creates a concentration gradient that can cause
propulsion, depending on features of the products and the solvent (self-diffusiophoresis).
Finally, heat generation through reaction exothermicity may also lead to enhanced
diffusion. However, in several instances the bulk rise in solution temperature due to

17
enzymatic catalysis has been estimated and found to be in the micro-Kelvin range; too
small to account for the observed enhanced diffusion.78, 81 Moreover, to be discussed in
chapter 5 are recent results showing catalysis induced enhancement of diffusion
coefficient for the endothermic turn-over of fructose-bis-phosphate by Aldolase (∆G = +
5.73 Kcal/mol) that argue against the exothermicity hypothesis.
In case of non-motor proteins like urease and catalase, it was determined, using
Langevin/Brownian dynamics simulations, that forces of 12 pN and 9 pN respectively per
turnover were sufficient to cause the enhancement in diffusion. These forces are
comparable to that produced by myosin, kinesin, and dynein motors (about 10 pN)82 and
other molecular scale systems83, 84, and within the range to activate integrins,85 biological
adhesion molecules responsible for mechanosensation by cells, making force production
by enzyme catalysis a potentially novel mechanobiology-relevant event.
1.3.7 Chemotaxis
In the presence of a gradient of substrate concentration, the enzyme molecules
migrate towards higher substrate concentration regions, a form of molecular
chemotaxis;78 another important propulsion mechanism covered in this thesis.
Chemotaxis has long been observed in biological systems,2 and recently in artificial
systems and enzymes in vitro as well.12, 86, 45, 78 The mechanism, however, is not as well
understood in the latter case, unlike the previously discussed phoretic propulsion
mechanisms. In inorganic/synthetic systems, chemotaxis is defined as the preferential
migration in the direction of an externally applied chemical gradient. Hong et al.
proposed that catalytic motors preferentially diffuse up concentration gradients of fuel to
regions with higher diffusivities87, and similar theory has recently been proposed by

18
Saha et al.88 When Pt/Au nanorods are placed in a gradient of hydrogen peroxide, they
gradually diffuse to the source of the chemical, using a combination of active and
stochastic diffusion as demonstrated in Figure 1-5.86 A similar behavior was also
discovered in the polymerization motor system 49, as well as bubble-propelled catalytic
micro-engines.87
86Figure 1-5. Collective behavior demonstrated by synthetic motors. Au-Pt bimetallic
nanomotors chemotax towards the source of hydrogen peroxide fuel (the gel in the
upper left side), as depicted by an increase in the number of rods over time.

19
It has been suggested that the chemotactic behavior of the enzyme molecules
arises from the enhanced diffusion mechanism, since the substrate concentration
changes continuously as the enzyme diffuses along the gradient. Thus, at every point in
space, the diffusion rate increases on moving up the gradient and decreases on moving
down the gradient. A higher diffusion coefficient leads to a greater spreading of the
enzyme molecules on the side of the higher substrate concentration. Thus, the “center of
gravity” of the enzyme ensemble moves towards higher substrate concentration. As with
any non-equilibrium system, a continuous energy input is required for the directional
movement, in this case, to maintain the substrate gradient. The proposed mechanism is
stochastic in nature and is different from biological chemotaxis, which requires temporal
memory of the concentration gradient. The observed chemotactic behavior of single
enzymes suggests that an enzyme that acts on the products of a second, nearby
enzymatic reaction might exhibit collective movement up the substrate gradient towards
this second enzyme; an example of collective behavior at the molecular level.
Chapter 5 discusses such an enzymatic cascade- glycolysis as well as new
insights into the proposed enhanced diffusion controlled mechanism. Several new
control experiments suggest other possible mechanisms or factors such as binding
affinity and turnover rate that play a crucial role in the observed chemotaxis. Other
previously mentioned factors like enzyme conformation, orientation, locally produced
temperature gradients are currently under investigation. These results will shine new
light on the riveting process.

20
1.3.8 Enzyme Pumps
Similar to synthetic pumps, surface-anchored enzymes also transfer their
chemically-generated force to the surrounding fluid; in effect, generating micropumps in
the presence of enzyme-specific substrates.66 Thus, enzymes transduce chemical
energy from substrate turnover into fluid motion. This discovery enables the design of
non-mechanical, self-powered enzyme-based devices that act both as sensor and pump,
precisely controlling flow rate and turning on and off in response to specific analytes.
Most of the enzyme pumps studied so far (glucose oxidase, catalase, lipase, DNA
polymerase) catalyze exothermic reactions and therefore pump fluid and tracer particles
inward along the bottom surface of a microchannel through thermal gradients, as
illustrated in Figure 1-6.

21
66Figure 1-6. Schematic depiction of fabrication and functioning of enzymatic
micropumps. (a) Au patterned on a PEG-coated glass surface is functionalized with a
quaternary ammonium thiol, which electrostatically binds to the negatively charged
groups on the enzyme. Triggered fluid pumping is initiated by introducing enzyme
specific substrate. (b) Cascading fluid pumping is observed when enzyme catalase is
actuated by production of its substrate in situ by enzyme glucose oxidase and its
substrate glucose enabling microfluidic regulation and logic.

22
However, urease (which hydrolyzes urea to bicarbonate and ammonium ions)
increases the solution density and thus pumps fluid outward. These experiments
establish two important findings: 1) essentially all surface-anchored enzymes act as
pumps when turning over their substrates, 2) these pumps are selective for the substrate
or promoter of a particular enzyme.
As with the diffusivity of freely swimming enzymes, the pumping velocity of the
enzyme pumps increases with increasing substrate concentration and reaction rate.
Similar pumping can occur in gel particles in which the enzymes are immobilized. For
example, bound glucose oxidase pumps insulin out of gel particles when glucose is
added to solution.78
1.4 Other Mechanisms
The phoretic mechanisms - electrophoresis and diffusiophoreis, as well as
chemotaxis comprise the focus of this thesis and will be discussed in great details, with
example applications, in the chapters that follow. However, there are other propulsion
mechanisms that have been identified and applied in synthetic systems. The following
sections briefly discuss a few such mechanisms.
1.4.1 Bubble Propulsion
Bubble propulsion is another mechanism, like non-electrolyte diffusiophoresis, that can
power motion at high ionic strengths. In this case, oxygen or hydrogen microbubbles are
generated through decomposition of hydrogen peroxide or reduction of water (Figure 1-
7).89 When bubbles detach from the motors, the associated recoil force pushes motors in

23
the opposite direction. Through surface modification and functionalization, bubble-
propelled motors can sense, capture, and transport biological analytes ranging from
molecules to cells.90 Identification, separation, and isolation of target analytes, such as
specific proteins, nucleic acids, or other biomarkers, are extremely important in
biomedical research. Receptor-modified tubular micro-engines have been demonstrated
to selectively isolate a wide range of target bioanalytes, including bacteria,91 DNA
molecules46 and cancer cells.92
89Figure 1-7. Bubble propulsion mechanism. Oxygen microbubbles are generated
through decomposition of hydrogen peroxide. As the bubbles detach from the motors,
the associated recoil force pushes motors in the opposite direction.

24
For example, with the outer surface functionalized with Concanavalin A (Con A)
lectin receptor, catalytic micro-engines can recognize carbohydrate constituents of
bacterial surface, and selectively bind to them.91 As a proof of concept, E.coli was
demonstrated to be isolated from untreated seawater and drinking water samples.
Tubular catalytic microengines can also function as concentrating systems,93 and
achieve directional transport and delivery of cells with the help of external magnetic
fields.94
By coating the surface with polymeric layers, it is also possible to achieve
controlled-drug release via bubble-propelled motors. Mg/Pt Janus motors, when coated
with thermo-responsive poly(N-isopropylacrylamide) (PNIPAM) hydrogel layer, have
been reported to release drug molecules in response to a temperature change.95
Despite these potential applications, in-vivo application of bubble-propelled
motors are hindered by the fact that their motility is attenuated by electrolytes and blood
plasma.96, 97
1.4.2 Magnetically-driven Motors
A problem for bubble-propelled motor is their general lack of directionality, due to
Brownian randomization at longer time scales. One way to overcome this problem is to
introduce magnetic components into motors. Such motors, although still powered by
chemical fuels, are subject to guidance by external magnetic fields.
Another method is to simply replace the power source with external magnetic
fields. These motors, when actuated, can be employed both in vitro and in vivo .98 Using
this technique, Nelson group has reported several examples of cell transportation and
drug delivery by artificial flagella.99-101 For cell transportation, cage-like micromotors

25
(Figure 1-8)100 were fabricated and cells were allowed to grow inside them. These
motors were subsequently activated and propelled using an external rotating magnetic
field. For drug delivery, motor surfaces were modified with drug-loaded chitosan or
liposomes 99, 101; motors then migrated towards targets and released drugs.
Wireless manipulation of micromotors inside eye cavity through OctoMag
electromagnetic control system has also been reported. 102, 103 The OctoMag can control
motors of a human eye. Micromotors are injected into eyes through a 23G-needle
syringe and, once inside, are powered and manipulated by the magnetic fields.

26
100Figure 1-8. Magnetic manipulation of cage-like micromotors for transportation of cells.
(a) SEM image of a hexahedral microrobot after cell culture and (b) an enlarged SEM
image. Confocal microscope images of the (c) hexahedral and (d) cylindrical microrobots
after staining of the cells.
27
1.4.3 Acoustically-powered Motors
Low-power acoustic waves are safe and used extensively for in vivo imaging,
and are thus useful for powering motors. In an acoustic field, suspended microparticles
experience acoustic radiation forces, which are strongest when standing waves are
formed under acoustic excitation.
Recently Wang et al. reported a MHz-frequency ultrasound-powered
autonomous micromotor system.6 In the system, bimetallic microrods are suspended in
water, and levitated to a plane at the midpoint of the cell by a vertical standing wave, as
demonstrated in Figure 1-9a.38 In the plane, the rods exhibit axial propulsion at speeds
up to 200 µm/s (~100 body lengths/s), and also form patterns in the nodal plane. Motion
of the motors are significantly affected by their composition, as only metallic rods
showing fast axial motion, and polymeric rods do not.
Self-acoustophoresis has been proposed as the mechanism of motility. The
acoustic motors, under guidance of magnetic fields, can be steered to capture and
transport various bioanalytes like cells, as demonstrated in Figure 1-9b.38 The motion of
acoustic motors inside living HeLa cells, has also been reported, the first example of
artificial motors inside living cells.57 The motors attach strongly to the external surface of
the cells, and are readily internalized through incubation for periods longer than 24 h.
Actuated at 4 MHz, these motors exhibit axial propulsion and spinning while the cells
remaining viable. Such systems can provide a new tool for probing the response of living
cells to internal mechanical excitation and related biomedical applications.

28
Figure 1-9. Acoustic powered self-propelled motors.38 (a) Propagation and assembly of
bimetallic rods under acoustic fields. (b) Navigation of an acoustically-powered motor
towards a HeLa cell under magnetic field-guidance.

29
1.5 Conclusion
This chapter gives a general introduction to the theme of nanoscale propulsion.
However, the focus of this thesis continues to be diffusiophoretic mechanisms. The
following chapters discuss diffusiphoretic mechanism utilized to design application
oriented triggered, self-propelled micro-pumps, followed by new insights into enzymatic
chemotaxis.

30
1.6 References
1. Feynman, R. P. Engineering and Science 1960, 23, 22-36. 2. Berg, H. C.; Brown, D. A. Nature 1972, 239, 500-504. 3. Block, S. M. Cell 1998, 93, 5-8. 4. Bonabeau, E.; Dorigo, M.; Theraulaz, G., Swarm intelligence: from natural to
artificial systems. Oxford University Press, Inc.: 1999; p 307. 5. Purcell, E. M. Am. J. Phys. 1977, 45, 3-11. 6. Wang, W.; Duan, W.; Ahmed, S.; Mallouk, T. E.; Sen, A. Nano Today 2013, 8,
531-554. 7. Lauga, E. Phys. Rev. Lett. 2011, 106, 178101. 8. Metzler, R.; Klafter, J. Phys. Rep. 2000, 339, 1-77. 9. Pusey, P. N. Science 2011, 332, 802-803. 10. Duan, W.; Ibele, M.; Liu, R.; Sen, A. Eur. Phys. J. E 2012, 35, 1-8. 11. Dunderdale, G.; Ebbens, S.; Fairclough, P.; Howse, J. Langmuir 2012, 28, 10997-
11006. 12. Metzler, R.; Jeon, J.-H.; Cherstvy, A. G.; Barkai, E. Phys. Chem. Chem. Phys.
2014, 16, 24128-24164. 13. Anderson, J. L. Annu. Rev. Fluid Mech. 1989, 21, 61-99. 14. Adair, J. H.; Suvaci, E.; Sindel, J. Encyclopedia of Materials: Science and
Technology, Elsevier Publishing, The Netherlands, 2001, 8996-9006. 15. Ruckenstein, E. J. Colloid Interface Sci. 1981, 83, 77-81. 16. Golestanian, R.; Liverpool, T.; Ajdari, A. New J. Phys. 2007, 9, 126. 17. Rasuli, S. N.; Ramin, G. J. Phys.: Condens. Matter 2005, 17, S1171. 18. Jiang, H.-R.; Yoshinaga, N.; Sano, M. Phys. Rev. Lett. 2010, 105, 268302. 19. Baraban, L.; Streubel, R.; Makarov, D.; Han, L.; Karnaushenko, D.; Schmidt, O.
G.; Cuniberti, G. ACS Nano 2013, 7, 1360-1367. 20. Córdova-Figueroa, U. M.; Brady, J. F. Phys. Rev. Lett. 2008, 100, 158303.
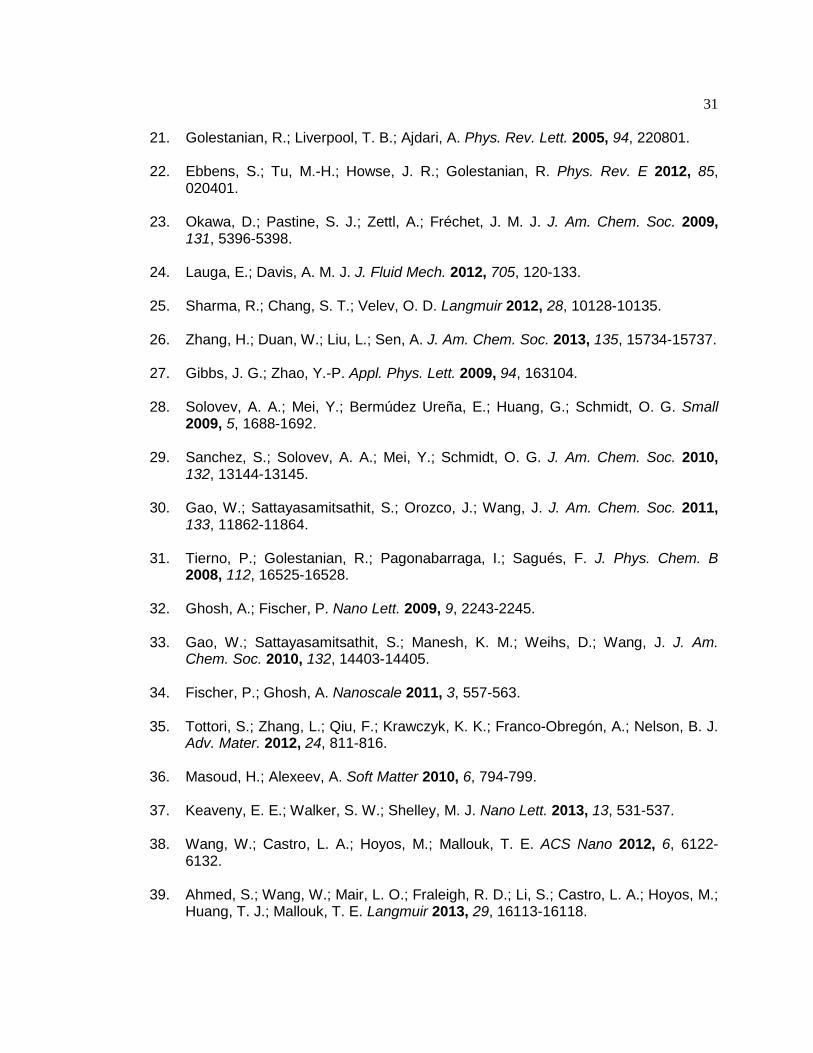
31
21. Golestanian, R.; Liverpool, T. B.; Ajdari, A. Phys. Rev. Lett. 2005, 94, 220801. 22. Ebbens, S.; Tu, M.-H.; Howse, J. R.; Golestanian, R. Phys. Rev. E 2012, 85,
020401. 23. Okawa, D.; Pastine, S. J.; Zettl, A.; Fréchet, J. M. J. J. Am. Chem. Soc. 2009,
131, 5396-5398. 24. Lauga, E.; Davis, A. M. J. J. Fluid Mech. 2012, 705, 120-133. 25. Sharma, R.; Chang, S. T.; Velev, O. D. Langmuir 2012, 28, 10128-10135. 26. Zhang, H.; Duan, W.; Liu, L.; Sen, A. J. Am. Chem. Soc. 2013, 135, 15734-15737. 27. Gibbs, J. G.; Zhao, Y.-P. Appl. Phys. Lett. 2009, 94, 163104. 28. Solovev, A. A.; Mei, Y.; Bermúdez Ureña, E.; Huang, G.; Schmidt, O. G. Small
2009, 5, 1688-1692. 29. Sanchez, S.; Solovev, A. A.; Mei, Y.; Schmidt, O. G. J. Am. Chem. Soc. 2010,
132, 13144-13145. 30. Gao, W.; Sattayasamitsathit, S.; Orozco, J.; Wang, J. J. Am. Chem. Soc. 2011,
133, 11862-11864. 31. Tierno, P.; Golestanian, R.; Pagonabarraga, I.; Sagués, F. J. Phys. Chem. B
2008, 112, 16525-16528. 32. Ghosh, A.; Fischer, P. Nano Lett. 2009, 9, 2243-2245. 33. Gao, W.; Sattayasamitsathit, S.; Manesh, K. M.; Weihs, D.; Wang, J. J. Am.
Chem. Soc. 2010, 132, 14403-14405. 34. Fischer, P.; Ghosh, A. Nanoscale 2011, 3, 557-563. 35. Tottori, S.; Zhang, L.; Qiu, F.; Krawczyk, K. K.; Franco-Obregón, A.; Nelson, B. J.
Adv. Mater. 2012, 24, 811-816. 36. Masoud, H.; Alexeev, A. Soft Matter 2010, 6, 794-799. 37. Keaveny, E. E.; Walker, S. W.; Shelley, M. J. Nano Lett. 2013, 13, 531-537. 38. Wang, W.; Castro, L. A.; Hoyos, M.; Mallouk, T. E. ACS Nano 2012, 6, 6122-
6132. 39. Ahmed, S.; Wang, W.; Mair, L. O.; Fraleigh, R. D.; Li, S.; Castro, L. A.; Hoyos, M.;
Huang, T. J.; Mallouk, T. E. Langmuir 2013, 29, 16113-16118.

32
40. Garcia-Gradilla, V.; Orozco, J.; Sattayasamitsathit, S.; Soto, F.; Kuralay, F.; Pourazary, A.; Katzenberg, A.; Gao, W.; Shen, Y.; Wang, J. ACS Nano 2013, 7, 9232-9240.
41. Liu, R.; Sen, A. J. Am. Chem. Soc. 2011, 133, 20064-20067. 42. Pantarotto, D.; Browne, W. R.; Feringa, B. L. Chem. Commun. 2008, 1533-1535. 43. Mano, N.; Heller, A. J. Am. Chem. Soc. 2005, 127, 11574-11575. 44. Kline, T. R.; Paxton, W. F.; Mallouk, T. E.; Sen, A. Angew. Chem. 2005, 117, 754-
756. 45. Paxton, W. F.; Baker, P. T.; Kline, T. R.; Wang, Y.; Mallouk, T. E.; Sen, A. J. Am.
Chem. Soc. 2006, 128, 14881-14888. 46. Wu, J.; Balasubramanian, S.; Kagan, D.; Manesh, K. M.; Campuzano, S.; Wang,
J. Nat. Commun. 2010, 1, 36. 47. Howse, J. R.; Jones, R. A. L.; Ryan, A. J.; Gough, T.; Vafabakhsh, R.;
Golestanian, R. Phys. Rev. Lett. 2007, 99, 048102. 48. Stock, C.; Heureux, N.; Browne, W. R.; Feringa, B. L. Chem. Eur. J. 2008, 14,
3146-3153. 49. Pavlick, R. A.; Sengupta, S.; McFadden, T.; Zhang, H.; Sen, A. Angew. Chem.
2011, 123, 9546-9549. 50. Dreyfus, R.; Baudry, J.; Roper, M. L.; Fermigier, M.; Stone, H. A.; Bibette, J.
Nature 2005, 437, 862-865. 51. Calvo-Marzal, P.; Sattayasamitsathit, S.; Balasubramanian, S.; Windmiller, J. R.;
Dao, C.; Wang, J. Chem. Commun. 2010, 46, 1623-1624. 52. Chang, S. T.; Paunov, V. N.; Petsev, D. N.; Velev, O. D. Nat. Mater 2007, 6, 235-
240. 53. Hong, Y.; Diaz, M.; Córdova-Figueroa, U. M.; Sen, A. Adv. Funct. Mater. 2010, 20,
1568-1576. 54. Liu, M.; Zentgraf, T.; Liu, Y.; Bartal, G.; Zhang, X. Nat. Nanotechnol. 2010, 5, 570-
573. 55. Ibele, M.; Mallouk, T. E.; Sen, A. Angew. Chem., Int. Ed. 2009, 48, 3308-3312. 56. Abid, J.-P.; Frigoli, M.; Pansu, R.; Szeftel, J.; Zyss, J.; Larpent, C.; Brasselet, S.
Langmuir 2011, 27, 7967-7971.

33
57. Wang, W.; Li, S.; Mair, L.; Ahmed, S.; Huang, T. J.; Mallouk, T. E. Angew. Chem., Int. Ed. 2014, 53, 3201-3204.
58. Kagan, D.; Benchimol, M. J.; Claussen, J. C.; Chuluun-Erdene, E.; Esener, S.;
Wang, J. Angew. Chem. 2012, 124, 7637-7640. 59. Qian, B.; Montiel, D.; Bregulla, A.; Cichos, F.; Yang, H. Chem. Sci. 2013, 4, 1420-
1429. 60. Paxton, W. F.; Kistler, K. C.; Olmeda, C. C.; Sen, A.; St. Angelo, S. K.; Cao, Y.;
Mallouk, T. E.; Lammert, P. E.; Crespi, V. H. J. Am. Chem. Soc. 2004, 126, 13424-13431.
61. McDermott, J. J.; Kar, A.; Daher, M.; Klara, S.; Wang, G.; Sen, A.; Velegol, D.
Langmuir 2012, 28, 15491-15497. 62. Jun, I.-K.; Hess, H. Adv. Mater. 2010, 22, 4823-4825. 63. Kline, T. R.; Paxton, W. F.; Wang, Y.; Velegol, D.; Mallouk, T. E.; Sen, A. J. Am.
Chem. Soc. 2005, 127, 17150-17151. 64. Ibele, M. E.; Wang, Y.; Kline, T. R.; Mallouk, T. E.; Sen, A. J. Am. Chem. Soc.
2007, 129, 7762-7763. 65. Sengupta, S.; Spiering, M. M.; Dey, K. K.; Duan, W.; Patra, D.; Butler, P. J.;
Astumian, R. D.; Benkovic, S. J.; Sen, A. ACS Nano 2014, 8, 2410-2418. 66. Sengupta, S.; Patra, D.; Ortiz-Rivera, I.; Agrawal, A.; Shklyaev, S.; Dey, K. K.;
Córdova-Figueroa, U.; Mallouk, T. E.; Sen, A. Nature Chem. 2014, 6, 415-422. 67. Zhang, H.; Yeung, K.; Robbins, J. S.; Pavlick, R. A.; Wu, M.; Liu, R.; Sen, A.;
Phillips, S. T. Angew. Chem., Int. Ed. 2012, 51, 2400-2404. 68. Yadav, V.; Zhang, H.; Pavlick, R.; Sen, A. J. Am. Chem. Soc. 2012, 134, 15688-
15691. 69. Solomentsev, Y.; Anderson, J. L. J. Fluid Mech. 1994, 279, 197-215. 70. Fournier-Bidoz, S.; Arsenault, A. C.; Manners, I.; Ozin, G. A. Chem. Commun.
2005, 441-443. 71. Gibbs, J. G.; Fragnito, N. A.; Zhao, Y. Appl. Phys. Lett. 2010, 97, 253107. 72. Wheat, P. M.; Marine, N. A.; Moran, J. L.; Posner, J. D. Langmuir 2010, 26,
13052-13055. 73. Loget, G.; Kuhn, A. J. Am. Chem. Soc. 2010, 132, 15918-15919.

34
74. Kline, T. R.; Iwata, J.; Lammert, P. E.; Mallouk, T. E.; Sen, A.; Velegol, D. J. Phys. Chem. B 2006, 110, 24513-24521.
75. Kline, T. R.; Sen, A. Langmuir 2006, 22, 7124-7127. 76. Yadav, V.; Duan, W.; Sen, A., Diffusiophoretic Nano and Microscale Propulsion
and Communication. In Engineering of Chemical Complexity II, pp 73-91. 77. Laocharoensuk, R.; Burdick, J.; Wang, J. ACS Nano 2008, 2, 1069-1075. 78. Sengupta, S.; Dey, K. K.; Muddana, H. S.; Tabouillot, T.; Ibele, M. E.; Butler, P. J.;
Sen, A. J. Am. Chem. Soc. 2013, 135, 1406-1414. 79. Sakaue, T.; Kapral, R.; Mikhailov, A. S. Eur. Phys. J. B 2010, 75, 381-387. 80. Peter, H. C.; Raymond, K. Europhys. Lett. 2014, 106, 30004. 81. Shah, A. S.; Ben-Shahar, Y.; Moninger, T. O.; Kline, J. N.; Welsh, M. J. Science
2009, 325, 1131-1134. 82. Spudich, J. A.; Rice, S. E.; Rock, R. S.; Purcell, T. J.; Warrick, H. M. Cold Spring
Harb Protoc. 2011, 2011, 066662. 83. Mahadevan, L.; Matsudaira, P. Science 2000, 288, 95-99. 84. Mehta, A. D.; Rief, M.; Spudich, J. A.; Smith, D. A.; Simmons, R. M. Science
1999, 283, 1689-1695. 85. Wang, N.; Butler, J.; Ingber, D. Science 1993, 260, 1124-1127. 86. Hong, Y.; Blackman, N. M. K.; Kopp, N. D.; Sen, A.; Velegol, D. Phys. Rev. Lett.
2007, 99, 178103. 87. Baraban, L.; Harazim, S. M.; Sanchez, S.; Schmidt, O. G. Angew. Chem. 2013,
125, 5662-5666. 88. Saha, S.; Golestanian, R.; Ramaswamy, S. Phys. Rev. E 2014, 89, 062316. 89. Abdelmohsen, L. K.; Peng, F.; Tu, Y.; Wilson, D. A. J. Mater. Chem. B 2014, 2,
2395-2408. 90. Solovev, A. A.; Sanchez, S.; Pumera, M.; Mei, Y. F.; Schmidt, O. G. Adv. Funct.
Mater. 2010, 20, 2430-2435. 91. Campuzano, S.; Orozco, J.; Kagan, D.; Guix, M.; Gao, W.; Sattayasamitsathit, S.;
Claussen, J. C.; Merkoçi, A.; Wang, J. Nano Lett. 2012, 12, 396-401.

35
92. Balasubramanian, S.; Kagan, D.; Jack Hu, C.-M.; Campuzano, S.; Lobo-Castañon, M. J.; Lim, N.; Kang, D. Y.; Zimmerman, M.; Zhang, L.; Wang, J. Angew. Chem., Int. Ed. 2011, 50, 4161-4164.
93. Restrepo-Perez, L.; Soler, L.; Martinez-Cisneros, C.; Sanchez, S.; Schmidt, O. G.
Lab Chip 2014, 14, 2914-2917. 94. Sanchez, S.; Solovev, A. A.; Schulze, S.; Schmidt, O. G. Chem. Commun. 2011,
47, 698-700. 95. Mou, F.; Chen, C.; Zhong, Q.; Yin, Y.; Ma, H.; Guan, J. ACS Appl. Mater.
Interfaces 2014, 6, 9897-9903. 96. Wang, H.; Zhao, G.; Pumera, M. Phys. Chem. Chem. Phys. 2013, 15, 17277-
17280. 97. Zhao, G.; Wang, H.; Khezri, B.; Webster, R. D.; Pumera, M. Lab Chip 2013, 13,
2937-2941. 98. Peyer, K. E.; Zhang, L.; Nelson, B. J. Nanoscale 2013, 5, 1259-1272. 99. Fusco, S.; Chatzipirpiridis, G.; Sivaraman, K. M.; Ergeneman, O.; Nelson, B. J.;
Pané, S. Adv. Healthc Mater. 2013, 2, 1037-1044. 100. Kim, S.; Qiu, F.; Kim, S.; Ghanbari, A.; Moon, C.; Zhang, L.; Nelson, B. J.; Choi,
H. Adv. Mater. 2013, 25, 5863-5868. 101. Mhanna, R.; Qiu, F.; Zhang, L.; Ding, Y.; Sugihara, K.; Zenobi-Wong, M.; Nelson,
B. J. Small 2014, 10, 1953-1957. 102. Marino, H.; Bergeles, C.; Nelson, B. J. IEEE Trans. Autom. Sci. Eng. 2014, 11,
310-316. 103. Kummer, M. P.; Abbott, J. J.; Kratochvil, B. E.; Borer, R.; Sengul, A.; Nelson, B. J.
IEEE Trans. Robot. 2010, 26, 1006-1017.

36
Chapter 2
Triggered “On/Off” Micro-Pumps and Colloidal Photo-Diode
2.1. Introduction
An important challenge in designing nano/micromotors and pumps involves
achieving targeted transport to a precise destination.1-8 Such fine-tuned motion is
essential for complex functions in microfluidic chips, cargo delivery systems, and self-
assembly applications. Further, it is also highly desirable that these pumps be capable of
being turned on by a specific external signal. This chapter discusses a set of
autonomous micropumps based on simple acid-base and photochemistry induced ion
gradients that result in spatio-temporal control of fluid flow. Earlier designs of
micropumps that cause fluid flow in response to specific fuels or chemical signals 9-15
typically lack control since they cannot be readily turned off and on again.16 Having an
on/off switch is important for it allows the pump to respond to changes in the
environment, which is useful for the design of sensors and logic gates.
2.2 Design of Smart Micro-Pumps
This chapter describes a photo-acid generator (PAG) based system that was
used to demonstrate a UV-initiated pump with an “on/off” switch that can further be used
for patterning. In addition the acid-catalyzed hydrolysis of a polymeric imine17-20 was
utilized to create a pump with pH regulated velocities that was combined with the PAG

37
pump to create a source-drain based “photo-diode” that gives spatio-temporal control
over colloidal mobility.
2.3 Propulsion Mechanism
As shown in Figure 2-1, upon illumination at wavelength 365 nm,, the solid
photoacid generator, N-hydroxyphthalimide triflate (PAG-1), forms N-
hydroxyphthalimide, and two ions: proton and triflate anion. The large difference in
diffusion coefficients between the small cation and the large anion, establishes a
diffusion-induced electric field pointing towards the PAG that is responsible for the
observed diffusiophoretic motion.
As discussed in the previous chapter, in an unbounded solution of a
symmetrically charged binary electrolyte with a uniform concentration gradient ∇𝑐𝑐, the
diffusiophoretic velocity of a charged particle, U, is given by Equation 2.121
U = 𝜀𝜀kT2𝑒𝑒𝑒𝑒
��𝐷𝐷+−𝐷𝐷−
𝐷𝐷++𝐷𝐷−� ζ𝑃𝑃 − 2kT𝑍𝑍𝑒𝑒
𝜌𝜌𝑙𝑙(1 − 𝛾𝛾2) ∇𝑐𝑐c0
� (2.1)
where D+ and D- are the diffusion coefficients of the cation and anion
respectively, Z is the absolute value of the valences of the ions, e is the charge of
an electron, k is the Boltzmann constant, T is the absolute temperature, ε is the
dielectric permittivity of the solution, η is the viscosity of the solution, ζ𝑃𝑃 is the
zeta potential of the particle, γ = tanh(Zeζ𝑃𝑃/4kT), and c0 is the bulk concentration
of ions at the particle location, as if the particle was not there. The electroosmotic
component is given by a similar equation, with the particle zeta potential replaced
by the wall zeta potential.

38
The net velocities in this system result from the competition between the
diffusiophoresis and the electroosmosis (Figure 2-1). With the proton diffusing faster (D
= 9.31 x 10⁻⁵ cm2 s-1) than the larger triflate anion (estimated D = 1.38 x 10⁻⁵cm2 s-1
assuming a sphere), a local electric field is set up pointing inwards. Owing to the electric
double layer on the negatively-charged sodium borosilicate glass slide, an
electroosmotic flow is generated, which is also inwards in the direction of the local
electric field.
Figure 2-1. A schematic depiction of PAG pumping mechanism. The negative surface
charge of the glass creates a positive double layer, which in response to the generated
ions causes an inward electroosmotic flow. The negatively charged tracers (S-PS
particles) move opposite to the direction of the electric field, competing against the
electroosmotic flow while the positively charged tracers (NH2-PS particles) move along
the electric field direction aided by the electroosmotic flow.
UV
N
O
O
O S
O
CF3
O
hvN
O
O
OH
CF3SO3-
+
+ H+

39
2.4 Switchable Photoacid Pump
2.4.1 Experimental Set-Up
As displayed in Figure 2-1, to construct the PAG pump, crystallites of PAG-1
were placed on a glass slide and covered with hybridization chambers. An HBO (H for
Hg or mercury, B is the symbol for luminance, O for unforced cooling) 100 lamp attached
to the microscope was used for UV exposure. The light wavelength was predominantly
365 nm with a maximum power of 2.5 Wcm-2 at the center. In a typical experiment a 9
mm diameter, 0.12 mm thick imaging hybridization chamber was placed on a
microscope slide and the appropriate solution, typically a water suspension of sulfate,
carboxylate, or amine functionalized polystyrene tracers (2 µm diameter) was added to
the chamber. The deionized (DI) water that was used for all experiments had a specific
resistance of 18 MΩ cm. The videos were captured using a CCD camera attached to an
optical microscope (Zeiss Axiovert 200 reflectance/ transmission) at 50x magnification.
To calculate particle velocities, 30 randomly selected particles were tracked using
tracker software for 6 s.
2.4.2 ‘On/Off’ Pump in Action
Positively charged tracers (amino functionalized polystyrene particles, NH2-PS)
were observed to move towards the photoacid, aided by both the diffusiophoretic and
electroosmotic flows, attaining an average velocity of 7.2 ± 2.4 µm/s. The negatively
charged tracers (sulfate functionalized polystyrene particles; S-PS and carboxylate
functionalized polystyrene particles; HOOC-PS) on the other hand, move in the direction

40
of the diffusiophoretic flows, out-winning the electroosmotic flow, owing to their higher
zeta potential in comparison to that of the glass.22, 25 Also, in this system, the pH
changes from 6.8 to 2 and the ionic strength changes from 10-6 to 10-3 M. In this range,
the zeta potential of glass and involved tracers are: Glass, -30 to -60 mV22; NH2-PS,
approx. +55 mV23; S-PS, -100 to -180 mV24; HOOC-PS, -120 to -160 mV25, the exact
value depending on the ionic strength and pH. The S-PS particles attained an average
velocity of 4.8 ± 1.3 µm/s and that for HOOC-PS particles was calculated to be 4.1 ± 0.9
µm/s. Note that all the reported velocities were measured close to the wall (glass
surface). As expected, due to fluid continuity, the direction of motion is reversed when
observing particles several hundred microns above the wall. The motion ceases when
UV light is turned off but can be reinitiated upon re-illumination. Only Brownian diffusion
is observed in the absence of UV light. Another control was performed by first
exhausting the photoacid by prolonged UV illumination, until it no longer produces
protons (no measurable change in pH). Here again, no powered motion was observed
even under illumination. Hence, the role of a thermal gradient in causing flow can be
ruled out. Figure 2-2 displays the tracer particle distributions without UV and after 1 min
of UV irradiation.
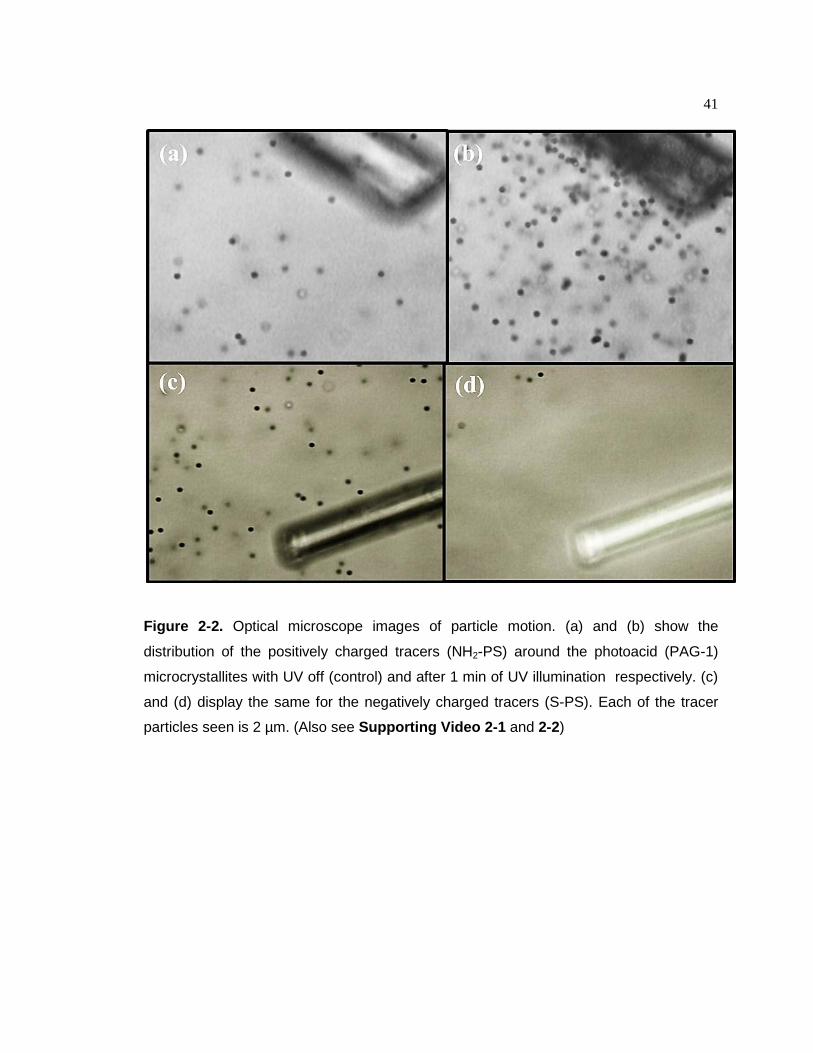
41
Figure 2-2. Optical microscope images of particle motion. (a) and (b) show the
distribution of the positively charged tracers (NH2-PS) around the photoacid (PAG-1)
microcrystallites with UV off (control) and after 1 min of UV illumination respectively. (c)
and (d) display the same for the negatively charged tracers (S-PS). Each of the tracer
particles seen is 2 µm. (Also see Supporting Video 2-1 and 2-2)

42
2.4.3 Separation of Diffusiophoretic and Electroosmotic Motion
In the interest of separating the diffusiophoretic and electroosmotic components,
the same experiments were performed on a polystyrene surface, which has minimal
surface charge. The particles (2 µm) were tracked over a 6 s period using tracker
software. The velocities of the positively charged tracers were impeded in the absence
of the aiding electroosmotic force (average velocity = 4.0 ± 0.4 µm/s), while those of the
negatively charged tracers were enhanced due to the absence of the opposing
electroosmotic force (S-PS particle, average velocity = 7.9 ± 1.1 µm/s and HOOC-PS
particle, average velocity = 6.6 ± 0.3 µm/s), both approximately by a factor of two. Thus,
the estimated contributions of diffusiophoretic and electroosmotic components of velocity
are approximately equal (Figure 2-3).
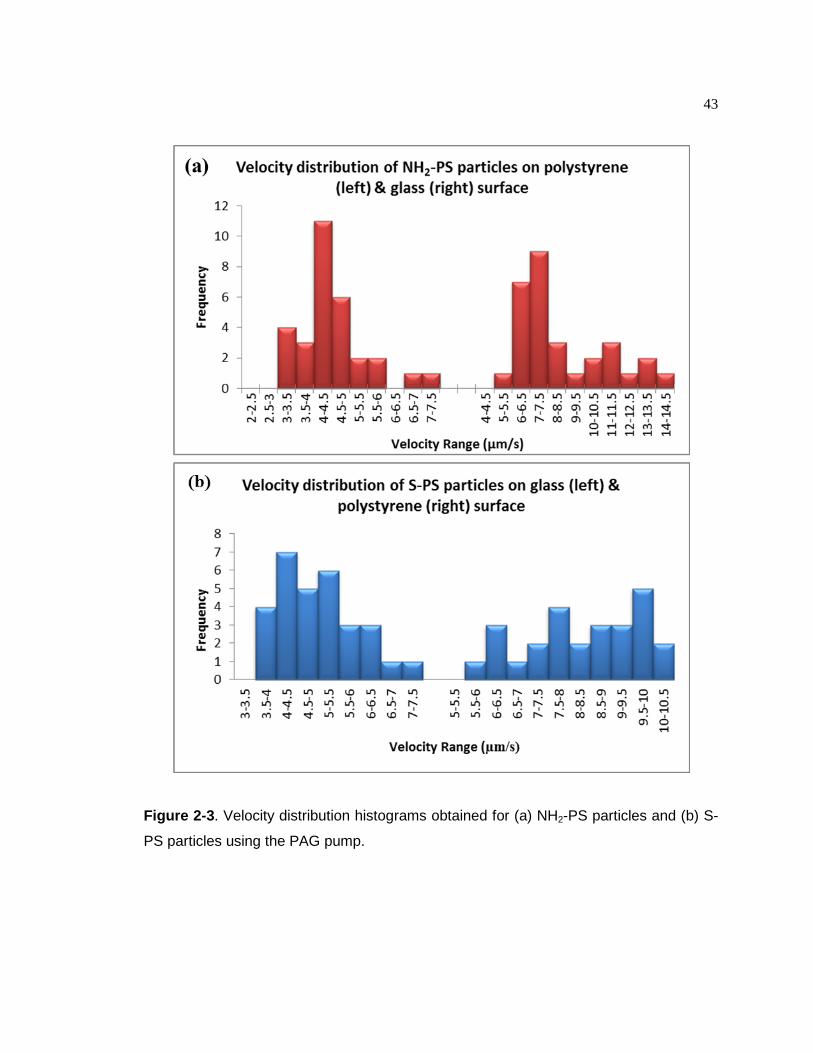
43
Figure 2-3. Velocity distribution histograms obtained for (a) NH2-PS particles and (b) S-
PS particles using the PAG pump.

44
2.4.4 Self- Assembled Patterns
As shown in Figure 2-4, diffusiophoretic pumping by PAG upon illumination
resulted in patterned self-assemblies of tracer particles (2 µm) (Supporting Video 2-3).
This outcome was utilized to design the photoacid pump induced guided motion through
microchannels to achieve patterning at the micron scale using photo-induced ion
gradients. The lithographic mask was printed on a polyacrylate surface using epilog mini
laser printer and a PDMS layer was cast on it (Figure 2-5). The PDMS layer was
subsequently peeled off after curing and was used as our pattern. The reservoirs on
each end of the pattern were 10 x 10 mm. PAG-2 crystallites were packed in two 1 x 1
mm compartments on either side of a 4 x 1 mm channel connecting the two reservoirs.
Figure 2-4. Patterns induced by PAG pumping. (a) Control image, NH2-PS particle
distribution around a single photoacid crystallite with UV off. (b) Self-assembled NH2-PS
particle pattern with UV on. Each of the tracer particles seen is 2 µm.
Control Self-assembly (a) (b)

45
N-Hydroxy-5-norbornene-2,3-dicarboximide perfluoro-1-butanesulfonate, PAG-2
was used for this experiment due to its granular morphology and its ease of packing in
the 1 mm x 1 mm compartment within the pattern. Upon UV illumination, tracers (NH2-
PS) were pulled out of the large reservoirs and were made to follow the designed micro-
channel in the pattern (Supporting Video 2-4). When the UV was switched off, the
particle motion relaxed and picked up again as the UV was turned back on. Thus, the
motion can be initiated and stopped repeatedly.
Figure 2-5. A schematic depiction of the pattern. The pump pulls the NH2-PS particles
out from the large reservoirs (10 x 10 mm2) into the micro-channels (4 x 1 mm2), towards
the PAG chambers (1 x 1 mm2) on either side of the channel.

46
2.5 pH Controlled Polymer Pump
Figure 2-6. Schematic depiction of PFA-S pumping mechanism. The local electric field
points outwards away from the polymer film and the negatively charged tracers COOH-
PS particles move inwards, towards film.
The acid-catalyzed hydrolysis of a polymeric imine, poly(4-formyphenyl acrylate)
aniline Schiff base (PFA-S) film cast on a glass slide was next used to design another
diffusiophoretic pump, only this time with the direction of the local electric field reversed
due to the higher diffusivity of the anion (DCl- = 2.032 x 10⁻⁵ cm2 s-1) relative to the much
larger cation (Figure 2-6). (Supporting Videos 2-5 and 2-6). Accordingly, the
movement of the tracers was observed to be reversed with the negative HOOC-PS

47
tracers moving inwards competing against the electroosmotic component and the
positively charged NH2-PS particles moving outwards, aided by the electroosmotic
component. The experimental design of the PFA-S polymer pump involved dissolving
the polymer in dichloromethane (20 mg/mL) and drop casting the solution onto a glass
slide. The polymer film was vacuum dried overnight and then carefully cut into
approximately 0.3 x 0.3 mm and excess polymer was scraped off. The PFA-S film was
covered with hybridization chamber and tracers (6 µm diameter) in HCl (1M, 0.1M and
0.01M) or phosphate buffer solution (pH = 7, control) were added in the chamber. The
ionic strength of all solutions was adjusted to 1M by adding extra NaCl if necessary. The
optical imaging was performed at 5X magnification.
Figure 2-7. Optical microscope images of PFA-S film pumping away HOOC-PS tracers
(6 µm). (a) Image taken 0 s after exposure to 1 M HCl in deionized water at 25 °C, and
(b) 1200 s after exposure.
(a) (b)

48
Figure 2-7 shows optical images of the pumping by PFA-S film. In accordance
with equation (1), the velocities attained by the tracer particles were noted to be
dependent on the concentration gradient of the formed electrolytes. Accordingly, varying
concentrations of HCl were introduced into the PFA-S system and the HOOC-PS particle
velocities measured for each concentration. In each experiment, 20 randomly selected
particles were tracked using Tracker software for 6 consecutive time-steps of 5 s (120
data points for each distribution plot). As expected, the particle velocities showed an
increase with decreasing pH reaching an average velocity of 3.2 ± 0.8 µm/s in 1 M HCl.
Figure 2-8. Velocity distribution histograms of HOOC-PS tracers as a function of the
acid concentration for the PFA-S pump.
(µm/s)

49
The particle velocities were measured at distances from 100 µm to 200 µm away
from the pump, 0 to 50 s after exposure to acid. The velocity distribution histograms at
each proton concentration, over the specified range of distance and time, are shown in
Figure 2-8. The ionic strength at each acid concentration (1M, 0.1M, 0.01M HCl) was
kept the same at 1M, to avoid any changes to the electric double layer.
Figure 2-9. Velocity distribution histograms of HOOC-PS tracers at 100 to 1100 µm
away from the PFA-S pump upon addition of 1 M HCl to the PFA-S film at 25°C,
demonstrating long range pumping.

50
Further, as expected of a diffusiophoretic pump, the pumping velocities also
showed a dependence on the distance from the pump source. Average particle velocity
was noted to change as a function of distance for the PFA-S pump over the time period
of 0 s to 5 s after exposure to 1M HCl at 25 °C (Figure 2-9). The PFA-S pump is capable
of providing minimum average pumping velocities of 2.0 ± 0.6 µm/s at distances over 1
mm from the pump.
2.6. Photo-Colloidal Diode
Figure 2-10 Schematic depiction of source (PAG)-drain (PFA-S) based colloidal photo-
diode indicating both the rectification and the direction of movement of S-PS particles.
UV

51
In the pursuit to design multiple levels of regulation over colloidal transport, the
two individual pumps were combined to create a source-drain based colloidal photo-
diode which uses UV as the input to regulate the direction and speed of particle
transport. The PAG and the PFA-S were cast into separate films, about 300 µm away
from each other to create an emitter (PAG, proton generator)-collector (PFA-S, proton
consumer) system (Figure 2-10). The experiments were performed on glass surface
using S-PS tracers (2 µm) owing to their high zeta potential and desired direction of
motion: away from PAG and towards PFA-S. This push-pull mechanism was observed to
results in rectification of particle motion.
2.6.1 Experimental Set-Up
PFA-S polymers and PAG were dissolved in dichloromethane (20 mg/mL for
PFA-S, 100 mg/mL for PAG-2). One drop of PFA-S solution was put onto a glass slide
and one drop of PAG solution was put next to PFA-S droplet. The glass slide was
vacuum dried overnight. Then the PFA-S film (drain) and PAG (source) were carefully
cut into approx. 0.3 × 0.3 mm with the distance of approximately 300 µm apart. The
PFA-S/PAG was covered with hybridization chamber and a water suspension of sulfate
tracers (2 µm diameter) was added in the chamber. The videos were captured at 20X
magnification and 30 randomly selected particles were tracked for two consecutive 0.5 s
time-steps at 10 s intervals for 40 s total using tracker software (60 data points every 10
s).

52
2.6.2 Spatial and Temporal Regulation of Colloidal Transport
Before each experiment, a control video was recorded with UV lamp off. The
tracers show no directional movement, only Brownian motion was observed. Upon UV
illumination, the PAG initiated the diffusiophoretic motion pushing the negatively charged
tracers away in all directions (Supporting Video 2-7). When the acid formed by the
photolysis of PAG reached the PFA-S film, it started imine hydrolysis; the PFA-S film
then actively pulls the tracers precisely towards itself, and further enhances the tracer
velocities. As a result, the particle velocities in between the source and the drain were
observed to be much faster than that on opposite sides of either of them. Thus, upon
illumination, the particles began moving away from the PAG slowly and their velocities
steadily increased as they approached the drain; PFA-S. Moreover, the velocities in
between the source and drain were time-dependent owing to the delay in the PFA-S’s
hydrolysis which depends on the diffusion of the acid from the illuminated PAG. Figure
2-11 depicts the spatial and temporal control achieved using the source-drain set-up,
with the particles reaching a maximum average velocity of 3.9 µm/s. Effectively, the
designed colloidal photo-diode is capable of amplifying the velocity, as well as directing
the particle flow in one direction, without introducing a third “base/gate” terminal as
required by a typical transistor. This opens the door to creating more complex colloidal
logic systems.

53
Figure 2-11. Spatial and temporal regulation of velocity (S-PS particles) attained using
the source-drain photo-diode. Distance is measured from edge of the PAG and time is
measured from when the UV is turned on. For velocity vs time plot, distance = 150 µm;
for velocity vs distance, time = 20 s.

54
2.7 Conclusion
In conclusion, this chapter describes a set of smart, self-powered microscale
pumps capable of converting chemical/photochemical energy directly into mechanical
motion. The photo-triggered pump can be turned on and off repeatedly. Moreover, the
design of a colloidal photo-diode26 opens up further avenues to amplify and attain spatio-
temporal control over colloidal transport.
2.8 Acknowledgement
The author acknowledges the role of Hua Zhang in the synthesis of the Schiff’s
base polymer and his help in carrying out the pump experiments with it.

55
2.9 References
Parts of this chapter have been adapted from “Yadav, V.; Zhang, H.; Pavlick, R.; Sen, A. J. Am. Chem. Soc. 2012, 134, 15688-15691”. 1. Paxton, W. F.; Sundararajan, S.; Mallouk, T. E.; Sen, A. Angew. Chem. Int. Ed.
2006, 45, 5420-9. 2. Hong, Y.; Velegol, D.; Chaturvedi, N.; Sen, A. Phys. Chem. Chem. Phys. 2010,
12, 1423. 3. Sanchez, S.; Pumera, M. Chem. Asian. J. 2009, 4, 1402. 4. Mei, Y. F.; Solovev, A. A.; Sanchez, S.; Schmidt, O. G. Chem. Soc. Rev. 2011,
40, 2109. 5. Wang, J. ACS Nano. 2009, 3, 4. 6. Wang, J.; Manesh, K. M Small, 2010, 6, 338. 7. Mirkovic, T.; Zacharia, N. S.; Scholes, G. D.; Ozin, G. A. Small 2010, 6, 159. 8. Ebbens, S. J.; Howse, J. R. Soft Matter, 2012, 8, 3077. 9. Jun, I.K.; Hess, H. Adv. Mat. 2010, 22, 4823. 10. Kline, T. R.; Paxton, W. F.; Wang, Y.; Velegol, D.; Mallouk, T. E.; Sen, A. J. Am.
Chem. Soc. 2005, 127, 17150. 11. Ibele, M. E.; Wang, Y.; Kline, T. R.; Mallouk, T. E.; Sen, A. J. Am. Chem. Soc.
2007, 129, 7762. 12. Pavlick, R. A.; Sengupta, S.; McFadden, T.; Zhang, H.; Sen, A. Angew. Chem. Int.
Ed. 2011, 50, 9374. 13. Zhang, H.; Yeung, K.; Robbins, J. S.; Pavlick, R. A.; Wu, M.; Liu, R.; Sen, A.;
Phillips, S. T. Angew. Chem. Int. Ed. 2012, 51, 2400. 14. Smith, E. J.; Xi, W.; Makarov, D.; Monch, I.; Harazim, S.; Quinones, V. A. B.;
Schmidt, C. K.; Mei, Y.; Sanchez, S. ; Schmidt, O. G. Lab Chip, 2012, 12, 1917. 15. Solovev, A. A.; Sanchez, S.; Mei, Y.; Schmidt, O. G. Phys. Chem. Chem. Phys.
2011, 13, 10131.

56
16. Solovev, A. A.; Smith, E. J.; Bof Bufon, C. C.; Sanchez, S. Schmidt, O. G. Angew. Chem. Int. Ed. 2011, 50, 10875.
17. Tauk, L.; Schröder, A. P.; Decher, G.; Giuseppone, N. Nature Chem. 2009, 1,
649. 18. Deng, G.; Tang, C.; Li, F.; Jiang, H.; Chen, Y. Macromolecules 2010, 43, 1191. 19. Gu, J.; Cheng, W. P.; Liu, J.; Lo, S. Y.; Smith, D.; Qu, X.; Yang, Z.
Biomacromolecules 2007, 9, 255. 20. Wang, C.; Wang, G.; Wang, Z.; Zhang, X. Chem. Europ. J. 2011, 17, 3322. 21. Anderson, J. L. Annu. Rev. Fluid Mech. 1989, 21, 61. 22. Gu, Y.; Li, D. J. Colloid Interface Sci. 2000, 226, 328. 23. Delair, T.; Meunier, F.; Elaissari, A.; Charles, M. H.; Pichot, C. Colloids Surf., A
1999, 153, 341. 24. Bastos, D.; De Las Nieves, F. J. Prog. Colloid Polym. Sci. 1993, 93, 37. 25. Gracia-Salinas, M. J.; Romero-Cano, M. S.; De Las Nieves, F. J. Prog. Colloid
Polym. Sci. 2000, 115, 112. 26. Yadav, V,; Zhang, H.; Pavlick, R. A.; Sen, A. J. Am. Chem. Soc. 2012, 134,
15688-15691.

57
Chapter 3
Bone-Crack Detection, Targeting and Repair Using Ion Gradients
3.1. Introduction
Self-powered nanomotors and pumps are increasingly being explored for
biological applications given the advances in basic motor design and functionality over
the last decade.1-13 Such autonomous devices, requiring no external power supply, offer
a broad range of potential bio-medical applications ranging from targeted drug delivery
to minimally invasive surgeries. Ion gradients can cause diffusiophoretic transport of fluid
and particles and provide a technique for directing movement towards specific targets.
This chapter describes a biological-synthetic hybrid micropump-based strategy for
detection of bone lesions or dental cracks by utilizing the damaged matrix itself as both
the trigger and the fuel. This strategy is also applicable to synthetic surfaces with equal
efficiency, a case in point being the polymer repair system described in the last section
of this chapter. A crack in a mineral-rich material generates ion-gradient driven electric-
fields which can be utilized for active targeting and treatment.
3.2 Motivation
The hybrid approach described in this chapter complements but is orthogonal to
current methods that promote healing by delivery of a therapeutic agent to the bone via
passive diffusion.14-18 The current clinical treatments include systemic anti-resorptive
(bisphosphonates19) or anabolic therapies (parathyroid hormone therapy20), which are
useful for general increase in mineralization and bone strength in patients. However,

58
since bone diseases like osteoporosis vary in degree of degeneration at different
skeletal sites, fractures of vulnerable areas like the hip, spine and wrist are common
even with preventative therapies.21 Consequently, a variety of new targeting strategies to
increase drug delivery to the bone, are currently being investigated and include, for
example environmentally sensitive cleavable linker systems, and fusion proteins or
nanoparticles with bone targeting moieties.22 While these treatments enhance specificity
to bone, mechanisms for active delivery of agents to target sites most at risk for fracture
or of active degeneration remain elusive and are highly desired. Described in this
chapter, is the active detection of ex vivo human bone cracks using charged quantum
dots and strategy for repair, based on the phenomenon of diffusiophoretic motion. The
role of electric fields and ensuing electrophoresis as a mechanism for the directional
movement of motile cells has also previously been illustrated.23
3.3 Generation of Local Electric Fields
The strategy is based on the generation of ion gradients from freshly exposed
mineral surfaces, which results in a local electric field that can be exploited for targeting
and treatment. Bone is a composite material that supports load. It is composed of
collagen and a mineral matrix most closely resembling hydroxyapatite.24 The mineral is
also used in cements for bone repair as well as an implant coating for improved
biocompatibility and integration of medical devices. Hydroxyapatite, at the physiological
pH, undergoes hydrolysis as follows:
Ca10(PO4)6(OH)2 + 12H2O 10Ca2+ + 6H2PO4- + 14OH-

59
A crack in the bone releases ions into the surrounding solution. The large
difference in diffusion coefficients between the cation (Ca2+) and the faster anion (OH-)
[D(Ca2+) = 0.789x10⁻⁵ cm2s-1, D(OH-) = 5.273x10⁻⁵ cm2s-1, D(H2PO4-) = 0.959x10⁻⁵ cm2s-1]
induces a local electric field oriented outwards, away from the crack in the bone surface
(i.e., the ion source). Charged moieties introduced in the system respond to this electric
field undergoing diffusiophoretic motion. As has been described in the previous two
chapters, in an unbounded solution of a symmetrically charged binary electrolyte with a
uniform concentration gradient ∇𝑐𝑐, the diffusiophoretic velocity of a charged particle, U, is
given by Equation 3.1,25
(3.1)
where D+ and D- are the diffusion coefficients of the cation and anion
respectively, Z is the absolute value of the valences of the ions, e is the charge of an
electron, k is the Boltzmann constant, T is the absolute temperature, ε is the dielectric
permittivity of the solution, η is the viscosity of the solution, ζ𝑃𝑃 is the zeta potential of the
particle, γ = tanh(Zeζ𝑃𝑃/4kT), and c0 is the bulk concentration of ions at the particle
location, as if the particle was not there. Typical electric fields generated in
diffusiophoretic systems are 1-10 V/cm, sufficient to cause directed motion of charged
particles. Electric fields of similar magnitude are also known to cause galvanotaxis of
motile cells (reorientation and migration along the direction of the electric field).23
U =𝜀𝜀kT𝑍𝑍𝑅𝑅𝜂𝜂 ��
𝐷𝐷+ − 𝐷𝐷−
𝐷𝐷+ + 𝐷𝐷−� ζ𝑃𝑃 −2kT𝑍𝑍𝑅𝑅 𝜌𝜌𝑙𝑙(1 − 𝛾𝛾2)
∇𝑐𝑐
c0�

60
Figure 3-1. Schematic depiction of ion gradient-induced electric field and the resultant
particle migration. The length of the arrows next to the ions represent their relative
mobilities. The generated electric field points outwards away from the crack.
Accordingly, the negatively charged particles move towards and positively charged
particles move away from the crack.

61
In the described system, anionic or cationic moieties are expected to respond to
the diffusion-induced electric field generated by slow dissolution of hydroxyapatite by
moving towards or away from the source (the crack), respectively (Figure 3-1). The
hypothesis was first tested out by evaluating the mobility of negatively and positively
charged quantum dots in the presence of a cracked substrate.
3.4 Experimental Design
Bone from human tibia and femur, obtained from the Boston medical school were
cut using an IsoMet 3000 (Beuhler, IL) with a diamond metal bonded, wafering blade.
Samples were cut at approximately 500 micrometer thickness at low speed using saline
lubrication bath. Bone samples were stored at 4 °C in saline and washed with DI prior to
analysis. The experimental set-up involved introducing a fluorescent quantum dot
solution into a 9 mm diameter, 0.6 mm thick imaging spacer, covering the cracked
bone/PDMS samples. The quantum dots were 20 nm crystals of a semiconductor
material (CdSe), which are shelled with an additional ZnS semiconductor layer. This
core-shell material is coated with a polymer layer that has –COO- or –NH3+ surface
groups. 10 μL of a 8 μM stock of quantum dot solution was diluted to 500 μL with DI
water. The setup was sealed, inverted and placed on the confocal microscope stage
(Leica TCS SP5 confocal instrument). Ar laser was used for the imaging of the quantum
dots. The fluorescence intensity was monitored at the crack with a 10X objective every
10 min for 2 h following the time taken to set up the experiment (~ 5 min). T = 0 is
defined as the point of initial observation.

62
3.5 Diffusiophoresis led Damage Detection
When the carboxylate-functionalized negatively-charged quantum dots were
added to a freshly cracked bone within the confines of a hybridization chamber and
monitored on a confocal microscope the quantum dot intensity was observed to increase
within the crack, and along its edges due to the expected diffusiophoretic movement
(Figure 3-2a). In contrast, the amine-functionalized, positively-charged quantum dots
move outwards, away from the crack (Figure 3-3a.). Image J software was used for
intensity calculation. The fluorescence intensity was averaged over the entire crack area
and the values obtained from different experiments were normalized (maximum = 1) for
comparison and representation on a common scale.
The experiments were carried out in an inverted set-up, eliminating the role of
gravity in the particle migration. Control experiments were performed by immersing
cracked bone slices in DI water for 3-4 weeks, till no further measurable change in
conductivity was recorded after showing an initial increase of ~15 µS/cm every 10
minutes. When exposed to quantum dot solution no change in intensity was observed in
this case (Figure 3-3c). Marangoni and other non-ionic gradient-driven flows can also
cause active movement of particles.26 However, our observation of opposite directional
migration of positively and negatively charged particles suggest diffusiophoresis to be
the dominant propulsion mechanism.

63
Figure 3-2. Increasing quantum dot intensity within the crack on bone surface (a) and
PDMS surface (b) demonstrating an effective damage detection scheme. Scale bar is 60
µm. Right panel shows calculated intensities inside the damage (averaged over entire
damaged area) for HOOC Q-Dots, amine Q-Dots and control, using Image J software,
for bone surface (c) and PDMS surface (d).

64
The mechanism described above is not surface specific, and its versatility can be
gauged from its effectiveness on synthetic mineral surfaces as well. To generalize the
crack detection mechanism, an artificial system was engineered by embedding
hydroxyapatite in between two 1 mm thick polydimethylsiloxane (PDMS) layers. The
procedure involved mixing PDMS elastomer base with the crosslinker, Sylgard® 184
Silicone Elastomer, in a 10:1 ratio. Then 3 g of this mixture was poured on to a 60 x 15
mm polystyrene Petri-dish and placed in a vacuum desiccator for 30 min. to remove
bubbles from the mixture. The dish was then placed in an oven at 60⁰C for 1 hr. to cure
the PDMS. A thin layer or line of solid hydroxyapatite was added on the PDMS base.
Then an additional 3 g of a mixture of 10:1 PDMS and crosslinker was poured on top of
the hardened PDMS. The coating was then again placed in the vacuum desiccators for
30 min. followed by curing at 60⁰C for 1 hr. The embedded PDMS was then cut out of
the Petri-dish and sealed onto a glass slide using a high frequency generator. A crack
was formed in this “artificial bone” using a scalpel and a similar quantum dot migration
study was performed. As expected, the negatively charged quantum dots migrated
towards the crack, as indicated by the increase in fluorescence intensity (Figure 3-2b),
while the positively charged ones migrated away from the crack (Figure 3-3b). Note that
the rate of ion release in solution is governed by the level of hydroxyapatite incorporation
and the hydrophobicity of the PDMS. Control experiments with a PDMS layer containing
no mineral showed no increase in the quantum dot intensity within the crack over similar
time periods (2 h) (Figure 3-3d). These data establish an effective and versatile crack
detection system utilizing ion gradient-induced electric fields. In principle, any underlying
layer of mineral can be effectively utilized to detect cracks on a surface, as long as the
cation and the anion have significantly different diffusivities.

65
Figure 3-3. Analysis of the crack detection scheme using confocal microscopy. Intensity
study within the crack on bone surface (a) and PDMS surface (b) using amine
functionalized quantum dots. Control images showing no intensity change on bone (c) &
PDMS (d). Scale bar is 130 µm.
20 min 0 min 40 min
0 min 20 min 40 min
0 min 20 min 40 min
0 min 40 min 20 min

66
3.6 Disfussiophoresis Guided Targeted Protein delivery
3.6.1 Fluorescence Microscopy analysis
To further demonstrate the generality and applicability of this approach, the
migration of an anionic protein was evaluated to the bone crack site. Urease enzyme
was chosen since it has an isoelectric point less than the physiological pH. Urease was
tagged with Dylight melamide 550 in 1 mM PBS introduced over the cracked bone
surface, and followed under a confocal microscope using a He-Ne laser for imaging.
Urease (type C-3) was tagged with a thiol-reactive dye, Dylight 550 (ex/em: 557/572).
The reaction of the fluorescence probe (40 μM) with urease (2 μM) was carried out in
150 mM phosphate buffer (pH 7) at room temperature for 4-5 h under gentle stirring. The
enzyme-dye complexes were further purified using membrane dialysis (10 kDa pores) to
reduce free-dye concentration. The number of dye molecules per catalase enzyme
molecule was ~2 as quantified with UV-Vis spectroscopy. Urease was observed to
consistently move towards the crack, increasing the dye intensity within the crack and at
its edges.
3.6.2 Raman Spectroscopy Analysis
In order to further support this finding, Raman data was acquired on the enzyme-
containing bone samples. Control spectra were collected for both the enzyme and the
bone, individually, and overlaid with the bone sample with the deposited enzyme (Figure
3-4). Raman spectra were acquired using a confocal Raman microscope equipped with
a 40 X (NA = 0.6) objective, utilizing a 785 nm diode laser for excitation. A 10 mM

67
solution of urease was introduced on to a cracked bone slice within the confines of an
imaging spacer. After an hour of exposure, the bone slice was taken out of solution and
allowed to air dry. The integration time for each spectrum was 30 sec. The spectra were
recorded by an And Or DV401-BV CCD camera attached to an Acton Research
Corporation SpectraPro-2300i spectrometer using the 600 g/mm diffraction grating. The
characteristic stokes lines for the human bone were identified at 965, 1075 and 1269,
1456, 1669 cm-1, indicating the presence of phosphate, carbonate and amide bonds
respectively (other notable peaks at 862, 596 and 436 cm-1).27 Urease enzyme showed a
broad peak centered around 379 cm-1. The presence of these characteristic peaks from
both the bone and the enzyme was noted in the analyzed sample, indicating the
presence of enzyme at the crack site (Figure 3-4a).
Conclusive evidence of the enzyme migration towards the crack site was noted
upon collection of Raman spectra at increasing distances away from it. Spectra recorded
at the precise crack site displays an intense enzyme peak along with a noticeable
characteristic bone peak (phosphate). As we moved away from the crack (in 20 µm
steps) the ratio of characteristic urease peak to that of bone consistently decreases
indicating the diffusiophoretic motion of the anionic enzyme towards the ion source
(crack) (Figure 3-4b).

68
Figure 3-4. (a) Raman spectra obtained on the bone and enzyme separately, overlaid
with one collected on the bone exposed to the enzyme. (b) Raman spectra at increasing
distances from the crack depicting the preferential enzyme migration towards the crack.

69
3.7 Targeted Drug Delivery
The motion of this self-propelled system was next explored as a targeting
mechanism, such as a drug delivery vehicle, transporting biomaterials to the bone-crack
site. Accordingly, negatively charged, fluorescently labeled poly(lactic-co-glycolic acid)
(PLGA) nanoparticle containing sodium alendronate were prepared and characterized.
3.7.1 Synthesis of Alendronate Nanoparticle
The drug loaded nanoparticles were synthesized by adding 50 mg of
alendronate sodium dissolved in 1mL of deionized water to a mixture of 200mg PLGA
(MW, 44k) and 1 mg Nile red dissolved in 5 mL dichloromethane followed by sonication
of the combined mixture for 2 min. 20 mL of 0.05 g/mL SDS solution was added and
again sonicated for 2 min. Following sonication, 100 mL of deionized water was added
and the solution was allowed to stir overnight, exposed to air to allow evaporation of the
organic solvent. The solution was centrifuged and the resulting pellets re-suspended in 5
mL deionized water and centrifuged again. The pellets were next re-suspended in 1mM
phosphate buffer for analysis and use.
3.7.2 Drug load Calculation
Alendronate concentration was determined by a fluorimetric assay of its complex
with fluorescamine. The PLGA nanoparticles were degraded in 1 M sodium hydroxide for
1 h and then the solution neutralized with 1 M hydrochloric acid. Alendronate was
reacted with fluorescamine in a pH 10 borate buffer. Fluorescence was compared to that

70
of known concentrations of alendronate to determine loading.28, 29 Drug loading of the
particles was found to be 70.3 ± 5.3 %.
3.7.3 Particle Characterization
Drug loaded nanoparticles were imaged by allowing a 10 µL droplet of 1 mg/mL
nanoparticle solution to dry on a silica wafer connected to an aluminum sample stub.
Samples were imaged on a Zeiss SUPRA 40VP (Carl Zeiss Microscopy LLC,
Oberkochen, Germany) field emission scanning electron microscope (FE SEM) using an
accelerating voltage of 2 kV (Figure 3-5).
The hydrodynamic size of the nanoparticles was measured by dynamic light
scattering (DLS) at 25 °C using the Brookhaven Instruments 90 Plus Particle Sizer.
Samples were prepared in 1mM PBS. Hydrodynamic size was based on 5 measurement
Z-average/-effective of intensity-based distribution. The effective diameter was
measured to be ~220 nm
The zeta potential of the nanoparticles was measured using the Brookhaven
Instruments ZetaPALS Zeta Potential Analyzer. The same samples used for DLS size
characterization were used to determine zeta potential. Each sample was subjected to 5
runs each consisting of 20 cycles with auto correction for voltage. The zeta potential of
the particles was measured to be -24.5 ± 1.1 mV.

71
Figure 3-5. Electron microscopy analysis of drug loaded particles: SEM images of
PLGA nanoparticles coated with Au/Pd sputter coating for visualization.

72
3.7.4 Drug Delivery and Cell Proliferation Assay
PLGA is a well-known biocompatible polymer used in medical devices,28 and
sodium alendronate is a bisphosphonate drug used for the clinical treatment of
osteoporosis. The experiments were all performed at the physiological pH in 1 mM PBS
and followed using confocal microscopy. Once again increased fluorescence intensity in
the crack indicated the active migration of the negatively charged drug loaded
nanoparticles towards the crack (Figure 3-6).
Figure 3-6. Increasing fluorescence intensity within the crack indicates active migration
of Nile-red tagged drug loaded PLGA particles to the crack site demonstrating an
effective drug delivery protocol. Scale bar is 100 µm.

73
To confirm that this drug delivery vehicle was indeed capable of delivering an
active agent, an in vitro cell proliferation assay30 was performed with human MG-63 cells
- an immortalized osteoblast cell line. The cells were maintained in Dulbecco’s Modified
Eagle Media supplemented with 10% bovine calf serum and 1% penicillin/streptomycin
in a humidified atmosphere at 37 °C and 5% CO2.30
For the MTS assay, MG-63 cells were plated at a density of 1 x 10⁴ cells/well in
96 well plates. After overnight incubation at 37 °C, the media was replaced with
media/PLGA nanoparticle suspension containing 10-6, 10-8, or 10-10 M sodium
alendronate and the cells were allowed to incubate for 48 hours. Cell viability was tested
using a colorimetric MTS (3-(4,5-dimethylthiazol-2-yl)-5-(3-carboxymethoxyphenyl)-2-(4-
sulfophenyl)-2H-tetrazolium) cell proliferation assay and absorbance read at 490 nm.
Data is expressed in Figure 3-7 as the percentage of optical density relative to medium
alone (control) which is taken as 100%.30
The colorimetric assay utilized, measures increase in cell proliferation, induced
by the drug, signified by increase in optical density. Indeed, an increase in cell density
was observed in cells treated with alendronate as compared to the control, non-treated
group, demonstrating increased cell proliferation and successful release of drug from the
PLGA nanoparticles. The increased cell growth (~10%) was consistent with other
reports30 and the clinical use of alendronate for bone regeneration and repair.

74
Figure 3-7. Proliferation of MG-63 cells treated with PLGA nanoparticles containing 10-6,
10-8 and 10-10 M alendronate for 48 hours, expressed as percentage optical density
relative to the negative control of 100%, using a colorimetric MTS cell proliferation
assay. (Graph expressed as Mean ± SD; Significance (*P < 0.05) compared with
negative control group (medium alone)).

75
3.8 Expansion of the detection and repair technique
The use of ion gradients and in-turn diffusiophoretic motion represents a new
approach to targeting a biological structure that augments current methods that are
focused on primarily biomacromolecular interactions involving small molecules, proteins
and nucleic acids. The above described active, self-propelled particle-based bone crack
detection, drug delivery, and repair strategy requires no external trigger or fuel supply,
and is based on ion gradients. The one challenge with this technique however remained
the high ionic strength that the drug loaded particles would have to withstand within the
body. This presented a major challenge to the in-vivo applicability of the scheme.
However, with the merits of the technique and the applicability of a self-guided technique
in the medical field in mind, the technique was expanded to investigate dental caries and
tooth decays.
3.8.1 Present therapeutic techniques
The presently available treatments to tooth decay or cracks remain inadequate,
similar to the bone lesion issue. Fluoride infused toothpastes or gels offer a remedy,
coating a layer of fluoroapatite on the tooth which is more resistant to acidic
environments, typical in case of bacterial decay. However, the mechanisms by which
fluoride acts on the teeth remain unknown.31 Moreover, less than 50% of the fluoride
actually reaches the target site and the rest is removed from the body. An excess
dosage of fluoride also increases the risk of fluorosis to the patient that is manifested as
joint pain in both upper and lower limbs, numbing and tingling of the extremities, back
pains, and knock-knees.32 Interestingly, tooth is also composed of hydroxyapatite, the

76
same mineral forming bone and therefore the diffusiophoretic mechanism, was applied
to the present problem. The fluorescent imaging was done as before, only this time in
the biologically relevant ionic strengths. Saliva typically has one-third to one half the
ionic strength of serum.33 Ionic strength dependent detection study revealed the
mechanism to be applicable upto ~60 µM salt concentrations. Preliminary testing with
quantum dots (Figure 3-8) gave expected results, with anionic particles leading to
detection.
Figure 3-8: Damage detection in cracked teeth. Negatively charged amine
functionalized quantum dots move in towards the crack leading to an increase in
fluorescence intensity (a) while positively charged carboxyl functionalized quantum dots
move away from the crack leading to decrease in fluorescence intensity (c). Images (b)
& (d) are the bright field images of the tested crack.

77
3.8.2 Detection using FDA approved diagnostic dye
Figure 3-9. (a) Increasing fluorescein intensity within the dental crack in a tooth slice
leads to detection. (b) Fluorescence intensity analysed inside the damage (averaged
over entire damaged area) through Image J.
(a)
0.5
0.6
0.7
0.8
0.9
1
1.1
0 20 40 60 80 100 120 140
Nor
mal
ized
Flu
ores
cenc
e In
tens
ity
Time (s)
(b)

78
Pursuing the biologically relevant theme, a biocompatible diagnostic dye
fluorescein, approved by the FDA for biological imaging in humans34, was used for
detection. The anionic dye, when tested on the confocal fluorescence microscope,
showed accumulation within the crack, enabling detection (Figure 3-9). Once detection
using fluorescein was confirmed on tooth slices, a crack was designed on a whole
human tooth and tested under similar conditions. The detection technique was found to
work well enabling the detection of a minor crack on the tooth (Figure 3-10). In-vivo
testing of the present technique is under way at the Boston Medical School.
Figure 3-10. Damage detection on a whole tooth using fluorescein dye.
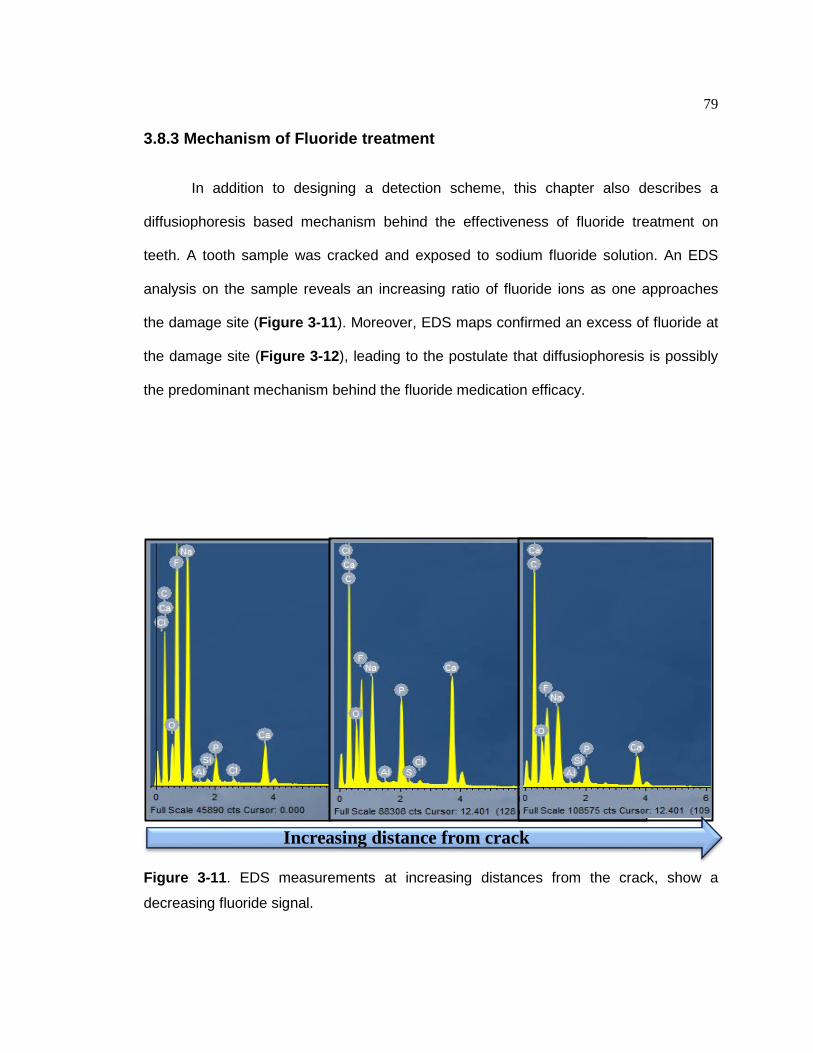
79
3.8.3 Mechanism of Fluoride treatment
In addition to designing a detection scheme, this chapter also describes a
diffusiophoresis based mechanism behind the effectiveness of fluoride treatment on
teeth. A tooth sample was cracked and exposed to sodium fluoride solution. An EDS
analysis on the sample reveals an increasing ratio of fluoride ions as one approaches
the damage site (Figure 3-11). Moreover, EDS maps confirmed an excess of fluoride at
the damage site (Figure 3-12), leading to the postulate that diffusiophoresis is possibly
the predominant mechanism behind the fluoride medication efficacy.
Figure 3-11. EDS measurements at increasing distances from the crack, show a
decreasing fluoride signal.
Increasing distance from crack

80
Figure 3-12. EDS maps generated at the crack site show a heavy deposition of sodium
and fluoride at the crack site. The presence of the crack can be noted by the scarcity of
calcium, phosphate and oxygen at the same site, the primary components of
hydroxyapatite. Scale bar is 400 µm.
Fluoride Sodium
Calcium Phosphate Oxygen

81
3.9 Application on Synthetic Surfaces- Polymer Repair
Another facet of versatility of the described ion gradient generated
diffusiophoretic mechanism is the applicability to a variety of surfaces both biological and
synthetic. This section describes a follow-up of this study on synthetic polymeric
surfaces.
3.9.1. Motivation
Developing methods to detect and repair damage in polymers is an active area of
research.35-47 Many of the previously described methods suffer from the lack of long-term
stability of the reagents, which are typically pre-incorporated into the polymer. Also, they
tend to be specific to certain types of polymeric materials. More recent systems have
utilized supramolecular interactions, photochemistry, and thermal heating to seal
cracks.41-43 However; these systems have long healing times. The ‘ion gradient triggered
motion’ approach was expanded into this domain and a general method for detection
and repair of cracks in polymers was designed. The process consists of embedding the
polymer with a salt that leaches out upon cracking or degradation to the polymer,
thereby powering flows and activating the detection or repair reagents in the fluid.
Detection is possible with fluorescent quantum dots, which aggregate at the crack site.
Repair is shown to occur through two different strategies. The first repair strategy
involves high ionic strength triggered destabilization of oil-in-water emulsions,
transporting polymerization agents, resulting in polymer deposition at damage site. The
second, more biocompatible strategy, involves using an enzyme, urease, and its
catalytic hydrolysis of urea to deposit solid calcium carbonate in the crack. The solution

82
of the detection or healing agent may be added “as needed” thereby overcoming the
problem of reagent instability
3.9.2 Density Driven Flows
After detailed mechanistic studies it was concluded that a salt driven density flow
works more effectively in the given system compared to a directional diffusiophoretic
particle motion. A density driven flow can actively transport active agents to the target
site. The flow occurs when the salt concentration increases sufficiently to cause a local
density change. Such density driven flows are very common in nature at mineral salt
deposits and estuaries. Local fluid density varies with salt concentration, causing flows
dictated by the direction of gravity. 48-52
The samples were prepared in the same manner as described in section 3.5,
only replacing the sparingly soluble hydroxyapatite with the highly soluble calcium
chloride (solubility, 74.5 g in 100 ml at 20°C53). When the surface was cracked, the
calcium chloride dissolved into the supernatant aqueous solution, creating a change in
the local density powering density driven flows. This was confirmed by inverting the
experimental set-up that led to a reversal of flow directions. Moreover, the motion was
observed to be independent of the charge of the motile specie. Both positively and
negative charged particles were led to the damage site with equal speeds. The following
section describes the synthesis of repair agents that get transported to the damage site,
through the triggered flows.

83
3.9.3 Synthesis of repair agents
Two 1 mL centrifuge tubes were filled with 450 μL nanopure H2O and 20 μL oleic
acid. One tube was then filled with 40 μL 5 wt% Grubbs Catalyst, 2nd Generation in
1,1,2-trichloroethane. To the other tube, 40 μL liquid dicyclopentadiene, heated to 43°C,
was added. The tubes were then emulsified for 180 sec each forming the emulsions.
Equal volumes of each emulsion mixture were then added to a container. The separation
of the monomer from the catalyst is itself important; for certain polymerizations occur too
fast to allow adequate mixing of reactants, as is seen in the well-known Grubbs’ ring
opening metathesis system.54-58 The emulsions were tested to be stable for upto 20
hours in low salt concentrations (<0.1M), but underwent immediate destabilization in
higher salt concentrations, thereby being ideal agents for the designed system.
3.9.4 Polymer Repair
As the damaged salt-embedded polymer released ions, density driven flows were
generated. As the flows brought the emulsions over the crack, the high ionic strength at
the damaged site caused the emulsions to break open and aggregate, allowing the
catalyst and reactant to mix. This mixing resulted in polymer formation and deposition at
the crack, repairing the damage. The spacers were then removed after 1 hr, the samples
were washed extensively with DI water, dried and studied with an environmental
scanning electron microscope (ESEM) (Figure 3-13). The samples showed substantial
filling of the crack with polymer deposition centered at the crack. Deposition in the crack
was more uniform in the inverted samples, since the flow at the surface was directed
towards the crack allowing for better delivery of the repair reagents.

84
Figure 3-13. ESEM images of polymer deposition at the damage site. The strategy
works well for both single (a, b) and multiple cracks (c, d). (a, c) The image of cut
polymer with no salt after 1 hr. exposure to emulsions. (b, d) PDMS/CaCl2 after 1 hr.
exposure to emulsions.
500µm 500µm
CRACK 1
CRACK 2
500µm 500µm
CRACK 1
CRACK 2
(a) (b)
(c) (d)

85
Micro AT-IR spectroscopy was used to characterize the polymer deposits. The IR
spectrum showed key peaks for poly-DCPD at 1665 cm-1 and 956 cm-1 for the acyclic
C=C and the acyclic =C-H stretching, respectively.59, 60 A control with the emulsion
solution over a cut in pure PDMS film showed no polymer deposition.
3.9.5 Enzymatic repair
Figure 3-14. Schematic of a surface healing system using a salt/PDMS film. The urease
enzymes (blue) and urea molecules (grey) move over the crack due to density driven
flows. While this occurs, the urea is converted by the urease to carbonate ions
(pH~10.3). The carbonate ions then react with the leaching calcium ions forming solid
calcium carbonate.

86
Having established this polymeric repair strategy, the possibility of a more bio-
friendly approach was explored. The concept involved the addition of a premixed
solution of the enzyme urease (2 µM) and its substrate urea (1 M) to a calcium ion-
leaching crack. At pH 10.3, carbonate ions are formed due to enzymatic hydrolysis of
urea. These carbonate ions would be expected to combine with the leached calcium ions
to deposit calcium carbonate at the crack (Figure 3-14).
A damaged PDMS/CaCl2 system was prepared as before. When the crack in this
system was exposed to a mixture of urease and urea (pH~10.3; a drop of 0.1 M
ammonium hydroxide added to raise the pH.) and left undisturbed for 1 hr, a white
precipitate was observed to deposit at the crack (Figure 3-15a). The precipitate showed
aragonite and calcite like morphology (Figure 3-16a). XRD analysis at the crack site
also confirmed the presence of calcium carbonate, in aragonite and calcite forms
(Figure 3-15b). XRD patterns were collected using PANalytical Empyrean theta-theta
goniometer with Cu-K-alpha radiation, and programmable divergence slit (2 mm, 1.0
degree anti-scatter, specimen length 10mm) and diffracted (2 mm, 0.02 mm nickel filter)
optics in reflection geometry. Data was collected at 45 kV and 40 mA from 5-70 degrees
2-theta using PIXcel 3D detector in scanning mode with a PSD length of 3.35 degrees 2-
theta, and 255 active channels for duration of ~0.5 hr. Resulting patterns were corrected
for both 2-theta and position by comparison to ICDD (calcite PDF #00-005-0586 and
aragonite PDF #00-041-1475) and analyzed with Jade+9 software.
Supporting IR spectra were also collected at the crack site, (Figure 3-16b) to
corroborate the XRD findings. Carbonate vibration bands61 at 1460 cm-1 (symmetric
stretching) and 880 cm-1 (out-of-plane bending) confirmed the presence of the
precipitated carbonate.

87
Figure 3-15. (a) ESEM images showing the control (left) and sample (right) where the
crack was exposed to the urease-urea mixture without and with the underlying calcium
chloride layer, respectively. Scale bar is 100 µm. (b) XRD Analysis of the crack site
confirming the presence of calcite (red bars-standard) and aragonite (blue bars-
standard). The amorphous halo at lower two-theta values is due to PDMS.
(a)
(b)

88
Figure 3-16. (a) SEM image of the precipitated material within the crack showing
aragonite and calcite like morphology. Scale bar is 20 µm. (b) Micro-IR: Carbonate
vibration bands61 at 1460 cm-1 (symmetric stretching) and 880 (out-of-plane bending)
cm-1 confirms the presence of the precipitated calcium carbonate.
(a)
(b)

89
3.10. Conclusion
To conclude, the versatility of the ion- gradient-powered system has been
demonstrated in its ability to perform both crack detection and repair, on a variety of
substrates. Moreover, the designed system enables delivery of nanoparticles, protein,
emulsions, quantum dots, diagnostic dyes with equal efficacy.62 The elimination of the
requirement of an external power source to power the motion makes the system
especially desirable. This chapter describes a system that has practical applicability in
medical diagnostics, polymer and coatings industry.62, 63 The involved methodology is
versatile and the detection and healing solutions can be assembled as needed. Finally,
the method should be useful for coatings on materials that are not easy to remove and
repair. A comprehensive assessment of various salt and polymer combinations and the
effect of salt impregnation on polymer properties are planned. Future systems will also
seek to improve the deposition process and allow for restoration of the polymer
properties.
3.11. Acknowledgements
The author would like to express her gratitude towards Jonathan Freedman for
his help in the synthesis of the drug loaded nanoparticles, providing the bone and teeth
samples, and carrying out the cell proliferation assay. The author would also like to
thank Ryan Pavlick for his valuable contribution on the polymeric repair system.

90
3.12 References
Parts of this chapter have been adapted from “Yadav, V., Freedman, J. D., Grinstaff, M.; Sen, A. Angew. Chem., Int. Ed., 2013, 52, 10997-11001” and “Yadav, V.; Pavlick, R. A.; Meckler, S.; Sen. A. Triggered Detection and Polymer Deposition: Towards the Repair of Microcracks, Chem. Mater., 2014 26, 4647-4652”.
1. Ozin, G. A.; Manners, I.; Fournier-Bidoz, S.; Arsenault, A. Adv. Mater. 2005, 17, 3011-3018.
2. Paxton, W.F.; Mallouk, T. E.; Sen, A. Chem. Eur. J. 2005, 11, 6462-6470. 3. Paxton, W. F.; Sundararajan, S.; Mallouk, T. E.; Sen, A. Angew. Chem., Int. Ed.
2006, 45, 5420-5429. 4. Wang, J. ACS Nano 2009, 3, 4-9. 5. Sanchez, S.; Pumera, M. Chem. Asian J. 2009, 4, 1402-1410. 6. Hong, Y.; Velegol, D.; Chaturvedi, N.; Sen, A. Phys. Chem. Chem. Phys. 2010,
12, 1423-1425. 7. Wang, J.; Manesh, K. M. Small, 2010, 6, 338-345. 8. Mirkovic, T.; Zacharia, N. S.; Scholes, G. D.; Ozin, G. A. Small 2010, 6, 159-167. 9. Mei, Y.; Solovev, A. A.; Sanchez, S.; Schmidt, O. G. Chem. Soc. Rev. 2011, 40,
2109-2119. 10. Yadav, V.; Zhang, H.; Pavlick, R. A.; Sen, A. J. Am. Chem. Soc. 2012, 134,
15688-15691. 11. Sengupta, S.; Ibele, M. E.; Sen, A. Angew. Chem., Int. Ed. 2012, 51, 8434-8445. 12. Patra, D.; Sengupta, S.; Duan, W.; Zhang, H.; Pavlick, R. A.; Sen, A. Nanoscale
2013, 5, 1273-1283. 13. Sengupta, S.; Dey, K. K.; Muddana, H. S.; Tabouillot, T.; Ibele, M.; Butler, P. J.;
Sen, A. J. Am. Chem. Soc. 2013, 135, 1406-1414. 14. Arns, S.; Gibe, R.; Moreau, A.; Monzur Morshed, M.; Young, R. N. Bioorg. Med.
Chem. 2012, 20, 2131-2140. 15. Fleurence, R. L.; Iglesias, C. P.; Johnson, J. M. PharmacoEconomics 2007, 25,
913-933.

91
16. Olszynski, W. P.; Davison, K.S. Expert Opin Pharmacother 2008, 9, 491-498. 17. Wang, D.; Miller, S. C.; Kopeckova, P.; Kopecek, J. Adv. Drug Deliv. Rev. 2005,
57, 1049-1076. 18. Zhang, G. et al Nat. Med. 2012, 18, 307-314. 19. Russell, R. G; Xia, Z; Dunford J. E.; Oppermann, U.; Kwaasi, A.; Hulley, P. A.; et
al. Ann N Y Acad Sci. 2007, 1117, 209–257. 20. Uihlein, A. V.; Leder, B. Z. Endocrinol. Metab. Clin. North. Am. 2012, 3, 507-525. 21. Colón-Emeric, C. Z. J. Am. Med. Assoc. 2006, 296, 2968-2969. 22. Luhmann, T.; Germershaus, O.; Groll, J.; Meinel, L. J. Control Release 2012,
161, 198-213. 23. Allen, G. M.; Mogilner, A.; Theriot, J. A. Curr. Biol. 2013, 23, 1-9. 24. Boskey, A.; Pleshko Camacho, N. Biomaterials 2007, 28, 2465-2478. 25. Anderson, J. L. Annu. Rev. Fluid Mech. 1989, 21, 61-99. 26. Zhao, G.; Stuart, E. J. E.; Pumera, M.; Phys. Chem. Chem. Phys., 2011, 13,
12755-12757. 27. Smith, R.; Rehman, I. J. Mater. Sci.: Mater. Med., 1995, 5, 775-778. 28. Cohen-Sela, E.; Chorny, M.; Koroukhov, N.; Danenberg, H. D.; Golomb, G. J.
Control Release, 2009, 133, 90-95. 29. Ullrich, O.; Reinheckel, T.; Sitte, N.; Hass, R.; Grune, T.; Davies, K. J. Proc. Natl.
Acad. Sci. USA 1999, 96, 6223-6228. 30. Xiong, Y.; Yang, H. J.; Feng, J.; Shi, Z. L.; Wu, L. D. J. Int. Med. Res., 2009, 37,
409-416. 31. Peckham, S.; Awofeso, N. Water Fluoridation: A Critical Review of the
Physiological Effects of Ingested Fluoride as a Public Health Intervention. The Scientific World Journal, Volume 2014, Article ID 293019.
32. Riggs, B. L.; Hodgson, S. F.; O’Fallon, M. W. et al N Engl. J. Med. 1990, 322,
802–809. 33. Boackle, R. J.; Suddick, R. P. Salivary proteins and oral health.; Menaker L., Ed.; Hagerstown: Harper & Row, 1980, p113-131. 34. Mérian, J.; Gravier, J.; Navarro, F.; Texier, I. Molecules 2012, 17, 5564-5591.

92
35. Jin, H.; Mangun,C. L.; Griffin, A. S.; Moore, J. S.; Sottos, N. R.; White, S. R. Adv. Mater. 2014, 26, 282-287.
36. Yue, H. B.; Fernández-Blázquez, J. P.; Beneito, D. F.; Vilatela, J. J. J. Mater.
Chem. A, 2014, 2, 3881-3887. 37. White, S. R.; Sottos, N. R.; Geubelle, P.H., Moore, J.S.; Kessler, M. R.; Sriram, S.
R.; Brown, E. N.; Viswanathan, S. Nature, 2001, 409, 794-797. 38. Kessler, M. R.; Sottos, N. R.; White, S. R. Composites: Part A, 2003, 34, 743-753. 39. Jones, A. S.; Rule, J. D.; Moore, J. S.; White, S. R.; Sottos, N. R. Chem. Mater.,
2006, 18, 1312-1317. 40. Rule, J. D.; Sottos, N. R.; White, S. R. Polymer, 2007, 48, 3520-29. 41. Wu, D. Y.; Meure, S.; Solomon, D. Prog. Polym. Sci., 2008, 33, 479-522. 42. Nosonovsky, M.; Amano, R.; Lucci, J. M.; Rohatgi, P. K. Phys. Chem. Chem.
Phys., 2009, 11, 9530-9536. 43. Wojtecki, R. J.; Meador, M. A.; Rowan, S. J. Nature Mater., 2011, 10, 14-27. 44. Pang, J. W. C.; Bond, I. P. Compos. Sci. Technol., 2005, 65, 1791-1799. 45. Pang, J. W. C.; Bond, I. P. Composites: Part A, 2005, 36, 183-188. 46. Kolmakov, G. V.; Revanur, R.; Tangirala, R.; Emrick, T.; Russell, T. P.; Crosby, A.
J.; Balazs, A. C. ACS Nano, 2010, 4, 1115-1123. 47. Kratz, K.; Narasimhan, A.; Tangirala, R.; Moon, S. C.; Revanur, R.; Kundu, S.;
Kim, H. S.; Crosby, A. J.; Russell, T. P.; Emrick, T.; Kolmakov, G.; Balazs, A. C. Nature Nanotech., 2012, 7, 87-90.
48. Middleton, G. V.; Can. J. Earth Sci., 1966, 3, 523-546. 49. Anderson, R. Y.; Kirkland, D. W. Geology, 1980, 8, 66-69. 50. Devantier, B. R.; Larock, B. E. Int. J. Numer. Meth. Fl., 1986, 6, 241-253. 51. Linden P. F.; Simpson. J. E. J. Fluid Mech., 1986, 172, 481-497. 52. Alavian, V. J. Hydraul. Eng. 1986, 112, 27-42. 53. Lide D. R.; CRC Handbook of Chemistry and Physics, 87th Ed., 8-54. 54. Ben-Asuly, A.; Tzur, E.; Diesendruck, C. E.; Sigalov, M.; Goldberg, I.; Lemcoff, N.
G. Organometallics, 2008, 27, 811-813.

93
55. Monsaert, S.; Vila, A. L.; Drozdzak, R.; Van Der Voort, P.; Verpoort, F. Chem. Soc. Rev. 2009, 38, 3360-3372.
56. Drozdzak, R.; Nishioka, N.; Recher, G.; Verpoort, F. Macromol. Symp. 2010, 293,
1-4. 57. Thomas, R. M.; Fedorov, A.; Keitz, B. K.; Grubbs, R. H. Organometallics, 2011,
30, 6713-6717. 58. Ernst, C.; Elsner, C.; Prager, A.; Scheibitz, B; Buchmeiser, M. R. J. Appl. Polym.
Sci., 2011, 121, 2551-2558. 59. Jeong, Y.; Duncan, B.; Park, M. H.; Kim, C.; Rotello, V. M. Chem. Commun.,
2011, 47, 12077-12079. 60. Dragutan, V.; Dragutan, I.; Dimonie, M., A Selective Route for Synthesis of Linear
Polydicyclopentadiene. In Green Metathesis Chemistry, Dragutan, V.; Demonceau, A.; Dragutan, I.; Finkelshtein, E., Eds. Springer Netherlands: 2010; pp 369-381.
61. Mecozzi, M. et al Analyst 2001. 126, 144-146. 62. Yadav, V., Freedman, J. D., Grinstaff, M.; Sen, A. Angew. Chem., Int. Ed., 2013,
52, 10997-11001. 63. Yadav, V.; Pavlick, R. A.; Meckler, S.; Sen. A. Triggered Detection and Polymer
Deposition: Towards the Repair of Microcracks, Chem. Mater., 2014 26, 4647-4652
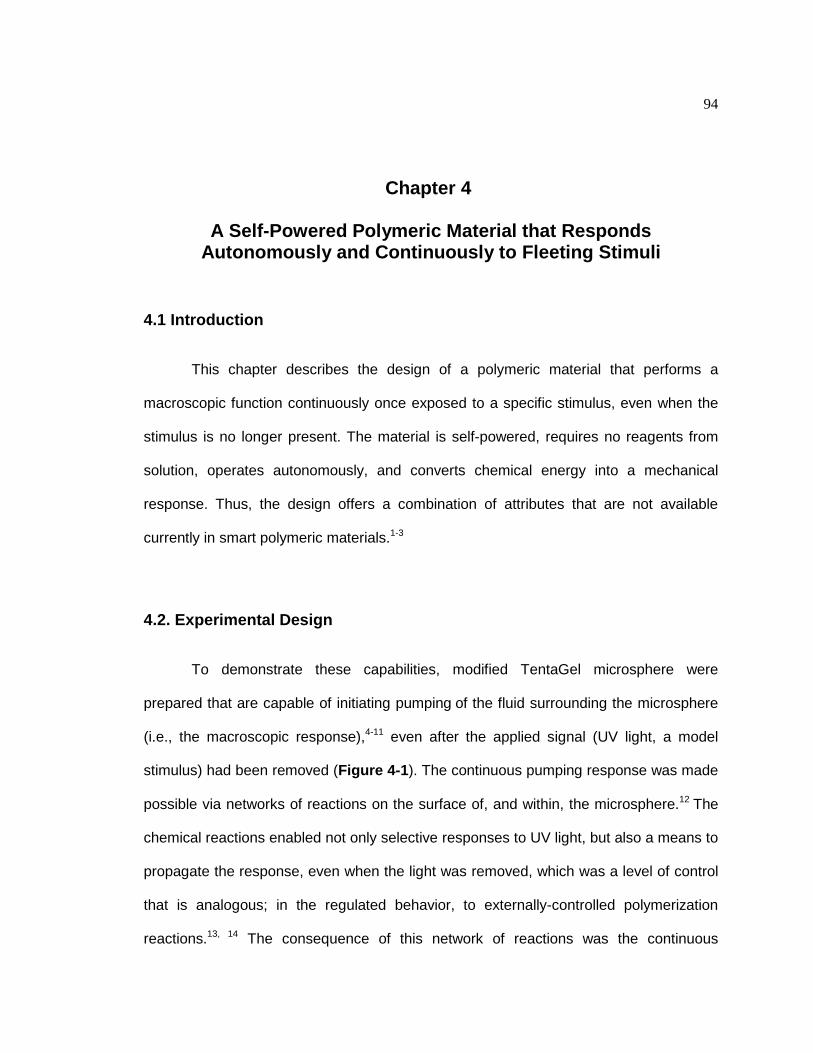
94
Chapter 4
A Self-Powered Polymeric Material that Responds Autonomously and Continuously to Fleeting Stimuli
4.1 Introduction
This chapter describes the design of a polymeric material that performs a
macroscopic function continuously once exposed to a specific stimulus, even when the
stimulus is no longer present. The material is self-powered, requires no reagents from
solution, operates autonomously, and converts chemical energy into a mechanical
response. Thus, the design offers a combination of attributes that are not available
currently in smart polymeric materials.1-3
4.2. Experimental Design
To demonstrate these capabilities, modified TentaGel microsphere were
prepared that are capable of initiating pumping of the fluid surrounding the microsphere
(i.e., the macroscopic response),4-11 even after the applied signal (UV light, a model
stimulus) had been removed (Figure 4-1). The continuous pumping response was made
possible via networks of reactions on the surface of, and within, the microsphere.12 The
chemical reactions enabled not only selective responses to UV light, but also a means to
propagate the response, even when the light was removed, which was a level of control
that is analogous; in the regulated behavior, to externally-controlled polymerization
reactions.13, 14 The consequence of this network of reactions was the continuous

95
production of small molecule products that generate a gradient as they diffuse away
from the microsphere (Figure 4-1). This gradient was then able to induce movement of
the surrounding fluid towards the microsphere (i.e., the pumping response).
Figure 4-1. Schematic depiction of polymer microsphere pump that induces the
movement of fluid that surrounds the pump in response to a specific stimulus, even after
the stimulus has been removed. The blue arrows represent the direction of fluid
movement, and the sizes of the arrows illustrate an approximation of the relative
magnitude of fluid flow when the signal is present or absent. When the UV light is off, a
self-propagating reaction enables the microsphere to continue generating a
concentration gradient of products that drive the pumping response. The signal
transduction reagents (fluoride ion) translate the first reaction with UV light to initiation of
the self-propagating reaction. The byproduct of the reactions (3) is yellow/orange in color
and, thus, turns the microsphere from colorless to yellow to orange over the course of
the pumping response.

96
On the molecular level, the ability of the material to continue performing its
function arose from a self-propagating autoinductive reaction15 that utilized reagents
incorporated directly onto the polymer. This self-propagating autoinductive reaction
amplified the gradient of products, which was similar to the behavior of pumps based on
signal-induced depolymerization reactions.5
For the purpose of this chapter, the activity based reagent, 2-(4-((4-
(Difluoromethyl)-3-methoxyphenylcarbamoyloxy)methyl)-3-nitrophenoxy)acetic acid, will
be referred to as reagent 1, the autoinductive reagent, 3-(3-(tert-Butyldimethylsilyloxy)-4-
((4-(difluoromethyl)-3-methoxyphenylcarbamoyloxy) methyl) phenyl)propanoic acid, as
reagent 2 and 4-amino-2-methoxybenzaldehyde as 3. Both reagents 1 and 2 are grafted
on the microsphere in varying proportions (Figure 4-2a). The activity-based detection
reagent16 detects a pre-defined stimulus by reaction of the stimulus with specific
functionality in the detection reagent. In principle, this activity-based detection reagent
could be exchanged with other functionality to create modular materials that respond to
a variety of fleeting stimuli.16
Reagent 1 is designed to respond to 254 nm to 365 nm light17,18 to release two
equivalents of fluoride, carbon dioxide, 4-aminobenzaldehyde derivative 3, and two
protons (that exist predominantly as as pyridinium ions upon reaction with the solvent
constituent pyridine) (Figure 4-2b). The released fluoride is a signal transduction
reagent that translates the detection event into initiation of a self-propagating reaction.
This self-propagating reaction involves reagent 2, which responds to one equivalent of
fluoride and releases two additional equivalents of fluoride as well as more of 3 and a
proton (exist as pyridinium ions).15,19 The released fluoride is then available to react with
additional equivalents of 2 to continue amplifying the quantity of fluoride, 3, and protons
(exist as pyridinium ions) in the microsphere until all of 2 has been consumed (Figure 4-

97
2c). This self-propagating autoinductive reaction enables the continuous response of the
material, even when the stimulus is removed, since the self-propagating reaction
generates and amplifies an ion gradient and a small molecule gradient (Figures 4-2)
that induce movement of the surrounding fluid.4-11
4.3. Results and Discussion
Both the activity-based detection reagent (1) and the self-propagating reagent (2)
were grafted to the polymeric Tentagel bead (composed of polystyrene and polyethylene
network) bead in a presumed 1:1 ratio. A 1:1 ratio of reagents 1 and 2 was chosen to
ensure that the beads contained sufficient quantities of both reagents to sustain the two
halves of the reaction network, particularly since ~40%−60% of the reactions occur on
the surface of the microsphere12 where diffusion could interfere with the signal
transduction and autoinductive processes. Two control microspheres were prepared as
well using analogous chemistry, one containing 100% of 1 and the other 100% of 2.20

98
Figure 4-2. Structures and reactions of reagents 1 and 2 that are grafted onto a 300 µm-
diameter TentaGel microsphere. (a) A microsphere that contains a 1:1 ratio of reagents
1 and 2. (b) Exposure of this microsphere to UV light causes the activity-based detection
reagent (1) to release fluoride, compound 3, and protons (exist as pyridinium ions). (c)
The released fluoride then reacts with 2 to initiate a self-propagating reaction that
amplifies fluoride, 3, and protons (exist as pyridinium ions). The gradient of these small
molecules causes fluid movement around the microsphere (i.e., pumping). The notation
“n” refers to the number of cycles of the autoinductive reaction in (c).
UV ON
UV OFF

99
4.3.1 Colorimetric Analysis
Before testing whether the microsphere containing both 1 and 2 were capable of
“remembering” its pre-defined stimulus, control experiments were first conducted, to
determine whether the microspheres that contain 2 were capable of supporting the
autoinductive, self-propagating reaction. Treatment of the colorless microspheres with 2
mM cesium fluoride in 10:4:1 isopropanol-water-pyridine for 3 h yielded dark
yellow/orange microspheres (the color of 3) (Figures 4-3a, b). The color change was
caused by 3 being released into solution, a fact that was confirmed by injecting an
aliquot of the reaction mixture into an HPLC connected to a mass spectrometer
(LCMS).20 The time-dependent intensity of the yellow/orange colorimetric response was
quantified by photographing the beads over time (Figure 4-3b) and using image
processing software to measure the intensity of the color in the digital images.15, 19 The
change in color over time reflected the extent of completion of the autoinductive reaction,
and provides a visual indication that the material is performing its function (i.e., pumping,
see below). The resulting sigmoidal response curves based on the intensity of the color
were consistent with an autoinductive reaction (Figure 4-3c).15, 19
The autoinductive behavior of 2, was further verified, by exposing microspheres
containing only 2 to substoichiometric quantities of added fluoride relative to the loading
level of the TentaGel microsphere. Regardless of the quantity of fluoride used to initiate
the autoinductive reaction, all microspheres provided equal levels of color over time,
which is an expected result for a self-propagating reaction. As expected for an
autoinductive reaction, the time to reach completion when the microspheres were
exposed to lower quantities of fluoride was longer than when the microspheres were
exposed to higher quantities of fluoride (Figure 4-3c).

100
Control experiment was also performed on a microsphere containing only 1. In
this experiment, the ability of 1 to respond to UV light when the microsphere was
exposed to 365 nm light for 40 min was tested. As expected, the microspheres turned a
bright yellow/orange color, which was indicative of formation of 4-amino-2-
methoxybenzaldehyde (3), a fact that was verified by LCMS analysis.20
Figure 4-3. Colorimetric response of a TentaGel microsphere that contained 100% of
reagent 2. (a) The procedure for testing the autoinductive, self-propagating reaction that
is mediated by 2. The product of the autoinductive reaction is 3 (Figure 4-2c), which
turns the microspheres a yellow/orange color (b). (c) This color reflects the extent of the
autoinductive reaction,15,19 and can be quantified by photographing the microspheres
and using image processing software to measure the intensity of color. Exposure of the
microspheres to substoichiometric quantities of fluoride (relative to the loading level of
the microspheres) reveals sigmoidal kinetics characteristic of autoinductive
reactions.15,19 Note that the scale of the x-axis changes after the break.

101
Overall, the two sets of control experiments performed on microspheres
containing only 1 or 2 demonstrate that reagents 1 and 2 were capable of performing
their individual functions on a molecular level when grafted to the microspheres.
Whether they were capable of imparting a macroscopic response to the microspheres
was next tested by measuring whether they could induce pumping of the surrounding
fluid. The experiment involved placing the microspheres on a glass slide that was
immersed in 10:4:1 isopropanol-water-pyridine in a closed system and then exposing the
microspheres to UV light.
4.3.2. Stimuli Responsive Pumping Behaviour
The following experimental set-up was designed to the study the pumping
response of the tentagel beads. Microspheres (either functionalized with a 1:1 ratio of
reagents 1 and 2, just reagent 1, or just reagent 2) were exposed to a solution of i-
PrOH/H2O/pyridine (10:4:1 respectively) for approximately 1 h, which allowed them to
swell to a stable size. One microsphere was removed from the solution, placed on a
glass microscope slide and covered with a hybridization chamber. The hybridization
chamber was filled with a solution of 2 µm diameter, amine-functionalized polystyrene
tracer particles suspended in i-PrOH/H2O/pyridine (10:4:1 respectively). To ensure that
the maximum sustainable directional movement of the fluid was measured, the
measurements were made after ~19 min of exposure to UV light. Also, the microspheres
did not move during the pumping experiments. Their density was higher than the
surrounding solvent, therefore they remained on the surface of the glass slide in the test
chamber. The speeds of the tracer particles were measured in the x-direction (the
sphere was located to either the left- or right-hand side of the observation window in all

102
experiments) using the ‘tracker’ software provided by Open Source Physics. The videos
were recorded at 60 fps and the particles were tracked for the last 30 s of each 2 min
observation window.
Figure 4-4. Average pumping speeds caused by TentaGel microspheres exposed to
365 nm light. (a) The pumping action can be switched on and off for a microsphere
functionalized with 1 only (blue data), whereas no pumping was observed for
microspheres functionalized with only 2 (orange data). In contrast, the pumping speed
could be varied (but not turned off) for microspheres functionalized with both 1 and 2 by
turning on and off the UV light (black data). The pumping speeds reflect the averages of
measurements acquired over 30 s intervals that span the length of the data bars. (b)
Continuous pumping also is possible using microspheres that are functionalized with 1
and 2 once the microspheres are exposed to UV light for 20 min. For both (a) and (b),
the average pumping speeds were obtained by tracking the distance that 30 tracer
beads traveled over time.

103
When microspheres containing 100% of 1 were exposed to 365 nm light, the
surrounding fluid displayed directional movement towards the microsphere, as reflected
by the movement of 2 µm-diameter amine-functionalized polystyrene tracer particles
towards the microsphere with an average speed of 4.8 ± 0.3 µm/s (blue data, Figure 4-
4a; Supporting Video 4-1). This directional fluid movement (i.e., pumping) could be
turned on and off repeatedly by switching on and off the UV light exposed to the
microspheres. In contrast, when microspheres containing 100% of 2 were exposed to
365 nm light for 20 min, no directional fluid movement was observed and no switching
behavior was established (orange data, Figure 4-4a; Supporting Video 4-2).
4.3.3 Memory based Pumping in the Absence of Stimuli
Clearly only 1, as anticipated, was capable of responding to the stimulus (UV
light) and inducing a macroscopic response from the materials. However, 1 alone did not
enable the microsphere to “remember” the applied stimulus when the UV light was
removed. For that capability, 2 was introduced to the microsphere to complete the
designed network of reactions (Figures 4-2a). First a baseline pumping speed for the
microspheres containing a 1:1 ratio of 1 and 2 when exposed to 365 nm light for 20 min
was established. In this experiment, directional fluid movement was observed once
again, albeit at a reduced speed of 3.7 ± 0.5 µm/s compared with the microsphere that
contained 100% of 1 (4.8 ± 0.3 µm/s). This reduced pumping speed was to be expected
since the microspheres containing approximately equal quantities of 1 and 2 had less of
1 to react with the UV light than the microspheres containing 100% of 1.
Next, the UV light was cycled on and off, which yielded persistent fluid pumping
during the off cycles for the microspheres containing 1 and 2 (unlike the microsphere

104
containing only 100% of 1), with a pumping speed of 0.28 ± 0.07 µm/s, when the light
was off (black data, Figure 4-4a; Table 4-1; Supporting Video 4-3, 4-4). This 0.28 ±
0.07 µm/s pumping speed arose from the autoinductive reaction mediated by 2, which
was a slower chemical reaction (Figure 4-2c) than the direct photochemical reaction of 1
when the UV light was turned on.17, 18
Perhaps more revealing about the behavior of the microspheres containing 1 and
2 was their ability to respond continuously when they are exposed only once to the
stimulus, rather than periodically (Figure 4-4b; Table 4-2). Specifically, when
microspheres that contained a 1:1 ratio of 1 and 2 were exposed to 365 nm light for 20
min, and then the light was removed, the pumping speed dropped from 3.2 ± 0.3 µm/s to
0.33 ± 0.07 µm/s. This speed was maintained for ~8 min, at which point the pumping
speed began to decrease, likely as a result of consumption of 2 in the microspheres.

105
Table 4-1. Average pumping speeds caused by Microspheres exposed to on and off
cycle of 365 nm light. Speeds and colors correspond to the data represented in Figure 4-4a.
Microsphere Time (min) Speed (µm/s) Standard Deviation
Microsphere functionalized with
reagent 1
19.5-20 4.81 0.32
21.5-22 0.02 0.01
23.5-24 4.41 0.48
25.5-26 0.03 0.01
27.5-28 4.28 0.58
29.5-30 0.02 0.01
Microsphere functionalized with
reagent 2
19.5-20 0.02 0.01
21.5-22 0.02 0.01
23.5-24 0.04 0.02
25.5-26 0.02 0.01
27.5-28 0.02 0.01
29.5-30 0.03 0.02
Microsphere functionalized with a 1:1
ratio of reagent 1 & 2
19.5-20 3.71 0.48
21.5-22 0.28 0.08
23.5-24 3.20 0.66
25.5-26 0.32 0.07
27.5-28 3.45 0.29
29.5-30 0.25 0.07

106
Table 4-2: Average tracer particle speeeds caused by TentaGel microspheres exposed
20 min of continous UV exposure. Speeds correspond to the data represented in Figure 4-4b.
These combined data demonstrated that pumping speeds could be modulated
either by periodic exposure of the material to its pre-defined stimulus, or through fleeting
exposure. More importantly, these results showed that the microspheres continued
pumping even when the signal was removed, which was an unusual capability in the
context of stimuli-responsive materials, and one that was achieved by building into the
material the capacity for a self-propagating reaction.
The motility mechanism discussed thus far in this chapter is based on non-
electrolyte self-diffusiophoresis. The presence of the organic non-polar solvents (i-
PrOH/H2O/pyridine) prevent the formation of an electrostatinc double layer, thereby
generating motion primarily due to a gradient of small molecules.
Microsphere Time (min) Speed (µm/s) Standard Deviation
Microsphere functionalized with a
1:1 ratio of reagent 1 & 2
19.5-20 3.18 0.34
21.5-22 0.33 0.07
23.5-24 0.33 0.08
25.5-26 0.33 0.08
27.5-28 0.30 0.08
29.5-30 0.24 0.07

107
4.4 Difusiophoretic Pumping- Scavenger Design
The aqueous counterpart of the experiments, that would sustain substantial
Debye lengths and thereby allow for diffusiophoretic pumping, was also evaluated. Since
organic solvents were essential for the occurrence of the auto-inductive reaction
(reagent 2) (Figure 4-2c), only microspheres functionalized with reagent 1 were
analyzed. The activity based reagent responded to UV light in an aqueous environment,
generating two ions, two fluoride ions and two protons (absence of pyridine in solution
makes these protons freely available) (Figure 4-2b). The difference in the diffusivity of
the two ions, led to a local separation of charges thereby creating a local electric field
pointing inwards, towards the microsphere. Following a similar experimental set-up as
described in section 4.3.2, the microsphere functionalized with reagent 1 was triggered
using UV light and the induced movement to the surrounding charged tracer particles
was noted. Unlike the previous case with organic solvents, a directional response based
on the charge of the tracers was observed, as expected of a diffusiophoretic mechanism.
Negatively charged amine functionalized polystyrene particles were observed to move
away from the microspheres creating exclusion zones (Figure 4-5a; Supporting Video
4-5), while positively charged carboxyl functionalized polystyrene particles moved
towards and inside the microsphere (Figure 4-5b; Supporting Video 4-6) Moreover, the
positively charged particles moving towards the microsphere were observed to get
trapped within its body. The microsphere containing the trapped particles was frozen in a
sugar solution and cryotomed to expose the interior, and was imaged on an
Environmental scanning electron microscope (Figure 4-6). The images reveal a versatile
scavenger design that is capable of scavenging, in its present design, any positively
charged species.

108
Figure 4-5. Optical microscope images of the microsphere functionalized with reagent 1
alone, triggered with UV light that induces motion to the surrounding (a) negatively
charged polystyrene particles at 5X magnification. A zone of exclusion can clearly be
seen around the microsphere where tracer particles have been pushed away. (b)
Positively charged particles were pulled in towards the microsphere, eventually getting
trapped inside at 20X magnification. The imaged polystyrene particles are each 2 µm in
diameter.
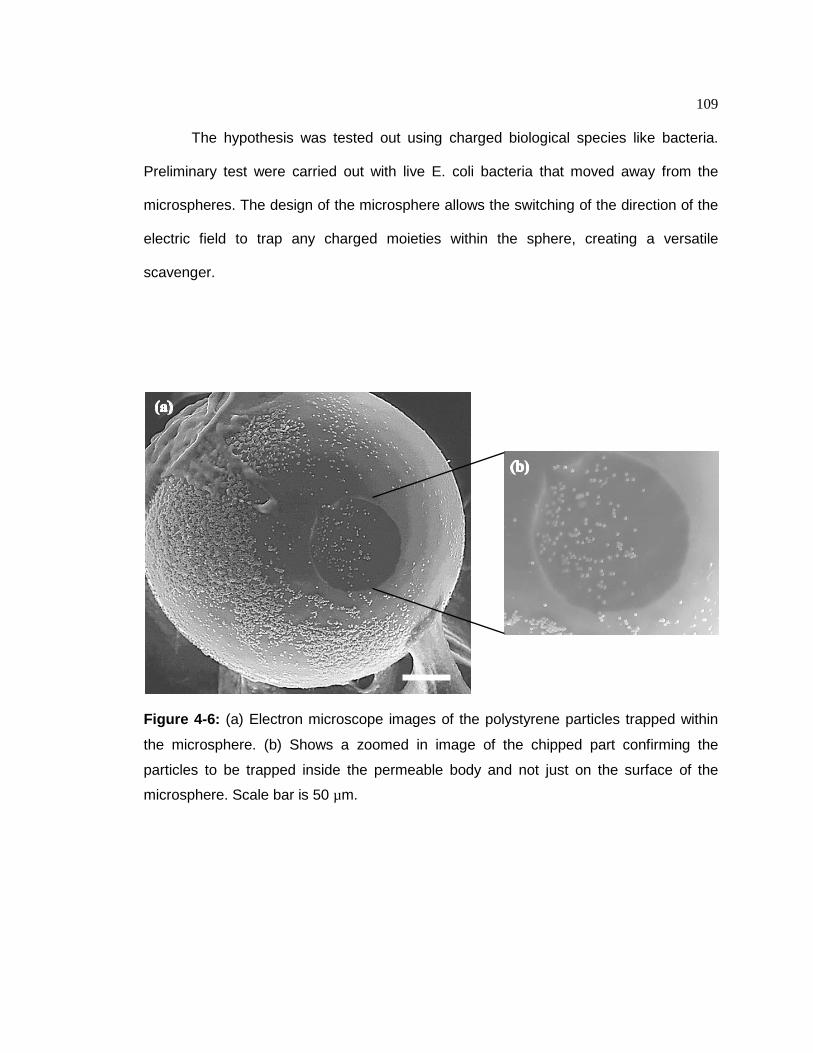
109
The hypothesis was tested out using charged biological species like bacteria.
Preliminary test were carried out with live E. coli bacteria that moved away from the
microspheres. The design of the microsphere allows the switching of the direction of the
electric field to trap any charged moieties within the sphere, creating a versatile
scavenger.
Figure 4-6: (a) Electron microscope images of the polystyrene particles trapped within
the microsphere. (b) Shows a zoomed in image of the chipped part confirming the
particles to be trapped inside the permeable body and not just on the surface of the
microsphere. Scale bar is 50 µm.

110
4.5 Conclusion
In conclusion, this chapter describes a new approach for creating smart, stimuli-
responsive materials that are capable of remembering when they are exposed to a
stimulus, even when the stimulus is no longer present. The proof-of-concept application
to demonstrated in this chapter is a plastic microsphere-based fluidic pump, which is
capable of pumping the fluid surrounding the microsphere in response to UV light, as
well as continuous pumping even when the UV light is removed. The microspheres
provide the continuous pumping without using reagents supplied in solution and without
intervention by the user. Moreover, the pumping speed can be altered in magnitude if
the signal is present or absent, and the microsphere reveal that it is responding to the
signal by turning a yellow/orange color (Figure 4-3), the intensity of which loosely
correlates with the remaining lifetime of the pump (i.e., the quantity of 2 that has been
consumed). This level of autonomous function extends beyond existing smart
materials,1-3 where closely related examples include materials that have a memory for
their original shape,21-25 or have the ability to perpetuate an oscillatory response to an
applied signal using reagents from the surroundings.26-29
The particular application of the above described fluidic pump may prove useful
in a variety of contexts, ranging from collecting and concentrating select agents, to
biological sensing, to directing flow in microfluidic devices in response to specific signals.
Efforts are underway to expand the scope of the autoinductive chemistry that enables
the continuous responses,30-34 and to create other types of stimuli-responsive pumps
with improved response rates and duration of pumping. Parameters to explore in this
context include varying the shape,35 size, loading capacity, and porosity of the polymeric
material, as well as the ratio of reagents grafted to the polymer. More broadly, the

111
chemical concepts described in this chapter may enable the preparation of other types of
stimuli-responsive polymeric materials that perform continuous, macroscopic operations,
other than pumping, when exposed to a fleeting signal.
4.6 Acknowledgements
The author would like to thank Dr. Matthew Baker and Prof. Scott Phillips for
synthesizing and characterizing reagent 1 and 2, and carrying out the colorimetric
analysis.

112
4.7 References
Parts of this chapter have been adapted from “Baker, M. S.; Yadav, V.; Sen, A.; Phillips, S. T. Angew. Chem., Int. Ed. 2013, 52, 10295–10299”
1. Spruell, J. M.; Hawker, C. J. Chem. Sci. 2011, 2, 18–26. 2. Epstein, I. R.; Vanag, V. K.; Balazs, A. C.; Kuksenok, O.; Dayal, P.; Bhattacharya,
A. Acc. Chem. Res. 2012, 45, 2160–2168. 3. Stuart, M. A. C.; Huck, W. T. S.; Genzer, J.; Müller, M.; Ober, C.; Stamm, M.;
Sukhorukov, G. B.; Szleifer, I.; Tsukruk, V. V.; Urban, M.; Winnik, F.; Zauscher, S.; Luzinov, I.; Minko, S. Nature Mater. 2010, 9, 101–113.
4. Laser, D. J.; Santiago, J. G. J. Micromech. Microeng. 2004, 14, R35–R64. 5. Zhang, H.; Yeung, K.; Robbins, J. S.; Pavlick, R. A.; Wu, M.; Liu, R.; Sen, A.;
Phillips, S. T. Angew. Chem., Int. Ed. 2012, 51, 2400–2404. 6. Chang, S. T.; Beaumont, E.; Petsev, D. N.; Velev, O. D. Lab Chip 2008, 8, 117–
124. 7. Chang, S. T.; Paunov, V. N.; Petsev, D. N.; Velev, O. D. Nature Mater. 2007, 6,
235–240. 8. Kline, T. R.; Paxton, W. F.; Wang, Y.; Velegol, D.; Mallouk, T. E.; Sen, A. J. Am.
Chem. Soc. 2005, 127, 17150–17151. 9. Paxton, W. F.; Baker, P. T.; Kline, T. R.; Wang, Y.; Mallouk, T. E.; Sen, A. J. Am.
Chem. Soc. 2006, 128, 14881–14888. 10. Hong, Y.; Diaz, M.; Córdova-Figueroa, U. M.; Sen, A. Adv. Funct. Mater. 2010, 20,
1568–1576. 11. Yadav, V.; Zhang, H.; Pavlick, R.; Sen, A. J. Am. Chem. Soc. 2012, 134, 15688–
15691. 12. McAlpine, S. R.; Schreiber, S. L. Chem. Eur. J. 1999, 5, 3528–3532. 13. Leibfarth, F. A.; Mattson, K. M.; Fors, B. P.; Collins, H. A.; Hawker, C. J. Angew.
Chem., Int. Ed. 2013, 52, 199–210. 14. Neilson, B. M.; Bielawski, C. W. Chem. Commun. 2013, 49, 5453–5455. 15. Baker, M. S.; Phillips, S. T. J. Am. Chem. Soc. 2011, 133, 5170–5173. 16. Cho, D. G.; Sessler, J. L. Chem. Soc. Rev. 2009, 38, 1647–1662.

113
17. Il’ichev, Y. V.; Schwörer, M. A. Wirz, J. J. Am. Chem. Soc. 2004, 126, 4581–4595. 18. Bochet, C. G. J. Chem. Soc., Perkin Trans. I 2002, 125–142. 19. Baker, M. S.; Phillips, S. T. Org. Biomol. Chem. 2012, 10, 3595–3599. 20. Baker, M. S.; Yadav, V.; Sen, A.; Phillips, S. T. Angew. Chem., Int. Ed. 2013,
52, 10295–10299. 21. Lendlein, A.; Jiang, H.; Jünger, O.; Langer, R. Nature 2005, 434, 879–882. 22. Sun, L.; Huang, W. M. Ding, Z.; Zhao, Y.; Wang, C. C.; Purnawali, H.; Tang, C.
Mater. Des. 2012, 33, 577–640. 23. Liu, Y.; Lv, H.; Lan, X.; Leng, J.; Du, S. Compos. Sci. Technol. 2009, 69, 2064–
2068. 24. Luo, X.; Mather, P.T. ACS Macro Lett. 2013, 2, 152–156. 25. Lendlein, A.; Kelch, S. Angew. Chem., Int. Ed. 2002, 41, 2034–2057. 26. Yoshida, R. Adv. Mater. 2010, 22, 3463–3483. 27. Kaminaga, A.; Vanag, V. K.; Epstein, I. R. Angew. Chem., Int. Ed. 2006, 45,
3087–3089. 28. Shinohara, S.; Seki, T.; Sakai, T.; Yoshida, R.; Takeoka, Y. Angew. Chem., Int.
Ed. 2008, 47, 9039–9043. 29. Kuhnert, L. Nature, 1986, 319, 393−394 30. Yeung, K.; Schmid, K. M.; Phillips, S. T. Chem. Commun. 2013, 49, 394–396. 31. Mohapatra, H.; Schmid, K. M.; Phillips, S. T. Chem. Commun. 2012, 48, 3018–
3020. 32. Perry-Feigenbaum, R.; Sella, E.; Shabat, D. Chem. Eur. J. 2011, 17, 12123–
12128. 33. Sella, E.; Weinstain, R.; Erez, R.; Burns, N. Z.; Baran, P. S.; Shabat, D. Chem.
Commun. 2010, 46, 6575–6577. 34. Scrimin, P.; Prins, L. J. Chem. Soc. Rev. 2011, 40, 4488–4505. 35. Jang, S. G.; Audus, D. J.; Klinger, D.; Krogstad, D. V.; Kim, B. J.; Cameron, A.;
Kim, S. W.; Delaney, K. T.; Hur, S. M.; Killops, K. L.; Fredrickson, G. H.; Kramer, E. J.; Hawker, C. J. J. Am. Chem. Soc. 2013, 135, 6649–6657.

114
Chapter 5
Substrate-driven Chemotatic Assembly in Enzyme Cascades
“Aerodynamically, the bumble bee shouldn't be able to fly, but the bumble bee doesn't know it so it goes on flying anyway.”
-Mary Kay Ash
5.1 Introduction
A motor is a machine that consumes energy in some form and coverts it into
mechanical work. Motion is an inextricable part of life and nature has employed several
different chemically-powered motors to sustain life. Some examples of molecular motors
include myosins, dyneins and kinesins, which are known as cytoplasmic motors. These
utilize ATP as their energy source and move on tracks (e.g., microtubules) to achieve
directionality. ATP hydrolysis causes a conformational change that is further amplified
and translated into mobility. In this respect, synthetic motors and pumps are similar to
their biological counterparts. Both expend energy; ATP hydrolysis in one case and
chemical, electrical, or magnetic in the other, and convert it into mechanical motion.
Resemblance can also be seen in the working mechanisms of the two: specifically,
proton gradients cause transport across membranes in living systems, and are also
responsible for the propulsion of bimetallic nanorods and fluid pumping in bimetallic
pumps. A recent study reveals that almost all enzymes, and not just the ones involved in
cytoplasmic motors, are capable of exhibiting motion. Further, they exhibit a rudimentary
form of chemotaxis in the presence of their substrate gradient. This chapter applies this
latest finding into solving the mysteries of enzymatic cascades that have baffled
biologists and enzymologists for a long time.

115
5.2 Motivation
Enzymatic catalysis is essential to cell survival. The interaction between
enzymes in living cells is an area of active research. In many instances, enzymes that
participate in reaction cascades have been shown to assemble in response to the
presence of the initial substrate to facilitate substrate channeling.1, 2 However, what
triggers the enzymes to form metabolons remains an open question. While the
mechanism that brings together enzymes in a cascade to promote substrate channeling
remain unknown, metabolon formation through non-covalent interactions has been
suggested but not demonstrated. The diffusivity of enzymes has been shown to increase
in the presence of their respective substrates in a concentration-dependent manner3, 4
and directional movement of individual enzymes in response to their respective
substrate gradients has been reported. Furthermore, enzymes are known to diffuse over
distances of microns within seconds in living cells.5 This chapter presents an
investigation into a well-known enzyme cascade- glycolysis and the possibility of a
chemotactic response to be guiding the metabolon formation.
5.3 Experimental Design
The sequential catalysis by the first four enzymes of the glycolytic cascade
(Figure 5-1)7, hexokinase (HK), phosphoglucose isomerase (Iso), phosphofructokinase
(PFK) and aldolase (Ald), was examined. A flow-based microfluidic channel was
designed to study the chemotactic enzyme migrations (Figure 5-2). The first and the last
enzyme of this four-step cascade, HK and Ald, were tagged with an amine reactive
(ex/em: 493/518) and a thiol reactive (ex/em: 638/658) Dylight dye, respectively, in order

116
to monitor their movement by confocal fluorescence microscopy. A low dye:enzyme ratio
at 0.4:1 in case of HK and 0.6:1 in case of Ald was maintained in order to not
compromise the enzyme activity. Fluorescence correlation spectroscopy (FCS)
measurements were performed to study the diffusion enhancements for HK and Ald as a
function of their respective substrate concentrations.
7Figure 5-1. The glycolysis cycle. \The first four enzymes, hexokinase (HK),
phosphogluco isomerase (Iso), phosphofructokinase (PFK) and aldolase (Ald) were
examined for their ability to undergo chemotactic assembly.

117
5.3.1 Microfluidic device fabrication
The microfluidic device was cast in polydimethylsiloxane (PDMS, Sylgard 184)
using standard soft lithography protocols.11 A 100-μm deep master pattern was created
on a silicon wafer (Silicon Quest) using SPR-220 resist (Microposit) and deep reactive
ion etching (Alcatel). The master was exposed to 1H,1H,2H,2H-perfluorooctyl-
trichlorosilane to minimize adhesion of PDMS during the peeling step. After the PDMS
was peeled off, the inlet and outlet regions were opened by drilling, and the device was
sealed to a glass coverslip. Fluid flow through the channel was controlled by a syringe
pump, connected by polyethylene tubing to the device.
Figure 5-2. Photo-lithographically fabricated flow based microfluidic gradient generator
for studying enzyme chemotaxis. The length of the channels is either 20 or 40 mm, width
360 μm, and the height is 100 μm. Considering laminar flow, the width of each channel
is 120 µm. Fluorescence intensities were analyzed along a vertical line as shown in the
figure leaving off 20 µm next to the sidewalls.

118
Table 5-1. Distance from the start of the channel converted into time spent inside the
channel for specified channel geometry.
5.3.2 Fluorescent tagging of HK and Ald
Hexokinase (from Saccharomyces cerevisiae) was tagged with an amine-
reactive dye, Dylight 488 (ex/em: 493/518). Hexokinase (44 μM; 15% protein) was
reacted with a threefold excess of the fluorescent probe and 1 M mannose in 50 mM
Hepes (pH 7.0) at 4°C for 2–4 h on a rotator. Aldolase (from rabbit muscle) was labeled
with a thiol-reactive dye Dylight 633 (ex/em: 638/658). Labeling of Aldolase (75 mM;
80% protein) was carried out with two fold excess of the fluorescent dye and 1 mM
EDTA on a rotator at 4°C for 2–3 h in 50 mM HEPES buffer (pH 7.4). The enzyme–dye
complexes were further purified using a Sephadex G-25 (GE Healthcare) size exclusion
column with 50 mM hepes buffer (pH 7.4) to reduce free-dye concentration. The number
Flow rate (µL/h) Distance (mm) Time (s)
50
10 8.6
20 17.3
30 25.9
40 34.6
30
10 14.4
20 28.8
30 43.2
40 57.6

119
of dye molecules per HK or ALD enzyme molecule was ∼0.4 or 0.6, respectively, as
quantified using UV–Vis spectroscopy.
Hexokinase activity before and after attachment of the fluorophore was
measured spectrophotometrically by coupling with glucose-6-phosphate dehydrogenase
and following the reduction of NADP+ at 340 nm. An assay mixture 1 mL in total volume
contained 1 mM glucose, 2 mM ATP, 10 mM MgCl2, 50 mM HEPES (pH 7.4), 0.5 mM
NADP+, 2 units glucose-6-phosphate dehydrogenase, and 5 nM hexokinase. All assays
were performed at 25 °C. The enzymatic activity was not significantly altered by the
attachment of the fluorophore.
Aldolase activity before and after attachment of the fluorophore was also
measured spectrophotometircally by coupling with α-glycerophosphate
dehydrogenase/triosephosphate isomerase and following the oxidation of NADH at 340
nm. An assay mixture 1 mL in total volume contained 2 mM fructose-1,6-disphosphate,
50 mM HEPES (pH 7.4), 0.1 mM NADH, 1.5 units α-glycerophosphate
dehydrogenase/triosephosphate isomerase (based on GDH units), and 50 nM aldolase.
All assays were performed at 25 °C. The enzymatic activity was not significantly altered
by the attachment of the fluorophore.

120
5.3.3 Fluorescence Correlation Spectroscopy
Spectroscopy measurements were performed on a custom-built microscope-
based optical setup, described previously.13 Briefly, a PicoTRAIN laser (High-Q Laser),
delivered 5.4 ps pulses of 532 nm light at 80 MHz frequency. This light was guided
through a fiber optic cable, expanded and directed through an IX-71 microscope
(Olympus), with an Olympus 60×/1.2-NA water-immersion objective. Emitted fluorescent
light from the sample was passed through a dichroic beam splitter (Z520RDC-SP-POL,
Chroma Technology) and focused onto a 50 μm, 0.22-NA optical fiber (Thorlabs), which
acted as a confocal pinhole. The signal from the photomultiplier tube was routed to a
preamplifier (HFAC-26) and then to a time-correlated single-photon counting (TCSPC)
board (SPC-630, Becker and Hickl). The sample was positioned with a high-resolution 3-
D piezoelectric stage (NanoView, Mad City Laboratories).
Fluorescent molecules moving into and out of the diffraction-limited observation
volume induce bursts in fluorescence collected in first-in, first-out mode by the TCSPC
board, which was incorporated in the instrument. Fluctuations in fluorescence intensity
from the diffusion of molecules were autocorrelated and fit by a multicomponent 3D
model to determine the diffusion coefficients of individual species. Fluctuations in
fluorescence intensity from the diffusion of molecules were autocorrelated and fit by a
single component 3D model to determine the diffusion coefficients of individual species.
Contributions to the autocorrelation curve from fluctuations in molecular fluorescence
intensity due to fast processes such as triplet state excitation occur were minimal.
Nevertheless, when the shape of the autocorrelation curve indicated the need to include
the triplet state in the fit, the alternative Equation 5.2 was used.

121
𝑮𝑮(𝝉𝝉) =𝟏𝟏𝑵𝑵
�𝟏𝟏 + �𝟏𝟏𝒘𝒘
�−𝟏𝟏
� �𝟏𝟏 + �𝟏𝟏𝒘𝒘
�𝟐𝟐
�𝝉𝝉
𝝉𝝉𝑫𝑫��
−𝟏𝟏𝟐𝟐
(5.1)
𝑮𝑮(𝝉𝝉) = �𝟏𝟏 +𝑻𝑻
𝟏𝟏 − 𝑻𝑻𝒆𝒆−𝝉𝝉 𝝉𝝉𝑻𝑻� �
𝟏𝟏𝑵𝑵
�𝟏𝟏 + �𝟏𝟏𝒘𝒘
�−𝟏𝟏
� �𝟏𝟏 + �𝟏𝟏𝒘𝒘
�𝟐𝟐
�𝝉𝝉
𝝉𝝉𝑫𝑫��
−𝟏𝟏𝟐𝟐
(5.2)
where N is number of molecules in the confocal volume, w is the structure factor (radius,
r, of confocal volume over its half height), τ is the correlation time, τD is the characteristic
diffusion time (where τD = r2/4D (D is diffusion coefficient), and T is the triplet fraction, τT.
FCS measurements were performed with 30 μW excitation power, and the
optical system (r and w of confocal volume) was calibrated before each experiment
using free Rhodamine 6G (R6G) dye (D = 2.8 × 10⁻⁶ cm2/s in water; (Life Technologies,
CA) in deionized water. Autocorrelation curves were fit to Equation 5.1 or 5.2 using
Levenberg−Marquardt nonlinear least- squares regression algorithm with Origin software
to determine N, T, and τD .

122
Figure 5-3. Fluorescence correlation spectroscopy (FCS) results showing an enhanced
diffusion coefficient for Ald (a) and HK (b) in the presence of their respective substrates.
(a)
(b)

123
As described in Figure 5-3, both HK and Ald exhibited substantial increase in
diffusivity: upto 140% for HK and 230% for aldolase. Note that the reaction catalyzed by
aldolase is endothermic and its substrate-induced enhanced diffusion is, therefore,
inconsistent with the mechanism recently proposed by Bustamante et al.6
5.3.4 Statistical Significance Analysis of FCS data
Diffusion coefficients of each enzyme for each substrate concentration were
entered into a table in Graphpad Prism software. Means and standard deviations were
calculated. After this, an analysis of variance (ANOVA) test was performed followed by
Tukey’s multiple comparisons of means. For HK (Figure 5-3a), all means except for 50
μM were statistically significantly greater than the values at 0 μM substrate. For Ald
(Figure 5-3b) the values at 100 μM and 1000 μM were significantly greater than the
value at 0 uM.
5.3.5 Confocal Microscope Imaging
Confocal images were acquired using a Leica TCS SP5 laser scanning confocal
inverted microscope (LSCM, Leica Microsystems) with a 10X objective (HCX PL APO
CS, 0.70 NA) incorporated in it. The plane of interest (along the z-axis) for confocal
imaging was chosen such that fluorescence intensity was captured from the plane that is
half of the height into the channel.
Videos were recorded and analyzed using Image J software. In each experiment,
the mean fluorescence intensity was calculated from three videos. Each video is a
collection of 667 images. A region of interest (ROI) was selected along the channel (as

124
indicated by the vertical line in Figure 5-2), and the stack-averaged fluorescence
intensity was plotted as a function of distance along the width of the channel.
5.3.6. Detailed Investigation into Hexokinase Chemotaxis Behavior
The various components of the four-step cascade were allowed to flow through
the microfluidic device using syringe pumps to control flow rates. All solutions were
prepared in buffer, i.e. HEPES, 50 mM, pH 7.4. The enzyme concentrations were kept
constant at 200 nM. 2 mM ATP and 10 mM Mg2+ were also added to experiments
involving the two kinases to enable phosphorylation. The initial substrate concentration
was 10 mM, unless specified otherwise. The fluorescently tagged enzymes, HK and Ald
were tracked for their movement transverse to the flow planes in the microfluidic device,
along a vertical line towards the end of the channel as indicated in Figure 5-2. By using
specific flow rates and channel geometry, the distance traversed to the point where
fluorescence was measured was converted into time spent inside the channel (Table 5-
1). The fluorescence measured from top to bottom along the vertical line is plotted from
left to right in all the fluorescence figures shown. The fluorescence intensity was
normalized (maximum = 1) for comparison and representation on a common scale.
5.3.7 Substrate Triggered Chemotaxis
The ability of the individual enzymes in the cascade to chemotax up the gradient
of their respective substrates was first established. Accordingly, the chemotaxis of HK in
competing gradients of its substrate D-glucose and the corresponding enantiomer, L-
glucose, which is not a substrate, was tested. The volumetric flow rate was fixed at 200

125
µL/h and fluorescence was noted 30 mm down the channel, allowing a total interaction
time of 6.48 s. Three sets of experiments were performed. HK was allowed to flow
through the middle channel with either buffer solution (control), D-glucose (10 mM) and
buffer, or L-glucose (10 mM) and buffer flowing through the two flanking channels. As
shown in Figure 5-4, the spreading of HK into the buffer only and L-glucose channels
was comparable. On the other hand, there was a significantly enhanced migration of HK
into the D-glucose channel, suggesting a chemotactic movement towards its substrate
beyond what is expected for Brownian diffusion as has previously been observed for
urease, catalase, RNA and DNA polymerases.3, 4, 6

126
Figure 5-4. Chemotactic response observed for hexokinase (HK). HK shows
chemotactic shift only in presence of a gradient of its substrate, D-glucose (D-Glu) and is
unaffected by the presence of L-glucose (L-Glu). Also, hexokinase shows a greater
chemotactic shift towards its substrate of choice D-glucose (D-Glu) compared to
mannose (Mann) which it phosphorylates at a significantly lower rate. Experimental
conditions: Starting enzyme concentration = 200 nM (100%) Flow rate = 200µl/h,
distance = 30 mm, interaction time = 6.48 s; Percentage of enzyme migration into the left
D-glucose channel is 4.59 ± 0.4 % and towards the right D-glucose channel is 4.54 ± 0.3
%. Percentage of enzyme migration into mannose channel is 2.85 ± 0.5 %. Inset on the
top and bottom shows a clearer migration towards preferred channels. Note that the
percent enzyme migration into adjoining buffer channels due Brownian diffusion alone is
~ 2%.

127
5.3.8 Binding Affinity VS Turnover Rate
To confirm the role of substrate turnover in the observed enhanced chemotactic
movement, HK was presented a choice between its usual substrate, D-glucose and
another competitive substrate, mannose. HK shows a higher binding affinity towards
mannose (Km = 40 µM) compared to D-glucose (Km = 120 µM); on the other hand,
pyruvate kinase/lactose dehydrogenase coupled assays for HK activity confirmed
mannose phosphorylation to be half as fast as D-glucose phosphorylation (see section
5.3.9 for details). As before, three sets of experiments were performed at the same flow
rate. HK was allowed to flow through the middle channel with either a buffer solution
(control), D-glucose (10 mM) and buffer, or mannose (10 mM) and buffer flowing through
the flanking channels. A significantly greater chemotactic shift was observed towards the
D-glucose channel compared to the mannose channel (Figure 5-4) suggesting that
catalysis, rather than simple substrate binding, is important for the observed chemotaxis.
5.3.9 Enzyme activity assays
The difference in hexokinase activity using glucose or mannose as the substrate
was measured spectrophotometrically by coupling with pyruvate kinase/lactic
dehydrogenase and following the oxidation of NADH at 340 nm. An assay mixture 1 mL
in total volume contained 1 mM glucose or mannose, 2 mM ATP, 10 mM MgCl2, 3.3 mM
phosphoenolpyruvate, 50 mM HEPES (pH 7.4), 0.2 mM NADH, 2 units pyruvate
kinase/lactic dehydrogenase (based on PK units), and 5 nM hexokinase. All assays were
performed at 25 °C. The enzymatic activity of hexokinase with mannose as the substrate
was approximately half the enzymatic rate with glucose as the substrate.

128
5.3.9 Investigation into Aldolase Chemotaxis
Experiments were also performed to probe the chemotactic movement of Ald
towards its own substrate: fructose 1,6-bisphosphate. Varying concentrations of the
substrate were tested: 1µM, 10µM, 100µM and 1mM. Once again, three sets of
experiments were performed. The enzyme, Ald, was allowed to flow through the middle
channel with buffer (control) and varying concentrations of its substrate in buffer flowing
in the adjoining channels. A chemotactic shift was observed when a solution of Ald was
exposed to 100 µM or higher concentration of fructose bisphosphate (Km = 60 µM) in an
adjoining channel. The response was obsrved to increase with increasing substrate
concentration.
5.3.10 Why Chemotaxis? Enhanced Diffusion Model
Chemotactic movement of the enzyme molecules towards higher substrate
concentrations can arise from substrate concentration-dependent enhanced diffusion, as
demonstrated previously.3, 4, 7 The substrate concentration changes continuously as the
enzyme diffuse along the substrate gradient. Thus, at every point in space, the diffusivity
increases on moving up the gradient and decreases on moving down the gradient. A
higher diffusivity leads to a greater spreading of the enzyme molecules on the side of the
higher substrate concentration. Thus, the “center of gravity” of the enzyme ensemble
moves towards the region of higher substrate concentration. Detailed modeling based on
substrate-induced enhanced diffusion predicted chemotatic shifts similar to those
observed, thereby supporting the above hypothesis.

129
5.3.11 Inadequacy of the Diffusion Model to Explain Chemotaxis
While the above experiments involved enhanced enzyme diffusion towards
regions of higher substrate concentration, it is also possible to prevent the normal
diffusional spreading of enzymes and force them to focus into a narrower region in
space in response to the presence of the substrate. As shown in Figure 5-5 and Figure
5-6, the spreading of HK from the middle to the flanking buffer channels was significantly
reduced when the buffer solution is substituted by a solution of D-glucose in the middle
channel. Moreover, while HK in buffer spreads into adjoining substrate channels, when
glucose is introduced within the HK channel, chemotaxis towards adjoining substrate
channels was again restricted and resembled HK behaviour towards flanking buffer
cahnnels (Figure 5-7). If a purely diffusion model was to hold true, this constriction
should not have been seen.
Although the experiment involving competition between mannose and D-glucose
for HK suggested a dominant role for catalysis in the observed chemotatic movement,
substrate binding itself can also cause enzymes to preferentially locate themselves in
regions of higher substrate concentrations.9 If the chemical potential of the enzyme-
substrate complex is lower than that of enzyme + substrate, then the enzyme would be
located in (thermodynamically favorable) regions of higher substrate concentration.
Indeed, active transport in response to chemical potential gradients has been reported
for nanoparticles, polymers, and dendrimers.

130
Figure 5-5. Substrate-induced enzyme focusing. The normal diffusional spreading of HK
(1 µM) towards the flanking channels that contain buffer is reduced if the composition in
the middle channel is switched from HK in buffer to HK in 70 mM D-glucose. The net
reduction in area is 13.4 ± 3.0%. Experimental conditions: Flow rate = 100µl/h, distance
= 18 mm, interaction time = 7.78 s.

131
Figure 5-6. Cofactor-induced enzyme focusing. The enzyme (1 µM) switches from an
equilibrium distribution to a non-equilibrium one when cofactors ATP (50 mM) and MgCl2
(100 mM) are introduced in the middle channel. This is analogous to reported cellular
responses in the cytosol where enzyme association is regulated by oxygenation and
phosphorylation requirements. Experimental conditions: Flow rate = 30 µl/h, distance =
19 mm, interaction time = 24.7 s.

132
Figure 5-7. Restricted chemotaxis in the absence of substrate gradient. The normal
diffusional spreading of HK (200 nM) towards the flanking substrate channels is reduced
if the substrate is also introduced within the middle channel flowing the enzyme.
Experimental conditions: Flow rate = 100 µl/h, distance = 20 mm, interaction time = 8.64
s.

133
5.4. Enzyme Cascade Investigation
Having demonstrated that individually both enzymes, HK and Ald, chemotax up
the gradient of their respective substrates, the behavior of the entire four enzyme
cascade was then examined. The first experiment was designed to examine the
response of Ald towards its substrate, fructose 1,6-bisphosphate (FBP), generated from
D-glucose by the successive actions of the first three enzymes. In a microfluidic device,
the Ald was allowed to flow through the middle channel. The first three enzymes, HK, Iso
and PFK, with Mg2+ and ATP (required by the kinases) were passed through one of the
flanking channels, along with 10 mM D-glucose, while buffer was passed through the
flanking channel on the opposite side. The setup allowed Ald an equal opportunity to
migrate towards either or both of the flanking channels (Figure 5-8a). The volumetric
flow rate per inlet was fixed at 50 µL/h, allowing a total interaction time of 17.3 seconds
in a 20 mm channel. 8.1 ± 0.9 % of Ald was observed to spread into the channel in
which its substrate was being formed in situ (Figure 5-8b). When the interaction time
was reduced to 8.6 s, the chemotactic migration correspondingly reduced to 4.5 ± 1.0 %.
As expected, HK did not show any movement into the adjoining channel (Figure 5-9a).
Additional control experiments were performed by removing either enzyme 2; Iso,
enzyme 3; PFK, or D-glucose from the channel containg HK, Mg2+ and ATP. In each
case, Ald showed no chemotactic shift (Figure 5-9b).

134
Figure 5-8. (a) Experimental set-up to study the chemotactic response of Ald (green
channel) towards the channel that generates its substrate in situ. (b) Fluorescence
intensity measured across the channels plotted against the width of the channels. The
dotted lines represent the approximate center channel boundaries. When compared to
Ald’s movement towards buffer, the enzyme shows enhanced migration into the channel
that generates its substrate in situ. (c) Experimental set up that allows the entire
enzymatic reaction cascade to occur in-situ. Substrate (D-glucose) for enzyme 1, HK
(red channel), was provided in the middle channel to trigger the cascade. (d) Ald (green
bars) shows time-delayed chemotactic response compared to HK (red bars) as expected
based on the sequence of reactions. When mannose was introduced along with D-
glucose, HK shows reduced chemotaxis (orange bars) corresponding to slower rate of
mannose phosphorylation.

135
Figure 5-9. (a) While Ald chemotaxes towards its substrate gradient (Figure 5-8b), HK
flowing along with its substrate in its own channel, shows no movement into the adjacent
channel. (b) Control experiments performed for studying the chemotactic response of
Ald towards its substrate precursors. Ald shows no movement towards the channel
flowing the recipe for its substrate when any one of the ingredients is missing.
0
0.1
0.2
0.3
0.4
0.5
0.6
0.7
0.8
0.9
1
0 20 40 60 80 100 120 140 160 180 200 220 240 260 280 300 320 340
Nor
mal
ized
Flu
ores
cenc
e In
tens
ity
Distance across channel (µm)
Buffer-Ald-Substrate precursors (HK) at 8.6 s
Buffer-Ald-Substrate precursors (HK) at 17.3 s
(a
0
0.1
0.2
0.3
0.4
0.5
0.6
0.7
0.8
0.9
1
0 20 40 60 80 100 120 140 160 180 200 220 240 260 280 300 320 340
Nor
mal
ized
Flu
ores
cenc
e In
tens
ity
Distance across channel (µm)
Buffer-Ald-Substrate precursorw/o glucose
Buffer-Ald-Substrate precursorw/o Iso
Buffer-Ald-Substrate precursorw/o PFK
(b)

136
5.4.1 Cascade In-situ
After establishing the basic outline of the chemotactic assembly of the four-
enzyme cascade, the sequential chemotactic movement of HK and Ald when exposed to
D-glucose was examined. This is expected since D-glucose is the immediate substrate
for HK, while the substrate for Ald, fructose 1,6-phosphate, is only formed from D-
glucose through three successive enzymatic steps. The components of the cascade
were now separated into two batches consisting of the first two and the last two
enzymes, respectively. HK, ATP, Mg2+, Iso were flowed through one flanking channel,
while PFK, ATP, Mg2+, Ald were flowed through the other flanking channel. A solution of
D-glucose passed through the middle channel (Figure 5-8c). The flow rate was reduced
to 30 µL/h and the channel length was increased to 40 mm, allowing for a total
interaction time of 57.6 s within the channel. A reaction progress simulation (see section
5.4.2) was run to ensure the time was enough for the entire cascade to occur, given the
enzyme concentrations and the Kcats.
5.4.1.1 Progress Curve Simulation
The substrate depletion and product formation through the first four enzymes in
the glycolytic cascade were simulated using Global Kinetic Explorer software (version
4.0, KinTek Corporation).12 The steady-state reaction scheme assumed 1) substrate
binding rates at the diffusion limit for glucose binding to hexokinase since the initial
glucose concentration was sufficient to saturate the enzyme, and at kcat/Km for the
subsequent enzyme reactions because the substrates were the product of the previous
enzyme reaction and their concentrations did not reach the level of saturation; 2)

137
irreversible reaction rates fixed at kcat for each enzyme since the product of each
reaction would be pulled through the cascade by the presence of the downstream
enzymes preventing the reverse reaction or product inhibition; and 3) that product
release was not rate limiting for any individual reaction. The simulation input values were
10 mM for the starting glucose concentration; 74 nM for each starting enzyme
concentration; k1 = 1000 µM-1s-1 and kcat = 315 s-1 for hexokinase; kcat = 408 s-1 and Km =
700 µM for isomerase; kcat = 113 s-1 and Km = 30 µM for PFK; and kcat = 5 s-1 and Km =
60 µM for aldolase. The simulation assumes that all the enzymes and glucose are
combined in one reaction mixture; an enzyme concentration of 74 nM was chosen
because that is the amount of hexokinase determined to migrate into a channel
containing 10 mM D-glucose (Table 5-2). The progress curves from the simulation
indicated that the 100 µM threshold concentration of fructose 1,6-bisphosphate, the
substrate for aldolase, could be produced under the experimental conditions to promote
the migration of the enzyme up the substrate concentration gradient.
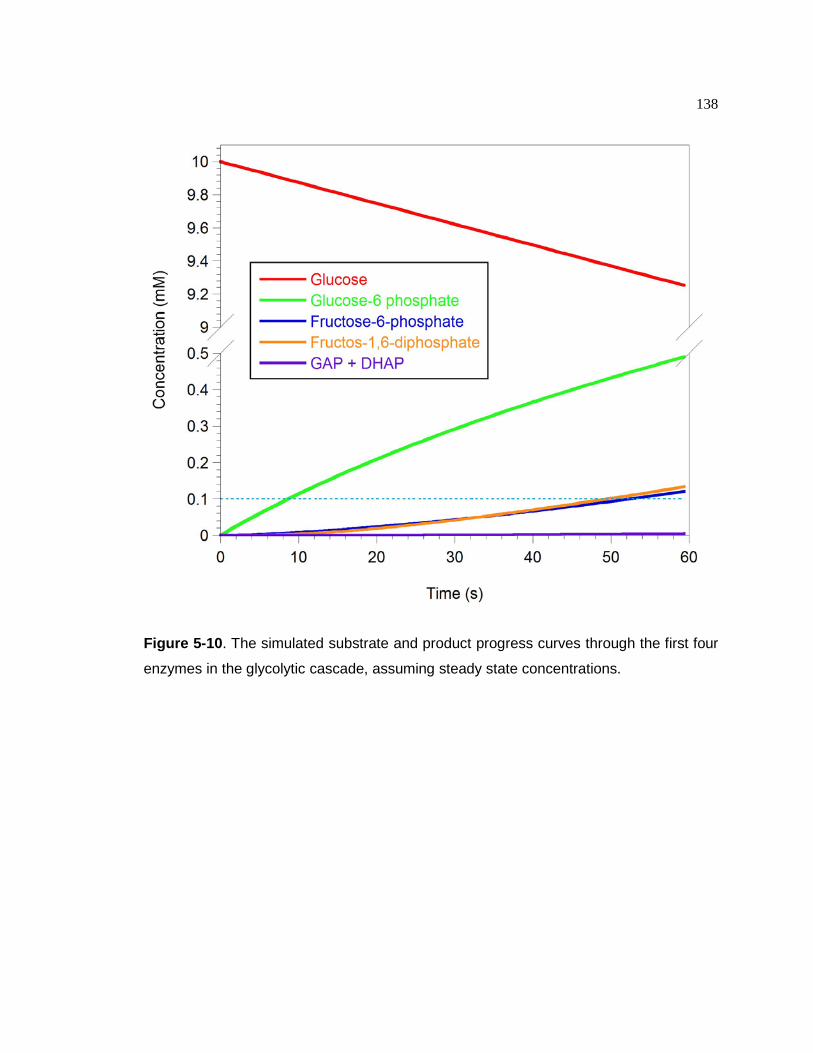
138
Figure 5-10. The simulated substrate and product progress curves through the first four
enzymes in the glycolytic cascade, assuming steady state concentrations.

139
As described above, the examination of the enzyme reaction rates confirmed that
the time available within the microchannel was sufficient for entire cascade of reactions
to occur (Figure 5-10). As discussed, hypothesis being tested was that HK would
respond first to its substrate gradient by moving into the D-glucose channel, thereby
producing the substrate for enzyme 2, Iso. The cascade would continue with PFK
participation, finally producing fructose 1,6-bisphosphate that in turn should prompt Ald
to chemotax towards the central channel. The fluorescence profiles for enzymes HK
and Ald were noted at different interaction times, 14.4 s, 28.8 s, 43.2 s and 57.6 s and
their chemotactic behavior is summarized in Figure 5-8d. As expected, a clear
sequential movement of HK, followed by Ald towards the central channel was observed.
5.4.2 Competitive Substrates
The above experiment was repeated, except that the solution of D-glucose (10
mM) in the middle channel was replaced by a solution consisting of D-glucose (10 mM)
and its competitive substrate, mannose (10 mM), which has a higher binding affinity but
reacts more slowly than glucose (see above). As shown in Figure 5-8d, HK now showed
a smaller chemotactic shift towards the central channel and no significant shift of Ald
was observed because of the slowing down of the reaction cascade that originates from
glucose (mannose phosphorylation does not initiate the glycolysis cascade).
5.5. Chemotaxis and Metabolons
For both HK and Ald, a linear relationship was observed between fluorescence
intensity and concentration (Figure 5-11). This allowed the estimation of the amount of

140
enzyme that had chemotaxed into a specific substrate channel. The results for the four
enzyme cascade experiment involving sequential movements of HK and Ald (Figures 5-
8c-d) are tabulated in Table 5-2. For HK, the results indicate that, in 58 sec, 37 % of the
starting 200 nM enzyme moves into the central channel containing D-glucose (10 mM)
compared to 7 % of the enzyme moving into the same channel when flowing only buffer
(see Table 5-2).
Figure 5-11. Linear relationships between fluorescence intensity (arbitrary units) and
concentration for both HK and Ald. This enables directly correlating fluorescence
intensity to the concentration of enzyme.

141
Table 5-2. Concentration of enzyme (HK or Ald) migrated into the central channel
(containing either buffer only or 10 mM D-glucose + buffer) at specified time periods (see
Figure 5-7c). The starting concentration of both enzymes was 200 nM.
Enzyme Time (s)
Enzyme conc. in buffer channel (% of 200 nM)
Enzyme conc. in glucose channel
(% of 200 nM)
HK
14.4 2.6 ± 0.7 12.1 ± 3.8
28.8 3.8 ± 1.6 19.6 ± 3.7
43.2 5.0 ± 0.4 28.5 ± 0.3
57.6 6.7 ± 1.3 37.0 ± 3.0
Ald
14.4 2.9 ± 0.4 3.6 ± 0.8
28.8 3.4 ± 1.0 5.1 ± 1.4
43.2 5.0 ± 2.0 7.4 ± 0.6
57.6 5.9 ± 1.0 8.9 ± 0.7

142
5.5.1. Chemotaxis in Cytosolic Conditions
Finally, to replicate the cytosolic crowding conditions that enzymes encounter in
cells due to the presence of other macromolecules, 20% w/v Ficoll PM 70 was added to
the experiments involving the entire cascade. Ficoll PM 70 is a highly branched
polysaccharide polymer that serves as a synthetic crowding agent by affecting the fluid
properties of the solution, such as increasing the viscosity and osmolality.10 As shown in
Figure 5-12, the presence of the crowding agent slowed down but did not stop the
chemotactic movement and assembly of the enzymes.
Figure 5-12. D-glucose gradient-driven sequential movement of HK and Ald for the
entire enzymatic reaction cascade was observed even in Ficoll PM 70 (20% w/v)
induced crowded environment mimicking cytosolic crowding conditions in cell. Ald (red
bars) shows a time delayed chemotactic migration towards substrate channel compared
to HK (blue bars) corresponding to the cascade reaction sequence. The error bars
represent the standard deviation.
0
2
4
6
8
10
12
1 2
% E
nzym
e C
once
ntra
tion
Time (s)
HK in glucose channel
Ald in glucose channel
43.2 57.6

143
5.6 Conclusion
The results discussed above, suggest that the observed assembly of enzymes
participating in a cascade in response to the presence of the initial substrate is a direct
result of enzymes undergoing chemotaxis in response to their specific substrates. The
extent of enzyme migration is proportional to the exposure time to the substrate gradient.
Significantly, the chemotactic migration of enzymes is fairly rapid even under conditions
that mimic cystolic crowding: > 0.5 microns/sec, a rate very similar to that reported for
enzyme diffusion in living cells.5 This mechanism obviates the need for direct interaction
between the enzymes to form complexes that promote substrate channeling.
Furthermore, the enzymes should revert back to their equilibrium distribution, once the
initial substrate is completely reacted and the substrate gradients for the individual
enzymes disappear. Evidence presented in this chapter suggest that enzymes in a
cascade assemble via chemotaxis. Each of the enzymes involved independently follows
the gradient of its own specific substrate, which in turn is produced as a product of the
preceding reaction. The chemotactic assembly of enzymes occurs even under cytosolic
crowding conditions. Sequential directional migration of enzymes participating in the
glycolysis cascade is observed in response to the initial substrate, D-glucose.
5.7 Acknowledgements
The author would like to thank Dr. Michelle Spiering and Prof. Stephen Benkovic
for their guidance with the enzyme tagging experiments, and sharing their insights on
enzyme catalysis. The author also expresses her gratitude towards Xi Zhao and Prof.
Peter Butler for their help with the fluorescence correlation spectroscopy measurements.

144
5.8 References
1. An, S.; Kumar, R.; Sheets, E. D.; Benkovic, S. J. Science 2008, 320, 103-106. 2. Percival Zhang, Y.-H. Biotechnology Advances, 2011, 29, 715-725.
3. Sengupta, S.; Dey, K. K.; Muddana, H. S.; Tabouillot, T.; Ibele, M. E.; Butler, P. J.;
Sen, A. J. Am. Chem. Soc.2013, 135, 1406-1414. 4. Sengupta, S.; Spiering, M. M.; Dey, K. K.; Duan, W.; Patra, D.; Butler, P. J.;
Astumian, R. D.; Benkovic, S. J.; Sen, A. ACS Nano 2014, 8, 2410-2418. 5. Baum, M.; Erdel, F.; Wachsmuth, M.; Rippe, K. Nature Comm. 2014, 5,
doi:10.1038/ncomms5494. 6. Riedel, C.; Gabizon, R.; Wilson, C. A. M.; Hamadani, K.; Tsekouras, K.;
Marqusee, S.; Presse´, S.; Bustamante, C. Nature, 2015, 517, 227-230. 7. Karp, G. Cell and Molecular Biology: Concepts and Experiments. Wiley, New
York, 2009, 5, 108. 8. Yu, H.; Jo, K.; Kounovsky, K. L.; De Pablo, J. J.; Schwartz, D. C. J. Am. Chem.
Soc., 2009, 16, 5722-5723. 9. F. Wu, L. N. Pelster, S. D. Minteer, Chem. Commun., 51, 1244-1247 (2015). 10. Vopel, T.; Makhatadze, G. I. PLOS One, 2012, 7, 1-6. 11. Xia, Y.; Whitesides, G. M. Annu. Rev. Mater. Sci.1998, 28, 153−184. 12. Johnson, K. A.; Simpson, Z. B.; Blom, T. Anal. Biochem. 2009, 387, 20-29. 13. Gullapalli, R. R.; Tabouillot, T.; Mathura, R.;Dangaria, J. H.; Butler, P. J. J Biomed
Opt. 2007, 12, 014012. 14. Muddana, H. S.; Sengupta, S.; Mallouk, T. E.; Sen, A.; Butler, P. J. J. Am. Chem.
Soc. 2010, 7, 2110-2111.

145
Chapter 6
Bringing discipline into enzyme motors
6.1. Introduction
The discovery of synthetic motors and pumps in 2004 opened up new avenues
for nanoscale transport that held other broader implications in the field of artificial
intelligence. Chapters 1, 2, 3 and 4 of this thesis discuss specific applications of such
systems in microfluidics, medical therapy, encoded-healing materials, and memory-
encrypted smart materials. More recently motor like behavior of non-motor proteins, in
the form of chemotaxis towards substrates, has been demonstrated. These naturally
occurring biological motors present new opportunities for designing an innovative class
of organic-synthetic-hybrid nanomachines. However, further investigation is needed to
fully understand the origins of the enzyme motor behavior, in order to design future
systems. This chapter focusses on developing an understanding of the genesis of
enzymatic chemotaxis by testing enzyme behavior in different environments.
6.2 Motivation
Diffusion of enzymes like urease, catalase, DNA polymerase etc. towards higher
substrate gradient has previously been reported.1 This phenomenon, defined as diffusion
based chemotaxis, is observed due to higher enzyme diffusivity in the substrate.
However, further investigation is needed to comprehend this behavior entirely and
compare with the better studied bacterial chemotaxis.2, 3 This chapter focusses on better

146
understanding the phenomenon by investigating enzyme behavior in complicated
environments and investigating the role of binding vs catalytic turn-over.
6.3. Experimental Design
A flow based microfluidic gradient generator was fabricated, similar to the
one described in chapter 5. The microfluidic device was a three inlet, one outlet device,
fabricated through photo-lithography that consisted of three parallel channels, 20 mm in
length, 100 µm height and 360 µm in width (Figure 6-1).
Figure 6-1. Photo- lithographically fabricated flow based microfluidic gradient generator
for studying enzyme chemotaxis. The length of the horizontal channels is 20 mm, width
360 μm and height is 100 μm.
Fluorescence measurement
S E
S + I

147
6.3.1 Test Subject 1: Catalase
The first enzyme investigated was catalase. Catalase is a robust enzyme with a
high Kcat of 105 s-1. Also, sodium cyanide is known to inhibit catalase in a competitive
manner. 4μM catalase enzyme was prepared and tagged with NHS-Rhodamine dye, 10
mM H2O2 was prepared as the substrate (S) and 0.1 M sodium cyanide solution in 10
mM peroxide solution as the substrate-inhibitor mix (S+I). All solutions were made in DI
water since catalase is best deactivated by cyanide in water. The S and S+I solutions
were passed through the two extreme inlets and fluorescently tagged enzyme through
the middle inlet as shown in Figure 6-1. For the control experiment, substrate was
passed through both extreme inlets with the tagged enzyme in the middle. The flow rate
was maintained at 200 μl/h. Lower flow rates ~50 μl/h increase the bubble formation,
due to oxygen release, as a result of the peroxide decomposition by catalase. A confocal
microscope was used to track the fluorescently tagged enzyme; along the vertical line
shown in Figure 6-1, and the data was analyzed using image J software, in the same
manner as described in chapter 5. As shown in Figure 6-2, a shift in fluorescence
intensity was observed towards the substrate gradient and away from the inhibitor
gradient. For the control experiment, the fluorescence intensity remained largely
centered across the channel. In other words, the enzyme diffusion was equal towards
both substrate channels as expected.
The lateral shift observed at half maximum fluorescence intensity, in Figure 6-2,
was comparable to previously reported substrate driven chemotaxis shift for catalase
~13 μm.1 The presence of the inhibitor restricted the enhanced migration of the enzyme
into the substrate channel.

148
Figure 6-2. Shift in fluorescence intensity observed for catalase. The enzyme diffuses
away from the inhibitor (NaCN) and towards the substrate (H2O2) (Note the blue graph’s
shift towards left when compared to the control (red)).
0
0.1
0.2
0.3
0.4
0.5
0.6
0.7
0.8
0.9
1
0 50 100 150 200 250 300 350
Nor
mal
ized
fluo
resc
ence
inte
nsity
Distance across channel (µm)
H2O2-catalase-H2O2in NaCNH2O2-catalase-H2O2

149
6.3.2 Test Subject: Urease
A similar study was then conducted for urease enzyme. 1 M urea was prepared
as the substrate and 1 mM pyrocatechol in 1 M urea was prepared as the S+I solution.
Urease was tagged with dylight malemide 550 dye (Thermo Scientific). All solutions
were made in PBS buffer (saline, pH 7.2). However, no shift was observed in case of
urease (Figure 6-3). The reason for this is postulated to be the incomplete inhibition of
urease. Pyrocatechol inhibits urease in a time and concentration dependent manner.4 It
reacts with urease to first convert to an intermediary that finally inactivates urease by
attacking the cysteine units at the active site. Given the dimensions of the microfluidic
device, the inhibitor gets only 4.32 seconds to deactivate or inhibit the enzyme. While
this time may be sufficient for cyanide to finish its job, pyrocatechol is unable to do so
resulting in a fluorescence profile similar to the control, i.e. no observed shift.

150
Figure 6-3. No shift in fluorescence intensity observed for Urease. Pyrochatechol is
unable to completely inhibit urease within the 4.32 s in the microfluidic channel, due to
the slow inhibition rate. As a result, no shift is observed.
0
0.1
0.2
0.3
0.4
0.5
0.6
0.7
0.8
0.9
1
0 50 100 150 200 250 300
Nor
mal
ized
Flu
ores
cenc
e In
tens
ity
Distance across channel (µm)
Urea-Urease-Urea inCatechol
Urea-Urease-Urea

151
Hence, in order to study urease’ chemotactic behavior, a new microfluidic
gradient generator was designed that could elongate the diffusion process. Agar gel has
previously been reported to be utilized to study DNA chemotaxis.5 Keeping this strategy
in mind, a diffusion based microfluidic gradient generator was then designed. After
testing several designs, the pattern shown in Figure 6-4 was found to work best. This
microfluidic device consists of two adjacent reservoirs, one for S and the other for S+I,
separated by a wall. These two were connected to a third chamber that stored the
fluorescently tagged enzyme.
Figure 6-4. Diffusion based microfluidic gradient generation device designed using
Adobe illustrator, printed on acrylic surface using a CO2 laser printer and then cast on
PDMS using soft lithography.
S + I

152
Both the S and the S+I chambers were 2 mm in diameter and the enzyme
chamber 1 mm, connect by two 2 mm wide channels. 1% agar gel (prepared in PBS
buffer, saline, pH 7.2; the same solvent as that used to prepare the rest of the solutions)
was first introduced in the device to allow the substrate and inhibitor solutions to diffuse
slowly through it. This helps to study the diffusion for a longer time period and enables
pyrocatechol to inhibit urease effectively. About 20 µl of S and S+I was injected into their
respective channels and left undisturbed for about 10 minutes, to allow the gradient to
build. Finally about 10 µl of dye tagged urease was introduced in its chamber and
allowed to slowly diffuse through the agar-buffer bed into the connected channels for 4-5
hours. The recorded fluorescence was then analyzed using image J software (Figure 6-
5, 6-6).

153
Figure 6-5. Normalized fluorescence intensity measured across the substrate and
substrate + inhibitor channels in the microfluidic device. (a) The fluorescence intensity
within substrate (urea) and the S+I (urea + catechol) channel. The enzyme diffuses
much faster and further into the substrate channel compared to the S+I channel. In case
of S+I channel most of the enzyme concentration (fluorescence maxima) stays close to
the starting position. (b) Control experiment performed contained the substrate urea in
both reservoirs and the fluorescence intensity indicates similar enzyme diffusion in both
channels.
0.0
0.1
0.2
0.3
0.4
0.5
0.6
0.7
0.8
0.9
1.0
0 500 1000 1500 2000 2500
Nor
mal
ized
Flu
ores
cenc
e In
tens
ity
Distance (µm)
0 hrs
2 hrs Catechol
2 hrs Urea
(a)
0
0.1
0.2
0.3
0.4
0.5
0.6
0.7
0.8
0.9
1
0 500 1000 1500 2000 2500
Nor
mal
ized
Flu
ores
cenc
e In
tens
ity
Distance (µm)
0 hrs
4 hrs-urea1
4 hrs-urea2
(b)

154
Figure 6-6. Normalized fluorescence intensity measured across the substrate and
substrate + inhibitor channels in the microfluidic device over 5 hours. The fluorescence
intensity within the (a) substrate (urea) and (b) the S+I (rea + catechol) channel. The
enzyme diffuses much faster and further into the substrate channel compared to the S+I
channel. In case of S+I channel most of the enzyme concentration (fluorescence
maxima) stays close to the starting position.
0
0.1
0.2
0.3
0.4
0.5
0.6
0.7
0.8
0.9
1
0 500 1000 1500 2000 2500
Nor
mal
ized
Flu
ores
cenc
e In
tens
ity
Distance (µm)
(a)
0
0.1
0.2
0.3
0.4
0.5
0.6
0.7
0.8
0.9
1
0 500 1000 1500 2000 2500
Nor
mal
ized
Flu
ores
cenc
e In
tens
ity
Distance (µm)
(b)
0 hrs 3 hrs 5 hrs
0 hrs 3 hrs 5 hrs

155
6.4 Results and Discussion
The enzyme diffused into the substrate channel, indicated by the shifting
fluorescence maxima; whereas in case of the inhibitor channel, the fluorescence
maximum stays largely at the starting position. The hydrodynamic radii (a) of the
diffusing species are: urease- 7 nm6, 7, urea- 0.18 nm8, pyrocatechol- 0.39 nm9. Taking
the viscosity of 1% w/w agar gel to be 4 X 10⁻³ Pa-s10, the diffusion coefficient of urease
in the gel at 298 K is calculated (using D= kT/6Πηa) to be 0.78 X 10⁻¹¹ m2/s. Using this D
value, the average distance (L) urease diffuses in 5 hrs is calculated (using L2 = 2Dt) to
be 515 μm, urea: 3208 μm and pyrocatechol: 2180 μm. The enzyme diffusion in both
channels is noted to be significantly higher. The presence of the substrate in the
channels enables the enhanced diffusion observed. Some diffusion by the enzyme is
also seen in the S+I channel as expected, it however does not cross the channel into the
S+I chamber. The modest spreading of urease into the S+I channel could simply be due
to the slight pull experienced by it due to the faster diffusion of urea compared to
pyrocatechol from the S+I solution. The enzyme’s inhibition to travel further ahead in the
channel could possibly be attributed to its sensing the presence of the inhibitor.
Pyrocatechol, once bound on the enzyme, alters its structure, thus preventing it to
interact any more with the substrate i.e. urea. The results confirm that a combination of
substrate and inhibitor solution could be used to restrict or alter the enzyme motor. Also
urease’ ability to sense a substrate gradient and diffuse towards it over time is
comprehensively proved (Figure 6-5a, Figure 6-6a).
Another set of control experiments performed with urease being exposed to a
gradient of buffer in both reservoirs. The enzyme diffuses ~1400 µm into along the buffer
channels, as expected of Brownian diffusion (Figure 6-7).

156
Figure 6-7. Normalized fluorescence intensity measured in the buffer channel over time.
Only Brownian diffusion is observed.
6.5 Conclusions
The results discussed in this chapter open new avenues towards controlling the
motion of ‘the enzyme motor’. The presence of an inhibitor along with a substrate
gradient was observed to restrict the motility allowing for regulated motion. This
observation has been demonstrated on both catalase and urease in both flow based as
well as diffusion based gradient generating microfluidic devices respectively. This
indicates towards the generality of imposing an inhibitor gradient to control a wide variety
of ‘enzyme motors’. The experimental results, such as competitive binding events, also
widen the mechanistic understanding of the phenomenon of chemotaxis itself. Future
studies are planned with hydroxyurea, a structural analog of urea that functions as a
reversible and competitive inhibitor to urease; unlike pyrocatechol. While urease binds
0
0.1
0.2
0.3
0.4
0.5
0.6
0.7
0.8
0.9
1
0 500 1000 1500 2000 2500 3000
Nor
mal
ized
Flu
ores
cenc
e In
tens
ity
Distance (µm)
0 hrs8 hrs12 hrs

157
reversibly to hydroxyurea, it is not turned over. A comparison of enzyme’s chemotactic
response towards hydroxyurea versus urea could help gain important insights into the
role of binding versus catalysis.
Preliminary fluorescence correlation spectroscopy (FCS) results on hexokinase
with increasing substrate concentration without the presence of cofactors- ATP and
MgCl2 shows an increase in diffusion coefficient of the enzyme. These results suggest
that reversible binding without catalytic turn over could also lead to enhanced diffusion.
The future experiments planned with urease that investigate its chemotactic response
towards hydroxyurea over urea, in other words, reversible binding over catalysis, would
shed new light on the process.

158
6.6 References
1. Sengupta, S.; Dey, K. K.; Muddana, H. S.; Tabouillot, T.; Ibele, M. E.; Butler, P. J.; Sen, A. J. Am. Chem. Soc. 2013, 135, 1406−1414.
2. Adler, J. Annu. Rev. Biochem. 1975, 44, 341-356. 3. Tso, W. W.; Adler, J. J. Bacteriol. 1974, 118, 560. 4. Kot, M.; Zaborska, W. J. Enzyme Inhib. Med. Chem. 2003, 18, 413–417. 5. Yu, H.; Jo, K.; Kounovsky, K. L.; De Pablo, J. J.; Schwartz, D. C. J. Am. Chem.
Soc. 2009, 131, 5722–5723. 6. Follmer, C.; Pereira, F. V.; Da Silveira, N. P.; Carlini, C. R. Biophys. Chem. 2004,
111, 79–87. 7. Muddana, H. S.; Sengupta, S.; Mallouk, T. E.; Sen, A.; Butler, P. J. J Am Chem
Soc. 2010, 132, 2110–2111. 8. Schultz, S. G.; Solomon, A. K. J. General Physiology, 1961, 44, 1189-1199. 9. Rudyk, R. A.; Molina, M. A. A.; Gómez, M. I.; Blanco, S. E.; Ferretti, F. H. Internet
Electronic Journal of Molecular Design, 2004, 3, 11–28. 10. Folger, R.; Weiss, L.; Glaves, D.; Subjeck, J. R.; Harlos, J. P. J. Cell Sci., 1978,
31, 245-257.

159
Chapter 7
Conclusions
“Science never solves a problem without creating ten more” - Geroge Bernard Shaw
This thesis describes the new developments in the field of artificial
nanomachines powered predominantly by ion gradient led diffusiophoretic nanoscale
motion. Viable applications of this motion have been elucidated in each chapter. First,
regulation of colloidal transport for microfluidic based lab on chip style devices is
demonstrated. On/off switchability, pH-controlled motion and photo-triggered rectification
and amplification of colloidal transport are significant advances in this field.
Secondly, ion gradients generated from damaged mineralized substrates like
bone lesion or cracked polymers, have been shown to transform the damaged
substrates into power-houses generating remedies to cure themselves. The biological-
synthetic-hybrid micropump powers motion that allows repair agents to track and reach
the damage site.2 The ability to repair on-site, at ambient temperatures, without the use
of an external power source like electric or magnetic field has powerful implications in
medicine and coatings industry. The versatility of the approach allows easy quick-fix
applications for a variety of problems.
Thirdly, ion gradients have also been demonstrated to design smart materials
that show signs of memory; a level of autonomous function that extends beyond existing
smart materials. Diffusiophoretic motion generated from an engineered polymeric
material is used an example to demonstrate continuous pumping response, even in the
absence of the model stimuli; once triggered. The design of the material allows for

160
fabricating pre-programmed materials that could respond to a variety of stimuli, thus
satisfying an array of applications.
Finally, new insights are presented on the substrate gradient driven enzyme
motor-the next generation of biological-synthetic-hybrid-nanomachine. The ensemble
behavior of the enzyme motor- chemotaxis, i.e. preferential movement up a substrate
gradient, has been used to unravel the mystery of enzymatic cascades in cells. The
sequential directed movement of enzymes in the glycolysis cascade towards each other,
driven by the chemotactic response of the individual enzymes to their respective
substrate gradients is described. The latest data shines new light on the novel
phenomenon that is still not completely understood. While catalytic conversion being a
necessary and overriding factor generating chemotaxis is comprehensively proved, the
new data leaves the enhanced diffusion model insufficient to explain the observed
substrate driven enzyme focusing.
The endeavor to gain mechanistic insights into chemotaxis continues into chapter
6, where the role of (inhibitor) binding is again observed to be moderated by catalytic
conversion. Further investigation continues into studying other factors such as, the role
of temperature gradients by examining a temperature driven chemotaxis in the absence
of substrate gradients. Also, investigations into enzyme orientation driven chemotaxis is
being undertaken. At the same time, theoreticians are working in tandem to model the
unique phenomenon based on new experimental observations.
In conclusion, substantial progress has been made into unravelling the
phenomenon of chemotaxis and the baton has been passed to Xi Zhao for conquering
the mystery.
VITA
Vinita Yadav
Education Ph.D. Chemistry, The Pennsylvania State University GPA 3.9/4.0 M.S. Chemistry, University of Delhi First Class B.S., Chemistry, University of Delhi First Class with Honors
Awards and Honors • Young Investigator award, Baxter International, 2014• Miller Fellowship, The Pennsylvania State University, 2014• Invited Speaker, Gordon research conference, 2014• Very Important Paper, Angewante Chemie, 2013• Noteworthy Paper, Angewante Chemie, 2013• Selected for Leadership Workshop at Georgia Tech., NSF, Summer 2013• Travel Award, The Pennsylvania State University, Fall 2012, Spring 2014• Graduate Fellowship, The Pennsylvania State University, 2011-2012• Merit Award, University of Delhi, 2006• Gold Medalist, University of Delhi, 2004• Merit Award, University of Delhi, 2004
Publications
1. Yadav, V.; Zhang, H.; Pavlick, R.; Sen, A. J. Am. Chem. Soc., 2012, 134, 156882. Yadav, V.; Freedman, J.; Grinstaff. M.; Sen, A. Angew. Chem. Int. Ed., 2013,
52, 109973. Baker, M. S.; Yadav, V.; Sen, A.; Phillips, S. T. Angew. Chem. Int. Ed., 2013,
52, 10295
4. Yadav, V.; Duan, W.; Sen, A. invited book chapter, Engineering of chemicalcomplexity, 2014 Ed. (Edited by 2007 Chemistry Nobel Laureate Gerhard Ertl)
5. Yadav, V.; Pavlick, R. A.; Meckler, S.; Sen. A. Chemistry of Materials, 2014, 26,4647
6. Duan, W.; Wang, W.; Das, S.; Yadav, V.; Sen, A. Annual Review of AnalyticalChemistry, accepted, 2015
7. Yadav, V.; Duan, W.; Sen, A. Annual Review of Biophysics, accepted, 2015
8. Yadav, V.; Spiering, M., Zhao, X.; Scott, J.; Linderberg, K.; Gilson, M. K.; Butler, P.J.; Benkovic, S. J.; Sen, A. Science, submitted, 2015
9. Zhao, X.; Yadav, V.; Sen, A. Bringing Discipline into Enzyme Motors, manuscript inpreparation for Nature Chemistry, 2015