self-reported influenza-like illness during the 2009 h1n1 ... · in june 2009, the world health...
TRANSCRIPT

U.S. Department of Health and Human ServicesCenters for Disease Control and Prevention
Morbidity and Mortality Weekly Report
Weekly / Vol. 60 / No. 2 January 21, 2011
CDC identified the first case of 2009 H1N1 pandemic influenza on April 15, 2009. During the first 3 months of the outbreak, approximately 43,000 cases were reported to CDC (1). In June 2009, the World Health Organization declared the outbreak an influenza pandemic. Because no existing influenza surveillance system in the United States monitored influenza-like illness (ILI) among persons with ILI who did not seek health care, CDC initiated community-based surveillance of self-reported ILI (defined as the presence of fever with cough or sore throat) and health-care–seeking behavior through a sup-plementary module of the Behavioral Risk Factor Surveillance System (BRFSS). This report summarizes results from BRFSS surveys conducted during September 2009–March 2010. Among 216,431 adults and 43,511 children (aged <18 years), the average monthly percentage of respondents reporting ILI in the 30 days preceding the interview was 8.1% among adults (range: 5.5% for September interviews to 9.5% for November) and 28.4% among children (range: 20.4% for September interviews to 35.9% for November). Health care was sought by 40% of adults and 56% of children with self-reported ILI. The results indicate that reported symptoms of ILI were wide-spread during the 2009–10 influenza season, with a substantial percentage of those reporting ILI seeking health care.
BRFSS conducts state-based, random-digit–dialed telephone surveys of the noninstitutionalized U.S. population aged ≥18 years to determine the prevalence of health conditions and health risk behaviors (2). From September 1, 2009, to March 31, 2010, BRFSS respondents in 49 states (excluding Vermont), the District of Columbia (DC), and Puerto Rico were interviewed using a new module for ILI. One of each respondent’s children also was eligible to be the subject of the interview in 39 of the 49 states, DC, and Puerto Rico. Reported fever with cough or sore throat during the 30 days preceding the interview (for themselves or their child) was
defined as having ILI in the past month.* Those respondents who reported ILI also were asked if they (or their child) visited a health-care professional for the illness.†
Average monthly percentages of self-reported ILI were calcu-lated. ILI was analyzed by age group, month of interview, sex, race/ethnicity,§ and U.S. Census region.¶ Percentage estimates for race/ethnicity were age-adjusted by the direct method to the 2000 U.S. Census population. Respondents with miss-ing ILI status or who resided in states where interviews were conducted for <6 months were excluded from analysis. Results were weighted to reflect selected demographic and geographic population estimates, in accordance with BRFSS weighting
* To determine the presence of ILI among adult respondents, two questions were asked: “During the past month, were you ill with a fever?” and “Did you also have a cough and/or sore throat?” A “yes” response to both was classified as ILI. To determine the presence of ILI among children, adult respondents were asked one question about their child: “Has the child had a fever with cough and/or sore throat during the past month?” A “yes” response was classified as ILI.
† To determine whether medical care was sought among those with ILI, respon-dents were asked: “Did you [or your child] visit a doctor, nurse, or other health professional for this illness?”
§ Respondents were categorized into four non-Hispanic racial populations: white, black, American Indian/Alaska Native, and other race. Person categorized as Hispanic might be of any race.
¶ Northeast: Connecticut, Maine, Massachusetts, New Hampshire, New Jersey, New York, Pennsylvania, Rhode Island, and Vermont. Midwest: Illinois, Indiana, Iowa, Kansas, Michigan, Minnesota, Missouri, Nebraska, North Dakota, Ohio, South Dakota, and Wisconsin. South: Alabama, Arkansas, Delaware, District of Columbia, Florida, Georgia, Kentucky, Louisiana, Maryland, Mississippi, North Carolina, Oklahoma, South Carolina, Tennessee, Texas, Virginia, and West Virginia. West: Alaska, Arizona, California, Colorado, Hawaii, Idaho, Montana, Nevada, New Mexico, Oregon, Utah, Washington, and Wyoming.
INSIDE42 CDC Grand Rounds: Childhood Obesity in the
United States46 Announcement47 QuickStats
Self-Reported Influenza-Like Illness During the 2009 H1N1 Influenza Pandemic — United States, September 2009–March 2010

The MMWR series of publications is published by the Office of Surveillance, Epidemiology, and Laboratory Services, Centers for Disease Control and Prevention (CDC), U.S. Department of Health and Human Services, Atlanta, GA 30333.Suggested citation: Centers for Disease Control and Prevention. [Article title]. MMWR 2011;60:[inclusive page numbers].
Centers for Disease Control and PreventionThomas R. Frieden, MD, MPH, Director
Harold W. Jaffe, MD, MA, Associate Director for ScienceJames W. Stephens, PhD, Office of the Associate Director for Science
Stephen B. Thacker, MD, MSc, Deputy Director for Surveillance, Epidemiology, and Laboratory ServicesStephanie Zaza, MD, MPH, Director, Epidemiology and Analysis Program Office
MMWR Editorial and Production StaffRonald L. Moolenaar, MD, MPH, Editor, MMWR Series
John S. Moran, MD, MPH, Deputy Editor, MMWR SeriesRobert A. Gunn, MD, MPH, Associate Editor, MMWR Series
Teresa F. Rutledge, Managing Editor, MMWR SeriesDouglas W. Weatherwax, Lead Technical Writer-Editor
Donald G. Meadows, MA, Jude C. Rutledge, Writer-Editors
Martha F. Boyd, Lead Visual Information SpecialistMalbea A. LaPete, Julia C. Martinroe,Stephen R. Spriggs, Terraye M. Starr
Visual Information SpecialistsQuang M. Doan, MBA, Phyllis H. King
Information Technology SpecialistsMMWR Editorial Board
William L. Roper, MD, MPH, Chapel Hill, NC, ChairmanVirginia A. Caine, MD, Indianapolis, IN
Jonathan E. Fielding, MD, MPH, MBA, Los Angeles, CADavid W. Fleming, MD, Seattle, WA
William E. Halperin, MD, DrPH, MPH, Newark, NJKing K. Holmes, MD, PhD, Seattle, WADeborah Holtzman, PhD, Atlanta, GA
John K. Iglehart, Bethesda, MDDennis G. Maki, MD, Madison, WI
Patricia Quinlisk, MD, MPH, Des Moines, IAPatrick L. Remington, MD, MPH, Madison, WI
Barbara K. Rimer, DrPH, Chapel Hill, NCJohn V. Rullan, MD, MPH, San Juan, PR
William Schaffner, MD, Nashville, TNAnne Schuchat, MD, Atlanta, GA
Dixie E. Snider, MD, MPH, Atlanta, GAJohn W. Ward, MD, Atlanta, GA
Morbidity and Mortality Weekly Report
methodology (2). Response rates for BRFSS were calculated using Council of American Survey and Research Organizations (CASRO) guidelines. Median survey response rates were 55.2%, calculated as the percentage of persons who completed inter-views among all eligible persons, including those who were not contacted. Median cooperation rates were 75.3%, calculated as the percentage of persons who completed interviews among all eligible persons who were contacted. Statistical significance was determined by t tests where appropriate; comparisons were considered statistically significant at p<0.05.
In interviews conducted during September 2009–March 2010, the average monthly percentage of adults reporting ILI was 8.1%, and the percentage of children with reported ILI was 28.4% (Table). Reported ILI among adults (9.5%) and children (35.9%) peaked in November interviews, which cor-responds with illness in October or November. This pattern was observed in all census regions, except among adults in the South, where ILI peaked in December interviews (Figure 1). Reported ILI among adults (5.5%) and children (20.4%) was lowest for September interviews.
The monthly percentage of respondents reporting ILI decreased with age; the percentage was highest among children aged 0–4 years (32.7%) and lowest among adults aged ≥65 years (3.2%). Among all adults, a significantly higher percentage of women (9.0%) reported ILI than men (7.1%), but no statisti-cally significant difference by sex was observed among children (p=0.11). Compared with white adults (8.4%) and children (29.9%), those identified as American Indian/Alaska Native adults (16.3%) and children (40.8%) reported significantly
higher ILI prevalence, and those identified as black adults (7.2%) and children (23.3%) reported significantly lower ILI prevalence.
Among adults, no statistically significant differences were observed by census region. However, among children, those in the Midwest (29.4%) and South (29.5%) were significantly more likely to have reported ILI than those in the Northeast (26.2%). By state, adults in Arkansas were the most likely to report ILI (11.5%), whereas those in Delaware were the least likely (5.3%) (Figure 2). Among children, those in Oklahoma were the most likely to report ILI (33.4%), whereas those in DC were the least likely (21.5%). Health care was sought by 40% of adults and 56% of children with ILI.
Reported by
M Biggerstaff, MPH, L Kamimoto, MD, L Finelli, DrPH, Influenza Div, National Center for Immunization and Respiratory Diseases; L Balluz, PhD, ScD, Div of Behavioral Surveillance, Office of Surveillance, Epidemiology, and Laboratory Svcs, CDC.
Editorial Note
With the emergence of 2009 H1N1 influenza, CDC initiated community-based monitoring of self-reported ILI as a method for assessing the impact of 2009 H1N1 influenza on persons who did not seek health care. Results indicate that self-reported ILI was more common among younger respondents and less common among older respondents, a finding consistent with reports from other influenza surveillance systems (1).

Morbidity and Mortality Weekly Report
MMWR / January 21, 2011 / Vol. 60 / No. 2 39
After adjusting for age, the percentage of self-reported ILI in adults and children was similar among whites and Hispanics, moderately lower among black adults and children, and significantly higher among American Indian/Alaska Native adults and children. Reasons for these differences are not clear and are being investigated, but severe outcomes from influenza and other respiratory infections have been reported more commonly among children in certain racial/ethnic groups than in others (3).
The findings in this report are subject to at least five limita-tions. First, BRFSS ILI data are self-reported or reported by parents for their children; thus, symptoms, including fever, were not confirmed. However, self-reported symptoms of infectious illness, including respiratory illnesses, have shown close congruence with physician documentation (4). Second, the reported cases of ILI were not laboratory-confirmed as influenza infection. Influenza infection can cause illnesses that do not meet the ILI case definition (e.g., respiratory illness without fever); conversely, illnesses meeting the ILI criteria can be caused by multiple pathogens other than influenza (e.g., respiratory syncytial virus). Studies have indicated that 10%–25% of all respiratory illnesses occurring during periods
TABLE. Average monthly percentage of children* and adults with reported influenza-like illness (ILI) during the preceding 30 days, by selected characteristics — Behavioral Risk Factor Surveillance System, United States, September 2009–March 2010
Children Adults
Characteristic Sample size % (95% CI) Sample size % (95% CI)
Total 43,511 28.4 (27.6–29.2) 216,431 8.1 (7.8–8.4)Sex
Male 21,619 27.9 (26.8–29.1) 81,931 7.1 (6.7–7.6)Female 19,821 29.3 (28.1–30.5) 134,500 9.0 (8.6–9.4)
Race/Ethnicity†
White 28,930 29.9 (29.0–30.9) 169,376 8.4 (8.1–8.7)Black 3,756 23.3 (21.0–25.8) 17,129 7.2 (6.3–8.2)Hispanic 6,112 27.6 (25.6–29.6) 14,508 7.5 (6.7–8.4)American Indian/Alaska Native 960 40.8 (31.4–51.0) 2,916 16.3 (12.2–21.5)Other race 3,127 28.8 (26.0–31.8) 8,618 9.1 (7.8–10.6)
Age group (yrs) 0–4 9,985 32.7 (30.9–34.6) — — — 5–11 15,506 29.4 (28.1–30.7) — — — 12–17 17,944 24.2 (23.0–25.4) — — — 18–49 — — — 71,684 10.1 (9.7–10.6) 50–64 — — — 72,167 6.8 (6.4–7.2) ≥65 — — — 70,880 3.2 (3.0–3.5)U.S. Census§
Northeast 6,812 26.2 (24.4–28.2) 33,440 7.7 (7.0–8.4)Midwest 11,604 29.4 (27.8–31.0) 51,872 7.8 (7.3–8.3)South 11,259 29.5 (28.0–31.1) 74,424 8.4 (8.0–8.9)West 13,288 28.0 (26.5–29.6) 54,423 8.2 (7.5–8.8)
Abbreviation: CI = confidence interval.* Aged <18 years.† Persons categorized as white, black, American Indian/Alaska Native, and other race are all non-Hispanic. Persons categorized as Hispanic might be of any race.§ Northeast: Connecticut, Maine, Massachusetts, New Hampshire, New Jersey, New York, Pennsylvania, Rhode Island, and Vermont. Midwest: Illinois, Indiana, Iowa,
Kansas, Michigan, Minnesota, Missouri, Nebraska, North Dakota, Ohio, South Dakota, and Wisconsin. South: Alabama, Arkansas, Delaware, District of Columbia, Florida, Georgia, Kentucky, Louisiana, Maryland, Mississippi, North Carolina, Oklahoma, South Carolina, Tennessee, Texas, Virginia, and West Virginia. West: Alaska, Arizona, California, Colorado, Hawaii, Idaho, Montana, Nevada, New Mexico, Oregon, Utah, Washington, and Wyoming.
What is already known on this topic?
CDC identified the first case of 2009 H1N1 pandemic influenza on April 15, 2009. In June 2009, the World Health Organization declared the outbreak an influenza pandemic. Routine U.S. influenza surveillance systems provided information describing visits to health-care providers for influenza-like illness (ILI) and reports of influenza-associated hospitalizations and deaths, but did not monitor ILI among persons who did not seek health care.
What is added by this report?
During September 2009–March 2010, the average monthly per-centage of adults and children with reported symptoms of ILI dur-ing the preceding 30 days was 8.1% and 28.4%, respectively. Health care was sought by 40% of adults and 56% of children with ILI.
What are the implications for public health practice?
The results indicate that a large segment of the population reported symptoms of ILI and sought health care for those symptoms during the 2009–10 influenza season. Community-based surveillance of influenza was a useful adjunct to routine influenza surveillance and provided the only source of informa-tion regarding persons with ILI who did not seek health care.

Morbidity and Mortality Weekly Report
40 MMWR / January 21, 2011 / Vol. 60 / No. 2
FIGURE 1. Percentage of children* and adults with reported influenza-like illness (ILI) during the preceding 30 days, by U.S. Census region† and interview month — Behavioral Risk Factor Surveillance System, United States, September 2009–March 2010
Perc
enta
ge
Adults
Children40
30
20
10
0
12
10
8
6
4
2
0
Perc
enta
ge
Sep Oct Nov Dec Jan Feb Mar
Northeast
South
West
Midwest
Northeast
South
West
Midwest
Month
Sep Oct Nov Dec Jan Feb Mar
Month
* Aged <18 years.† Northeast: Connecticut, Maine, Massachusetts, New Hampshire, New Jersey, New York, Pennsylvania, Rhode Island, and Vermont. Midwest: Illinois, Indiana, Iowa,
Kansas, Michigan, Minnesota, Missouri, Nebraska, North Dakota, Ohio, South Dakota, and Wisconsin. South: Alabama, Arkansas, Delaware, District of Columbia, Florida, Georgia, Kentucky, Louisiana, Maryland, Mississippi, North Carolina, Oklahoma, South Carolina, Tennessee, Texas, Virginia, and West Virginia. West: Alaska, Arizona, California, Colorado, Hawaii, Idaho, Montana, Nevada, New Mexico, Oregon, Utah, Washington, and Wyoming.
when influenza viruses are known to be circulating are actu-ally laboratory-confirmed influenza (5–7). The sensitivity and specificity of the ILI definition for influenza illness can vary substantially, but requiring fever as part of the ILI criteria has been shown to increase the specificity of ILI for influenza illness (8,9). Third, BRFSS data are collected only from households with a landline telephone. Selection bias related to exclusion of households with only cellular phones or no telephone service is possible; however, BRFSS weighting methodology
partially compensates for the exclusion of households without telephones. Fourth, respondents from nine states were excluded from the analysis of ILI in children, and six of the excluded states were in the South census region. Therefore, results from the ILI analysis for children might not be representative of the United States overall and particularly of the South census region. Finally, the median state response rate for this survey period was only 55.2%; low response rates can increase the potential for bias.

Morbidity and Mortality Weekly Report
MMWR / January 21, 2011 / Vol. 60 / No. 2 41
Community-based ILI surveillance through BRFSS pro-vided important information to help describe the 2009 H1N1 influenza pandemic and the epidemiology of ILI in the United States. These data were a useful adjunct to routine influenza surveillance and provided the only source of information for persons with ILI who did not seek health care. CDC continues to use the supplementary ILI module during the 2010–11 influenza season; the results will enable analysis of year-to-year trends and factors associated with self-reported ILI.
≥9.3%8.2%–9.2%7.1%–8.1%≤7.0%No data
DC
PR
FIGURE 2. Percentage of adults reporting influenza-like illness (ILI) during the preceding 30 days — Behavioral Risk Factor Surveillance System, United States,* September 2009–March 2010
* 49 states (Vermont did not collect data), District of Columbia, and Puerto Rico.
AcknowledgmentsThis report is based, in part, on contributions by BRFSS state
coordinators; M Jhung, MD, Influenza Div, National Center for Immunization and Respiratory Diseases; and W Garvin and M Qayad, Div of Behavioral Surveillance, Office of Surveillance, Epidemiology, and Laboratory Svcs, CDC.
References1. Jhung M, Swerdlow D, Olsen S, et al. Epidemiology of 2009 pandemic
influenza A (H1N1) in the United States. Clin Infect Dis 2011;52 (Suppl 1):S13–26.
2. CDC. Behavioral Risk Factor Surveillance System operational and user’s guide. 2006. Atlanta, GA: US Department of Health and Human Services, CDC; 2006. Available at ftp://ftp.cdc.gov/pub/data/brfss/userguide.pdf. Accessed January 14, 2011.
3. Iwane M, Edwards K, Szilagyi P, et al. Population-based surveillance for hospitalizations associated with respiratory syncytial virus, influ-enza virus, and parainfluenza viruses among young children. Pediatrics 2004;113:1758–64.
4. Orts K, Sheridan J, Robinson-Whelen S, Glaser R, Malarkey WB, Kiecolt-Glaser JK. The reliability and validity of a structured inter-view for the assessment of infectious disease symptoms. J Behav Med 1995;18:517–29.
5. Monto A, Ullman B. Acute respiratory illness in an American community. The Tecumseh study. JAMA 1974;227:164–9.
6. Bridges C, Thompson W, Meltzer M, et al. Effectiveness and cost-benefit of influenza vaccination of healthy working adults: a randomized con-trolled trial. JAMA 2000;284:1655–63.
7. Ren L, Gonzalez R, Wang Z, et al. Prevalence of human respiratory viruses in adults with acute respiratory tract infections in Beijing, 2005–2007. Clin Microbiol Infect 2009;15:1146–53.
8. Monto A, Gravenstein S, Elliott M, Colopy M, Schweinle J. Clinical signs and symptoms predicting influenza infection. Arch Intern Med 2000;160:3243–7.
9. Ong A, Chen M, Lin L, et al. Improving the clinical diagnosis of influenza—a comparative analysis of new influenza A (H1N1) cases. PLoS ONE 2009;4:e8453.

Morbidity and Mortality Weekly Report
42 MMWR / January 21, 2011 / Vol. 60 / No. 2
CDC Grand Rounds: Childhood Obesity in the United States
The magnitude of the problem In the United States, childhood obesity affects approximately
12.5 million children and teens (17% of that population) (1). Changes in obesity prevalence from the 1960s show a rapid increase in the 1980s and 1990s, when obesity prevalence among children and teens tripled, from nearly 5% to approxi-mately 15% (Figure 1) (1). During the past 10 years, the rapid increase in obesity has slowed and might have leveled. However, among the heaviest boys, a significant increase in obesity has been observed, with the heaviest getting even heavier. Moreover, substantial racial/ethnic disparities exist, with Hispanic boys and non-Hispanic black girls disproportionately affected by obesity (Figure 2) (1). Also, older children and teens are more likely to be obese compared with preschoolers (1).
In the short term, obesity in children can lead to psychosocial problems and to cardiovascular risk factors such as hyperten-sion, high cholesterol, and abnormal glucose tolerance or diabetes. In one study, 70% of obese children had at least one additional cardiovascular risk factor, and 30% had two or more
(2). Although the prevalence of type 2 diabetes in teens is very low, a recent report estimated that 15% of new diabetes cases among children and adolescents are type 2 diabetes (3). In the 1980s, type 2 diabetes in teens was virtually unheard of.
The prevalence of obesity among U.S. adults (34%) is twice that observed in children and translates into nearly 73 million adult men and women (4). On average, U.S. adults weigh 24 pounds more than they did in 1960 (5), and they are at increased risk for health conditions such as diabetes, cardiovascular disease, and certain cancers. Although obesity prevalence has remained mostly flat in the past 10 years, the costs associated with obesity have increased substantially dur-ing the same period. One study estimated that approximately 9% of all medical costs in 2008 were obesity-related and amounted to $147 billion, compared with $78.5 billion 10 years before (6).
Challenges and strategies to combat the problem Identification of effective interventions. Environmental
determinants of childhood obesity in the United States include shifts in food consumption, changes in physical activity levels, and higher levels of television viewing, with the consequent inactivity and marketing of food to children. CDC is focusing on best available evidence to implement intervention programs. For maximum population impact, the focus should be on strategies that alter the food and physical activity environ-ments in places where persons live, learn, work, play, and pray.
FIGURE 1. Prevalence of obesity among children and adolescents, by age group — United States, 1963–2008
2–5 yrs
6–11 yrs
12–19 yrs
0
5
10
15
20
Perc
enta
ge
1976–1980
1988–1994
1999–2000
2003–2004
Period
1971–1974
1966–1970
1963–1965
2007–2008
This is another in a series of occasional MMWR reports titled CDC Grand Rounds. These reports are based on grand rounds presentations at CDC on high-profile issues in public health science, practice, and policy. Information about CDC Grand Rounds is available at http://www.cdc.gov/about/grand-rounds.

Morbidity and Mortality Weekly Report
MMWR / January 21, 2011 / Vol. 60 / No. 2 43
Interventions aimed at single behavioral targets are unlikely to have a substantial impact, and both evidence-based practice and practice-based evidence should be considered.
Breastfeeding has been shown to have substantial health benefits for children, who consequently might be at reduced risk for childhood obesity (7). The most recent data show that nearly 30% of mothers do not breastfeed, and only approxi-mately 40% of children are still breastfed at age 6 months (the recommended duration of exclusive breast feeding is to age 4–6 months) (8). A study of mothers’ experiences during their stay at maternity-care hospitals found that duration of breastfeeding increased when the number of baby-friendly steps the mother experienced increased (e.g., initiating breastfeeding early, exclusive breastfeeding, rooming in, on-demand feedings, no pacifiers, and providing information to new mothers) (9). Interventions that encourage breastfeeding in workplaces also would increase the chances of working mothers continuing to breastfeed longer.
Strategies to reduce energy intake include decreasing con-sumption of high energy-density foods, increasing consump-tion of fruits and vegetables, decreasing consumption of sugar-sweetened beverages, and decreasing time spent watch-ing television and exposure to food marketed to children. A substantial proportion of all money spent on food consumed outside the home is spent on fast food (10). Institutions such as child-care facilities and schools should alter their purchas-ing strategies to reduce the availability of high-calorie foods. Approaches to reducing energy intake through decreasing consumption of sugar drinks (sodas and 10% juice–containing beverages) include 1) enacting regulations and policies that eliminate availability of such drinks, including sports drinks, in child-care settings and schools and at school events and
afterschool programs, 2) increasing availability of fresh water in parks and recreational facilities, and 3) eliminating sugar drinks in school vending machines. Reducing the amount of time children spend watching television, and thus reducing exposure to food marketed to them, can be accomplished by limiting television time at home and in child-care settings and removing televisions from children’s bedrooms.
Increasing energy output through increased physical activity plays an important role in preventing and reducing obesity-related illnesses and conditions such as hyperlipidemia, hyper-insulinemia, and elevated blood pressure, even if weight is not reduced (11). Activity levels can be increased by making it safer to walk or bike to school. Quality school physical education programs that keep children moving the majority of their time in physical education class should be implemented. Providing a safe environment for physical activity and establishing habits (e.g., regular physical activity) that will lead to activity into and throughout adulthood must become priorities.
An example of a comprehensive school-based program was one that was implemented in Philadelphia, Pennsylvania, aimed at 4th, 5th, and 6th graders, which included reducing television time, increasing physical activity, and increasing fruit and vegetable intake (11). This intervention was based on CDC’s School Health Guidelines for Nutrition (12) and included changes in the school food supply to meet the Dietary Guidelines for Americans (13). The 2-year intervention resulted in a 50% reduction in the incidence of overweight and a 10% reduction in prevalence of overweight. Physical inactivity and television viewing also declined (14).
Policies and systems changes in action. Changing policy often is the most effective way to implement and sustain these kinds of environmental changes. Policies not traditionally thought
FIGURE 2. Prevalence of obesity among children and adolescents, by sex, age group, and race/ethnicity — United States, 2007–2008
0
5
10
15
20
25
30
2–5 6–11 12–19 2–5 6–11 12–19
Sex and age group (yrs)
Perc
enta
ge
Black, non-Hispanic
White, non-Hispanic
Hispanic
Males Females

Morbidity and Mortality Weekly Report
44 MMWR / January 21, 2011 / Vol. 60 / No. 2
of as health policies (e.g., involving transportation, land use, education, agriculture, and economics) can affect health and obesity rates. The following two examples of major policy-driven initiatives requiring system changes focus on access to healthy foods and improving the built environment, respectively.
According to the U.S. Department of Agriculture, approxi-mately 23.5 million persons in urban and rural areas of the United States live in “food deserts” (i.e., low-income areas with-out access to healthy foods) (15). Improved access to healthy foods might improve eating habits and decrease obesity. The Fresh Food Financing Initiative (FFFI) in Pennsylvania is a public-private partnership that has improved access to healthy foods using one-time loans and grants; as of September 2009, it had committed $59.7 million to projects across the state (16). As a result of FFFI, approximately 500,000 persons now have access to healthy foods who did not have it before, nearly 5,000 jobs have been created or retained, and approximately 1.5 mil-lion square feet of retail space has been created or saved (16). Eighty-three projects have been implemented, ranging from large supermarkets in urban settings to small stores in small town/rural settings, farmers markets, and community-supported agriculture. Replication of FFFI is under way in California, Colorado, Illinois, Louisiana, New Jersey, and New York. The President’s proposed 2011 budget includes support for a Healthy Food Financing Initiative (HFFI), which combines $345 million from the U.S. Department of Agriculture, U.S. Department of Health and Human Services, and U.S. Treasury Department for loans, grants, and tax credits to support a range of projects designed to increase access to healthy foods.*
Supporting HFFI and other policies to increase access to healthy foods through different food and farm policy innovations, and improving the built environment through strategies for walk-able, bikeable, and safe neighborhoods, parks, and playgrounds, particularly in underresourced communities, are the focus of the Convergence Partnership, a collaborative of six major funding organizations and CDC.† PolicyLink, a national research and pol-icy institute serves as the Convergence Partnership program lead, providing guidance about policy and strategy.§ Local strategies for enhancing the built environment to support healthy eating and active living include walkable and bikeable neighborhoods, public transit, joint use of school yards, and health impact assessments. Public education and advocacy efforts already have increased awareness of the connection between health and transportation and have altered policy proposals.
Implementation at the state level: the Maine experience. In Maine, the pediatric community partnered with community groups, the Maine-Harvard Prevention Research Center, and the state Center for Disease Control and Prevention to develop simple steps clinicians could follow in their practices to reduce childhood obesity. These partnerships led to formation of the Maine Youth Overweight Collaborative (MYOC) in 2004.¶ It started with a simple message: 5-2-1-0: five or more fruits and vegetables per day, 2 hours or less screen time per day, 1 hour or more of physical activity per day, and zero sugar drinks coupled with more water and low fat milk consumption. This message provided clinicians with basic steps to take to combat the childhood obesity epidemic. Before MYOC, clinicians documented body mass index for age and sex approximately 25% of the time; after 24 months of MYOC in action, approximately 90% of encounters resulted in a documented body mass index.
In 2006, a group of local businesses and health-care leaders in Portland, Maine, formed a unique profit/nonprofit partner-ship called Let’s Go! that used lessons learned and tools and resources developed in MYOC to take the 5-2-1-0 message to additional settings: schools, child-care centers, communities, workplaces, after-school programs, and health-care settings.** The core principles of Let’s Go! affirm that 1) environmental and policy changes influence behavior change, 2) intercon-nectivity across sectors is essential, and 3) strategies should be evidence-based and continuously evaluated. Let’s Go! has a robust evaluation plan that focuses on qualitative and quantita-tive data. Because changes in obesity rates take years, progress is tracked through environmental and policy changes as well as behavioral data as precursors to changes in population weight status (Figure 3). Parents already are more likely able to iden-tify all four healthy behaviors correctly, and a 27% increase in perceived behavior change was observed among children in three of four of the 5-2-1-0 targeted behaviors. Let’s Go! has begun to expand statewide, and by June 2010, involved nearly 85,000 students in 262 schools, 40 child-care sites caring for thousands of children, approximately 50 physician practices, numerous after-school programs supporting approximately 2,500 youths, six of Portland’s largest employers, and eight regions across Maine. Since June 2010, Let’s Go! has been dis-seminated statewide to seven additional regions in Maine.
Other initiatives. The efforts already under way for obesity prevention and control are further strengthened by Let’s Move, the First Lady’s initiative to end childhood obesity in a genera-tion, by empowering parents, encouraging healthier foods in * Additional information available at http://www.letsmove.gov/healthycom-
munity.php.† Additional information available at http://www.convergencepartnership.org.§ Additional information available at http://www.policylink.org.
¶ Additional information available at http://www.letsgo.org/resources/MYOC.php. ** Additional information available at http://www.letsgo.org.

Morbidity and Mortality Weekly Report
MMWR / January 21, 2011 / Vol. 60 / No. 2 45
schools, increasing physical activity, and increasing access to affordable healthy foods.†† Let’s Move includes establishment of the intergovernmental Childhood Obesity Task Force and, in the U.S. Department of Health and Human Services, a Healthy Weight Task Force is developing broad approaches in multiple sectors. Other key programs include those instituted by the Convergence Partnership and programs initiated by CDC with funds from the American Recovery and Reimbursement Act of 2009.
Summary
Policy and environmental interventions show early evidence of improving environments that will lead to lower rates of obesity. Nonetheless, more studies of impact and effectiveness are needed, as are identification and evaluation of promis-ing approaches from around the country. The high visibility accorded to childhood obesity by the Let’s Move initiative and the funding provided to states and communities through the American Recovery and Reinvestment Act provide unparalleled opportunities to reverse the obesity epidemic.
Reported by
J Bell, MPA, PolicyLink, Oakland, California. VW Rogers, MD, Barbara Bush Children’s Hospital, Maine Medical Center,
Before MYOC
After MYOC
0
10
20
30
40
50
60
70
80
90
100
Perc
enta
ge
Address overweight
Medically evaluate
Do behavioral goal setting
Do brief focused negotiation
Schedule follow-up
Practice
FIGURE 3. Percentage of clinicians reporting that they “strongly agreed” with the use of selected practices to counter childhood obesity among their patients, before and after implementation of the Maine Youth Overweight Collaborative (MYOC) — Maine, 2004–2006
Portland, Maine. WH Dietz, MD, PhD, Div of Nutrition, Physical Activity, and Obesity, National Center for Chronic Disease Prevention and Health Promotion; CL Ogden, PhD, Div of Health and Nutrition Examination Surveys, National Center for Health Statistics; C Schuler, PhD, Div of Respiratory Disease Studies, National Institute for Occupational Safety and Health; T Popovic, MD, PhD, Office of the Director, CDC.
References 1. Ogden CL, Carroll MD, Curtin LR, Lamb MM, Flegal KM. Prevalence
of high body mass index in US children and adolescents, 2007–2008. JAMA 2010;303:242–9.
2. Freedman DS, Mei Z, Srinivasan SR, Berenson GS, Dietz WH. Cardiovascular risk factors and excess adiposity among overweight children and adolescents: The Bogalusa Heart Study. J Pediatr 2007;150:12–7.
3. SEARCH for Diabetes in Youth Study Group. The burden of diabetes mellitus among US youth: prevalence estimates from the SEARCH for Diabetes in Youth Study. Pediatrics 2006;118:1510–8.
4. Flegal KM, Carroll MD, Ogden CL, et al. Prevalence and trends in obesity among US adults, 1999–2008. JAMA 2010;303:235–41.
5. Ogden CL, Fryar CD, Carroll MD, Flegal KM. Mean body weight, height, and body mass index, United States 1960–2002. Adv Data 2004;347:1–17.
6. Finkelstein EA, Trogdon JG, Cohen JW, Dietz W. Annual medical spending attributable to obesity: payer- and service-specific estimates. Health Aff (Millwood) 2009;28:w822–31.
7. Harder T, Bergmann R, Kallischnigg G, Plagemann. Duration of breast-feeding and risk of overweight: a meta-analysis. Am J Epidemiol 2005;162:397–403.
†† Additional information available at http://www.letsmove.gov.
Morbidity and Mortality Weekly Report
46 MMWR / January 21, 2011 / Vol. 60 / No. 2
8. CDC. Racial and ethnic differences in breastfeeding initiation and duration by state—National Immunization Survey, United States, 2004–2008. MMWR 2010;59:327–34.
9. Philipp BL, Merewood A, Miller LW, et al. Baby-friendly hospital initia-tive improves breastfeeding initiation rates in a US hospital setting. Pediatrics 2001;108:677–81.
10. The Keystone Forum on Away-from-Home Foods. Opportunities for preventing weight gain and obesity. Washington, DC: The Keystone Center; 2006.
11. Gutin B, Barbeau P, Owens S, et al. Effects of exercise intensity on cardiovascular fitness, total body composition, and visceral adiposity in obese adolescents. Am J Clin Nutr 2002;75:818–26.
12. CDC. Guidelines for school health programs to promote lifelong healthy eating. MMWR 1996;45(No. RR-9).
13. US Department of Health and Human Services, US Department of Agriculture. Dietary guidelines for Americans. Washington DC: US Government Printing Office; 2005. Available at http://www.healthierus.gov/dietaryguidelines. Accessed January 18, 2011.
14. Foster GD, Sherman S, Borradaile KE, et al. A policy-based school intervention to prevent overweight and obesity. Pediatrics 2008;121:e794–802.
15. Economic Research Service, US Department of Agriculture. Access to affordable and nutritious food. Measuring and understanding food deserts and their consequences: report to Congress. Washington, DC: US Department of Agriculture; 2009. Available at http://www.ers.usda.gov/publications/ap/ap036. Accessed January 13, 2011.
16. Karpyn A, Manon M, Treuhaft S, Giang T, Harries C, McCoubrey K. Policy solutions to the ‘grocery gap’. Health Aff (Millwood) 2010;29:473–80.
AnnouncementEnvironmental Public Health Tracking 101
A new CDC online course, Environmental Public Health Tracking 101, provides an overview of the major components of environmental public health tracking. The course is divided into 12 modules within three sections. Topics include how to use the National Environmental Public Health Tracking Network (http://www.cdc.gov/ephtracking), surveillance and epidemiology, types of tracking data, and geographic informa-tion systems.
The online course is available at http://www.nehacert.org. The course can be accessed by entering “Tracking 101” in the search box. Continuing education credit is available at no charge for nurses, health educators, and other health professionals.
Morbidity and Mortality Weekly Report
MMWR / January 21, 2011 / Vol. 60 / No. 2 47
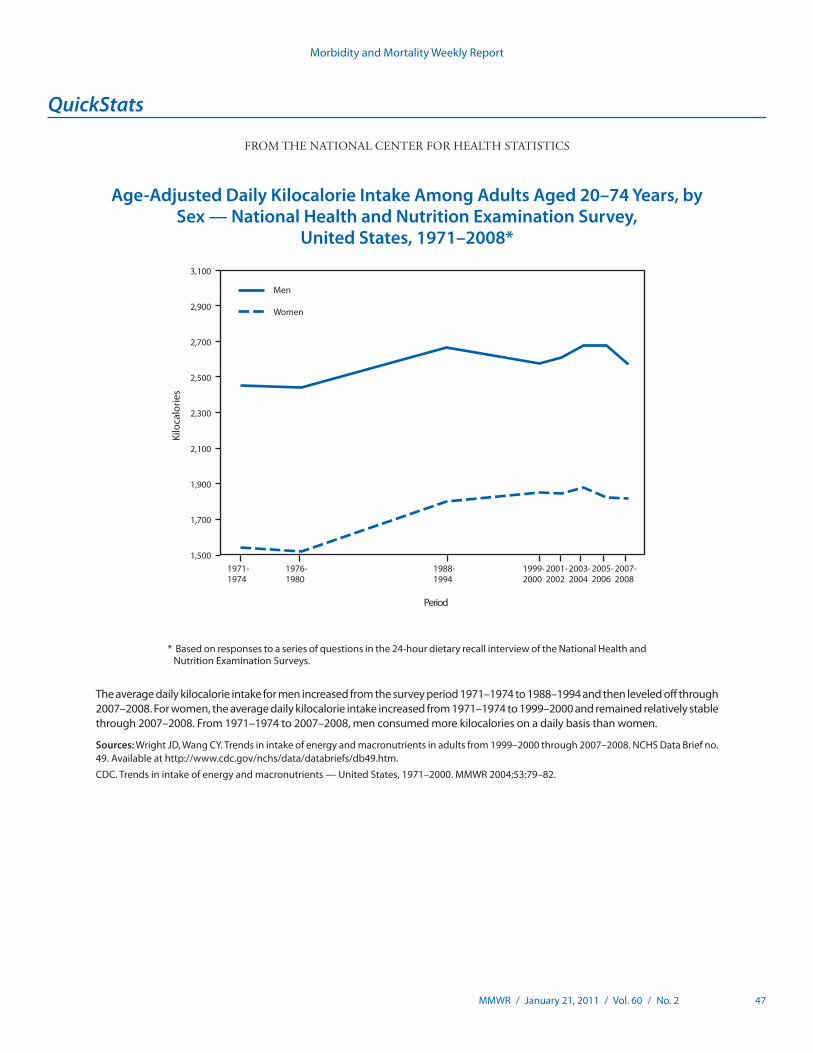
* Based on responses to a series of questions in the 24-hour dietary recall interview of the National Health and Nutrition Examination Surveys.
The average daily kilocalorie intake for men increased from the survey period 1971–1974 to 1988–1994 and then leveled off through 2007–2008. For women, the average daily kilocalorie intake increased from 1971–1974 to 1999–2000 and remained relatively stable through 2007–2008. From 1971–1974 to 2007–2008, men consumed more kilocalories on a daily basis than women.
Sources: Wright JD, Wang CY. Trends in intake of energy and macronutrients in adults from 1999–2000 through 2007–2008. NCHS Data Brief no. 49. Available at http://www.cdc.gov/nchs/data/databriefs/db49.htm.
CDC. Trends in intake of energy and macronutrients — United States, 1971–2000. MMWR 2004;53:79–82.
1,500
1,700
1,900
2,100
2,300
2,500
2,700
2,900
3,100
Kilo
calo
ries
Period
Men
Women
1999-2000
2001-2002
2003-2004
2005-2006
2007-2008
1976-1980
1988-1994
1971-1974
QuickStats
FROM THE NATIONAL CENTER FOR HEALTH STATISTICS
Age-Adjusted Daily Kilocalorie Intake Among Adults Aged 20–74 Years, by Sex — National Health and Nutrition Examination Survey,
United States, 1971–2008*

Morbidity and Mortality Weekly Report
48 MMWR / January 21, 2011 / Vol. 60 / No. 2
TABLE I. Provisional cases of infrequently reported notifiable diseases (<1,000 cases reported during the preceding year) — United States, week ending January 15, 2011 (2nd week)*
DiseaseCurrent
weekCum 2011
5-year weekly
average†
Total cases reported for previous years
States reporting cases during current week (No.)2010 2009 2008 2007 2006
Anthrax — — — — 1 — 1 1Arboviral diseases § ,¶:
California serogroup virus disease — — — — 55 62 55 67Eastern equine encephalitis virus disease — — — — 4 4 4 8Powassan virus disease — — 0 — 6 2 7 1St. Louis encephalitis virus disease — — 0 — 12 13 9 10Western equine encephalitis virus disease — — — — — — — —
Babesiosis — — — NN NN NN NN NNBotulism, total — 1 3 108 118 145 144 165
foodborne — — 0 7 10 17 32 20infant — 1 2 76 83 109 85 97other (wound and unspecified) — — 0 25 25 19 27 48
Brucellosis 2 3 2 127 115 80 131 121 OH (1), FL (1)Chancroid — 1 1 37 28 25 23 33Cholera — 1 0 10 10 5 7 9Cyclosporiasis§
— 1 4 170 141 139 93 137Diphtheria — — — — — — — —Haemophilus influenzae,** invasive disease (age <5 yrs):
serotype b — — 1 16 35 30 22 29nonserotype b — — 5 151 236 244 199 175unknown serotype 2 10 5 263 178 163 180 179 CA (2)
Hansen disease§ 1 1 1 57 103 80 101 66 CA (1)Hantavirus pulmonary syndrome§
— — 1 17 20 18 32 40Hemolytic uremic syndrome, postdiarrheal§ 1 3 5 218 242 330 292 288 CA (1)Influenza-associated pediatric mortality§,††
3 6 2 61 358 90 77 43 TX (1), ND (1), GA (1)Listeriosis 1 6 18 758 851 759 808 884 TN (1)Measles§§
— — 1 57 71 140 43 55Meningococcal disease, invasive¶¶:
A, C, Y, and W-135 — 1 6 240 301 330 325 318serogroup B — — 4 109 174 188 167 193other serogroup — — 1 9 23 38 35 32unknown serogroup 3 15 13 410 482 616 550 651 NYC (1), NE (1), AZ (1)
Novel influenza A virus infections*** — — 0 443,774 2 4 NNPlague — — 0 2 8 3 7 17Poliomyelitis, paralytic — — 0 — 1 — — —Polio virus Infection, nonparalytic§
— — — — — — — NNPsittacosis§
— — 0 4 9 8 12 21Q fever, total§ — 2 3 119 113 120 171 169
acute — 2 2 90 93 106 — —chronic — — 0 29 20 14 — —
Rabies, human — — 0 1 4 2 1 3Rubella†††
— — 0 6 3 16 12 11Rubella, congenital syndrome — — — — 2 — — 1SARS-CoV§ — — — — — — — —Smallpox§ — — — — — — — —Streptococcal toxic-shock syndrome§
— 2 4 156 161 157 132 125Syphilis, congenital (age <1 yr)§§§
— — 8 228 423 431 430 349Tetanus — — 0 8 18 19 28 41Toxic-shock syndrome (staphylococcal)§
— 1 2 75 74 71 92 101Trichinellosis 1 2 0 4 13 39 5 15 OH (1)Tularemia — — 1 110 93 123 137 95Typhoid fever — 1 10 414 397 449 434 353Vancomycin-intermediate Staphylococcus aureus§
1 2 1 89 78 63 37 6 LA (1)Vancomycin-resistant Staphylococcus aureus§
— — 0 1 1 — 2 1Vibriosis (noncholera Vibrio species infections)§
— 1 8 766 789 588 549 NNViral hemorrhagic fever¶¶¶ — — 0 1 NN NN NN NNYellow fever — — — — — — — —
See Table 1 footnotes on next page.
Notifiable Diseases and Mortality Tables

Morbidity and Mortality Weekly Report
MMWR / January 21, 2011 / Vol. 60 / No. 2 49
Notifiable Disease Data Team and 122 Cities Mortality Data Team Patsy A. Hall-BakerDeborah A. Adams Rosaline DharaWillie J. Anderson Pearl C. SharpMichael S. Wodajo Lenee Blanton
* Ratio of current 4-week total to mean of 15 4-week totals (from previous, comparable, and subsequent 4-week periods for the past 5 years). The point where the hatched area begins is based on the mean and two standard deviations of these 4-week totals.
FIGURE I. Selected notifiable disease reports, United States, comparison of provisional 4-week totals January 15, 2011, with historical data
420.250.125 1
Beyond historical limits
DISEASE
Ratio (Log scale)*
DECREASE INCREASECASES CURRENT
4 WEEKS
Hepatitis A, acute
Hepatitis B, acute
Hepatitis C, acute
Legionellosis
Measles
Mumps
Pertussis
Giardiasis
Meningococcal disease
569
48
69
11
90
2
25
11
730
0.5
TABLE I. (Continued) Provisional cases of infrequently reported notifiable diseases (<1,000 cases reported during the preceding year) — United States, week ending January 15, 2011 (2nd week)*
—: No reported cases. N: Not reportable. NN: Not Nationally Notifiable Cum: Cumulative year-to-date counts. * Case counts for reporting years 2010 and 2011 are provisional and subject to change. For further information on interpretation of these data, see http://www.cdc.gov/ncphi/disss/nndss/
phs/files/ProvisionalNationa%20NotifiableDiseasesSurveillanceData20100927.pdf. † Calculated by summing the incidence counts for the current week, the 2 weeks preceding the current week, and the 2 weeks following the current week, for a total of 5 preceding years.
Additional information is available at http://www.cdc.gov/ncphi/disss/nndss/phs/files/5yearweeklyaverage.pdf. § Not reportable in all states. Data from states where the condition is not reportable are excluded from this table except starting in 2007 for the arboviral diseases, STD data, TB data, and
influenza-associated pediatric mortality, and in 2003 for SARS-CoV. Reporting exceptions are available at http://www.cdc.gov/ncphi/disss/nndss/phs/infdis.htm. ¶ Includes both neuroinvasive and nonneuroinvasive. Updated weekly from reports to the Division of Vector-Borne Infectious Diseases, National Center for Zoonotic, Vector-Borne, and
Enteric Diseases (ArboNET Surveillance). Data for West Nile virus are available in Table II. ** Data for H. influenzae (all ages, all serotypes) are available in Table II. †† Updated weekly from reports to the Influenza Division, National Center for Immunization and Respiratory Diseases. Since October 3, 2010, 10 influenza-associated pediatric death oc-
curred during the 2010-11 influenza season. Since August 30, 2009, a total of 282 influenza-associated pediatric deaths occurring during the 2009-10 influenza season have been reported.
§§ No measles cases were reported for the current week. ¶¶ Data for meningococcal disease (all serogroups) are available in Table II. *** CDC discontinued reporting of individual confirmed and probable cases of 2009 pandemic influenza A (H1N1) virus infections on July 24, 2009. During 2009, four cases of human infec-
tion with novel influenza A viruses, different from the 2009 pandemic influenza A (H1N1) strain, were reported to CDC. The four cases of novel influenza A virus infection reported to CDC during 2010 were identified as swine influenza A (H3N2) virus and are unrelated to the 2009 pandemic influenza A (H1N1) virus. Total case counts for 2009 were provided by the Influenza Division, National Center for Immunization and Respiratory Diseases (NCIRD).
††† No rubella cases were reported for the current week. §§§ Updated weekly from reports to the Division of STD Prevention, National Center for HIV/AIDS, Viral Hepatitis, STD, and TB Prevention. ¶¶¶ There was one case of viral hemorrhagic fever reported during week 12 of 2010. The one case report was confirmed as lassa fever. See Table II for dengue hemorrhagic fever.

Morbidity and Mortality Weekly Report
50 MMWR / January 21, 2011 / Vol. 60 / No. 2
TABLE II. Provisional cases of selected notifiable diseases, United States, weeks ending January 15, 2011, and January 16, 2010 (2nd week)*
Reporting area
Chlamydia trachomatis infection Coccidioidomycosis Cryptosporidiosis
Current week
Previous 52 weeks Cum 2011
Cum 2010
Current week
Previous 52 weeks Cum 2011
Cum 2010
Current week
Previous 52 weeks Cum 2011
Cum 2010Med Max Med Max Med Max
United States 9,996 23,905 26,317 24,535 45,279 119 0 262 381 NN 44 118 344 96 253New England 547 781 1,211 1,082 1,122 — 0 0 — NN — 7 19 — 87
Connecticut — 177 402 — 64 — 0 0 — NN — 0 0 — 71Maine§ — 50 100 — 92 — 0 0 — NN — 1 7 — 4Massachusetts 485 402 693 916 748 — 0 0 — NN — 3 9 — 6New Hampshire 36 49 113 64 82 — 0 0 — NN — 1 5 — 2Rhode Island§ — 66 120 47 97 — 0 0 — NN — 0 2 — —Vermont§ 26 23 51 55 39 — 0 0 — NN — 1 5 — 4
Mid. Atlantic 1,676 3,354 5,073 3,025 5,781 — 0 0 — NN 7 15 38 12 21New Jersey 343 509 680 721 878 — 0 0 — NN — 0 4 — 1New York (Upstate) 501 696 1,342 790 586 — 0 0 — NN 1 4 13 1 2New York City — 1,216 2,768 — 2,640 — 0 0 — NN — 2 6 — 3Pennsylvania 832 946 1,092 1,514 1,677 — 0 0 — NN 6 8 26 11 15
E.N. Central 1,304 3,511 3,980 3,112 7,381 — 0 0 — NN 11 29 122 31 56Illinois 18 770 1,031 232 2,015 — 0 0 — NN — 4 21 1 11Indiana — 366 797 — 374 — 0 0 — NN — 3 10 1 6Michigan 940 946 1,419 1,751 2,104 — 0 0 — NN 2 5 18 6 14Ohio 169 991 1,109 707 2,055 — 0 0 — NN 9 7 24 23 11Wisconsin 177 427 514 422 833 — 0 0 — NN — 9 57 — 14
W.N. Central 149 1,383 1,556 645 2,767 — 0 0 — NN 2 21 83 8 16Iowa 10 202 237 146 479 — 0 0 — NN — 4 24 — 6Kansas — 189 235 53 395 — 0 0 — NN — 2 9 — 3Minnesota — 280 348 1 643 — 0 0 — NN — 0 16 — —Missouri 127 505 620 312 880 — 0 0 — NN 2 4 30 4 5Nebraska§ — 97 173 56 202 — 0 0 — NN — 3 26 4 2North Dakota — 28 79 — 36 — 0 0 — NN — 0 9 — —South Dakota 12 62 78 77 132 — 0 0 — NN — 1 6 — —
S. Atlantic 2,655 4,737 5,653 6,864 8,732 — 0 0 — NN 21 18 51 31 21Delaware 50 85 220 133 156 — 0 0 — NN — 0 1 — —District of Columbia — 91 177 76 126 — 0 0 — NN — 0 1 — —Florida 620 1,460 1,708 1,668 2,649 — 0 0 — NN 13 7 19 19 8Georgia — 610 1,217 — 489 — 0 0 — NN 5 5 31 7 10Maryland§ 405 469 804 735 443 — 0 0 — NN 2 1 3 2 1North Carolina 466 759 1,563 1,835 2,249 — 0 0 — NN — 0 12 — —South Carolina§ 334 535 847 658 1,038 — 0 0 — NN 1 1 8 1 1Virginia§ 704 597 882 1,561 1,483 — 0 0 — NN — 2 8 2 —West Virginia 76 74 122 198 99 — 0 0 — NN — 0 3 — 1
E.S. Central 480 1,753 2,416 1,475 2,747 — 0 0 — NN 1 4 19 2 8Alabama§ 426 533 792 867 933 — 0 0 — NN — 2 13 — —Kentucky 54 269 614 54 326 — 0 0 — NN — 1 6 1 2Mississippi — 377 780 230 441 — 0 0 — NN — 0 2 — 3Tennessee§ — 566 796 324 1,047 — 0 0 — NN 1 1 5 1 3
W.S. Central 1,171 3,003 4,310 2,892 7,672 — 0 0 — NN — 7 29 — 2Arkansas§ 233 275 391 570 536 — 0 0 — NN — 0 3 — —Louisiana 642 310 824 1,030 1,474 — 0 0 — NN — 1 6 — —Oklahoma 296 251 1,374 299 1,403 — 0 0 — NN — 1 8 — —Texas§ — 2,273 3,183 993 4,259 — 0 0 — NN — 4 22 — 2
Mountain 677 1,438 1,913 1,379 2,237 87 0 208 295 NN — 10 30 5 22Arizona 301 509 706 388 503 87 0 207 294 NN — 0 3 — 2Colorado — 336 560 185 735 — 0 0 — NN — 2 8 1 2Idaho§ — 69 200 — 118 — 0 0 — NN — 2 7 3 3Montana§ 23 60 82 73 94 — 0 0 — NN — 1 4 — 3Nevada§ 171 175 329 368 296 — 0 0 — NN — 0 7 — 1New Mexico§ 182 150 274 293 71 — 0 0 — NN — 2 12 1 6Utah — 119 175 72 344 — 0 1 1 NN — 1 5 — 3Wyoming§ — 40 90 — 76 — 0 0 — NN — 0 2 — 2
Pacific 1,337 3,695 4,557 4,061 6,840 32 0 54 86 NN 2 12 28 7 20Alaska — 112 148 103 260 — 0 0 — NN — 0 1 — 1California 846 2,766 3,568 2,985 5,225 32 0 54 86 NN 2 6 18 4 14Hawaii — 112 158 — 256 — 0 0 — NN — 0 1 — —Oregon 169 212 496 354 310 — 0 0 — NN — 3 13 3 5Washington 322 406 661 619 789 — 0 0 — NN — 1 6 — —
TerritoriesAmerican Samoa — 0 0 — — — 0 0 — NN N 0 0 N NNC.N.M.I. — — — — — — — — — NN — — — — —Guam — 8 31 — — — 0 0 — NN — 0 0 — —Puerto Rico — 92 265 116 168 — 0 0 — NN N 0 0 N NNU.S. Virgin Islands — 12 29 — 12 — 0 0 — NN — 0 0 — —
C.N.M.I.: Commonwealth of Northern Mariana Islands.U: Unavailable. —: No reported cases. N: Not reportable. NN: Not Nationally Notifiable. Cum: Cumulative year-to-date counts. Med: Median. Max: Maximum.* Case counts for reporting year 2010 and 2011 are provisional and subject to change. For further information on interpretation of these data, see http://www.cdc.gov/ncphi/disss/nndss/
phs/files/ProvisionalNationa%20NotifiableDiseasesSurveillanceData20100927.pdf. Data for TB are displayed in Table IV, which appears quarterly.† Contains data reported through the National Electronic Disease Surveillance System (NEDSS).

Morbidity and Mortality Weekly Report
MMWR / January 21, 2011 / Vol. 60 / No. 2 51
TABLE II. (Continued) Provisional cases of selected notifiable diseases, United States, weeks ending January 15, 2011, and January 16, 2010 (2nd week)*
Reporting area
Dengue Virus Infection
Dengue Fever† Dengue Hemorrhagic Fever§
Current week
Previous 52 weeks Cum 2011
Cum 2010
Current week
Previous 52 weeks Cum 2011
Cum 2010Med Max Med Max
United States — 0 8 — 16 — 0 0 — —New England — 0 0 — — — 0 0 — —
Connecticut — 0 0 — — — 0 0 — —Maine¶ — 0 0 — — — 0 0 — —Massachusetts — 0 0 — — — 0 0 — —New Hampshire — 0 0 — — — 0 0 — —Rhode Island¶ — 0 0 — — — 0 0 — —Vermont¶ — 0 0 — — — 0 0 — —
Mid. Atlantic — 0 2 — 7 — 0 0 — —New Jersey — 0 0 — — — 0 0 — —New York (Upstate) — 0 0 — — — 0 0 — —New York City — 0 2 — 7 — 0 0 — —Pennsylvania — 0 0 — — — 0 0 — —
E.N. Central — 0 1 — 3 — 0 0 — —Illinois — 0 0 — 1 — 0 0 — —Indiana — 0 0 — — — 0 0 — —Michigan — 0 0 — — — 0 0 — —Ohio — 0 1 — 2 — 0 0 — —Wisconsin — 0 0 — — — 0 0 — —
W.N. Central — 0 0 — — — 0 0 — —Iowa — 0 0 — — — 0 0 — —Kansas — 0 0 — — — 0 0 — —Minnesota — 0 0 — — — 0 0 — —Missouri — 0 0 — — — 0 0 — —Nebraska¶ — 0 0 — — — 0 0 — —North Dakota — 0 0 — — — 0 0 — —South Dakota — 0 0 — — — 0 0 — —
S. Atlantic — 0 2 — 2 — 0 0 — —Delaware — 0 0 — — — 0 0 — —District of Columbia — 0 0 — — — 0 0 — —Florida — 0 2 — 2 — 0 0 — —Georgia — 0 0 — — — 0 0 — —Maryland¶ — 0 0 — — — 0 0 — —North Carolina — 0 0 — — — 0 0 — —South Carolina¶ — 0 0 — — — 0 0 — —Virginia¶ — 0 0 — — — 0 0 — —West Virginia — 0 0 — — — 0 0 — —
E.S. Central — 0 0 — — — 0 0 — —Alabama¶ — 0 0 — — — 0 0 — —Kentucky — 0 0 — — — 0 0 — —Mississippi — 0 0 — — — 0 0 — —Tennessee¶ — 0 0 — — — 0 0 — —
W.S. Central — 0 0 — — — 0 0 — —Arkansas¶ — 0 0 — — — 0 0 — —Louisiana — 0 0 — — — 0 0 — —Oklahoma — 0 0 — — — 0 0 — —Texas¶ — 0 0 — — — 0 0 — —
Mountain — 0 1 — 1 — 0 0 — —Arizona — 0 0 — — — 0 0 — —Colorado — 0 0 — — — 0 0 — —Idaho¶ — 0 0 — — — 0 0 — —Montana¶ — 0 0 — — — 0 0 — —Nevada¶ — 0 1 — 1 — 0 0 — —New Mexico¶ — 0 0 — — — 0 0 — —Utah — 0 0 — — — 0 0 — —Wyoming¶ — 0 0 — — — 0 0 — —
Pacific — 0 2 — 3 — 0 0 — —Alaska — 0 0 — — — 0 0 — —California — 0 0 — 1 — 0 0 — —Hawaii — 0 0 — — — 0 0 — —Oregon — 0 0 — — — 0 0 — —Washington — 0 2 — 2 — 0 0 — —
TerritoriesAmerican Samoa — 0 0 — — — 0 0 — —C.N.M.I. — — — — — — — — — —Guam — 0 0 — — — 0 0 — —Puerto Rico — 0 69 — 169 — 0 1 — 4U.S. Virgin Islands — 0 0 — — — 0 0 — —
C.N.M.I.: Commonwealth of Northern Mariana Islands.U: Unavailable. —: No reported cases. N: Not reportable. NN: Not Nationally Notifiable. Cum: Cumulative year-to-date counts. Med: Median. Max: Maximum.* Case counts for reporting year 2010 and 2011 are provisional and subject to change. For further information on interpretation of these data, see http://www.cdc.gov/ncphi/disss/nndss/
phs/files/ProvisionalNationa%20NotifiableDiseasesSurveillanceData20100927.pdf. Data for TB are displayed in Table IV, which appears quarterly.† Dengue Fever includes cases that meet criteria for Dengue Fever with hemorrhage, other clinical and unknown case classifications.§ DHF includes cases that meet criteria for dengue shock syndrome (DSS), a more severe form of DHF.¶ Contains data reported through the National Electronic Disease Surveillance System (NEDSS).

Morbidity and Mortality Weekly Report
52 MMWR / January 21, 2011 / Vol. 60 / No. 2
TABLE II. (Continued) Provisional cases of selected notifiable diseases, United States, weeks ending January 15, 2011, and January 16, 2010 (2nd week)*
Reporting area
Ehrlichiosis/Anaplasmosis†
Ehrlichia chaffeensis Anaplasma phagocytophilum Undetermined
Current week
Previous 52 weeks Cum 2011
Cum 2010
Current week
Previous 52 weeks Cum 2011
Cum 2010
Current week
Previous 52 weeks Cum 2011
Cum 2010Med Max Med Max Med Max
United States — 8 47 1 3 1 11 56 1 2 — 1 10 1 —New England — 0 1 — — — 1 8 — 1 — 0 2 — —
Connecticut — 0 0 — — — 0 5 — — — 0 2 — —Maine§ — 0 1 — — — 0 2 — 1 — 0 0 — —Massachusetts — 0 0 — — — 0 0 — — — 0 0 — —New Hampshire — 0 1 — — — 0 3 — — — 0 1 — —Rhode Island§ — 0 0 — — — 0 5 — — — 0 0 — —Vermont§ — 0 0 — — — 0 0 — — — 0 0 — —
Mid. Atlantic — 1 5 — — 1 4 12 1 — — 0 1 — —New Jersey — 0 0 — — — 0 1 — — — 0 0 — —New York (Upstate) — 0 5 — — 1 4 12 1 — — 0 1 — —New York City — 0 3 — — — 0 1 — — — 0 0 — —Pennsylvania — 0 1 — — — 0 0 — — — 0 0 — —
E.N. Central — 0 4 — — — 4 39 — — — 1 7 1 —Illinois — 0 2 — — — 0 2 — — — 0 2 — —Indiana — 0 0 — — — 0 0 — — — 0 3 1 —Michigan — 0 1 — — — 0 0 — — — 0 1 — —Ohio — 0 3 — — — 0 1 — — — 0 0 — —Wisconsin — 0 1 — — — 4 39 — — — 0 4 — —
W.N. Central — 1 13 — — — 0 3 — — — 0 3 — —Iowa — 0 0 — — — 0 0 — — — 0 0 — —Kansas — 0 1 — — — 0 0 — — — 0 0 — —Minnesota — 0 0 — — — 0 0 — — — 0 0 — —Missouri — 1 13 — — — 0 3 — — — 0 3 — —Nebraska§ — 0 1 — — — 0 0 — — — 0 0 — —North Dakota — 0 0 — — — 0 0 — — — 0 0 — —South Dakota — 0 0 — — — 0 0 — — — 0 0 — —
S. Atlantic — 3 19 1 3 — 1 7 — 1 — 0 2 — —Delaware — 0 3 — — — 0 1 — — — 0 0 — —District of Columbia — 0 0 — — — 0 0 — — — 0 0 — —Florida — 0 2 — 1 — 0 1 — — — 0 0 — —Georgia — 0 4 1 1 — 0 1 — 1 — 0 1 — —Maryland§ — 0 3 — 1 — 0 2 — — — 0 2 — —North Carolina — 1 13 — — — 0 4 — — — 0 0 — —South Carolina§ — 0 2 — — — 0 1 — — — 0 0 — —Virginia§ — 1 8 — — — 0 2 — — — 0 1 — —West Virginia — 0 1 — — — 0 0 — — — 0 0 — —
E.S. Central — 0 10 — — — 0 2 — — — 0 1 — —Alabama§ — 0 3 — — — 0 2 — — — 0 0 — —Kentucky — 0 2 — — — 0 0 — — — 0 0 — —Mississippi — 0 1 — — — 0 1 — — — 0 0 — —Tennessee§ — 0 6 — — — 0 2 — — — 0 1 — —
W.S. Central — 0 5 — — — 0 2 — — — 0 1 — —Arkansas§ — 0 5 — — — 0 2 — — — 0 0 — —Louisiana — 0 1 — — — 0 0 — — — 0 0 — —Oklahoma — 0 5 — — — 0 1 — — — 0 0 — —Texas§ — 0 1 — — — 0 1 — — — 0 1 — —
Mountain — 0 0 — — — 0 0 — — — 0 0 — —Arizona — 0 0 — — — 0 0 — — — 0 0 — —Colorado — 0 0 — — — 0 0 — — — 0 0 — —Idaho§ — 0 0 — — — 0 0 — — — 0 0 — —Montana§ — 0 0 — — — 0 0 — — — 0 0 — —Nevada§ — 0 0 — — — 0 0 — — — 0 0 — —New Mexico§ — 0 0 — — — 0 0 — — — 0 0 — —Utah — 0 0 — — — 0 0 — — — 0 0 — —Wyoming§ — 0 0 — — — 0 0 — — — 0 0 — —
Pacific — 0 1 — — — 0 0 — — — 0 1 — —Alaska — 0 0 — — — 0 0 — — — 0 0 — —California — 0 1 — — — 0 0 — — — 0 1 — —Hawaii — 0 0 — — — 0 0 — — — 0 0 — —Oregon — 0 0 — — — 0 0 — — — 0 0 — —Washington — 0 0 — — — 0 0 — — — 0 0 — —
TerritoriesAmerican Samoa — 0 0 — — — 0 0 — — — 0 0 — —C.N.M.I. — — — — — — — — — — — — — — —Guam — 0 0 — — — 0 0 — — — 0 0 — —Puerto Rico — 0 0 — — — 0 0 — — — 0 0 — —U.S. Virgin Islands — 0 0 — — — 0 0 — — — 0 0 — —
C.N.M.I.: Commonwealth of Northern Mariana Islands.U: Unavailable. —: No reported cases. N: Not reportable. NN: Not Nationally Notifiable. Cum: Cumulative year-to-date counts. Med: Median. Max: Maximum.* Case counts for reporting year 2010 and 2011 are provisional and subject to change. For further information on interpretation of these data, see http://www.cdc.gov/ncphi/disss/nndss/
phs/files/ProvisionalNationa%20NotifiableDiseasesSurveillanceData20100927.pdf. Data for TB are displayed in Table IV, which appears quarterly.† Cumulative total E. ewingii cases reported for year 2010 = 10 and 0 case reports for 2011.§ Contains data reported through the National Electronic Disease Surveillance System (NEDSS).

Morbidity and Mortality Weekly Report
MMWR / January 21, 2011 / Vol. 60 / No. 2 53
TABLE II. (Continued) Provisional cases of selected notifiable diseases, United States, weeks ending January 15, 2011, and January 16, 2010 (2nd week)*
Reporting area
Giardiasis GonorrheaHaemophilus influenzae, invasive†
All ages, all serotypes
Current week
Previous 52 weeks Cum 2011
Cum 2010
Current week
Previous 52 weeks Cum 2011
Cum 2010
Current week
Previous 52 weeks Cum 2011
Cum 2010Med Max Med Max Med Max
United States 134 329 479 307 564 2,452 5,601 6,395 6,142 11,525 32 57 77 88 157New England 1 32 54 5 50 44 100 196 90 125 1 3 9 1 9
Connecticut — 5 13 — 12 — 39 169 — 17 — 0 6 — —Maine§ 1 4 12 3 4 — 3 11 — 9 1 0 1 1 —Massachusetts — 13 25 — 25 42 47 80 84 74 — 2 5 — 7New Hampshire — 3 8 2 2 2 3 7 4 10 — 0 2 — 2Rhode Island§ — 1 7 — — — 5 15 — 12 — 0 2 — —Vermont§ — 3 10 — 7 — 0 17 2 3 — 0 3 — —
Mid. Atlantic 24 61 106 57 101 388 689 1,167 683 1,274 8 11 19 22 32New Jersey — 6 18 — 18 107 110 175 207 216 — 2 5 1 3New York (Upstate) 14 22 54 16 21 90 108 203 126 106 2 3 9 2 6New York City 1 17 33 20 28 — 234 531 — 499 — 2 6 2 5Pennsylvania 9 15 27 21 34 191 255 366 350 453 6 4 11 17 18
E.N. Central 21 55 84 52 111 403 958 1,233 901 2,182 4 10 20 14 27Illinois — 11 26 — 24 4 190 278 67 529 — 3 7 1 10Indiana — 5 14 — 17 — 99 222 — 138 — 1 6 — 3Michigan 8 13 25 14 23 297 254 471 519 685 1 0 3 3 —Ohio 12 17 29 34 29 58 314 381 209 657 3 2 6 9 6Wisconsin 1 8 32 4 18 44 94 155 106 173 — 2 5 1 8
W.N. Central 9 24 101 26 38 51 286 349 204 551 1 3 14 1 9Iowa 3 5 11 7 13 1 33 57 31 80 — 0 1 — —Kansas — 4 10 1 12 — 40 62 7 76 — 0 2 — 1Minnesota — 0 75 — — — 37 62 — 77 — 0 9 — —Missouri 3 8 26 11 5 50 141 181 135 255 1 2 4 1 7Nebraska§ 3 4 9 7 4 — 22 48 23 41 — 0 3 — 1North Dakota — 0 5 — — — 1 8 — 2 — 0 2 — —South Dakota — 1 7 — 4 — 7 20 8 20 — 0 0 — —
S. Atlantic 39 69 101 79 92 703 1,341 1,790 1,890 2,927 12 14 26 24 38Delaware — 0 5 — 1 12 19 48 35 26 — 0 1 — —District of Columbia — 1 5 — — — 34 66 30 53 — 0 1 — —Florida 38 41 75 66 58 195 388 489 525 868 9 3 9 14 6Georgia — 6 51 — 9 — 205 392 — 160 — 3 9 6 13Maryland§ — 5 11 4 8 104 133 217 221 133 2 1 5 2 2North Carolina N 0 0 N N 159 245 596 586 976 — 2 9 — 6South Carolina§ — 2 9 1 3 111 153 262 189 335 — 1 5 — 8Virginia§ 1 9 19 8 13 106 150 223 267 359 1 2 4 2 3West Virginia — 0 6 — — 16 10 26 37 17 — 0 3 — —
E.S. Central 1 5 12 1 7 143 469 697 466 833 2 3 10 12 12Alabama§ 1 4 11 1 3 127 158 246 292 294 2 0 4 6 —Kentucky N 0 0 N N 16 73 142 16 75 — 1 3 2 2Mississippi N 0 0 N N — 111 216 80 153 — 0 2 — —Tennessee§ — 0 6 — 4 — 137 195 78 311 — 2 9 4 10
W.S. Central 1 7 14 2 14 370 833 1,298 829 2,206 — 2 10 1 4Arkansas§ 1 2 7 1 2 79 82 133 184 168 — 0 3 — —Louisiana — 3 8 1 9 201 90 273 289 503 — 0 4 1 3Oklahoma — 0 5 — 3 90 74 332 91 389 — 1 7 — 1Texas§ N 0 0 N N — 601 959 265 1,146 — 0 1 — —
Mountain 10 31 51 22 53 125 178 235 281 236 2 5 15 6 22Arizona — 3 8 1 8 50 60 100 68 63 — 2 10 — 14Colorado 7 13 27 15 12 — 54 95 47 93 — 1 5 1 2Idaho§ 3 4 9 6 9 — 2 14 — 8 2 0 2 2 —Montana§ — 2 7 — 2 1 2 6 2 2 — 0 1 — —Nevada§ — 1 11 — 2 44 30 94 98 57 — 0 2 — —New Mexico§ — 2 5 — — 30 21 35 65 7 — 1 3 3 6Utah — 4 11 — 13 — 5 15 1 6 — 0 4 — —Wyoming§ — 1 7 — 7 — 0 4 — — — 0 2 — —
Pacific 28 53 80 63 98 225 605 815 798 1,191 2 2 21 7 4Alaska — 2 6 1 6 — 24 37 19 48 — 0 2 1 2California 25 33 57 49 67 181 496 691 688 978 2 0 18 3 —Hawaii — 0 4 — — — 14 26 — 32 — 0 2 — —Oregon 3 9 20 13 21 9 19 34 23 38 — 1 5 3 2Washington — 9 25 — 4 35 53 83 68 95 — 0 2 — —
TerritoriesAmerican Samoa — 0 0 — — — 0 0 — — — 0 0 — —C.N.M.I. — — — — — — — — — — — — — — —Guam — 0 1 — — — 0 5 — — — 0 0 — —Puerto Rico — 1 8 — — — 5 14 4 2 — 0 1 — —U.S. Virgin Islands — 0 0 — — — 3 7 — 3 — 0 0 — —
C.N.M.I.: Commonwealth of Northern Mariana Islands.U: Unavailable. —: No reported cases. N: Not reportable. NN: Not Nationally Notifiable. Cum: Cumulative year-to-date counts. Med: Median. Max: Maximum.* Case counts for reporting year 2010 and 2011 are provisional and subject to change. For further information on interpretation of these data, see http://www.cdc.gov/ncphi/disss/nndss/
phs/files/ProvisionalNationa%20NotifiableDiseasesSurveillanceData20100927.pdf. Data for TB are displayed in Table IV, which appears quarterly.† Data for H. influenzae (age <5 yrs for serotype b, nonserotype b, and unknown serotype) are available in Table I.§ Contains data reported through the National Electronic Disease Surveillance System (NEDSS).

Morbidity and Mortality Weekly Report
54 MMWR / January 21, 2011 / Vol. 60 / No. 2
TABLE II. (Continued) Provisional cases of selected notifiable diseases, United States, weeks ending January 15, 2011, and January 16, 2010 (2nd week)*
Hepatitis (viral, acute), by type
Reporting area
A B C
Current week
Previous 52 weeks Cum 2011
Cum 2010
Current week
Previous 52 weeks Cum 2011
Cum 2010
Current week
Previous 52 weeks Cum 2011
Cum 2010Med Max Med Max Med Max
United States 19 30 44 29 49 10 61 91 29 90 — 13 25 7 23New England — 2 5 — 5 — 1 5 1 3 — 1 4 — 4
Connecticut — 0 3 — 2 — 0 2 — 2 — 0 4 — 1Maine† — 0 1 — — — 0 2 — — — 0 0 — —Massachusetts — 1 5 — 3 — 0 2 — 1 — 0 2 — 3New Hampshire — 0 1 — — — 0 2 1 — N 0 0 N NRhode Island† — 0 4 — — U 0 0 U U U 0 0 U UVermont† — 0 0 — — — 0 1 — — — 0 1 — —
Mid. Atlantic — 4 10 3 7 — 5 10 1 4 — 2 6 — 1New Jersey — 0 2 — 2 — 1 5 — — — 0 2 — —New York (Upstate) — 1 4 — — — 1 6 — — — 1 4 — 1New York City — 1 7 1 3 — 1 4 — 2 — 0 1 — —Pennsylvania — 1 4 2 2 — 1 5 1 2 — 0 3 — —
E.N. Central 1 4 9 2 10 1 9 17 1 18 — 2 7 — 2Illinois — 1 3 — 1 — 2 5 — 5 — 0 1 — —Indiana — 0 2 — — — 1 5 — 3 — 0 2 — —Michigan — 1 5 — 3 — 3 6 — 5 — 1 6 — 2Ohio 1 1 5 2 2 1 2 6 1 2 — 0 1 — —Wisconsin — 0 3 — 4 — 2 8 — 3 — 0 2 — —
W.N. Central — 1 13 1 3 — 2 7 1 3 — 0 8 — —Iowa — 0 3 1 1 — 0 2 — — — 0 0 — —Kansas — 0 2 — — — 0 2 — — — 0 1 — —Minnesota — 0 12 — — — 0 4 — — — 0 6 — —Missouri — 0 2 — 1 — 1 3 — 2 — 0 2 — —Nebraska† — 0 4 — 1 — 0 2 1 1 — 0 1 — —North Dakota — 0 3 — — — 0 0 — — — 0 0 — —South Dakota — 0 1 — — — 0 1 — — — 0 0 — —
S. Atlantic 4 6 14 6 10 8 16 32 15 27 — 2 6 2 4Delaware — 0 1 — — — 0 2 — 1 U 0 0 U UDistrict of Columbia — 0 1 — — — 0 1 — — — 0 1 — —Florida 1 3 7 2 3 5 5 11 10 13 — 0 0 — —Georgia 1 1 3 2 2 — 3 7 — 9 — 0 2 — —Maryland† 2 0 3 2 — 1 1 6 2 — — 0 3 2 2North Carolina — 0 5 — — — 1 16 — 2 — 1 3 — 2South Carolina† — 0 3 — 4 — 1 4 — — — 0 1 — —Virginia† — 1 6 — 1 2 1 6 3 2 — 0 2 — —West Virginia — 0 5 — — — 0 12 — — — 0 5 — —
E.S. Central — 1 5 1 1 — 8 13 8 19 — 3 8 4 2Alabama† — 0 2 — 1 — 1 4 — 6 — 0 1 — —Kentucky — 0 5 1 — — 2 8 5 6 — 2 6 3 2Mississippi — 0 1 — — — 0 3 — — U 0 0 U UTennessee† — 0 2 — — — 3 8 3 7 — 1 4 1 —
W.S. Central — 2 7 — — 1 9 29 1 6 — 1 5 — 1Arkansas† — 0 1 — — — 0 4 — — — 0 0 — —Louisiana — 0 2 — — — 1 3 — 3 — 0 1 — —Oklahoma — 0 1 — — — 2 6 — 1 — 0 3 — —Texas† — 2 7 — — 1 5 25 1 2 — 0 3 — 1
Mountain 3 3 8 3 7 — 2 8 — 7 — 1 5 1 1Arizona 2 1 4 2 5 — 0 2 — 2 U 0 0 U UColorado 1 1 3 1 1 — 0 5 — 1 — 0 2 1 1Idaho† — 0 2 — — — 0 1 — — — 0 2 — —Montana† — 0 1 — — — 0 0 — — — 0 1 — —Nevada† — 0 2 — — — 0 3 — 4 — 0 1 — —New Mexico† — 0 1 — — — 0 1 — — — 0 2 — —Utah — 0 1 — 1 — 0 1 — — — 0 2 — —Wyoming† — 0 3 — — — 0 1 — — — 0 0 — —
Pacific 11 5 17 13 6 — 6 17 1 3 — 1 4 — 8Alaska — 0 1 — — — 0 1 — 1 U 0 0 U UCalifornia 11 4 16 13 6 — 4 16 — 2 — 0 2 — 5Hawaii — 0 1 — — — 0 1 — — U 0 0 U UOregon — 0 2 — — — 1 3 1 — — 0 3 — 3Washington — 0 2 — — — 1 3 — — — 0 3 — —
TerritoriesAmerican Samoa — 0 0 — — — 0 0 — — — 0 0 — —C.N.M.I. — — — — — — — — — — — — — — —Guam — 0 6 — — — 1 6 — — — 0 7 — —Puerto Rico — 0 2 — — — 0 2 — — — 0 0 — —U.S. Virgin Islands — 0 0 — — — 0 0 — — — 0 0 — —
C.N.M.I.: Commonwealth of Northern Mariana Islands.U: Unavailable. —: No reported cases. N: Not reportable. NN: Not Nationally Notifiable. Cum: Cumulative year-to-date counts. Med: Median. Max: Maximum.* Case counts for reporting year 2010 are provisional and subject to change. For further information on interpretation of these data, see http://www.cdc.gov/ncphi/disss/nndss/phs/files/
ProvisionalNationa%20NotifiableDiseasesSurveillanceData20100927.pdf. Data for HIV/AIDS, AIDS and TB, when available, are displayed in Table IV, which appears quarterly.† Contains data reported through the National Electronic Disease Surveillance System (NEDSS).

Morbidity and Mortality Weekly Report
MMWR / January 21, 2011 / Vol. 60 / No. 2 55
TABLE II. (Continued) Provisional cases of selected notifiable diseases, United States, weeks ending January 15, 2011, and January 16, 2010 (2nd week)*
Reporting area
Legionellosis Lyme disease Malaria
Current week
Previous 52 weeks Cum 2011
Cum 2010
Current week
Previous 52 weeks Cum 2011
Cum 2010
Current week
Previous 52 weeks Cum 2011
Cum 2010Med Max Med Max Med Max
United States 28 56 116 53 93 28 397 1,670 89 531 15 26 80 24 37New England — 4 15 — 5 — 126 503 1 188 — 1 5 — 2
Connecticut — 1 6 — — — 47 212 — 97 — 0 1 — —Maine† — 0 4 — — — 11 65 — 1 — 0 1 — —Massachusetts — 2 10 — 2 — 41 223 — 61 — 1 4 — 2New Hampshire — 0 5 — 1 — 24 68 1 25 — 0 2 — —Rhode Island† — 0 4 — 1 — 1 40 — — — 0 1 — —Vermont† — 0 2 — 1 — 4 27 — 4 — 0 1 — —
Mid. Atlantic 7 14 47 11 20 19 171 739 58 230 2 7 17 4 12New Jersey — 1 11 — 3 — 49 220 — 71 — 0 1 — —New York (Upstate) 3 5 19 3 5 1 38 200 2 4 1 1 6 1 4New York City — 2 17 2 5 — 2 7 — 9 — 4 14 2 5Pennsylvania 4 6 18 6 7 18 86 385 56 146 1 1 3 1 3
E.N. Central 6 12 44 11 16 — 26 324 — 21 2 2 9 3 3Illinois — 2 15 — 5 — 1 17 — — — 0 7 — 2Indiana 2 2 6 2 1 — 1 7 — 1 — 0 2 — —Michigan 1 2 20 3 3 — 1 13 — — — 0 4 — —Ohio 3 4 15 6 6 — 0 9 — 1 2 1 5 3 1Wisconsin — 1 11 — 1 — 21 297 — 19 — 0 1 — —
W.N. Central — 2 9 1 1 — 1 11 — — — 1 4 — 1Iowa — 0 2 — — — 0 10 — — — 0 2 — 1Kansas — 0 2 — — — 0 1 — — — 0 2 — —Minnesota — 0 8 — — — 0 0 — — — 0 3 — —Missouri — 0 4 1 1 — 0 1 — — — 0 3 — —Nebraska† — 0 2 — — — 0 2 — — — 0 2 — —North Dakota — 0 1 — — — 0 5 — — — 0 1 — —South Dakota — 0 2 — — — 0 1 — — — 0 2 — —
S. Atlantic 2 10 27 6 14 8 56 174 26 84 8 7 44 14 13Delaware — 0 3 — 2 — 11 32 3 23 — 0 1 — —District of Columbia — 0 4 — — — 0 4 — — — 0 2 — —Florida 1 3 9 3 2 — 2 10 1 2 2 3 7 4 3Georgia — 1 4 — 1 — 0 2 — 1 — 0 6 2 2Maryland† 1 2 6 3 8 3 24 101 11 29 6 1 24 6 4North Carolina — 0 7 — — — 1 9 — 2 — 0 13 — 2South Carolina† — 0 2 — — — 0 3 — — — 0 1 — —Virginia† — 1 10 — 1 5 16 76 11 26 — 1 5 2 2West Virginia — 0 3 — — — 0 29 — 1 — 0 1 — —
E.S. Central — 2 10 3 8 — 0 4 — 4 — 0 3 — 1Alabama† — 0 2 — — — 0 1 — — — 0 1 — 1Kentucky — 0 4 2 3 — 0 1 — — — 0 1 — —Mississippi — 0 3 — — — 0 0 — — — 0 2 — —Tennessee† — 1 6 1 5 — 0 4 — 4 — 0 2 — —
W.S. Central — 3 8 1 2 — 2 9 — 1 — 1 7 — 3Arkansas† — 0 2 — — — 0 0 — — — 0 1 — —Louisiana — 0 2 — 1 — 0 1 — — — 0 1 — 1Oklahoma — 0 3 — — — 0 0 — — — 0 1 — —Texas† — 2 7 1 1 — 2 9 — 1 — 1 7 — 2
Mountain — 3 10 — 4 — 0 3 — 2 1 1 4 1 1Arizona — 1 7 — 2 — 0 1 — — 1 0 3 1 —Colorado — 0 2 — 1 — 0 1 — — — 0 3 — —Idaho† — 0 1 — — — 0 2 — 1 — 0 1 — —Montana† — 0 1 — — — 0 1 — — — 0 1 — —Nevada† — 0 2 — 1 — 0 1 — — — 0 1 — —New Mexico† — 0 2 — — — 0 2 — — — 0 1 — —Utah — 0 2 — — — 0 1 — 1 — 0 1 — 1Wyoming† — 0 2 — — — 0 0 — — — 0 0 — —
Pacific 13 5 19 20 23 1 4 10 4 1 2 3 10 2 1Alaska — 0 2 — — — 0 1 — — — 0 1 — —California 13 4 19 20 23 1 3 7 4 — 2 2 9 2 1Hawaii — 0 1 — — N 0 0 N N — 0 1 — —Oregon — 0 3 — — — 1 4 — 1 — 0 3 — —Washington — 0 4 — — — 0 3 — — — 0 5 — —
TerritoriesAmerican Samoa — 0 0 — — N 0 0 N N — 0 0 — —C.N.M.I. — — — — — — — — — — — — — — —Guam — 0 1 — — — 0 0 — — — 0 0 — —Puerto Rico — 0 0 — — N 0 0 N N — 0 2 — 1U.S. Virgin Islands — 0 0 — — — 0 0 — — — 0 0 — —
C.N.M.I.: Commonwealth of Northern Mariana Islands.U: Unavailable. —: No reported cases. N: Not reportable. NN: Not Nationally Notifiable. Cum: Cumulative year-to-date counts. Med: Median. Max: Maximum.* Case counts for reporting year 2010 and 2011 are provisional and subject to change. For further information on interpretation of these data, see http://www.cdc.gov/ncphi/disss/nndss/
phs/files/ProvisionalNationa%20NotifiableDiseasesSurveillanceData20100927.pdf. Data for TB are displayed in Table IV, which appears quarterly.† Contains data reported through the National Electronic Disease Surveillance System (NEDSS).

Morbidity and Mortality Weekly Report
56 MMWR / January 21, 2011 / Vol. 60 / No. 2
TABLE II. (Continued) Provisional cases of selected notifiable diseases, United States, weeks ending January 15, 2011, and January 16, 2010 (2nd week)*
Reporting area
Meningococcal disease, invasive† All serogroups Mumps Pertussis
Current week
Previous 52 weeks Cum 2011
Cum 2010
Current week
Previous 52 weeks Cum 2011
Cum 2010
Current week
Previous 52 weeks Cum 2011
Cum 2010Med Max Med Max Med Max
United States 3 15 26 16 39 1 30 221 6 78 117 449 784 285 301New England — 0 3 1 1 — 0 4 — 1 — 9 23 — 10
Connecticut — 0 1 1 — — 0 2 — — — 2 8 — 2Maine§ — 0 1 — — — 0 1 — 1 — 1 5 — —Massachusetts — 0 2 — 1 — 0 2 — — — 5 13 — 6New Hampshire — 0 0 — — — 0 1 — — — 0 2 — 1Rhode Island§ — 0 0 — — — 0 0 — — — 0 9 — —Vermont§ — 0 1 — — — 0 0 — — — 0 4 — 1
Mid. Atlantic 1 1 5 6 6 1 19 209 1 71 22 37 143 38 16New Jersey — 0 2 — 2 — 3 24 — 37 — 3 9 — 4New York (Upstate) — 0 2 — 1 — 3 99 — 34 11 11 80 13 1New York City 1 0 3 4 2 — 1 201 — — — 0 9 — —Pennsylvania — 0 2 2 1 1 0 16 1 — 11 14 69 25 11
E.N. Central — 2 9 2 10 — 1 7 2 5 38 108 183 102 109Illinois — 0 3 — 2 — 0 2 — 2 — 20 50 3 20Indiana — 0 2 — 4 — 0 1 — 1 — 12 26 — 14Michigan — 0 4 — 2 — 0 2 — 2 4 28 57 26 25Ohio — 0 2 2 1 — 0 5 2 — 32 33 80 69 34Wisconsin — 0 3 — 1 — 0 2 — — 2 9 21 4 16
W.N. Central 1 1 5 2 2 — 1 14 1 — 9 35 193 25 30Iowa — 0 3 — — — 0 7 — — — 12 34 — 5Kansas — 0 2 — — — 0 1 — — — 3 9 — 8Minnesota — 0 1 — — — 0 1 — — — 0 143 — —Missouri — 0 4 1 2 — 0 2 — — 6 8 44 16 11Nebraska§ 1 0 2 1 — — 0 10 1 — 3 4 13 9 4North Dakota — 0 1 — — — 0 1 — — — 0 30 — —South Dakota — 0 0 — — — 0 1 — — — 0 5 — 2
S. Atlantic — 2 7 1 8 — 1 4 — 1 12 30 78 30 47Delaware — 0 1 — 1 — 0 0 — — — 0 4 — —District of Columbia — 0 0 — — — 0 1 — — — 0 2 — —Florida — 1 5 1 5 — 0 3 — — 5 6 28 8 9Georgia — 0 2 — 1 — 0 1 — — — 4 18 — 4Maryland§ — 0 1 — — — 0 1 — 1 4 3 8 5 5North Carolina — 0 2 — — — 0 0 — — — 0 32 — 25South Carolina§ — 0 1 — — — 0 2 — — — 6 23 10 2Virginia§ — 0 2 — 1 — 0 2 — — 3 5 36 7 1West Virginia — 0 1 — — — 0 1 — — — 1 21 — 1
E.S. Central — 1 3 — 2 — 0 2 — — 1 16 34 13 28Alabama§ — 0 1 — 1 — 0 2 — — — 4 8 — 5Kentucky — 0 2 — 1 — 0 1 — — — 6 16 9 14Mississippi — 0 1 — — — 0 0 — — — 1 8 — 1Tennessee§ — 0 2 — — — 0 1 — — 1 4 11 4 8
W.S. Central — 1 9 — 2 — 1 11 — — — 55 113 2 17Arkansas§ — 0 1 — 1 — 0 1 — — — 3 14 — —Louisiana — 0 4 — 1 — 0 2 — — — 1 3 — 5Oklahoma — 0 7 — — — 0 0 — — — 0 23 — —Texas§ — 1 4 — — — 1 11 — — — 49 108 2 12
Mountain 1 1 6 3 2 — 0 4 1 — 23 29 92 50 31Arizona 1 0 2 2 1 — 0 1 — — 2 7 18 4 17Colorado — 0 4 — — — 0 1 — — 19 5 76 44 2Idaho§ — 0 1 1 — — 0 1 — — 2 2 15 2 3Montana§ — 0 1 — — — 0 0 — — — 1 16 — —Nevada§ — 0 1 — — — 0 1 — — — 0 7 — —New Mexico§ — 0 1 — 1 — 0 2 1 — — 2 11 — 5Utah — 0 1 — — — 0 1 — — — 4 13 — 4Wyoming§ — 0 1 — — — 0 1 — — — 0 2 — —
Pacific — 3 9 1 6 — 0 18 1 — 12 71 220 25 13Alaska — 0 1 — — — 0 1 — — — 0 6 1 1California — 2 9 — 5 — 0 18 — — 12 49 192 24 3Hawaii — 0 1 — — — 0 1 — — — 0 6 — —Oregon — 1 2 1 1 — 0 1 1 — — 6 15 — 9Washington — 0 4 — — — 0 2 — — — 6 38 — —
TerritoriesAmerican Samoa — 0 0 — — — 0 0 — — — 0 0 — —C.N.M.I. — — — — — — — — — — — — — — —Guam — 0 0 — — — 1 15 — — — 0 0 — —Puerto Rico — 0 0 — — — 0 1 — — — 0 1 — —U.S. Virgin Islands — 0 0 — — — 0 0 — — — 0 0 — —
C.N.M.I.: Commonwealth of Northern Mariana Islands.U: Unavailable. —: No reported cases. N: Not reportable. NN: Not Nationally Notifiable. Cum: Cumulative year-to-date counts. Med: Median. Max: Maximum.* Case counts for reporting year 2010 and 2011 are provisional and subject to change. For further information on interpretation of these data, see http://www.cdc.gov/ncphi/disss/nndss/
phs/files/ProvisionalNationa%20NotifiableDiseasesSurveillanceData20100927.pdf. Data for TB are displayed in Table IV, which appears quarterly.† Data for meningococcal disease, invasive caused by serogroups A, C, Y, and W-135; serogroup B; other serogroup; and unknown serogroup are available in Table I.§ Contains data reported through the National Electronic Disease Surveillance System (NEDSS).

Morbidity and Mortality Weekly Report
MMWR / January 21, 2011 / Vol. 60 / No. 2 57
TABLE II. (Continued) Provisional cases of selected notifiable diseases, United States, weeks ending January 15, 2011, and January 16, 2010 (2nd week)*
Reporting area
Rabies, animal Salmonellosis Shiga toxin-producing E. coli (STEC)†
Current week
Previous 52 weeks Cum 2011
Cum 2010
Current week
Previous 52 weeks Cum 2011
Cum 2010
Current week
Previous 52 weeks Cum 2011
Cum 2010Med Max Med Max Med Max
United States 5 62 143 15 64 242 859 1,737 522 1,605 17 85 214 58 135New England 2 4 13 3 7 1 31 68 6 518 — 2 13 — 61
Connecticut — 0 9 — — — 0 0 — 480 — 0 0 — 57Maine§ — 1 4 1 2 1 2 7 3 2 — 0 3 — —Massachusetts — 0 0 — — — 23 52 — 24 — 1 9 — 4New Hampshire — 0 5 — 1 — 3 12 — 4 — 0 2 — —Rhode Island§ — 0 4 — — — 2 17 — 7 — 0 1 — —Vermont§ 2 1 3 2 4 — 2 5 3 1 — 0 2 — —
Mid. Atlantic 3 19 41 11 19 24 95 218 50 142 4 9 32 5 7New Jersey — 0 0 — — — 16 57 — 34 — 1 9 — 2New York (Upstate) 3 9 19 11 11 8 25 63 11 12 4 3 13 4 —New York City — 1 12 — — 4 24 56 11 44 — 1 7 — 2Pennsylvania — 8 24 — 8 12 31 81 28 52 — 2 13 1 3
E.N. Central — 2 27 1 1 23 89 244 49 141 1 10 43 2 22Illinois — 1 11 1 — — 32 114 1 49 — 1 9 — 5Indiana — 0 0 — — — 12 62 — 20 — 2 10 — 2Michigan — 1 5 — — 2 15 49 9 24 — 2 16 — 3Ohio — 0 12 — 1 21 24 47 39 33 1 2 11 2 2Wisconsin — 0 0 — — — 9 45 — 15 — 3 17 — 10
W.N. Central — 4 14 — 4 18 46 97 36 47 — 11 39 3 7Iowa — 0 3 — — 2 9 34 6 3 — 2 16 — —Kansas — 1 4 — 4 3 7 18 5 8 — 1 5 — 3Minnesota — 0 4 — — — 0 32 — — — 0 7 — —Missouri — 1 6 — — 13 13 44 22 21 — 4 27 — 3Nebraska§ — 1 4 — — — 4 13 3 10 — 2 6 3 1North Dakota — 0 3 — — — 0 13 — 2 — 0 10 — —South Dakota — 0 0 — — — 3 17 — 3 — 0 4 — —
S. Atlantic — 20 104 — 24 106 258 612 200 415 5 14 30 21 14Delaware — 0 0 — — — 3 11 1 3 — 0 2 — —District of Columbia — 0 0 — — — 1 6 — 2 — 0 1 — 1Florida — 0 96 — — 65 108 226 113 177 3 4 23 11 3Georgia — 0 0 — — 14 43 133 38 75 — 2 15 2 2Maryland§ — 6 14 — 9 14 17 55 20 24 1 2 9 5 5North Carolina — 0 0 — — — 32 240 — 92 — 1 10 — 1South Carolina§ — 0 0 — — 2 25 99 2 23 — 0 2 — —Virginia§ — 10 25 — 14 11 19 57 26 19 1 2 9 3 2West Virginia — 1 7 — 1 — 2 13 — — — 0 3 — —
E.S. Central — 3 7 — 1 5 55 177 34 76 2 5 22 7 5Alabama§ — 1 4 — — — 18 52 5 26 — 1 4 1 4Kentucky — 0 4 — — — 11 32 14 14 — 1 6 1 —Mississippi — 0 1 — — — 18 67 3 13 — 0 12 — 1Tennessee§ — 1 4 — 1 5 16 53 12 23 2 2 7 5 —
W.S. Central — 0 30 — — 5 121 264 10 53 1 5 18 1 4Arkansas§ — 0 7 — — 4 12 43 6 5 1 1 5 1 1Louisiana — 0 0 — — — 20 49 3 23 — 0 2 — 2Oklahoma — 0 30 — — — 12 39 — 4 — 0 8 — —Texas§ — 0 0 — — 1 76 173 1 21 — 4 14 — 1
Mountain — 1 7 — 2 11 48 108 30 94 — 11 34 2 10Arizona — 0 0 — — — 15 42 1 41 — 1 13 1 1Colorado — 0 0 — — 10 11 24 24 16 — 3 21 — 5Idaho§ — 0 2 — — 1 3 9 4 6 — 2 7 1 2Montana§ — 0 3 — — — 1 5 — 10 — 1 5 — —Nevada§ — 0 2 — — — 4 22 — 3 — 0 5 — —New Mexico§ — 0 2 — — — 6 19 1 8 — 1 6 — 2Utah — 0 2 — — — 6 17 — 8 — 1 7 — —Wyoming§ — 0 4 — 2 — 1 8 — 2 — 0 3 — —
Pacific — 2 12 — 6 49 114 253 107 119 4 12 36 17 5Alaska — 0 2 — 3 — 1 5 1 2 — 0 1 — 1California — 1 12 — 2 49 79 217 101 103 4 6 22 17 4Hawaii — 0 0 — — — 3 14 — — — 0 4 — —Oregon — 0 2 — 1 — 8 48 5 14 — 2 14 — —Washington — 0 0 — — — 15 33 — — — 3 19 — —
TerritoriesAmerican Samoa N 0 0 N N — 0 1 — — — 0 0 — —C.N.M.I. — — — — — — — — — — — — — — —Guam — 0 0 — — — 0 2 — — — 0 0 — —Puerto Rico — 1 3 1 2 — 10 21 — 12 — 0 0 — —U.S. Virgin Islands — 0 0 — — — 0 0 — — — 0 0 — —
C.N.M.I.: Commonwealth of Northern Mariana Islands.U: Unavailable. —: No reported cases. N: Not reportable. NN: Not Nationally Notifiable. Cum: Cumulative year-to-date counts. Med: Median. Max: Maximum.* Case counts for reporting year 2010 and 2011 are provisional and subject to change. For further information on interpretation of these data, see http://www.cdc.gov/ncphi/disss/nndss/
phs/files/ProvisionalNationa%20NotifiableDiseasesSurveillanceData20100927.pdf. Data for TB are displayed in Table IV, which appears quarterly.† Includes E. coli O157:H7; Shiga toxin-positive, serogroup non-O157; and Shiga toxin-positive, not serogrouped.§ Contains data reported through the National Electronic Disease Surveillance System (NEDSS).

Morbidity and Mortality Weekly Report
58 MMWR / January 21, 2011 / Vol. 60 / No. 2
TABLE II. (Continued) Provisional cases of selected notifiable diseases, United States, weeks ending January 15, 2011, and January 16, 2010 (2nd week)*
Spotted Fever Rickettsiosis (including RMSF)†
Reporting area
Shigellosis Confirmed Probable
Current week
Previous 52 weeks Cum 2011
Cum 2010
Current week
Previous 52 weeks Cum 2011
Cum 2010
Current week
Previous 52 weeks Cum 2011
Cum 2010Med Max Med Max Med Max
United States 92 269 452 203 476 1 2 11 4 5 — 23 91 5 3New England — 4 17 — 71 — 0 0 — — — 0 1 — —
Connecticut — 0 0 — 63 — 0 0 — — — 0 0 — —Maine§ — 0 1 — — — 0 0 — — — 0 1 — —Massachusetts — 3 16 — 8 — 0 0 — — — 0 0 — —New Hampshire — 0 2 — — — 0 0 — — — 0 1 — —Rhode Island§ — 0 2 — — — 0 0 — — — 0 0 — —Vermont§ — 0 1 — — — 0 0 — — — 0 0 — —
Mid. Atlantic 4 31 64 15 85 — 0 1 — — — 1 4 — —New Jersey — 6 16 — 12 — 0 0 — — — 0 0 — —New York (Upstate) 3 3 15 3 4 — 0 1 — — — 0 3 — —New York City — 5 14 7 17 — 0 1 — — — 0 4 — —Pennsylvania 1 12 55 5 52 — 0 1 — — — 0 3 — —
E.N. Central 8 26 238 15 61 — 0 1 — — — 1 10 — —Illinois — 9 228 — 28 — 0 1 — — — 0 5 — —Indiana§ — 1 4 — 2 — 0 1 — — — 0 5 — —Michigan — 5 10 3 2 — 0 0 — — — 0 1 — —Ohio 8 5 18 12 17 — 0 0 — — — 0 2 — —Wisconsin — 4 21 — 12 — 0 0 — — — 0 1 — —
W.N. Central 14 37 81 26 107 — 0 4 — — — 4 21 — —Iowa — 1 4 — 5 — 0 0 — — — 0 1 — —Kansas§ 2 5 13 4 7 — 0 1 — — — 0 0 — —Minnesota — 0 3 — — — 0 0 — — — 0 0 — —Missouri 11 29 66 21 95 — 0 4 — — — 4 20 — —Nebraska§ 1 1 10 1 — — 0 1 — — — 0 1 — —North Dakota — 0 0 — — — 0 0 — — — 0 1 — —South Dakota — 0 2 — — — 0 0 — — — 0 0 — —
S. Atlantic 40 51 134 80 56 1 1 9 1 4 — 8 60 — 3Delaware§ — 0 4 — 5 — 0 1 — — — 0 3 — —District of Columbia — 0 4 — 1 — 0 1 — — — 0 0 — —Florida§ 34 23 53 65 13 — 0 1 — — — 0 2 — —Georgia 3 14 39 10 30 — 1 6 — 4 — 0 0 — —Maryland§ 2 2 8 3 1 1 0 1 1 — — 0 5 — 1North Carolina — 3 36 — 3 — 0 3 — — — 2 48 — 1South Carolina§ — 1 5 — 3 — 0 1 — — — 0 2 — 1Virginia§ 1 3 8 2 — — 0 2 — — — 2 12 — —West Virginia — 0 66 — — — 0 0 — — — 0 0 — —
E.S. Central 2 13 40 11 15 — 0 3 — — — 5 29 1 —Alabama§ — 4 14 4 1 — 0 1 — — — 1 8 — —Kentucky — 3 28 3 6 — 0 2 — — — 0 0 — —Mississippi — 1 4 — 1 — 0 0 — — — 0 3 — —Tennessee§ 2 5 14 4 7 — 0 2 — — — 4 20 1 —
W.S. Central 6 52 109 9 24 — 0 3 — — — 1 18 — —Arkansas§ — 1 6 — 4 — 0 2 — — — 0 17 — —Louisiana — 5 13 — 3 — 0 0 — — — 0 1 — —Oklahoma — 5 13 — — — 0 3 — — — 0 6 — —Texas§ 6 42 88 9 17 — 0 1 — — — 0 3 — —
Mountain 2 15 32 16 28 — 0 5 3 — — 0 4 4 —Arizona — 8 18 4 17 — 0 5 3 — — 0 4 4 —Colorado§ 2 2 8 10 5 — 0 1 — — — 0 1 — —Idaho§ — 0 3 1 — — 0 0 — — — 0 1 — —Montana§ — 0 1 — — — 0 1 — — — 0 1 — —Nevada§ — 0 6 — — — 0 0 — — — 0 0 — —New Mexico§ — 3 10 1 4 — 0 0 — — — 0 1 — —Utah — 1 4 — 2 — 0 0 — — — 0 1 — —Wyoming§ — 0 0 — — — 0 0 — — — 0 1 — —
Pacific 16 21 58 31 29 — 0 2 — 1 — 0 0 — —Alaska — 0 1 — — N 0 0 N N N 0 0 N NCalifornia 16 17 52 29 29 — 0 2 — 1 — 0 0 — —Hawaii — 0 3 — — N 0 0 N N N 0 0 N NOregon — 1 4 2 — — 0 1 — — — 0 0 — —Washington — 1 17 — — — 0 0 — — — 0 0 — —
TerritoriesAmerican Samoa 1 1 1 1 — N 0 0 N N N 0 0 N NC.N.M.I. — — — — — — — — — — — — — — —Guam — 0 1 — — N 0 0 N N N 0 0 N NPuerto Rico — 0 1 — — N 0 0 N N N 0 0 N NU.S. Virgin Islands — 0 0 — — — 0 0 — — — 0 0 — —
C.N.M.I.: Commonwealth of Northern Mariana Islands.U: Unavailable. —: No reported cases. N: Not reportable. NN: Not Nationally Notifiable. Cum: Cumulative year-to-date counts. Med: Median. Max: Maximum.* Case counts for reporting year 2010 and 2011 are provisional and subject to change. For further information on interpretation of these data, see http://www.cdc.gov/ncphi/disss/nndss/
phs/files/ProvisionalNationa%20NotifiableDiseasesSurveillanceData20100927.pdf. Data for TB are displayed in Table IV, which appears quarterly.† Illnesses with similar clinical presentation that result from Spotted fever group rickettsia infections are reported as Spotted fever rickettsioses. Rocky Mountain spotted fever (RMSF) caused
by Rickettsia rickettsii, is the most common and well-known spotted fever.§ Contains data reported through the National Electronic Disease Surveillance System (NEDSS).

Morbidity and Mortality Weekly Report
MMWR / January 21, 2011 / Vol. 60 / No. 2 59
TABLE II. (Continued) Provisional cases of selected notifiable diseases, United States, weeks ending January 15, 2011, and January 16, 2010 (2nd week)*
Streptococcus pneumoniae,† invasive disease
Reporting area
All ages Age <5 Syphilis, primary and secondary
Current week
Previous 52 weeks Cum 2011
Cum 2010
Current week
Previous 52 weeks Cum 2011
Cum 2010
Current week
Previous 52 weeks Cum 2011
Cum 2010Med Max Med Max Med Max
United States 245 268 495 580 788 15 40 84 30 105 40 244 318 127 432New England 1 9 99 4 22 — 1 14 — 2 — 9 20 5 8
Connecticut — 0 91 — — — 0 12 — — — 1 8 — —Maine§ — 2 6 3 4 — 0 1 — 1 — 0 3 — —Massachusetts — 1 5 — 2 — 1 4 — — — 5 15 4 7New Hampshire — 0 7 — 10 — 0 1 — 1 — 0 2 — —Rhode Island§ — 0 36 — — — 0 3 — — — 1 4 1 1Vermont§ 1 1 6 1 6 — 0 1 — — — 0 2 — —
Mid. Atlantic 25 28 56 79 58 — 7 19 2 16 10 32 45 18 57New Jersey — 2 8 2 6 — 1 5 2 3 2 4 12 5 9New York (Upstate) — 3 7 1 10 — 2 7 — 5 2 2 9 5 —New York City 10 12 32 40 13 — 2 14 — 2 — 18 31 — 36Pennsylvania 15 10 22 36 29 — 1 5 — 6 6 7 16 8 12
E.N. Central 52 59 98 120 188 3 6 18 4 21 1 27 48 3 62Illinois — 2 7 — 2 — 2 5 — 2 — 8 26 — 33Indiana — 9 24 1 34 — 1 6 — 5 — 3 14 — —Michigan 4 13 27 20 41 — 1 6 — 7 — 4 12 1 11Ohio 42 25 49 86 92 2 2 6 3 4 — 9 19 1 15Wisconsin 6 7 22 13 19 1 0 4 1 3 1 1 3 1 3
W.N. Central 6 10 61 14 21 — 1 12 1 4 2 6 18 3 9Iowa — 0 0 — — — 0 0 — — — 0 3 — —Kansas 1 2 7 4 2 — 0 2 — — — 0 3 — —Minnesota — 0 46 — — — 0 8 — — — 2 9 — 1Missouri 2 2 10 4 10 — 1 4 — 2 2 3 9 3 8Nebraska§ 3 2 9 6 6 — 0 2 1 1 — 0 2 — —North Dakota — 0 11 — — — 0 1 — — — 0 0 — —South Dakota — 0 3 — 3 — 0 2 — 1 — 0 1 — —
S. Atlantic 93 62 144 200 218 10 9 27 17 26 15 56 103 50 72Delaware — 1 3 2 1 — 0 0 — — 1 0 4 1 —District of Columbia — 0 3 — 1 — 0 2 — 1 — 2 20 2 2Florida 54 25 89 118 81 5 3 18 8 5 2 21 44 13 28Georgia 11 10 26 28 44 2 2 9 4 8 — 9 29 — 2Maryland§ 25 9 31 49 39 2 1 6 4 3 5 6 15 11 4North Carolina — 0 0 — — — 0 0 — — 7 6 22 15 16South Carolina§ 2 8 23 2 48 — 1 4 — 7 — 3 7 4 8Virginia§ 1 1 4 1 2 1 1 4 1 2 — 5 22 4 11West Virginia — 2 9 — 2 — 0 4 — — — 0 2 — 1
E.S. Central 5 24 48 37 80 — 2 7 4 9 1 16 39 4 23Alabama§ — 0 0 — — — 0 0 — — 1 5 11 3 11Kentucky — 3 16 14 6 — 0 3 3 2 — 2 12 — 1Mississippi — 1 8 — 5 — 0 2 — 1 — 4 16 — —Tennessee§ 5 20 43 23 69 — 2 6 1 6 — 5 17 1 11
W.S. Central 33 35 160 43 48 1 5 21 1 6 3 37 63 21 80Arkansas§ 8 3 19 8 2 1 0 3 1 — 3 3 12 4 12Louisiana 3 2 8 8 13 — 0 3 — 4 — 7 28 — 23Oklahoma — 1 5 — 2 — 1 5 — 2 — 2 7 — 1Texas§ 22 27 139 27 31 — 3 17 — — — 24 33 17 44
Mountain 28 34 68 74 136 1 4 12 1 16 1 10 25 7 13Arizona 17 13 38 35 81 — 2 7 — 10 1 3 8 2 3Colorado 6 11 22 26 30 1 1 4 1 2 — 2 8 — 5Idaho§ 1 0 2 1 — — 0 2 — — — 0 2 — 1Montana§ — 0 2 — 1 — 0 1 — — — 0 2 — —Nevada§ — 1 4 1 6 — 0 1 — 2 — 2 9 4 2New Mexico§ 3 3 10 9 8 — 0 4 — — — 1 4 1 2Utah — 4 9 — 10 — 0 3 — 2 — 1 4 — —Wyoming§ 1 0 15 2 — — 0 1 — — — 0 0 — —
Pacific 2 5 16 9 17 — 0 7 — 5 7 45 63 16 108Alaska — 2 9 1 11 — 0 5 — 3 — 0 1 — —California 2 3 15 8 6 — 0 5 — 2 3 38 52 11 92Hawaii — 0 2 — — — 0 0 — — — 0 5 — 2Oregon — 0 0 — — — 0 0 — — — 1 7 — 2Washington — 0 0 — — — 0 0 — — 4 4 11 5 12
TerritoriesAmerican Samoa — 0 0 — — — 0 0 — — — 0 0 — —C.N.M.I. — — — — — — — — — — — — — — —Guam — 0 0 — — — 0 0 — — — 0 0 — —Puerto Rico — 0 0 — — — 0 0 — — — 3 15 2 5U.S. Virgin Islands — 0 0 — — — 0 0 — — — 0 0 — —
C.N.M.I.: Commonwealth of Northern Mariana Islands.U: Unavailable. —: No reported cases. N: Not reportable. NN: Not Nationally Notifiable. Cum: Cumulative year-to-date counts. Med: Median. Max: Maximum.* Case counts for reporting year 2010 and 2011 are provisional and subject to change. For further information on interpretation of these data, see http://www.cdc.gov/ncphi/disss/nndss/
phs/files/ProvisionalNationa%20NotifiableDiseasesSurveillanceData20100927.pdf. Data for TB are displayed in Table IV, which appears quarterly.† Includes drug resistant and susceptible cases of invasive Streptococcus pneumoniae disease among children <5 years and among all ages. Case definition: Isolation of S. pneumoniae from
a normally sterile body site (e.g., blood or cerebrospinal fluid).§ Contains data reported through the National Electronic Disease Surveillance System (NEDSS).

Morbidity and Mortality Weekly Report
60 MMWR / January 21, 2011 / Vol. 60 / No. 2
TABLE II. (Continued) Provisional cases of selected notifiable diseases, United States, weeks ending January 15, 2011, and January 16, 2010 (2nd week)*
West Nile virus disease†
Reporting area
Varicella (chickenpox)§ Neuroinvasive Nonneuroinvasive¶
Current week
Previous 52 weeks Cum 2011
Cum 2010
Current week
Previous 52 weeks Cum 2011
Cum 2010
Current week
Previous 52 weeks Cum 2011
Cum 2010Med Max Med Max Med Max
United States 135 287 562 249 531 — 0 1 — 1 — 0 0 — —New England 6 18 41 13 47 — 0 0 — — — 0 0 — —
Connecticut — 6 20 — 6 — 0 0 — — — 0 0 — —Maine§ — 4 15 — 20 — 0 0 — — — 0 0 — —Massachusetts — 5 12 — 9 — 0 0 — — — 0 0 — —New Hampshire — 2 8 — 7 — 0 0 — — — 0 0 — —Rhode Island§ — 0 3 — 1 — 0 0 — — — 0 0 — —Vermont§ 6 1 10 13 4 — 0 0 — — — 0 0 — —
Mid. Atlantic 13 32 62 27 62 — 0 0 — — — 0 0 — —New Jersey — 8 30 — 23 — 0 0 — — — 0 0 — —New York (Upstate) N 0 0 N N — 0 0 — — — 0 0 — —New York City — 0 1 — — — 0 0 — — — 0 0 — —Pennsylvania 13 23 40 27 39 — 0 0 — — — 0 0 — —
E.N. Central 76 97 176 135 201 — 0 0 — — — 0 0 — —Illinois 1 21 45 10 50 — 0 0 — — — 0 0 — —Indiana§ — 5 35 6 8 — 0 0 — — — 0 0 — —Michigan 17 31 62 35 73 — 0 0 — — — 0 0 — —Ohio 58 27 56 84 61 — 0 0 — — — 0 0 — —Wisconsin — 7 22 — 9 — 0 0 — — — 0 0 — —
W.N. Central 1 15 32 11 37 — 0 0 — — — 0 0 — —Iowa N 0 0 N N — 0 0 — — — 0 0 — —Kansas§ — 3 22 — 20 — 0 0 — — — 0 0 — —Minnesota — 0 0 — — — 0 0 — — — 0 0 — —Missouri — 9 23 10 16 — 0 0 — — — 0 0 — —Nebraska§ N 0 0 N N — 0 0 — — — 0 0 — —North Dakota — 0 10 — 1 — 0 0 — — — 0 0 — —South Dakota 1 1 7 1 — — 0 0 — — — 0 0 — —
S. Atlantic 20 35 100 25 52 — 0 0 — — — 0 0 — —Delaware§ — 0 3 — — — 0 0 — — — 0 0 — —District of Columbia 1 0 4 1 — — 0 0 — — — 0 0 — —Florida§ 17 16 57 21 24 — 0 0 — — — 0 0 — —Georgia N 0 0 N N — 0 0 — — — 0 0 — —Maryland§ N 0 0 N N — 0 0 — — — 0 0 — —North Carolina N 0 0 N N — 0 0 — — — 0 0 — —South Carolina§ — 0 35 — 2 — 0 0 — — — 0 0 — —Virginia§ 2 10 29 3 6 — 0 0 — — — 0 0 — —West Virginia — 7 26 — 20 — 0 0 — — — 0 0 — —
E.S. Central — 5 22 8 13 — 0 1 — 1 — 0 0 — —Alabama§ — 5 22 8 13 — 0 0 — — — 0 0 — —Kentucky N 0 0 N N — 0 0 — — — 0 0 — —Mississippi — 0 2 — — — 0 1 — 1 — 0 0 — —Tennessee§ N 0 0 N N — 0 0 — — — 0 0 — —
W.S. Central 19 43 177 26 56 — 0 0 — — — 0 0 — —Arkansas§ — 1 32 — 5 — 0 0 — — — 0 0 — —Louisiana — 2 5 1 5 — 0 0 — — — 0 0 — —Oklahoma N 0 0 N N — 0 0 — — — 0 0 — —Texas§ 19 40 171 25 46 — 0 0 — — — 0 0 — —
Mountain — 20 36 2 63 — 0 0 — — — 0 0 — —Arizona — 0 0 — — — 0 0 — — — 0 0 — —Colorado§ — 8 17 — 25 — 0 0 — — — 0 0 — —Idaho§ N 0 0 N N — 0 0 — — — 0 0 — —Montana§ — 3 17 — 10 — 0 0 — — — 0 0 — —Nevada§ N 0 0 N N — 0 0 — — — 0 0 — —New Mexico§ — 1 8 2 6 — 0 0 — — — 0 0 — —Utah — 4 17 — 22 — 0 0 — — — 0 0 — —Wyoming§ — 0 3 — — — 0 0 — — — 0 0 — —
Pacific — 1 6 2 — — 0 0 — — — 0 0 — —Alaska — 1 5 2 — — 0 0 — — — 0 0 — —California — 0 0 — — — 0 0 — — — 0 0 — —Hawaii — 0 6 — — — 0 0 — — — 0 0 — —Oregon N 0 0 N N — 0 0 — — — 0 0 — —Washington N 0 0 N N — 0 0 — — — 0 0 — —
TerritoriesAmerican Samoa N 0 0 N N — 0 0 — — — 0 0 — —C.N.M.I. — — — — — — — — — — — — — — —Guam — 0 2 — — — 0 0 — — — 0 0 — —Puerto Rico 3 9 30 3 4 — 0 0 — — — 0 0 — —U.S. Virgin Islands — 0 0 — — — 0 0 — — — 0 0 — —
C.N.M.I.: Commonwealth of Northern Mariana Islands.U: Unavailable. —: No reported cases. N: Not reportable. NN: Not Nationally Notifiable. Cum: Cumulative year-to-date counts. Med: Median. Max: Maximum.* Case counts for reporting year 2010 and 2011 are provisional and subject to change. For further information on interpretation of these data, see http://www.cdc.gov/ncphi/disss/nndss/
phs/files/ProvisionalNationa%20NotifiableDiseasesSurveillanceData20100927.pdf. Data for TB are displayed in Table IV, which appears quarterly.† Updated weekly from reports to the Division of Vector-Borne Infectious Diseases, National Center for Zoonotic, Vector-Borne, and Enteric Diseases (ArboNET Surveillance). Data for California
serogroup, eastern equine, Powassan, St. Louis, and western equine diseases are available in Table I.§ Contains data reported through the National Electronic Disease Surveillance System (NEDSS).¶ Not reportable in all states. Data from states where the condition is not reportable are excluded from this table, except starting in 2007 for the domestic arboviral diseases and influenza-
associated pediatric mortality, and in 2003 for SARS-CoV. Reporting exceptions are available at http://www.cdc.gov/ncphi/disss/nndss/phs/infdis.htm.

Morbidity and Mortality Weekly Report
MMWR / January 21, 2011 / Vol. 60 / No. 2 61
TABLE III. Deaths in 122 U.S. cities,* week ending January 15, 2011 (2nd week)
Reporting area
All causes, by age (years)
P&I† Total Reporting area (Continued)
All causes, by age (years)
P&I† Total
All Ages ≥65 45–64 25–44 1–24 <1
All Ages ≥65 45–64 25–44 1–24 <1
New England 587 427 116 23 13 8 57 S. Atlantic 1,398 909 356 66 41 26 99Boston, MA 134 83 37 5 6 3 5 Atlanta, GA 62 30 18 5 4 5 2Bridgeport, CT 48 42 5 1 — — 5 Baltimore, MD 170 90 56 13 7 4 9Cambridge, MA 18 17 1 — — — 4 Charlotte, NC 134 89 35 2 4 4 10Fall River, MA 27 20 6 1 — — 4 Jacksonville, FL 210 148 45 11 4 2 21Hartford, CT 59 45 12 1 1 — 4 Miami, FL 142 102 29 7 2 2 5Lowell, MA 35 34 1 — — — 6 Norfolk, VA 41 29 8 4 — — 4Lynn, MA 7 4 1 1 1 — — Richmond, VA 71 42 24 2 1 2 7New Bedford, MA 32 25 5 1 1 — 3 Savannah, GA 87 57 23 5 1 1 5New Haven, CT 17 13 2 2 — — 2 St. Petersburg, FL 62 31 21 3 5 2 8Providence, RI 67 40 20 4 2 1 4 Tampa, FL 285 202 65 9 8 1 19Somerville, MA U U U U U U U Washington, D.C. 108 68 28 4 5 3 7Springfield, MA 41 28 7 3 2 1 3 Wilmington, DE 26 21 4 1 — — 2Waterbury, CT 37 28 8 1 — — 6 E.S. Central 823 545 206 39 16 17 70Worcester, MA 65 48 11 3 — 3 11 Birmingham, AL 112 75 26 7 4 — 10
Mid. Atlantic 2,601 1,860 550 113 35 43 171 Chattanooga, TN 54 30 16 4 — 4 1Albany, NY 56 42 9 3 — 2 2 Knoxville, TN 120 91 25 3 1 — 7Allentown, PA 31 25 4 2 — — 1 Lexington, KY 62 40 15 5 1 1 2Buffalo, NY 82 54 22 4 2 — 7 Memphis, TN 166 104 43 8 2 9 21Camden, NJ 20 12 6 2 — — 2 Mobile, AL 97 63 29 3 2 — 7Elizabeth, NJ 21 13 8 — — — 4 Montgomery, AL 47 34 7 3 2 1 6Erie, PA 42 35 6 — 1 — 5 Nashville, TN 165 108 45 6 4 2 16Jersey City, NJ U U U U U U U W.S. Central 1,092 709 269 67 28 19 78New York City, NY 1,474 1,080 290 68 14 22 103 Austin, TX 97 58 28 8 3 — 7Newark, NJ 28 22 5 1 — — 1 Baton Rouge, LA U U U U U U UPaterson, NJ 22 15 4 2 — 1 4 Corpus Christi, TX 58 40 13 2 2 1 5Philadelphia, PA 487 299 140 22 14 12 18 Dallas, TX 237 145 61 18 9 4 17Pittsburgh, PA§ 43 38 4 1 — — 1 El Paso, TX 80 63 15 2 — — 4Reading, PA 34 29 4 1 — — 2 Fort Worth, TX U U U U U U URochester, NY 79 60 16 1 1 1 5 Houston, TX 93 52 26 8 2 5 9Schenectady, NY 27 24 2 — — 1 4 Little Rock, AR 57 36 11 8 2 — —Scranton, PA 27 20 4 2 1 — 1 New Orleans, LA U U U U U U USyracuse, NY 61 52 7 — 1 1 9 San Antonio, TX 264 168 70 14 7 5 21Trenton, NJ 38 18 12 4 1 3 — Shreveport, LA 71 46 20 3 — 2 2Utica, NY 11 9 2 — — — — Tulsa, OK 135 101 25 4 3 2 13Yonkers, NY 18 13 5 — — — 2 Mountain 1,152 775 276 66 15 19 69
E.N. Central 1,990 1,373 455 99 40 23 122 Albuquerque, NM 143 106 27 8 1 1 13Akron, OH 59 41 14 2 — 2 6 Boise, ID 66 51 14 — — 1 7Canton, OH 57 39 16 2 — — 5 Colorado Springs, CO 76 61 10 4 1 — 1Chicago, IL 264 164 79 15 6 — 19 Denver, CO 79 52 20 6 — 1 3Cincinnati, OH 92 66 17 1 4 4 6 Las Vegas, NV 263 174 68 17 3 1 16Cleveland, OH 279 183 70 20 4 2 13 Ogden, UT 43 30 8 4 — 1 3Columbus, OH U U U U U U U Phoenix, AZ 193 108 57 14 5 8 9Dayton, OH 143 99 27 7 6 4 17 Pueblo, CO 27 19 4 1 2 1 1Detroit, MI 140 85 35 10 6 4 2 Salt Lake City, UT 139 80 47 5 3 4 8Evansville, IN 31 24 6 1 — — — Tucson, AZ 123 94 21 7 — 1 8Fort Wayne, IN 102 75 23 3 1 — 2 Pacific 1,912 1,302 421 115 33 38 189Gary, IN 20 12 6 — 2 — — Berkeley, CA 16 10 3 1 — 2 1Grand Rapids, MI 56 42 8 3 2 1 8 Fresno, CA 139 97 30 6 1 5 15Indianapolis, IN 224 154 52 12 4 2 7 Glendale, CA 37 29 2 6 — — 6Lansing, MI 61 50 9 1 — 1 6 Honolulu, HI 61 45 10 4 2 — 9Milwaukee, WI 98 60 25 10 1 2 5 Long Beach, CA 65 41 21 3 — — 6Peoria, IL 60 44 14 1 1 — 7 Los Angeles, CA 344 213 84 30 8 9 37Rockford, IL 75 63 9 2 — 1 6 Pasadena, CA 25 18 5 2 — — 2South Bend, IN 49 37 9 3 — — 6 Portland, OR 135 83 39 7 2 4 8Toledo, OH 114 83 24 4 3 — 6 Sacramento, CA 173 122 38 8 4 1 30Youngstown, OH 66 52 12 2 — — 1 San Diego, CA 194 142 35 9 5 3 16
W.N. Central 708 457 193 30 12 15 60 San Francisco, CA 157 99 42 9 2 3 13Des Moines, IA 71 55 15 1 — — 7 San Jose, CA 207 155 34 6 6 6 18Duluth, MN 40 29 11 — — — 4 Santa Cruz, CA 33 28 5 — — — 2Kansas City, KS 22 12 9 1 — — 1 Seattle, WA 126 80 33 10 — 2 7Kansas City, MO 99 65 23 6 2 3 10 Spokane, WA 62 43 14 3 1 1 6Lincoln, NE 47 34 11 1 — 1 2 Tacoma, WA 138 97 26 11 2 2 13Minneapolis, MN 66 34 24 3 2 3 5 Total¶ 12,263 8,357 2,842 618 233 208 915Omaha, NE 88 59 21 4 2 2 11St. Louis, MO 116 61 38 9 3 4 7St. Paul, MN 57 38 15 3 — 1 6Wichita, KS 102 70 26 2 3 1 7
U: Unavailable. —: No reported cases. * Mortality data in this table are voluntarily reported from 122 cities in the United States, most of which have populations of >100,000. A death is reported by the place of its occurrence and
by the week that the death certificate was filed. Fetal deaths are not included.† Pneumonia and influenza.§ Because of changes in reporting methods in this Pennsylvania city, these numbers are partial counts for the current week. Complete counts will be available in 4 to 6 weeks.¶ Total includes unknown ages.


U.S. Government Printing Office: 2011-723-011/21023 Region IV ISSN: 0149-2195
The Morbidity and Mortality Weekly Report (MMWR) Series is prepared by the Centers for Disease Control and Prevention (CDC) and is available free of charge in electronic format. To receive an electronic copy each week, visit MMWR’s free subscription page at http://www.cdc.gov/mmwr/mmwrsubscribe.html. Paper copy subscriptions are available through the Superintendent of Documents, U.S. Government Printing Office, Washington, DC 20402; telephone 202-512-1800.
Data presented by the Notifiable Disease Data Team and 122 Cities Mortality Data Team in the weekly MMWR are provisional, based on weekly reports to CDC by state health departments. Address all inquiries about the MMWR Series, including material to be considered for publication, to Editor, MMWR Series, Mailstop E-90, CDC, 1600 Clifton Rd., N.E., Atlanta, GA 30333 or to [email protected].
All material in the MMWR Series is in the public domain and may be used and reprinted without permission; citation as to source, however, is appreciated.
Use of trade names and commercial sources is for identification only and does not imply endorsement by the U.S. Department of Health and Human Services.
References to non-CDC sites on the Internet are provided as a service to MMWR readers and do not constitute or imply endorsement of these organiza-tions or their programs by CDC or the U.S. Department of Health and Human Services. CDC is not responsible for the content of these sites. URL addresses listed in MMWR were current as of the date of publication.