self-reported population health: an international perspective … · population health: an...
TRANSCRIPT

Agota SzendeBas JanssenJuan Cabases Editors
Self-Reported Population Health: An International Perspective based on EQ-5D

Self-Reported Population Health: An InternationalPerspective based on EQ-5D

Agota Szende • Bas JanssenJuan Cabases
Editors
Self-Reported PopulationHealth: An InternationalPerspective based on EQ-5D

EditorsAgota SzendeGlobal Health Economics
and Outcomes ResearchCovance, Leeds, United Kingdom
Bas JanssenEuroQol GroupRotterdam, The Netherlands
Juan CabasesPublic University of NavarraPamplona, Spain
ISBN 978-94-007-7595-4 ISBN 978-94-007-7596-1 (eBook)DOI 10.1007/978-94-007-7596-1Springer Dordrecht Heidelberg New York London
© The Editor(s) (if applicable) and the Author(s) 2014. The book is published with open accessat SpringerLink.comOpen Access. This book is distributed under the terms of the Creative Commons Attribution Non-commercial License which permits any noncommercial use, distribution, and reproduction in anymedium, provided the original author(s) and source are credited.All commercial rights are reserved by the Publisher, whether the whole or part of the material isconcerned, specifically the rights of translation, reprinting, re-use of illustrations, recitation,broadcasting, reproduction on microfilms or in any other way, and storage in data banks. Duplicationof this publication or parts thereof is permitted only under the provisions of the Copyright Law of thePublisher’s location, in its current version, and permission for commercial use must always be obtainedfrom Springer. Permissions for commercial use may be obtained through RightsLink at the CopyrightClearance Center. Violations are liable to prosecution under the respective Copyright Law.The use of general descriptive names, registered names, trademarks, service marks, etc. in thispublication does not imply, even in the absence of a specific statement, that such names are exemptfrom the relevant protective laws and regulations and therefore free for general use.While the advice and information in this book are believed to be true and accurate at the date ofpublication, neither the authors nor the editors nor the publisher can accept any legal responsibility forany errors or omissions that may be made. The publisher makes no warranty, express or implied, withrespect to the material contained herein.
Printed on acid-free paper
Springer is part of Springer Science+Business Media (www.springer.com)

The EuroQol Group
• The EuroQol Group is a network of international multidisciplinary researchers
devoted to the measurement of health status. Established in 1987, the EuroQol
Group originally consisted of researchers from Europe, but nowadays includes
members from North and South America, Asia, Africa, Australia, and New
Zealand. The Group is responsible for the development of EQ-5D, a preference-
based measure of health status that is now widely used in clinical trials, observa-
tional studies, and other health surveys. The EuroQol Group has been holding
annual scientific meetings since its inception in 1987.
• The EuroQol Group can be justifiably proud of its collective scientific achieve-
ments over the last 20 years. Research areas include valuation, EQ-5D use in
clinical studies and in population surveys, experimentation with the EQ-5D
descriptive system, computerized applications, interpretation of EQ-5D ratings,
and the role of EQ-5D in measuring social inequalities in self-reported health.
• The EuroQol Group’s website (www.euroqol.org) contains detailed information
about EQ-5D, guidance for users, a list of available language versions, EQ-5D
references, and contact details.
• EQ-5D is a standardized measure of health status developed by the EuroQol
Group in order to provide a simple, generic measure of health for clinical and
economic appraisal. Applicable to a wide range of health conditions and
treatments, it provides a simple descriptive profile and a single index value for
health status that can be used in the clinical and economic evaluation of health
care as well as in population health surveys.
v

Acknowledgements
The editors wish to acknowledge the following researchers and organizations who
contributed EQ-5D country data described in this book.
Argentina Ministerio de Salud de Argentina, Buenos Aires, Argentina
Armenia Gayane Gharagebakyan, Armenia Transition Programme, Yerevan, Armenia
Belgiuma ESEMeD/MHEDEA 2000 Investigators
Canada Tim Cooke, Health Quality Council of Alberta, Calgary, Alberta, Canada
China Sun Sun and Kristina Burstrom, Department of Learning, Informatics,
Management and Ethics, Medical Management Centre, Karolinska
Institutet, Stockholm, Sweden
J. Chen, School of Health Policy and Management, Nanjing Medical
University, Nanjing, P. R. China
Denmark Jan Sorensen, Centre for Applied Health Services Research and Technology
Assessment, University of Southern Denmark, Odense C, Denmark
England National Centre for Social Research and University College London.
Department of Epidemiology and Public Health
Finland Seppo Koskinen, Division of Welfare and Health Policies, National Institute
for Health and Welfare, Helsinki, Finland
Francea ESEMeD/MHEDEA 2000 Investigators
Germanya ESEMeD/MHEDEA 2000 Investigators
Greece Yannis Yfantopoulos, University of Athens, Athens, Greece
Hungary Agota Szende, Global Health Economics and Outcomes Research, Covance,
Leeds, United Kingdom
Renata Nemeth, Hungarian National Center for Epidemiology, Budapest,
Hungary
Italya ESEMeD/MHEDEA 2000 Investigators
Japan Naoki Ikegami, Keio University School of Medicine, Tokyo, Japan
Aki Tsuchiya, University of Sheffield, Sheffield, United Kingdom
Korea Yeon-Kyeng Lee, Division of Chronic Disease Surveillance, Korea Centers for
Disease Control and Prevention, Seoul, Korea
The Netherlandsa ESEMeD/MHEDEA 2000 Investigators
(continued)
vii

(continued)
New Zealand Nancy Devlin, City University, London, United Kingdom
Paul Hansen, Otago University, Dunedin, New Zealand
Slovenia Valentina Prevolnik-Rupel, Ministry of Health, Ljubljana, Slovenia
Matejka Rebolj, Department of Public Health, Erasmus Medical Center,
Rotterdam, The Netherlands
Spaina ESEMeD/MHEDEA 2000 Investigators
Anna Mompart, Health Plan Service, Department of Health, Government
of Catalonia
Yolanda Ramallo Farina, Encuesta de Salud de Canarias 2009, Servicio
Canario de la Salud, Government of Canarias
Sweden Stefan Bjork, Novo Nordisk, Bagsvaerd, Denmark
Kristina Burstrom, Karolinska Institute, Stockholm, Sweden
Thailand Sirinart Tongsiri, Mahasarakham University, Mahasarakham, Thailand,
John Cairns, London School of Hygiene and Tropical Medicine, London,
United Kingdom
The United
Kingdom
Paul Kind, University of York, York, United Kingdom
The United
States
Patrick W. Sullivan, University of Colorado School of Pharmacy,
Pharmaceutical Outcomes Research Program, Denver, Colorado; and the
Center for Outcomes and Evidence, Agency for Healthcare Research and
Quality, Rockville, Maryland
Zimbabwe Jennifer Jelsma, University of Cape Town, Cape Town, South AfricaaThe editors especially acknowledge the contribution of the ESEMeD/MHEDEA 2000
Investigators who provided representative population surveys with EQ-5D-3L data for 6 European
countries from the European Study of the Epidemiology of Mental Disorders.
The ESEMeD Investigators are as follows:
Jordi Alonso M.D., Ph.D.1, Matthias Angermeyer M.D.2, Sebastian Bernert
M.Sc.2, Ronny Bruffaerts Ph.D.3, Traolach S. Brugha M.D.4, Giovanni de Girolamo
M.D.5, Ron de Graaf M.D., Ph.D.6, Koen Demyttenaere M.D., Ph.D.3, Isabelle
Gasquet M.D.7; Josep Maria Haro M.D., M.P.H., Ph.D.8, Steven J. Katz M.D.,
Ph.D.9; Ronald C. Kessler Ph.D.10, Hans-Helmut Konig M.D., M.P.H.11, Viviane
Kovess M.D., Ph.D.12, Jean Pierre Lepine M.D., HDR13, Herbert Matschinger
Ph.D.2, Johan Ormel M.A., Ph.D.14, Gabriella Polidori M.D.15, and Gemma
Vilagut Stat1.
From the 1Health Services Research Unit, IMIM – Institut Hospital del Mar
d’Investigacions Mediques, Barcelona, Spain, and CIBER en Epidemiologıa y
Salud Publica (CIBERESP), Spain; 2Department of Psychiatry, University of
Leipzig, Leipzig, Germany; 3Department of Psychiatry, University Hospital
Gasthuisberg; Leuven, Belgium; 4Department of Health Sciences, University of
Leicester, Leicester General Hospital, Leicester, UK; 5IRCCS Fatebenefratelli,
Brescia, Italy; 6Netherlands Institute of Mental Health and Addiction (Trimbos-
Instituut), Utrecht, The Netherlands; 7Public Health Department-Paul Brousse
Hospital (AP-HP),Villejuif, France; 8Parc Sanitari Sant Joan de Deu, Sant
Boi de Llobregat, Barcelona, Spain, CIBER en Salud Mental (CIBERSAM), Spain;9Medical Center of University of Michigan, AnnArbor, USA; 10Department of Health
Care Policy, Harvard Medical School, Boston, USA; 11Department of Medical
viii Acknowledgements
Sociology and Health Economics, University Medical Center Hamburg-Eppendorf,
Hamburg, Germany; 12EA4069, Paris Descartes University, Ecole des Hautes Etudes
en Sante Publique (EHESP), Paris, France; 13Psychiatre des Hopitaux, Hopital
Fernand Widal, INSERM U705, University Paris Diderot and Paris Descartes, Paris,
France; 14Center for Psychiatric Epidemiology, Department of Psychiatry, University
Medical Center Groningen, Groningen, The Netherlands; and 15Istituto Superiore di
Sanita, Rome, Italy.
The ESEMeD project was funded by the European Commission (Contracts
QLG5-1999-01042; SANCO 2004123, EAHC 20081308); the Piedmont Region
(Italy); Fondo de InvestigacionSanitaria, Instituto de Salud Carlos III, Spain (FIS
00/0028); Ministerio de Ciencia y Tecnolog{´a, Spain (SAF 2000-158-CE);
Departament de Salut, Generalitat de Catalunya, Spain; Instituto de Salud Carlos
III (CIBER CB06/02/0046, RETICS RD06/0011 REM-TAP); and other local
agencies and by an unrestricted educational grant from GlaxoSmithKline. The
ESEMeD project is part of the World Mental Health (WMH) Surveys initiative;
we are indebted to the support received by the WMH Consortium.
Finally, the editors acknowledge the importance of authors of the EuroQol Group
booklet ‘Measuring Self-Reported Population Health: An International Perspective
based on EQ-5D’ (Szende and Williams ed. 2004). The authors of this booklet
and their organizations at the time of publication included the following:
Irina Cleemput, Belgian Health Care Knowledge Centre, Brussels, Belgium
Frank de Charro, Erasmus University Rotterdam, The Netherlands
Mark Oppe, Erasmus University Rotterdam, The Netherlands
Rosalind Rabin, EuroQol Group Executive Office, Rotterdam, The Netherlands
Matejka Rebolj, Department of Public Health, Erasmus Medical Center,
Rotterdam, The Netherlands
Agota Szende, Covance, Leeds, United Kingdom
Alan Williams+, Centre for Health Economics, University of York, York, United
Kingdom+Alan Williams has deceased.
Acknowledgements ix


Contents
1 Introduction . . . . . . . . . . . . . . . . . . . . . . . . . . . . . . . . . . . . . . . . . . . 1
Juan Cabases and Rosalind Rabin
2 Data and Methods . . . . . . . . . . . . . . . . . . . . . . . . . . . . . . . . . . . . . . . 7
Bas Janssen, Agota Szende, and Juan Manuel Ramos-Goni
3 Population Norms for the EQ-5D . . . . . . . . . . . . . . . . . . . . . . . . . . . 19
Bas Janssen and Agota Szende
4 Cross-Country Analysis of EQ-5D Data . . . . . . . . . . . . . . . . . . . . . . 31
Agota Szende and Bas Janssen
5 Socio-demographic Indicators Based on EQ-5D . . . . . . . . . . . . . . . . 37
Agota Szende and Bas Janssen
Annex 1: EQ-5D Population Norms – National Surveys . . . . . . . . . . . . . 47
Annex 2: EQ-5D Population Norms – Regional Surveys . . . . . . . . . . . . 153
References . . . . . . . . . . . . . . . . . . . . . . . . . . . . . . . . . . . . . . . . . . . . . . . 189
Index . . . . . . . . . . . . . . . . . . . . . . . . . . . . . . . . . . . . . . . . . . . . . . . . . . . 193
xi


Glossary of EQ-5D Terms
EQ-5D-3L Descriptive system of health-related quality of life states
consisting of five dimensions (mobility, self-care, usual
activities, pain/discomfort, anxiety/depression). Each
dimension has three responses recording three levels of
severity (no problems/some or moderate problems/extreme
problems) within a particular EQ-5D dimension.
EQ-5D-5L Descriptive system of health-related quality of life states
consisting of five dimensions (mobility, self-care, usual
activities, pain/discomfort, anxiety/depression). Each
dimension has five responses recording five levels of
severity (no problems/slight problems/moderate problems/
severe problems/extreme problems) within a particular
EQ-5D dimension.
EQ-5D-Y EQ-5D-Y Youth version. Descriptive system of youth
health-related quality of life states consisting of five
dimensions (mobility, looking after myself, doing usual
activities, having pain or discomfort, feeling worried, sad,
or unhappy). Each dimension has three responses
recording three levels of severity (no problems/some
problems or a bit/a lot (of) problems or very) within a
particular EQ-5D dimension.
EQ-5D descriptive
system
Standard layout for the above five-dimensional descriptive
system for recording an individual’s current EQ-5D
self-reported health state (often referred to as page 2 of the
EQ-5D questionnaire).
EQ-5D Self-reported
health state
An EQ-5D health state recorded by an individual on the
EQ-5D descriptive system.
xiii

EQ VAS Standard vertical 20-cm visual analogue scale (similar to a
thermometer) for recording an individual’s rating for their
current health-related quality of life state (often referred to
as page 3 of the EQ-5D questionnaire).
EQ VAS score Score recorded by an individual for their current
health-related quality of life state on the EQ VAS.
EQ SDQ Standard set of questions concerning socio-demographic
variables for use with the EQ-5D valuation questionnaire
and a modified version for use with the EQ-5D
questionnaire. These questions are optional for users.
EQ-5D self-report
questionnaire
Questionnaire, of standard layout, consisting of the EQ-5D
descriptive system, the EQ VAS, and (if required) the
modified version of the EQ SDQ.
EQ-5D valuation
questionnaire
Questionnaire, of standard layout, consisting of the EQ-5D
questionnaire (including full EQ SDQ) in addition to the
EQ-5D VAS, and a standard set of instructions.
EQ-5D index value Index value attached to an EQ-5D state according to a
particular set of weights or value set.
EQ-5D value set A scoring algorithm that can be used to attach a single
index value to each EQ-5D state using a scale anchored at
1 ¼ full health and 0 ¼ dead. Value sets are derived from
EQ-5D valuation surveys normally conducted on a
representative sample of the general population of specific
countries or regions, typically using the EQ-5D VAS rating
scale or the time trade-off techniques.
xiv Glossary of EQ-5D Terms

Contributors
Juan Cabases Department of Economics, Public University of Navarra,
Pamplona, Spain
Bas Janssen Medical Psychology and Psychotherapy, Erasmus MC, Rotterdam,
The Netherlands
EuroQol Group, Rotterdam, The Netherlands
Rosalind Rabin EuroQol Group, London, United Kingdom
Juan Manuel Ramos-Goni EuroQol Group, Rotterdam, The Netherlands
Agota Szende Global Health Economics and Outcomes Research Covance, Leeds,
United Kingdom
xv
Chapter 1
Introduction
Juan Cabases and Rosalind Rabin
1.1 Purpose of This Book
During the 26 years since EQ-5D was first developed, a substantial amount of
research has been carried out worldwide using the instrument. Among these studies
were surveys conducted in various countries that measured the health-related
quality of life of the general population. These studies have been informative in
providing new data on population health characteristics, complementing the tradi-
tionally collected morbidity and mortality data.
The EuroQol Group is frequently asked to provide EQ-5D population reference
data (sometimes called population norm data or simply population norms) for a
specific country or international region. Such data can be used to compare profiles
for patients with specific conditions with data for the average person in the general
population in a similar age and/or gender group. Also the burden of disease in
question can be compared to the general population’s health.
In response to the increasing need for EQ-5D population reference data, the
EuroQol Group established the Self-Reported Health Task Force whose objectives
were as follows:
• Updating the international EQ-5D general population database archive.
• Providing easy-to-use tables with population norm data for individual countries.
• Illustrating the potential use of EQ-5D data in population health studies.
• Providing a recommended format to present and analyse EQ-5D data collected
from future surveys.
J. Cabases, Ph.D. (*)
Department of Economics, Public University of Navarra, Pamplona, Spain
e-mail: [email protected]
R. Rabin
EuroQol Group, London, UK
A. Szende et al. (eds.), Self-Reported Population Health: An International Perspectivebased on EQ-5D, DOI 10.1007/978-94-007-7596-1_1, © The Author(s) 2014
1

A first booklet summarised this work and presented population norms from
population surveys conducted in 15 countries (Szende and Willimas 2004). The
current book presents the population norms for 24 countries and some of their
regions as well as results of some additional analyses of population health based on
EQ-5D, including EQ-5D index norms.
The target audiences for this book are researchers using EQ-5D to collect
data from patients or members of the general population and policy-makers using
the collected information in health care decision-making. Readers wishing to
learn more are encouraged to contact the EuroQol Group Executive Office
1.2 EQ-5D
EQ-5D is a standardized health-related quality of life questionnaire developed by
the EuroQol Group in order to provide a simple, generic measure of health for
clinical and economic appraisal (EuroQol Group 1990). Applicable to a wide range
of health conditions and treatments, it provides a simple descriptive profile, a self-
report visual analogue scale and a single index value for health status that can be
used in the clinical and economic evaluation of health care as well as in population
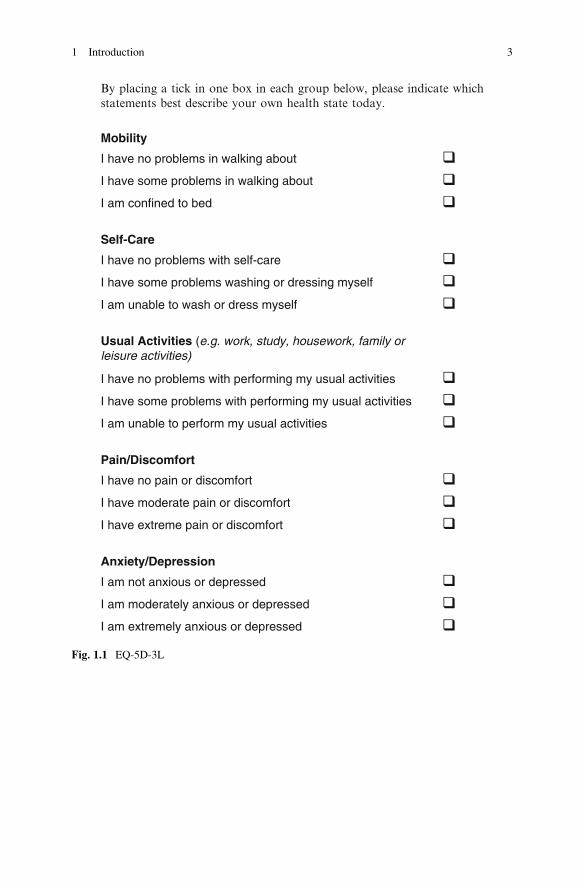
health surveys (Fig. 1.1).
EQ-5D is designed for self-completion by respondents and is suited for use in
postal surveys, web-based applications, and in face-to-face interviews. It is cogni-
tively undemanding, taking only a few minutes to complete. The instructions to
respondents are included in the questionnaire.
The EQ-5D consists of 2 pages – the EQ-5D descriptive system (page 2) and the
EQ VAS (page 3). The EQ-5D descriptive system comprises five dimensions:
mobility, self-care, usual activities, pain/discomfort and anxiety/depression. The
EQ-5D is available in three level and five level response options, EQ-5D-3L and
EQ-5D-5L, respectively, and a youth version, EQ-5D-Y.
The EQ-5D-3L (EQ-5D 3 level) was introduced in 1990 and is available in more
than 160 translated versions. Although the EQ-5D-3L was initially designed for
self-completion in paper-and-pencil format, EQ-5D-3L data are currently also
collected electronically by web or tablet versions, or by following a telephone
interviewer script. Each dimension has three levels: no problems, some problems,
severe problems/unable to. The respondent is asked to indicate his/her health state
by ticking (or placing a cross) in the box against the most appropriate statement in
each of the five dimensions. This decision results in a 1-digit number expressing the
level selected for that dimension. The digits for the five dimensions can be com-
bined in a 5-digit number (‘profile’) describing the respondent’s health state. It
should be noted that the numerals 1–3 have no arithmetic properties and should not
be used as a cardinal score.
The EQ VAS records the respondent’s self-rated health on a vertical, visual
analogue scale where the endpoints are labelled ‘Best imaginable health state’ and
2 J. Cabases and R. Rabin
By placing a tick in one box in each group below, please indicate whichstatements best describe your own health state today.
Mobility
I have no problems in walking about
I have some problems in walking about
I am confined to bed
Self-Care
I have no problems with self-care
I have some problems washing or dressing myself
I am unable to wash or dress myself
Usual Activities (e.g. work, study, housework, family orleisure activities)
I have no problems with performing my usual activities
I have some problems with performing my usual activities
I am unable to perform my usual activities
Pain/Discomfort
I have no pain or discomfort
I have moderate pain or discomfort
I have extreme pain or discomfort
Anxiety/Depression
I am not anxious or depressed
I am moderately anxious or depressed
I am extremely anxious or depressed
Fig. 1.1 EQ-5D-3L
1 Introduction 3

To help people say how good or bad a health state is, we havedrawn a scale (rather like a thermometer) on which the beststate you can imagine is marked 100 and the worst state youcan imagine is marked 0.
We would like you to indicate on this scale how good or badyour own health is today, in your opinion. Please do this bydrawing a line from the box below to whichever point on thescale indicates how good or bad your health state is today.
Your own
health state
9 0
8 0
7 0
6 0
5 0
4 0
3 0
2 0
1 0
100
Worstimaginablehealth state
0
Bestimaginablehealth state
Fig. 1.1 (continued)
4 J. Cabases and R. Rabin

‘Worst imaginable health state’. This information can be used as a quantitative
measure of health outcome as judged by the individual respondents.
The responses to the EQ-5D dimensions can be used to obtain a single
index value (EQ-5D index) for all health states described by the 5-digit number.
Given the five dimension and three-level response option format of the EQ-5D-3L
questionnaire, there are 243 possible health states plus dead and unconscious. An
index value is attached to each EQ-5D state according to a particular set of weights
or value sets that measure health states on a scale anchored at 1 ¼ full health
and 0 ¼ dead. Value sets (previously also referred to as “tariffs”) were based on
representative samples of the general population (as opposed to patients) of a
particular country or regions, and used a technique for valuing health states with
the EQ-5D VAS rating scale or the Time Trade-Off technique. A distinction should
be made between the EQ-VAS self-report question for measuring health outcome
and the EQ-5D valuation questionnaire that is designed to collect valuations for
health states defined by the EQ-5D descriptive system using the EQ-5D VAS rating
scale.
The EQ-5D index values can be used in the estimations of Quality Adjusted Life
Years (QALYs) as standard QALY calculations require valuations for all relevant
health states on a scale anchored at 1 ¼ full health and 0 ¼ dead. While the EQ-5D
index values (and QALYs based on it) are often used in economic evaluation to
inform priority setting in health care, the EQ-5D index values are also useful as
single index measures in clinical studies as well as in population health surveys.
After extensive research and preparation, the EuroQol Group launched the
EQ-5D-5L self-complete version in 2009, with the aim of further improving the
sensitivity and discriminatory power of the existing EQ-5D-3L version.
The EQ-5D-5L (EQ-5D 5 level) is available in more than 100 translated versions.
The EQ-5D-5L still consists of two pages – the EQ-5D-5L descriptive system
(page 2) and the EQ visual Analogue scale (EQ VAS) (page 3). The descriptive
system comprises the same five dimensions as the EQ-5D-3L. However, each
dimension now has five levels: no problems, slight problems, moderate problems,
severe problems, and extreme problems/unable.
The EQ-5D-Y (EQ-5D Youth version) is an EQ-5D-3L self complete version for
children and adolescents aged 7–12. It is available in more than 25 languages.
All analyses and results in this book, however, are based on adult EQ-5D-3L and
EQ VAS data.
1.3 The Structure of the Book
This book presents results from four main analyses of the international EQ-5D
database.
Chapter 2 presents the data sources and methods of the book. General population
surveys are accumulated from 24 countries (Table 2.1). Descriptive statistics are
used to provide EQ-5D population norms by age and gender categories for EQ
1 Introduction 5

VAS, EQ-5D index values, and for the five dimensions. Correlations between
country-specific EQ-5D data (EQ VAS and 5 dimensions) and country-specific
economic and health system macro indicators are calculated in the cross-country
analysis. Odds ratios and the health concentration index methodology are used in
the socio-demographic analysis of EQ-5D data.
Chapter 3 presents the population norm data using EQ-5D for each country.
EQ-5D norms are reported for EQ VAS and EQ-5D index values, and for self-
reported problems on each of the five dimensions of the EQ-5D descriptive system,
all classified by age and gender. These EQ-5D norms can be used as reference data
to compare patients with specific conditions and to assess the burden of the disease
in question.
Chapter 4 demonstrates that cross-country differences exist in EQ-5D outcomes
after the population data is standardized for demographic differences. These cross-
country differences in the general level of health are explained by looking at macro
data on the economic and health system characteristics of each country. Results
show that it is the prior living standards of a country that mostly explain cross-
country differences in self-reported health.
Chapter 5 specifically addresses the distribution of health within the population
and the degree to which age, gender, education level and country are responsible for
inequalities in self-reported health. Usual activities and pain/discomfort were the
highest contributors to overall inequalities in self-assessed health in most countries.
Education had a consistent role in explaining a lower level of self-reported health.
The level of inequalities in self-assessed health and the health inequality profile by
EQ-5D dimension differed substantially across countries, deserving the attention of
policy makers within each country.
Future population surveys using EQ-5D-3L or EQ-5D-5L may be integrated into
the EuroQol archive of population survey datasets as they become available.
Researchers planning to conduct new population surveys using EQ-5D should contact
the EuroQol Group Executive Office ([email protected]).
Open Access This chapter is distributed under the terms of the Creative Commons Attribution
Noncommercial License, which permits any noncommercial use, distribution, and reproduction in
any medium, provided the original author(s) and source are credited.
6 J. Cabases and R. Rabin

Chapter 2
Data and Methods
Bas Janssen, Agota Szende, and Juan Manuel Ramos-Goni
2.1 International EQ-5D Archive of Population Surveys
The international EQ-5D database archive consists of 27 EQ-5D population surveys
collected in 24 countries. Countries with 1 or more population surveys include:
Argentina, Armenia, Belgium, Canada, China, Denmark, England, Finland, France,
Germany, Greece, Hungary, Italy, Japan, Korea, the Netherlands, New Zealand,
Slovenia, Spain, Sweden, Thailand, United Kingdom, United States, and
Zimbabwe. The datasets are structured in a standardized format to facilitate com-
parative research, although each survey also has its own characteristics and
variables specific to the individual research context in which they were conducted.
In addition, three datasets from Argentina, China, and Sweden (Stockholm area)
were analyzed locally and results were added to the book, as the dataset transfer to
the central archive was not possible from these countries. The datasets captured by
this book currently include observations on 216,703 individuals. For a more
detailed account of the data, see Table 2.1.
All of the surveys used a standardized version of EQ-5D-3L. The Dutch,
Swedish and Finnish versions were translated in 1987 according to a ‘simultaneous’
process while the remaining versions were translated according to the EuroQol
Group’s translation protocol – based on international guidelines. However, some
differences between sampling and data collection methods should be noted.
B. Janssen, M.Sc., Ph.D. (*)
Medical Psychology and Psychotherapy, Erasmus MC, Rotterdam, The Netherlands
EuroQol Group, Rotterdam, The Netherlands
e-mail: [email protected]
A. Szende, M.Sc., Ph.D.
Global Health Economics and Outcomes Research, Covance, Leeds, United Kingdom
e-mail: [email protected]
J.M. Ramos-Goni
EuroQol Group, Rotterdam, The Netherlands
A. Szende et al. (eds.), Self-Reported Population Health: An International Perspectivebased on EQ-5D, DOI 10.1007/978-94-007-7596-1_2, © The Author(s) 2014
7

Table
2.1
National
andRegional
EQ-5D
PopulationSurveys
Source
Sam
ple
size
Data
collection
Survey
method
National
Argentina
MinistryofHealthofArgentina
2005
41,392
2005
Face-to-face
interviewsonthe2005RiskFactors
Survey
onarandom
selectionofhouseholdsrepresentativealso
atregional
level
Belgium
ESEMED,Konig
etal.2009
2,411
2001–2003
Personalcomputer-basedhomeinterviewsonanationalrepresentative
sampleofthenoninstitutionalized
generaladultpopulationas
partof
theEuropeanStudyoftheEpidem
iologyofMentalDisorders
(ESEMeD
)
China
Household
HealthSurvey
2010;
Sunet
al.2011
8,031
2010
Face-to-face
interviewsontherepresentative2010Household
Health
Survey
(HHS)
Denmark
Sorensenet
al.2009
16,861
2000–2001
Face-to-face
interviewsonthreerepresentativenational
surveys,
includinganational
healthinterview
survey
undertaken
bythe
National
Institute
ofPublicHealth(SUSY-2000),ahealthsurvey
undertaken
inFunen
County
(Funen
dataset)andanational
health
survey
undertaken
bytheUniversity
ofSouthernDenmark(SDUdata
set)withatotalof22,486individuals
England
HealthSurvey
forEngland2010
14,763
2008
Computerassistedinterviewsonarandomly
selected
sample
of
householdsin
England
Finland
Saarniet
al.2006
8,028
2000
Face-to-face
interviewsontheHealth2000survey
sample,whichisa
representativesurvey
oftheFinnishpopulationaged
30andover
France
ESEMED,Konig
etal.2009
2,892
2001–2003
Personalcomputer-basedhomeinterviewsonanationalrepresentative
sampleofthenoninstitutionalized
generaladultpopulationas
partof
theEuropeanStudyoftheEpidem
iologyofMentalDisorders
(ESEMeD
)
Germany
ESEMED,Konig
etal.2009
3,552
2001–2003
Personalcomputer-basedhomeinterviewsonanationalrepresentative
sampleofthenoninstitutionalized
generaladultpopulationas
partof
theEuropeanStudyoftheEpidem
iologyofMentalDisorders
(ESEMeD
)
Greece
Yfantopoulous1999
464
1998
Face-to-face
interviewsonasampleof500individualsselected
fromthe
general
population
8 B. Janssen et al.

Hungary
SzendeandNem
eth2003
5,503
2000
Self-administeredquestionnaireduringapersonalinterview
ona
random
sample
of7000people
from
theelectoralregistry
Italy
ESEMED,Konig
etal.2009
4,709
2001–2003
Personalcomputer-basedhomeinterviewsonanationalrepresentative
sample
ofthenoninstitutionalized
general
adultpopulationas
partof
theEuropeanStudyoftheEpidem
iologyofMentalDisorders
(ESEMeD
)
Korea
Lee
etal.2009
1,307
2007
Face-to-face
interviewsonarandom
sample
oftheSouth
Korean
resi-
dential
registry
Netherlands
ESEMED,Konig
etal.2009
2,367
2001–2003
Personalcomputer-basedhomeinterviewsonanationalrepresentative
sample
ofthenoninstitutionalized
general
adultpopulationas
partof
theEuropeanStudyoftheEpidem
iologyofMentalDisorders
(ESEMeD
)
New
Zealand
Devlinet
al.2000
1,327
1999
Postalsurvey
onarandom
sample
of3000New
Zealandersselected
from
theelectoralroll
Slovenia
Prevolnik
Rupel
andRebolj2001
742
2000
Postalsurvey
onarandomized
sampleof3000peopleselected
from
the
general
population
Spain
ESEMED,Konig
etal.2009
5,473
2001–2003
Personalcomputer-basedhomeinterviewsonanationalrepresentative
sample
ofthenoninstitutionalized
general
adultpopulationas
partof
theEuropeanStudyoftheEpidem
iologyofMentalDisorders
(ESEMeD
)
Sweden
Bjork
etal.1999
534
1994
Postalsurvey
onarandomized
sampleof1000Swedishcitizensselected
from
thegeneral
populationfrom
anaddress
register
Thailand
Tongsiriet
al.2011
1,409
2007
Face-to-face
interviewsonarandom
national
sample
provided
bythe
national
statisticaloffice
United
Kingdom
Kindet
al.1998
3,395
1993
Face-to-face
interviewsonarandom
sample
of5324individuals
selected
from
thegeneralpopulation(based
onthePostcodeAddress
file)from
England,ScotlandandWales
United
States
MEPS,Sullivan
etal.2005
38,678
2000–2002
Paper-and-pencilquestionnaireamongtheMedicalExpenditure
Panel
Survey
participants,anationally
representativesurvey
ofthe
USciviliannoninstitutionalized
population.Theresearch
pooled
2000,2001,and2002MEPSdataon23,839,32,122,and37,418
individuals
(continued)
2 Data and Methods 9

Table
2.1
(continued) Source
Sam
ple
size
Data
collection
Survey
method
Regional
Arm
enia
(5regions)
Gharagebakyan
2003
2,217
2002
Face-to-face
interviewsonarandom
sample
of1300households
(2337individuals)selected
from
thegeneral
populationof5regions
ofArm
enia
(Yerevan
city,Gegharkounik,Shirak,Lori,andSuinik)
Canada(A
lberta)
HQCA
2010
5,010
2010
ComputerAssistedTelephoneInterviewingwithasample
of5010
adultAlbertans
Japan
(3prefectures)
Tsuchiyaet
al.2002
620
1998
Face-to-face
interviewsonarandom
sampleof972individualsselected
from
thegeneralpopulation(over
age20)of3Prefecturesin
Japan
–
Saitama,Hiroshim
aandHokkaido
Spain(Canary
Islands)
CanaryHealthSurvey
2009
4,468
2009
Personalcomputer-basedhomeinterviewsonadistrictrepresentative
regional
CanariesHealthSurvey
to4600individuals
Spain(Catalonia)
CatalunyaHealthSurvey
2011
5,603
2011
Personalcomputer-basedhomeinterviewsonadistrictrepresentative
regional
Catalonia
ContinuousHealthSurvey
insemesterwaves
of
2500individuals
Sweden
(Stockholm
county)
Sunet
al.2012
32,597
2006
Postalsurvey
onarepresentativesample
oftheStockholm
County
populationaged
20–88years
Zim
babwe(H
arare)
Jelsma2003
2,350
2000
Face-to-face
interviewswith2488residentsfrom
Glenview
(ahigh
density
suburb
ofHarare).Ascompared
tothe1992censusHarare
Profile,males
wereunderrepresentedandthereweremore
young
andbettereducatedrespondentsthan
inthegeneral
population
10 B. Janssen et al.

Most importantly, while the majority of surveys were national representative
surveys covering the whole of the country, some surveys covered a specific part
(such as prefectures, regions or even city areas). Therefore, care should be
exercised in generalizing data outside the geographic location captured by the
data collection. Results in this book are reported separately for the national and
the regional surveys.
Surveys also differed in sample sizes and in the method of data collection. The
Argentinean dataset had the largest sample with over 41,000 respondents, while the
Greek and the Swedish national surveys had the smallest sample of around
500 respondents. Some of the surveys were postal while others were performed
as part of a face-to-face interview or administered by telephone. Since the questions
asked in EQ-5D are very simple to answer, there is no reason to believe that there
would be a significant impact on results other than differences in response rates.
While only the most recent national surveys were included in this book from
each country, the date of data collection varied considerably across countries. Data
collection for the majority of surveys took place during or after 2000, however
some surveys were older with the United Kingdom and Swedish national datasets
being the earliest from 1993 to 1994, respectively. These differences should be
considered when interpreting results, given that health-related quality of life in
general and specifically EQ-5D ratings and values could have changed over time.
Standardized variables across all datasets included reported problems by the five
dimensions, self-reported EQ VAS ratings, and the EQ-5D index values. In addi-
tion, all analyses of EQ-5D data presented in this book focused on three main
characteristics of the population: age, gender, and education level. Age in most
surveys was measured as a continuous variable (life years), while gender was
recorded as a categorical variable. Education level in each country was recoded
to a three-level scale, distinguishing low (i.e. primary), medium (i.e. secondary),
and high (i.e. university degree) education level.
All data analyses were performed using SPSS version 19 and Stata version
12 statistical software packages. All codes were checked and analyses were
reproduced by a second analyst. The exact methodologies are described in the
remainder of this chapter.
2.2 Methods of Describing EQ-5D Population Norms
The EuroQol Group is frequently asked to provide EQ-5D population reference
data (sometimes called normative data) for a specific country or international
region. Such data can be used as reference data to compare profiles for patients
with specific conditions with data for the average person in the general population
in a similar age and/or gender group. This comparison helps to identify the burden
of disease in a particular patient population.
2 Data and Methods 11

Descriptive statistics are provided for EQ VAS, the five dimensions, and
EQ-5D-3L index values for the total population and by gender and the following
age groups: 18–24, 25–34, 35–44, 45–54, 55–64, 65–74, 75+ years.
EQ-5D index value calculations are provided using the following value sets
(Szende et al. 2007):
• European VAS value set for all countries. Note that the European VAS value
set was constructed using data from 11 valuation studies in 6 countries: Finland
(1), Germany (3), The Netherlands (1), Spain (3), Sweden (1) and the UK (2).
This survey included enough data from different European regions to make the
European VAS dataset moderately representative for Europe. (Greiner
et al. 2003; Weijnen et al. 2003).
• Country-specific time trade-off (TTO) value set if available. Note that the
time trade-off (TTO) method has played an important role in generating value
sets for the EQ-5D as one of the most widely accepted preference elicitation
methods for health states (Torrance 1986) for economic evaluation and the
method of choice in the first large-scale EQ-5D valuation study (Dolan 1997).
Table 2.2 summarizes those 13 countries that have their own TTO value sets and
describes the value sets.
• Country-specific VAS value set if available. Note that the Visual Analogue
Scale (VAS) has become the other widely used method to elicit preferences for
the EQ-5D, including nine countries. Table 2.3 summarizes countries that have
their own VAS based value sets and describes the value sets, including the
European value set.
This means that for countries with no available value set from their own general
population, only the European VAS value set based EQ-5D index values are
summarised. However, for countries with available TTO and/or VAS value sets,
additional population norms of EQ-5D index values are calculated.
To summarize key results on reported problems, EQ VAS, and EQ-5D index
values, countries are tabulated in alphabetic order and are not ranked. Detailed
country-by-country results are provided in the appendices. Because the population
norms data are presented by age and gender, there is no need for the sample to have
the same age distribution as the general population in each country. Therefore the
data that are presented in the tables have not been standardized for age or gender.
This means that international comparisons across several age groups should be
made with caution as the demographic build-up by age and gender varies between
countries, and that the samples of the general population used to create the tables do
not necessarily follow that same distribution. However, international comparisons
of data contained in a single cell (i.e. 1 age and gender group) are valid. The
following section describes the methodology used to analyse cross-country
differences in EQ-5D population data.
12 B. Janssen et al.

Table
2.2
CoefficientsfortheestimationoftheEQ-5D
index
values
based
onTTO
valuationstudies
Country
Source
Model
MAD
Constant
MO2
MO3
SC2
SC3
UA2
UA3
PD2
PD3
AD2
AD3
N3
Other
Argentina
Augustovski2009
OLS
0.039
−0.189
−0.272
−0.128
−0.209
−0.111
−0.067
−0.130
−0.209
−0.082
−0.135
O2:0.003
O3:–0.355
Z2:–0.413
Z3:0.117
C22:0.010
C32:–0.005
Denmark
Wittrup-Jensen2002
RE
0.089
−0.114
−0.053
−0.411
−0.063
−0.192
−0.048
−0.144
−0.062
−0.396
−0.068
−0.367
France
Chevalier2011
RE
0.043
−0.155
−0.372
−0.212
−0.326
−0.156
−0.189
−0.112
−0.265
−0.090
−0.204
−0.174
Germany
Greiner
2005
RE
0.047
−0.001
−0.099
−0.327
−0.087
−0.174
−0.112
−0.315
−0.065
−0.323
Italy
Scalone2013
RE
0.030
−0.076
−0.518
−0.100
−0.289
−0.085
−0.198
−0.098
−0.334
−0.095
−0.213
D1:0.043
Japan
Tsuchiya2002
OLS
0.015
−0.152
−0.075
−0.418
−0.054
−0.102
−0.044
−0.133
−0.080
−0.194
−0.063
−0.112
Korea
Lee
2009
OLS
0.029
−0.050
−0.418
−0.046
−0.136
−0.051
−0.208
−0.037
−0.151
−0.043
−0.158
−0.050
Netherlands
Lam
ers2006
RE
0.030
−0.071
−0.036
−0.161
−0.082
−0.152
−0.032
−0.057
−0.086
−0.329
−0.124
−0.325
−0.234
Spain
Badia
2001
RE
NR
−0.024
−0.106
−0.430
−0.134
−0.309
−0.071
−0.195
−0.089
−0.261
−0.062
−0.144
−0.291
Thailand
Tongsiri2011
RE
0.080
−0.202
−0.121
−0.432
−0.121
−0.242
−0.059
−0.118
−0.072
−0.209
−0.032
−0.110
−0.139
United
Kingdom
MVHGroup1995
RE
0.039
−0.081
−0.069
−0.314
−0.104
−0.214
−0.036
−0.094
−0.123
−0.386
−0.071
−0.236
−0.269
United
States
Shaw
2005
RE
0.025
−0.146
−0.558
−0.175
−0.471
−0.140
−0.374
−0.173
−0.537
−0.156
−0.450
D1:0.140
I22:–0.011
I3:0.122
I32:0.015
Zim
babwe
Jelsma2003
RE
0.049
−0.100
−0.056
−0.204
−0.092
−0.231
−0.043
−0.135
−0.067
−0.302
−0.046
−0.173
MO2=1ifmobilityisatlevel2;MO3=1ifmobilityisatlevel3.SC2=1ifself-careisatlevel2;SC3=1ifself-careisatlevel3.UA2=1ifusualactivitiesisat
level2;UA3=1ifusualactivitiesisatlevel3.P
D2=1ifpain/discomfortisatlevel2;PD3=ifpain/discomfortisatlevel3.A
D2=1ifanxiety/depressionisatlevel
2;AD3=1ifanxiety/depressionisatlevel3.N3=1ifanydim
ensionisatlevel3,D1=additionalnumber
ofdim
ensionsateither
level2orlevel3;I2
=number
of
dim
ensionsatlevel2beyondthefirst;I3
=numberofdim
ensionsatlevel3beyondthefirst;O2=1ifalldim
ensionsatlevel1andlevel2;O3=1ifalldim
ensionsat
level1andlevel3;Z2=1ifatleastonedim
ensionatlevel2andonedim
ensionatlevel3;Z3=numberofdim
ensionsatlevel2given
atleastonedim
ensionatlevel
3;C2=number
ofdim
ensionsat
level
2;C3=number
ofdim
ensionsat
level
3;MAD=meanabsolute
difference;OLS=ordinaryleastsquares;RE=random
2 Data and Methods 13

Table
2.3
CoefficientsfortheestimationoftheEQ-5D
index
values
based
onVASvaluationstudies
Country
Source
ModelM
AD
Constant
MO2
MO3
SC2
SC3
UA2
UA3
PD2
PD3
AD2
AD3
N3
Other
Argentina
Augustovski2009
OLS0.020
�0.248
�0.247
�0.184
�0.178
�0.209
�0.148
�0.185
�0.157
�0.150
�0.116
O2:–0.028
O3:–0.388
Z2:–0.232
Z3:0.086
C22:0.020
C32:0.008
Belgium
Cleem
put2004
RE
0.036
�0.152
�0.074
�0.148
�0.083
�0.166
�0.031
�0.062
�0.084
�0.168
�0.103
�0.206
�0.256
Denmark
Wittrup-Jensen2002
RE
NR
�0.225
�0.126
�0.252
�0.112
�0.224
�0.064
�0.128
�0.078
�0.156
�0.091
�0.182
Europea
Greiner
2003
RE
0.030
�0.128
�0.066
�0.183
�0.117
�0.156
�0.026
�0.086
�0.093
�0.164
�0.089
�0.129
�0.229
Finland
Ohinmaa
1995
OLSNR
�0.158
�0.058
�0.230
�0.098
�0.143
�0.047
�0.131
�0.111
�0.153
�0.160
�0.196
Germanyb
Claes
1999
RE
0.036
0.926
0.945
0.393
0.808
0.470
0.880
0.554
0.975
0.467
0.817
0.468
New
Zealand
Devlin2000
RE
0.041
�0.204
�0.075
�0.150
�0.071
�0.142
�0.014
�0.028
�0.080
�0.160
�0.092
�0.184
�0.217
Slovenia
Prevolnik
Rupel
2000
OLSNR
�0.128
�0.206
�0.412
�0.093
�0.186
�0.054
�0.108
�0.111
�0.222
�0.093
�0.186
Spain
Badia
1998
OLSNR
�0.150
�0.090
�0.179
�0.101
�0.202
�0.055
�0.110
�0.060
�0.119
�0.051
�0.102
�0.212
United
Kingdom
MVHGroup1995
RE
NR
�0.155
�0.071
�0.182
�0.093
�0.145
�0.031
�0.081
�0.084
�0.171
�0.063
�0.124
�0.215
aThesevalues
havebeenrescaled
withthemeanvalueofdead
bTheGerman
model
isamultiplicativemodel.Thisim
plies
that
when
anyofthedim
ensionsisat
level
1theappropriatecoefficientforthat
dim
ensionis1
MO2=1ifmobilityisatlevel2,0otherwise;MO3=1ifmobilityisatlevel3,0otherwise.SC2=1ifself-careisatlevel2,0otherwise;SC3=1ifself-careisat
level3,0otherwise.UA2=1ifusualactivitiesisatlevel2,0otherwise;UA3=1ifusualactivitiesisatlevel3,0otherwise.PD2=1ifpain/discomfortisatlevel2,
0otherwise;PD3=ifpain/discomfortisatlevel3,0otherwise.AD2=1ifanxiety/depressionisatlevel2,0otherwise;AD3=1ifanxiety/depressionisatlevel3,
0otherwise.N1=1ifanydim
ensionisateither
level2orlevel3,0otherwise;N3=1ifanydim
ensionisatlevel3,0otherwise;O2=1ifalldim
ensionsatlevel1
andlevel
2,0otherwise;
O3=1ifalldim
ensionsat
level
1andlevel
3,0otherwise;
Z2=1ifat
leastonedim
ensionat
level
2andonedim
ensionat
level
3,
0otherwise;Z3=number
ofdim
ensionsatlevel2given
atleastonedim
ensionatlevel3;C2=numberofdim
ensionsatlevel2;C3=numberofdim
ensionsatlevel
3.GLIM
=generalized
linearmodel;MAD
=meanabsolute
difference;NR=notreported;OLS=ordinaryleastsquares;RE=random
effectsmodel
14 B. Janssen et al.

2.3 Methods of Cross-Country Analysis of EQ-5D Data
Cross-country summary data for reported problems by five dimensions and EQ VAS
were estimated using a standardized population structure for all countries with
national EQ-5D surveys. Countries were tabulated in alphabetic order. Standar-
dization for age was performed to avoid bias due to the fact that some populations
have a relatively higher proportion of elderly people. Age standardization of reported
problems by dimension and EQVASwas based on the European population structure
using Eurostat data from 2010 (Table 2.4).
To explore reasons for cross-country differences in EQ-5D data, correlations
between country-specific EQ-5D data (EQ VAS and five dimensions) and country-
specific economic and health system macro indicators were calculated.
Living standards were estimated by means of Gross Domestic Product (GDP)
per capita and unemployment rate. Indicators for health care system performance
were health expenditure per capita and health expenditure as a % of GDP, number
of hospital beds per 1,000 people and number of physicians per 1,000 people. The
indicators were selected on the basis of a presumed or possible relationship with
self-reported health. Data were obtained from the World Health Organization
Statistical Information System and the World Bank. The data were from 2010 or
the closest year with available data (Table 2.5). An alternative set of macro data was
also used to see how results might change when using macro data from the same
year as the EQ-5D data collection, including variables on gross national income on
purchasing power parity, unemployment rate, and health expenditure data.
For all correlation analyses, non-parametric Spearman rank correlations were
calculated. For this calculation, countries were ranked based on mean self-assessed
health results, and their living standards and health care system performance
characteristics. A high rank correlation means that the ranking of countries on
one variable (e.g. prevalence of self-reported health problems) is similar to the
ranking of another variable (e.g. GDP per capita).
Table 2.4 European
population age structureAge group EU population (%)
18–24 11
25–34 17
35–44 18
45–54 18
55–64 15
65–74 11
75+ 10
ALL 100
Source: Eurostat 2010, EU 27
2 Data and Methods 15

2.4 Methods of Sociodemographic Analysis of EQ-5D Data
Two main approaches were used to derive socio-demographic indicators based on
EQ-5D, based on odds ratios and concentration indices.
Logistic regression age-adjusted odds ratios for reporting problems on each
EQ-5D dimension were calculated by age groups, gender, and education. An odds
ratio higher than 1 indicates that the examined group reported more health problems
than the reference group. The reference group was males, 18–24 years, with
medium/high education.
Secondly, the analysis used the concentration index method, which is a single
index measure of relative inequalities (Wagstaff et al. 1991; Kakwani et al. 1997).
The overall health concentration index measures the mean difference in health
between individuals as a proportion of the average health of the total population.
This index can also be interpreted as a measure of how unequal the distribution of
health is in the population. Health inequality is measured on a scale between
0 (meaning complete equality in health) and 1 (meaning complete inequality in
health). Researchers also showed that the concentration index value also
Table 2.5 Country-specific economic and health system macro indicators
GDP per
capita $
2010
Unemployment
rate % 2010a
Health
expenditure (%
of GDP) 2010a
Health
expenditure per
capita $ 2010a
Physicians per
1,000 people
2004–2009a
Argentina 9,124 8.6 8.1 742 3.2
Belgium 43,006 8.3 10.7 4,618 3.0
China 4,433 4.3 5.1 221 1.4
Denmark 56,486 7.4 11.4 6,422 3.4
France 39,170 9.3 11.9 4,691 3.5
Germany 40,164 7.1 11.6 4,668 3.5
Greece 25,832 12.5 10.2 2,729 6.0
Hungary 12,863 11.2 7.3 942 3.1
Italy 33,787 8.4 9.5 3,248 4.2
Korea 20,540 3.7 6.9 1,439 2.0
Netherlands 46,623 4.5 11.9 5,593 3.9
New Zealand 32,407 6.5 10.1 3,279 2.4
Slovenia 22,898 7.2 9.4 2,154 2.5
Spain 29,956 20.1 9.5 2,883 3.7
Sweden 49,360 8.4 9.6 4,710 3.8
Thailand 4,614 1.2 3.9 179 0.3
United Kingdom 36,256 7.8 9.6 3,503 2.7
United States 46,612 9.6 17.9 8,362 2.4
Source: Macro indicators for each country were obtained from the World Bank (www.worldbank.
org) Physician per 1,000 population data were obtained from the World Health Organization
Statistical Information System (www.who.int)aData availability for last year varies in some countries
16 B. Janssen et al.

corresponds to 75 % of the Schutz index, and as such, it can also be interpreted as
the proportion of health that should be redistributed from those above the average
level to those below the average in order to equalize the distribution of health.
(Koolman and Doorslaer 2004).
The overall concentration index can be decomposed to identify the impact of
various factors, such as socio-demographic or quality of life characteristics, in order
to determine how much each factor contributes to inequalities (Wagstaff and
Doorslaer 2004; Clarke et al. 2010). In the current analysis, overall self-reported
health was measured by the EQ VAS. Decomposition analysis was performed to
determine inequalities by socio-demographic factors and by the EQ-5D
dimensions, as well as in a combined model in which both socio-demographic
and EQ-5D dimension variables were included.
The health concentration index for overall self-reported health, as measured by
the EQ VAS, was computed by the convenient regression model as proposed by
Kakwani et al. (1997):
2σ2REQVAS
EQVASi ¼ αi þ γkRi þ εi
where Ri is the relative fractional rank of the ith individual (ranked by the
individual’s EQ VAS health), and γk is the estimated concentration index.
For the purposes of the decomposition analysis, the same estimation is used for
all explanatory variables (by replacing EQ VAS with the explanatory variable in the
equation and also using this variable for ranking purposes).
The total health concentration index can be written as the weighted sum of the
concentration indices of the explanatory variables and the generalized concentra-
tion index of ε:
C ¼X
k
η kC xk þ GC ε
where the weights are equal to the elasticities of EQ VAS score with respect to each
explanatory variable in the model:
η k ¼ γ kx k=EQVAS
where x k (the mean of xk explanatory variables: age, gender, education, EQ-5D
problems) is multiplied by the coefficients for each explanatory variable that are
taken from the linear regression model to explain EQ VAS:
EQ� VAS ¼ αþX
k
γkχik þ εi:
Open Access This chapter is distributed under the terms of the Creative Commons Attribution
Noncommercial License, which permits any noncommercial use, distribution, and reproduction in
any medium, provided the original author(s) and source are credited.
2 Data and Methods 17

Chapter 3
Population Norms for the EQ-5D
Bas Janssen and Agota Szende
3.1 Catalogue of Population Norms
Annexes 1 and 2 capture a full set of EQ-5D population norm tables that were
estimated for each country. The tables contain information on the size of the study,
EQ VAS ratings and proportion of reported problems on each of the EQ-5D
dimensions, as well as EQ-5D index values.
Annex 1 includes surveys that were based on national representative popula-
tions. The survey for England is included among the national surveys, as it is
expected to be referenced more widely in studies performed in the United King-
dom. Annex 2 includes surveys that were based on general populations but were
limited to specific regions of the particular country. There are three examples where
both national and regional surveys are available in a single country, including
Spain, Sweden, and the United Kingdom. The choice between using the national
versus the regional dataset as a reference group may well depend on the objectives
and audiences of future studies. It is important to note that in all of these three
countries, the regional surveys were conducted more recently. Both the survey for
England and the Stockholm county survey capture a large proportion of the
population in England and Sweden. The results of the English survey were similar
to the UK survey, conducted 17 years previously, however no EQ VAS data were
collected in the English survey. The new Stockholm county survey results show
consistently worse EQ-5D population norms in all EQ-5D variables and in all age
B. Janssen, M.Sc., Ph.D. (*)
Medical Psychology and Psychotherapy, Erasmus MC, Rotterdam, The Netherlands
EuroQol Group, Rotterdam, The Netherlands
e-mail: [email protected]
A. Szende, M.Sc., Ph.D.
Global Health Economics and Outcomes Research, Covance, Leeds, United Kingdom
e-mail: [email protected]
A. Szende et al. (eds.), Self-Reported Population Health: An International Perspectivebased on EQ-5D, DOI 10.1007/978-94-007-7596-1_3, © The Author(s) 2014
19

groups. The two Spanish regional surveys also generally show worse EQ-5D
population norms compared to the earlier national Spanish survey, although this
is not consistently seen in all age groups.
All surveys included the EQ VAS ratings, with the exception of the Finnish and
English surveys. All surveys included EQ-5D dimensions. The EQ-5D index
population norms based on the European value set were calculated for all surveys.
Country-specific TTO-based value sets were available for 13 countries to calculate
EQ-5D index population norms. Country-specific VAS-based value sets were
available for 10 countries to calculate EQ-5D index population norms. Results for
sub-groups with less than 15 observations were indicated as not being available.
Key results are discussed in the sections below, while all detailed tables are
included in the annexes.
The population norm tables in the annexes reflect granular reporting of descrip-
tive statistics in order to provide flexibility for researchers when using the EQ-5D
norms for comparative purposes. The population norm tables can be used as
reference data to compare profiles for patients with specific conditions with data
for the average person in the general population in a similar age and/or gender
group.
3.2 EQ VAS Population Norms
For illustration purposes, the mean EQ VAS data from all population surveys of the
EuroQol archive were pooled and are presented in Fig. 3.1. As can be seen, the
mean EQ VAS ratings decrease with increasing age. Also, men of all age groups
reported higher EQ VAS ratings than women.
Table 3.1 shows results for self-rated EQ VAS scores for each country by
age group and for the total population. It is important to note that while results in
each age group may be compared across countries, the total population scores
cannot be compared directly as they reflect the unique age structure within each
country.
Figure 3.2 graphically presents self-rated EQ VAS scores by age group for each
country. As can be seen, the mean EQ VAS ratings decrease with increasing age,
although countries vary according to how younger age groups rate their health and
how the slope of people’s self-rated health declines over the decades of their life.
Korean data show a somewhat outlier pattern in people reporting their health within
a narrow EQ VAS range. This was also observed to some extent in the New Zealand
data.
For easier interpretation, Figs. 3.3 and 3.4 present self-rated EQ VAS scores
separately by age group for two sets of countries. The first graph shows the ‘upper
values’ (mainly viewed from the perspective of older people), and the second the
‘lower values’. Accordingly, a difference in the lower end of the Y-axis on the first
figure should be noted.
20 B. Janssen and A. Szende

50
55
60
65
70
75
80
85
90
95
100
18-24 25-34 35-44 45-54 55-64 65-74 75+
EQ V
AS
Age
Males
Females
Fig. 3.1 Illustration of mean population EQ VAS ratings
Table 3.1 EQ VAS ratings by age group and total population (not standardized)
18–24 25–34 35–44 45–54 55–64 65–74 75+ Total
Argentina 82.0 79.4 77.2 74.4 69.5 67.9 62.2 75.3
Belgium 84.0 82.0 80.2 77.2 74.2 71.3 69.4 77.6
China 89.1 85.7 82.7 79.4 76.5 72.2 69.4 80.4
Denmark 86.2 87.9 85.8 83.0 81.6 78.3 76.2 83.7
France 83.9 83.2 78.7 77.9 74.2 68.1 61.5 76.8
Germany 85.3 84.0 82.5 78.5 72.9 68.6 60.5 77.3
Greece 83.5 85.8 84.7 78.0 69.9 67.0 56.0 79.0
Hungary 83.3 81.1 75.3 69.1 63.7 59.0 53.9 71.1
Italy 87.5 83.9 81.4 77.0 74.0 67.8 60.1 77.1
Korea 78.9 80.7 80.6 80.4 76.9 76.5 – 79.5
Netherlands 85.7 84.6 83.7 81.0 80.7 78.0 72.9 82.0
New Zealand 82.4 82.3 82.5 82.2 81.6 79.6 70.8 80.8
Slovenia 85.4 82.6 80.8 75.5 67.9 65.3 55.4 76.4
Spain 82.0 80.1 76.7 73.6 72.0 69.0 62.2 75.0
Sweden 84.3 86.2 86.2 83.7 79.0 81.5 71.8 83.3
Thailand 82.9 80.9 80.1 78.3 79.3 76.1 72.3 79.4
United Kingdom 86.5 86.8 86.6 82.0 81.7 77.3 73.8 82.8
United States 86.2 83.5 81.8 79.2 76.9 75.1 68.5 80.0
3 Population Norms for the EQ-5D 21

Table 3.2 shows results for self-rated EQ VAS scores for each regional survey by
age group and for the total population. As seen across the national surveys, the
mean EQ VAS ratings decrease with increasing age in the regional surveys as well.
3.3 EQ-5D Dimensions
As the data on the 5 EQ-5D dimensions are not continuous but ordinal, the
information is presented as the proportions of the population reporting level
1 (no problems), level 2 (some problems) and level 3 (extreme problems) per
dimension, by age group and gender. Because the number of people reporting
severe problems is usually very small in general population surveys, the sum of
the proportions of reported level 2 and level 3 problems is sometimes used. This
essentially changes the 3-level EQ-5D dimensions into 2-level dimensions, using
categories ‘no problems’ and ‘problems’.
In a pooled dataset of surveys, Fig. 3.5 illustrates the sum of the proportion of
reported level 2 and level 3 problems for each of the 5 EQ-5D dimensions for three
distinct age groups. As can be seen from the figure, the proportion of problems
increased with age on all dimensions. Problems with mobility increased the most
with increasing age, whereas problems with anxiety/depression increased the least.
For every age group the proportion of problems with pain/discomfort was higher
than the proportion of problems on the other dimensions.
Fig. 3.2 EQ VAS ratings by age group
22 B. Janssen and A. Szende

65.0
70.0
75.0
80.0
85.0
90.0
18-24 25-34 35-44 45-54 55-64 65-74 75+
Belgium
China
Denmark
Korea
Netherlands
New Zealand
Sweden
Thailand
UK
US
Fig. 3.3 EQ VAS ratings by age group (countries with ‘upper values’)
50.0
55.0
60.0
65.0
70.0
75.0
80.0
85.0
90.0
18-24 25-34 35-44 45-54 55-64 65-74 75+
Argentina
France
Germany
Greece
Hungary
Italy
Slovenia
Spain
Fig. 3.4 EQ VAS ratings by age group (countries with ‘lower values’)
3 Population Norms for the EQ-5D 23

Table 3.3 summarizes results for reported problems along the five dimensions by
country. These results reflect the total population scores and cannot be compared
directly to each other as they reflect the unique age structure within each country.
Table 3.2 EQ VAS ratings by age group and total population (not standardized) from regional
surveys
18–24 25–34 35–44 45–54 55–64 65–74 75+ Total
Armenia (5 regions) 87.8 78.4 68.0 62.3 55.3 50.1 43.8 65.7
Canada (Alberta) 81.6 80.5 78.7 75.7 77.1 77.1 75.3 78.3
Japan (3 prefectures) 78.9 77.9 79.3 79.8 76.8 76.6 67.7 77.8
Spain – Canary Islands 83.3 79.7 77.4 71.6 66.1 64.4 56.4 71.7
Spain – Catalunya 82.4 79.3 77.5 72.7 67.6 63.6 54.4 72.3
Sweden – Stockholm county 81.7 81.5 80.7 79.2 78.1 75.9 68.5 78.7
Zimbabwe – Harare district 81.8 79.8 76.6 75.1 70.5 61.5 – 79.8
5%
1%
8%
24%
18%
15%
4%
16%
41%
22%
37%
11%
32%
56%
24%
0%
10%
20%
30%
40%
50%
60%
18-39
40-59
60+
Fig. 3.5 EQ-5D profile of the population (% reporting any problem)
24 B. Janssen and A. Szende

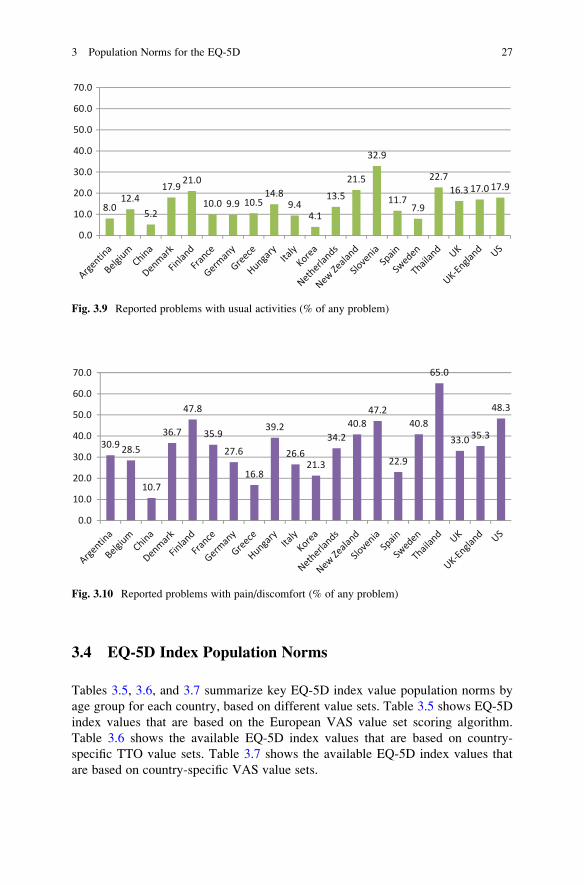
Figure 3.6 graphically presents reported problems by dimension for each coun-
try. As can be seen, problems with pain/discomfort were generally the most
prevalent, while problems with self-care were the least prevalent among the
5 dimensions.
Table 3.3 Reported problems by 5 dimensions (% of any problem)
Mobility Self-care Usual activities Pain/discomfort Anxiety/depression
Argentina 10.8 2.9 8.0 30.9 22.8
Belgium 12.6 4.0 12.4 28.5 6.6
China 5.1 2.8 5.2 10.7 8.7
Denmark 10.7 2.5 17.9 36.7 16.1
England 19.4 5.6 17.0 35.3 19.3
Finland 26.3 8.6 21.0 47.8 13.9
France 13.4 4.0 10.0 35.9 15.0
Germany 15.9 2.7 9.9 27.6 4.3
Greece 13.3 5.7 10.5 16.8 10.7
Hungary 19.6 6.5 14.8 39.2 35.2
Italy 10.4 3.3 9.4 26.6 8.7
Korea 5.9 0.8 4.1 21.3 17.4
Netherlands 11.5 3.4 13.5 34.2 3.5
New Zealand 20.0 4.4 21.5 40.8 21.2
Slovenia 29.8 14.0 32.9 47.2 36.4
Spain 13.7 4.1 11.7 22.9 7.8
Sweden 8.6 1.5 7.9 40.8 26.0
Thailand 26.3 8.7 22.7 65.0 47.4
United Kingdom 18.4 4.3 16.3 33.0 21.0
United States 18.5 3.7 17.9 48.3 23.2
MobilitySelf-Care
Usual ActivitiesPain/Discomfort
Anxiety/Depression
0.0
10.0
20.0
30.0
40.0
50.0
60.0
70.0 Mobility
Self-Care
Usual Activities
Pain/Discomfort
Anxiety/Depression
Fig. 3.6 EQ-5D profile by country
3 Population Norms for the EQ-5D 25

Figures 3.7, 3.8, 3.9, 3.10 and 3.11 show reported problems for each dimension
separately across all countries. Variability in reported problems for each dimension
is also present among countries, with percentages of reported problem ranges of
5.1–29.8 % for mobility; 0.8–14.0 % for self-care; 4.1–32.9 % for usual activities;
10.7–65.0 % for pain/discomfort; and 3.5–47.4 % for anxiety/depression.
Table 3.4 summarizes the results for reported problems across the 5 dimensions
by regional surveys. These results reflect the total population scores and cannot be
compared directly to each other as they reflect the unique age structure within each
country.
10.8 12.65.1
10.7
26.3
13.4 15.9 13.319.6
10.45.9
11.5
20.0
29.8
13.78.6
26.3
18.4 19.4 18.5
0.0
10.0
20.0
30.0
40.0
50.0
60.0
70.0
Fig. 3.7 Reported problems with mobility (% of any problem)
2.9 4.0 2.8 2.58.6
4.0 2.7 5.7 6.53.3 0.8 3.4 4.4
14.0
4.1 1.58.7
4.3 5.6 3.7
0.0
10.0
20.0
30.0
40.0
50.0
60.0
70.0
Fig. 3.8 Reported problems with self-care (% of any problem)
26 B. Janssen and A. Szende
3.4 EQ-5D Index Population Norms
Tables 3.5, 3.6, and 3.7 summarize key EQ-5D index value population norms by
age group for each country, based on different value sets. Table 3.5 shows EQ-5D
index values that are based on the European VAS value set scoring algorithm.
Table 3.6 shows the available EQ-5D index values that are based on country-
specific TTO value sets. Table 3.7 shows the available EQ-5D index values that
are based on country-specific VAS value sets.
8.012.4
5.2
17.921.0
10.0 9.9 10.514.8
9.44.1
13.5
21.5
32.9
11.77.9
22.716.3 17.0 17.9
0.0
10.0
20.0
30.0
40.0
50.0
60.0
70.0
Fig. 3.9 Reported problems with usual activities (% of any problem)
30.9 28.5
10.7
36.7
47.8
35.9
27.6
16.8
39.2
26.621.3
34.240.8
47.2
22.9
40.8
65.0
33.0 35.3
48.3
0.0
10.0
20.0
30.0
40.0
50.0
60.0
70.0
Fig. 3.10 Reported problems with pain/discomfort (% of any problem)
3 Population Norms for the EQ-5D 27

Therefore, cross-country differences seen in Tables 3.6 and 3.7 can be due to a
mixture of differences in how people in each country report problems along the five
dimensions and how different populations value these problems. Total population
scores also cannot be compared for the reason that they are not standardized for
demographic differences across countries. Regional data are presented using the
available national TTO and VAS value sets.
Open Access This chapter is distributed under the terms of the Creative Commons Attribution
Noncommercial License, which permits any noncommercial use, distribution, and reproduction in
any medium, provided the original author(s) and source are credited.
22.8
6.6 8.716.1 13.9 15.0
4.310.7
35.2
8.7
17.4
3.5
21.2
36.4
7.8
26.0
47.4
21.0 19.323.2
0.0
10.0
20.0
30.0
40.0
50.0
60.0
70.0
Fig. 3.11 Reported problems with anxiety/depression (% of any problem)
Table 3.4 Reported problems by five dimensions (% of any problem) – regional surveys
Mobility Self-care
Usual
activities
Pain/
discomfort
Anxiety/
depression
Armenia (5 regions) 27.4 14.3 30.2 65.1 53.5
Canada (Alberta) 18.5 3.7 17.9 48.3 23.2
Japan (3 prefecture) 7.3 1.8 5.2 20.0 8.5
Spain-Canary Islands 17.1 6.3 14.7 39.5 25.7
Spain – Catalunya 16.9 7.0 12.4 32.9 19.5
Sweden – Stockholm county 11.6 2.1 10.4 45.2 32.7
Zimbabwe – Harare district 9.8 3.4 11.0 30.5 30.7
28 B. Janssen and A. Szende
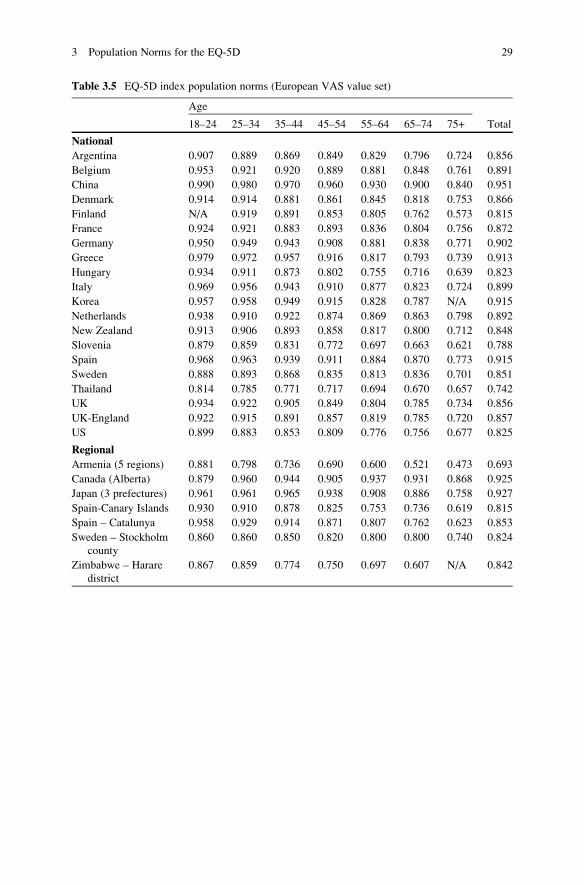
Table 3.5 EQ-5D index population norms (European VAS value set)
Age
18–24 25–34 35–44 45–54 55–64 65–74 75+ Total
National
Argentina 0.907 0.889 0.869 0.849 0.829 0.796 0.724 0.856
Belgium 0.953 0.921 0.920 0.889 0.881 0.848 0.761 0.891
China 0.990 0.980 0.970 0.960 0.930 0.900 0.840 0.951
Denmark 0.914 0.914 0.881 0.861 0.845 0.818 0.753 0.866
Finland N/A 0.919 0.891 0.853 0.805 0.762 0.573 0.815
France 0.924 0.921 0.883 0.893 0.836 0.804 0.756 0.872
Germany 0.950 0.949 0.943 0.908 0.881 0.838 0.771 0.902
Greece 0.979 0.972 0.957 0.916 0.817 0.793 0.739 0.913
Hungary 0.934 0.911 0.873 0.802 0.755 0.716 0.639 0.823
Italy 0.969 0.956 0.943 0.910 0.877 0.823 0.724 0.899
Korea 0.957 0.958 0.949 0.915 0.828 0.787 N/A 0.915
Netherlands 0.938 0.910 0.922 0.874 0.869 0.863 0.798 0.892
New Zealand 0.913 0.906 0.893 0.858 0.817 0.800 0.712 0.848
Slovenia 0.879 0.859 0.831 0.772 0.697 0.663 0.621 0.788
Spain 0.968 0.963 0.939 0.911 0.884 0.870 0.773 0.915
Sweden 0.888 0.893 0.868 0.835 0.813 0.836 0.701 0.851
Thailand 0.814 0.785 0.771 0.717 0.694 0.670 0.657 0.742
UK 0.934 0.922 0.905 0.849 0.804 0.785 0.734 0.856
UK-England 0.922 0.915 0.891 0.857 0.819 0.785 0.720 0.857
US 0.899 0.883 0.853 0.809 0.776 0.756 0.677 0.825
Regional
Armenia (5 regions) 0.881 0.798 0.736 0.690 0.600 0.521 0.473 0.693
Canada (Alberta) 0.879 0.960 0.944 0.905 0.937 0.931 0.868 0.925
Japan (3 prefectures) 0.961 0.961 0.965 0.938 0.908 0.886 0.758 0.927
Spain-Canary Islands 0.930 0.910 0.878 0.825 0.753 0.736 0.619 0.815
Spain – Catalunya 0.958 0.929 0.914 0.871 0.807 0.762 0.623 0.853
Sweden – Stockholm
county
0.860 0.860 0.850 0.820 0.800 0.800 0.740 0.824
Zimbabwe – Harare
district
0.867 0.859 0.774 0.750 0.697 0.607 N/A 0.842
3 Population Norms for the EQ-5D 29

Table 3.6 EQ-5D index population norms (country-specific TTO value sets)
Age
18–24 25–34 35–44 45–54 55–64 65–74 75+ Total
National
Argentina 0.951 0.936 0.919 0.898 0.874 0.835 0.756 0.902
Denmark 0.928 0.927 0.901 0.882 0.870 0.847 0.794 0.887
France 0.948 0.946 0.913 0.922 0.853 0.810 0.735 0.892
Germany 0.972 0.973 0.966 0.945 0.922 0.891 0.839 0.938
Italy 0.984 0.978 0.973 0.955 0.936 0.904 0.839 0.947
Korea 0.981 0.982 0.976 0.960 0.909 0.888 0.958
Netherlands 0.950 0.927 0.935 0.890 0.890 0.886 0.830 0.910
Spain 0.982 0.975 0.949 0.923 0.901 0.891 0.781 0.929
UK 0.940 0.927 0.911 0.847 0.799 0.779 0.726 0.856
UK-England 0.929 0.919 0.893 0.855 0.810 0.773 0.703 0.855
US 0.924 0.912 0.889 0.855 0.830 0.817 0.755 0.867
Regional 18–24 25–34 35–44 45–54 55–64 65–74 75+ Total
Japan (3 prefecture) 0.967 0.963 0.965 0.941 0.912 0.881 0.768 0.929
Spain-Canary Islands 0.953 0.934 0.911 0.854 0.780 0.754 0.596 0.836
Spain – Catalunya 0.974 0.947 0.941 0.898 0.838 0.780 0.594 0.871
Zimbabwe – Harare district 0.848 0.841 0.793 0.785 0.756 0.661 0.833
Table 3.7 EQ-5D index population norms (country-specific VAS value set)
Age
18–24 25–34 35–44 45–54 55–64 65–74 75+ Total
National
Argentina 0.928 0.911 0.888 0.867 0.837 0.793 0.712 0.871
Belgium 0.948 0.915 0.912 0.881 0.871 0.836 0.748 0.883
Denmark 0.885 0.884 0.845 0.822 0.799 0.766 0.691 0.826
Finland 0.909 0.878 0.835 0.781 0.738 0.583 0.800
Germany 0.962 0.966 0.962 0.937 0.915 0.882 0.817 0.930
New Zealand 0.890 0.883 0.869 0.827 0.782 0.763 0.672 0.818
Slovenia 0.869 0.841 0.794 0.712 0.619 0.554 0.498 0.738
Spain 0.969 0.963 0.939 0.912 0.883 0.866 0.761 0.914
UK 0.931 0.920 0.902 0.846 0.799 0.778 0.726 0.852
UK-England 0.922 0.914 0.888 0.854 0.814 0.775 0.706 0.853
Regional 18–24 25–34 35–44 45–54 55–64 65–74 75+ Total
Japan (3 prefecture) 0.885 0.884 0.845 0.822 0.799 0.766 0.691 0.826
Spain-Canary Islands 0.934 0.916 0.886 0.834 0.765 0.740 0.617 0.821
Spain – Catalunya 0.960 0.932 0.919 0.878 0.815 0.770 0.620 0.857
30 B. Janssen and A. Szende

Chapter 4
Cross-Country Analysis of EQ-5D Data
Agota Szende and Bas Janssen
4.1 Cross Country Comparison of Standardized EQ-5D
Data
EQ VAS ratings and the rate of self-reported problems on the five dimensions
within specific age groups were seen to be variable between countries in Chap. 3.
However, when aggregate measures of self-assessed health are compared between
countries, it is necessary to adjust for potential differences in demographics. As
gender was shown to play a small role in explaining EQ-5D data, the
standardization took into account age differences across countries.
Table 4.1 presents mean EQ-5D data for 18 countries with national representa-
tive population surveys where demographic characteristics were standardized based
on a European population structure. Note that the data presented in Table 4.1 do not
represent the actual situation in each country, but are based on the European age
distribution. Because the age structure superimposed on the dataset was the same
for each country, comparisons between countries can be made. When comparing
Table 4.1 with the non-standardized EQ VAS ratings (Table 3.1, column for total)
and 5D reported problems (Table 3.3), the results show the impact of age
standardization of population norms, that are usually within a few percentage
score difference.
As can be seen in Table 4.1, the data show that important differences exist in
EQ-5D population data across countries after taking into account differences in
population structure. Mean EQ VAS score varied from 70.37 to 83.28 in the total
A. Szende, M.Sc., Ph.D. (*)
Global Health Economics and Outcomes Research, Covance, Leeds, United Kingdom
e-mail: [email protected]
B. Janssen, M.Sc., Ph.D.
Medical Psychology and Psychotherapy, Erasmus MC, Rotterdam, The Netherlands
EuroQol Group, Rotterdam, The Netherlands
e-mail: [email protected]
A. Szende et al. (eds.), Self-Reported Population Health: An International Perspectivebased on EQ-5D, DOI 10.1007/978-94-007-7596-1_4, © The Author(s) 2014
31

population. The largest difference between any two countries in reporting problems
were 28.6, 12.7, 31.9, 53.7, and 43.8 % in absolute terms along the five dimensions,
respectively.
Hungary reported the lowest EQ VAS ratings, followed by Korea, while
Denmark and the United Kingdom reported the highest EQ VAS ratings. The
highest proportion of problems on the 5 EQ-5D dimensions was reported by
Slovenia and Thailand. Note that while Hungary and Korea reported a lower
mean EQ VAS than Slovenia and Thailand, more problems were reported in
Slovenia and Thailand across the 5 EQ-5D dimensions. At the other end of the
spectrum, China reported the lowest proportion of problems but reported average
EQ VAS ratings, while Denmark and the UK reported the highest EQ VAS ratings
and average proportions of problems. These results indicate that countries also
differed in how they answered the more general EQ VAS question relative to how
they answered the more specific questions on the EQ-5D dimensions.
4.2 The Impact of Economic and Health Care Indicators
After seeing that differences in EQ-5D data across countries exist after
standardization for population structure, this section examines whether these
patterns can be explained by differences in living standards and health care system
Table 4.1 Self-reported EQ-5D results after age standardization (mean VAS and proportions of
any problem)
EQ VAS Mobility Self-care
Usual
activity
Pain/
discomfort
Anxiety/
depression
Argentina 73.92 0.133 0.037 0.098 0.339 0.238
Belgium 77.42 0.139 0.048 0.129 0.294 0.061
China 79.91 0.061 0.034 0.061 0.115 0.092
Denmark 83.28 0.115 0.028 0.186 0.370 0.162
France 76.32 0.144 0.046 0.107 0.358 0.145
Germany 77.16 0.172 0.031 0.105 0.278 0.045
Greece 76.50 0.172 0.083 0.137 0.204 0.112
Hungary 70.37 0.209 0.072 0.158 0.404 0.362
Italy 76.95 0.123 0.044 0.111 0.277 0.092
Korea 71.31 0.065 0.010 0.046 0.296 0.229
Netherlands 81.44 0.118 0.035 0.125 0.326 0.032
New Zealand 80.76 0.192 0.043 0.208 0.393 0.212
Slovenia 74.47 0.347 0.167 0.365 0.510 0.380
Spain 74.29 0.127 0.040 0.110 0.213 0.073
Sweden 82.49 0.113 0.025 0.096 0.425 0.264
Thailand 78.90 0.298 0.092 0.259 0.652 0.470
United Kingdom 82.75 0.182 0.043 0.162 0.331 0.209
US 79.33 0.193 0.037 0.183 0.480 0.224
32 A. Szende and B. Janssen

Table
4.2
Spearm
anrankcorrelationsbetweenindicators
oflivingstandardsandself-reported
health
Agegroup
GDPper
capita
Unem
ploymentrate
Healthexpenditure
(%ofGDP)
Healthexpenditure
per
capita
Physiciansper
1,000
people
EQ-V
AS
18–24
0.38
�0.12
0.29
0.40
0.09
25–34
0.55*
�0.06
0.44
0.53*
0.32
35–44
0.50*
�0.26
0.35
0.47
0.18
45–54
0.49*
�0.50*
0.29
0.48*
�0.13
55–64
0.45
�0.50*
0.26
0.45
�0.25
65–74
0.47
�0.48*
0.20
0.44
�0.21
75+
0.42
�0.51*
0.17
0.37
�0.24
Total
0.58*
�0.35
0.39
0.55*
�0.03
EQ-5D
dim
ension
Agegroup
GDPper
capita
Unem
ploymentrate
Healthexpenditure
(%ofGDP)
Healthexpenditure
per
capita
Physiciansper
1,000
people
Mobility
18–24
0.20
�0.24
0.28
0.21
�0.38
25–34
0.11
�0.21
0.16
0.14
�0.43
35–44
�0.09
0.11
0.10
�0.03
�0.33
45–54
0.01
0.03
0.08
0.00
�0.23
55–64
�0.38
0.05
�0.11
�0.32
�0.22
65–74
�0.32
0.07
�0.11
�0.27
�0.24
75+
�0.11
0.08
�0.10
�0.13
�0.01
Total
�0.19
0.14
0.04
�0.13
�0.27
Self-care
18–24
�0.21
�0.32
�0.15
�0.18
�0.30
25–34
0.09
�0.20
0.10
0.11
�0.37
35–44
�0.33
0.36
�0.03
�0.25
�0.20
45–54
0.01
�0.04
0.02
�0.02
�0.26
55–64
�0.48*
0.24
�0.25
�0.42
�0.26
65–74
�0.50*
0.09
�0.26
�0.47*
�0.17
75+
�0.25
0.51*
�0.14
�0.31
0.44
Total
�0.35
0.26
�0.14
�0.35
�0.05
(continued)
4 Cross-Country Analysis of EQ-5D Data 33

Table
4.2
(continued)
EQ-5D
dim
ension
Agegroup
GDPper
capita
Unem
ploymentrate
Healthexpenditure
(%ofGDP)
Healthexpenditure
per
capita
Physiciansper
1,000
people
Usual
activities
18–24
0.34
�0.29
0.31
0.37
�0.34
25–34
0.33
�0.26
0.28
0.34
�0.32
35–44
0.23
�0.16
0.24
0.25
�0.32
45–54
0.23
�0.09
0.13
0.22
�0.27
55–64
�0.18
0.12
�0.03
�0.14
�0.17
65–74
�0.15
�0.10
�0.05
�0.15
�0.25
75+
�0.13
0.09
�0.13
�0.18
�0.05
Total
0.08
�0.03
0.13
0.09
�0.24
Pain/discomfort
18–24
0.34
�0.18
0.26
0.37
�0.27
25–34
0.32
�0.17
0.23
0.32
�0.21
35–44
0.26
0.01
0.15
0.27
�0.21
45–54
0.16
�0.05
0.05
0.17
�0.28
55–64
�0.04
�0.13
�0.17
�0.04
�0.38
65–74
�0.16
�0.21
�0.24
�0.14
�0.51*
75+
�0.20
�0.16
�0.30
�0.18
�0.44
Total
0.10
�0.11
�0.01
0.12
�0.38
Anxiety/depression
18–24
�0.01
�0.08
�0.17
0.00
�0.36
25–34
�0.24
0.01
�0.30
�0.22
�0.47
35–44
�0.30
0.10
�0.37
�0.28
�0.42
45–54
�0.30
0.07
�0.41
�0.30
�0.40
55–64
�0.43
�0.07
�0.56*
�0.44
�0.47*
65–74
�0.53*
�0.08
�0.60**
�0.52*
�0.54*
75+
�0.51*
�0.25
�0.68**
�0.52*
�0.59**
Total
�0.38
�0.04
�0.51*
�0.38
�0.46
*p<
0.05;**p<
0.01
34 A. Szende and B. Janssen
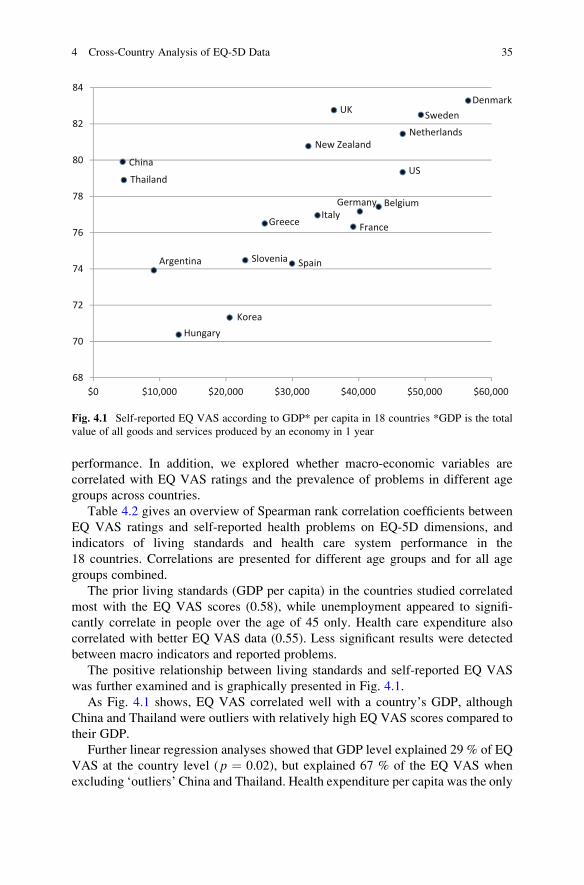
performance. In addition, we explored whether macro-economic variables are
correlated with EQ VAS ratings and the prevalence of problems in different age
groups across countries.
Table 4.2 gives an overview of Spearman rank correlation coefficients between
EQ VAS ratings and self-reported health problems on EQ-5D dimensions, and
indicators of living standards and health care system performance in the
18 countries. Correlations are presented for different age groups and for all age
groups combined.
The prior living standards (GDP per capita) in the countries studied correlated
most with the EQ VAS scores (0.58), while unemployment appeared to signifi-
cantly correlate in people over the age of 45 only. Health care expenditure also
correlated with better EQ VAS data (0.55). Less significant results were detected
between macro indicators and reported problems.
The positive relationship between living standards and self-reported EQ VAS
was further examined and is graphically presented in Fig. 4.1.
As Fig. 4.1 shows, EQ VAS correlated well with a country’s GDP, although
China and Thailand were outliers with relatively high EQ VAS scores compared to
their GDP.
Further linear regression analyses showed that GDP level explained 29 % of EQ
VAS at the country level ( p ¼ 0.02), but explained 67 % of the EQ VAS when
excluding ‘outliers’ China and Thailand. Health expenditure per capita was the only
Argentina
Belgium
China
Denmark
France
Germany
Greece
Hungary
Italy
Korea
NetherlandsNew Zealand
Slovenia Spain
Sweden
Thailand
UK
US
68
70
72
74
76
78
80
82
84
$0 $10,000 $20,000 $30,000 $40,000 $50,000 $60,000
Fig. 4.1 Self-reported EQ VAS according to GDP* per capita in 18 countries *GDP is the total
value of all goods and services produced by an economy in 1 year
4 Cross-Country Analysis of EQ-5D Data 35
other statistically significant explanatory factor that explained 26 % of the country
mean VAS ( p ¼ 0.03). While GPD showed a stronger correlation with VAS than
health expenditure, a dollar unit of health expenditure had eight times the impact of
a dollar unit of GPD on the country mean VAS scores (with coefficients of 0.0001
for GPD and 0.0008 for health expenditure). Another set of regression analyses, that
used macro data from the year of EQ-5D data collection in each country on gross
national income expressed in purchasing power parity in 2010 values, did not reach
statistically significant results. However, health care expenditure remained a statis-
tically significant factor ( p ¼ 0.03), explaining 27 % of variation in the country
mean VAS scores.
Open Access This chapter is distributed under the terms of the Creative Commons Attribution
Noncommercial License, which permits any noncommercial use, distribution, and reproduction in
any medium, provided the original author(s) and source are credited.
36 A. Szende and B. Janssen

Chapter 5
Socio-demographic Indicators Based
on EQ-5D
Agota Szende and Bas Janssen
5.1 The Use of EQ-5D in Socio-demographic Analysis
In addition to describing population norms, the EQ-5D database archive also
offered the opportunity to explore health inequalities as reported by general
populations of 18 countries. We have seen that age, and gender to a lesser extent,
played an important role in explaining EQ-5D data across individuals. A social
indicator, education, was also available in most datasets that were analysed along-
side age and gender to explain EQ-5D data.
The level of attained education is important as it represents the cultural compo-
nent of an individual’s socio-economic status, and is an indicator of living
circumstances in the earlier part of one’s life. Education level is fairly stable over
the life course of an individual. Later in life it shapes one’s occupation and expected
income potential. Through this mechanism, its indirect link with health is stronger
than its direct effect (Singh-Manoux et al. 2002).
Among the higher education groups, lower prevalence of health risk factors has
been observed. Given the existing health problems, individuals with a lower level of
education experience greater ill-health (Eachus et al. 1999). Higher education can
directly or through its vehicle mechanisms (such as being able to afford domestic
help, acquisition of home appliances, reduced workload or part-time work) enable
extra coping pathways that are not available to individuals with lower levels of
attained education (Simon 2002). Furthermore, observational studies among people
suffering from chronic conditions revealed that, through better self-management
A. Szende, M.Sc., Ph.D. (*)
Global Health Economics and Outcomes Research, Covance, Leeds, United Kingdom
e-mail: [email protected]
B. Janssen, M.Sc., Ph.D.
Medical Psychology and Psychotherapy, Erasmus MC, Rotterdam, The Netherlands
EuroQol Group, Rotterdam, The Netherlands
e-mail: [email protected]
A. Szende et al. (eds.), Self-Reported Population Health: An International Perspectivebased on EQ-5D, DOI 10.1007/978-94-007-7596-1_5, © The Author(s) 2014
37

and compliance, better treatment results can be achieved among the better-educated
(Katz 1998; Karter et al. 2000; Goldman and Smith 2002). A large body of literature
has shown that education is an important determinant of health indicators (Kunst
et al. 1995; Mackenbach et al. 1997; Regidor et al. 1999; Borrell et al. 1999; Dalstra
et al. 2002; Blakely et al. 2002; Regidor et al. 2003; von dem Knesebeck et al. 2003;
Nishi et al. 2004).
Two commonly used approaches of socio-demographic analysis of health, odds
ratios and concentration indices, were applied to the EQ-5D national surveys.
5.2 Odds Ratios Based on EQ-5D
The odds ratios for age, gender, and education are presented by country and by
EQ-5D dimension in Table 5.1. The reference population group was men aged
18–24 years with medium or high education level. The odds ratios presented for
demographic and education categories should be interpreted as relative to this
reference group.
Generally, each decade of age added substantial odds for higher reported
problems along all the EQ-5D dimensions. The only exception was anxiety/depres-
sion in the Netherlands and Sweden, where the odds decreased with age. In all other
countries, anxiety/depression had increased odds with age but among the five
dimension this dimension had the smallest odds ratio. Gender related odds ratios
generally favoured men in terms of reported problems. However, exceptions
included mobility, self-care, and usual activities in some countries. Gender related
odds ratios were highest for self-care in Korea (6.53), self-care in Greece (4.76),
and self-care in Sweden (3.06).
In most countries, attaining at least the medium level of education translated into
significantly lower age- and gender-adjusted odds of experiencing problems on any
dimension. Education had generally the highest impact in Korea and Slovenia, and
had a particularly high impact on self-care in Sweden, with an odds ratio of 11.63.
5.3 Concentration Indices Based on EQ-5D
Results of the concentration index analysis of the 17 countries are shown in
Tables 5.2, 5.3 and 5.4. Findings suggest that the level of inequalities in self-
assessed EQ VAS health and the health inequality profile by EQ-5D dimension
differed across countries. In terms of the overall level of inequalities, Korea,
Denmark, and China presented the lowest level of relative inequalities (0.090,
0.094, and 0.095 respectively) while Spain and Hungary had the highest relative
inequalities (0.173 and 0.157, respectively).
Differences were discerned in the extent to which the socio-demographic and
the quality of life factors explained overall inequalities in self-assessed health.
38 A. Szende and B. Janssen
Table 5.1 Odds ratios (95 % confidence intervals) for reporting problems on EQ-5D-3L
dimensions in 19 countries
Country Dimension Gender 95 % CI Age 95 % CI Edu 95 % CI
Belgium Mobility 1.37 0.98 1.91 1.64 1.46 1.84 1.05 0.70 1.58
Self-care 1.37 0.91 2.07 1.63 1.30 2.03 0.91 0.53 1.56
Usual activities 1.47 1.13 1.91 1.50 1.33 1.68 1.17 0.83 1.65
Pain/discomfort 1.31 1.05 1.63 1.31 1.22 1.42 1.19 0.88 1.63
Anxiety/
depression
1.63 1.04 2.55 1.05 0.93 1.20 1.04 0.60 1.82
China Mobility 1.18 0.95 1.45 1.71 1.58 1.84 1.89 1.46 2.46
Self-care 1.08 0.82 1.42 1.53 1.39 1.68 1.71 1.23 2.38
Usual activities 1.20 0.97 1.48 1.55 1.44 1.67 2.47 1.89 3.23
Pain/discomfort 1.67 1.43 1.95 1.55 1.47 1.63 1.54 1.29 1.83
Anxiety/
depression
1.19 1.01 1.40 1.23 1.17 1.30 2.36 1.95 2.86
Denmark Mobility 1.25 1.12 1.38 1.41 1.37 1.45 1.82 1.62 2.04
Self-care 1.25 1.02 1.53 1.51 1.42 1.59 1.89 1.49 2.40
Usual activities 1.48 1.36 1.61 1.28 1.25 1.31 1.62 1.48 1.76
Pain/discomfort 1.41 1.32 1.51 1.17 1.15 1.20 1.41 1.32 1.51
Anxiety/
depression
1.68 1.54 1.83 1.06 1.04 1.09 1.33 1.22 1.46
England Mobility 1.22 1.11 1.35 1.65 1.59 1.70 2.17 1.95 2.41
Self-care 1.19 1.02 1.40 1.47 1.40 1.55 2.33 1.95 2.79
Usual activities 1.28 1.16 1.41 1.47 1.43 1.52 2.04 1.82 2.27
Pain/discomfort 1.16 1.08 1.26 1.39 1.36 1.43 1.72 1.57 1.88
Anxiety/
depression
1.52 1.39 1.67 1.03 1.00 1.06 1.52 1.37 1.68
Finland Mobility 1.04 0.91 1.18 2.17 2.06 2.28 1.89 1.65 2.16
Self-care 0.96 0.80 1.15 2.24 2.08 2.41 1.78 1.46 2.17
Usual activities 1.17 1.02 1.34 1.92 1.83 2.02 1.82 1.57 2.10
Pain/discomfort 1.32 1.19 1.46 1.46 1.40 1.52 1.62 1.44 1.81
Anxiety/
depression
1.26 1.08 1.46 1.16 1.10 1.22 1.50 1.28 1.77
France Mobility 1.63 1.22 2.17 1.91 1.73 2.10 1.36 0.97 1.89
Self-care 0.94 0.59 1.49 1.68 1.43 1.99 1.51 0.86 2.65
Usual activities 1.22 0.89 1.66 1.54 1.38 1.72 1.29 0.89 1.88
Pain/discomfort 1.19 0.98 1.44 1.39 1.30 1.48 1.20 0.97 1.49
Anxiety/
depression
1.16 0.90 1.49 1.01 0.93 1.09 0.93 0.71 1.22
Germany Mobility 1.18 0.96 1.46 1.92 1.79 2.06 1.89 1.16 3.09
Self-Care 1.47 0.90 2.39 2.17 1.84 2.57 1.91 1.00 3.67
Usual activities 1.22 0.93 1.59 1.69 1.54 1.86 1.96 1.25 3.08
Pain/discomfort 1.36 1.15 1.60 1.38 1.28 1.48 1.59 0.99 2.56
Anxiety/
depression
1.43 0.98 2.07 1.04 0.90 1.19 1.79 0.82 3.91
Greece Mobility 1.34 0.71 2.53 1.93 1.54 2.42 2.13 1.06 4.29
Self-care 4.76 1.75 13.01 2.58 1.76 3.78 1.54 0.55 4.33
Usual activities 1.95 0.93 4.11 2.52 1.86 3.40 2.22 0.96 5.14
Pain/discomfort 1.83 1.04 3.20 1.59 1.32 1.92 3.03 1.62 5.68
Anxiety/
depression
1.27 0.66 2.43 1.19 0.96 1.47 3.79 1.71 8.36
(continued)
5 Socio-demographic Indicators Based on EQ-5D 39

Table 5.1 (continued)
Country Dimension Gender 95 % CI Age 95 % CI Edu 95 % CI
Hungary Mobility 1.17 1.00 1.37 1.80 1.71 1.89 2.00 1.70 2.35
Self-care 0.84 0.66 1.08 1.84 1.69 2.00 2.61 2.00 3.40
Usual activities 1.02 0.86 1.21 1.64 1.56 1.73 2.35 1.97 2.80
Pain/discomfort 1.45 1.28 1.64 1.48 1.43 1.54 1.95 1.71 2.23
Anxiety/
depression
1.71 1.51 1.93 1.24 1.20 1.29 1.98 1.74 2.26
Italy Mobility 1.44 1.15 1.79 2.25 2.07 2.45 1.78 1.30 2.43
Self-care 1.94 1.39 2.70 2.16 1.88 2.48 1.81 1.12 2.91
Usual activities 1.77 1.41 2.20 1.91 1.76 2.07 2.00 1.46 2.75
Pain/discomfort 1.74 1.50 2.02 1.53 1.46 1.60 1.47 1.24 1.75
Anxiety/
depression
2.26 1.81 2.81 1.25 1.17 1.35 1.20 0.90 1.59
Korea Mobility 2.40 1.37 4.22 1.66 1.29 2.15 3.56 1.81 7.03
Self-care 6.53 0.77 55.11 3.52 1.44 8.64 3.34 0.31 35.97
Usual activities 1.67 0.87 3.20 1.60 1.17 2.18 6.72 2.77 16.27
Pain/discomfort 1.73 1.28 2.34 1.63 1.42 1.86 2.51 1.70 3.71
Anxiety/
depression
2.05 1.51 2.80 1.31 1.14 1.49 1.42 0.93 2.16
Netherlands Mobility 1.60 1.12 2.29 1.53 1.37 1.70 1.38 0.95 2.01
Self-care 2.93 1.60 5.39 1.36 1.07 1.72 1.08 0.55 2.13
Usual activities 1.97 1.43 2.71 1.30 1.19 1.42 1.14 0.82 1.60
Pain/discomfort 1.42 1.13 1.78 1.22 1.13 1.31 1.06 0.84 1.35
Anxiety/
depression
2.12 1.08 4.15 0.80 0.63 1.01 2.41 1.07 5.46
New Zealand Mobility 1.04 0.77 1.40 1.75 1.58 1.93 1.26 0.92 1.73
Self-care 0.77 0.45 1.33 1.76 1.46 2.13 1.28 0.73 2.25
Usual activities 1.11 0.83 1.47 1.58 1.44 1.73 1.09 0.80 1.48
Pain/discomfort 1.08 0.86 1.37 1.45 1.34 1.56 1.29 0.99 1.68
Anxiety/
depression
1.43 1.08 1.89 1.11 1.02 1.21 1.27 0.94 1.71
Slovenia Mobility 0.70 0.48 1.02 1.95 1.72 2.20 4.48 2.64 7.58
Self-care 0.87 0.54 1.39 1.67 1.45 1.93 3.89 2.30 6.58
Usual activities 0.93 0.66 1.31 1.51 1.37 1.68 3.29 2.04 5.31
Pain/discomfort 1.04 0.76 1.43 1.52 1.37 1.67 2.30 1.39 3.81
Anxiety/
depression
1.13 0.83 1.54 1.16 1.06 1.27 1.66 1.06 2.59
Spain Mobility 1.61 1.30 2.00 1.91 1.78 2.06 1.46 1.10 1.96
Self-care 2.02 1.36 3.01 1.79 1.58 2.03 2.12 1.20 3.74
Usual activities 1.76 1.39 2.24 1.63 1.51 1.75 1.37 1.01 1.88
Pain/discomfort 1.71 1.43 2.05 1.34 1.28 1.41 1.41 1.15 1.73
Anxiety/
depression
1.86 1.41 2.46 1.15 1.08 1.23 1.48 1.10 2.01
Sweden Mobility 1.37 0.71 2.61 1.68 1.34 2.11 1.36 0.67 2.75
Self-care 3.06 0.60 15.69 1.39 0.83 2.32 11.63 1.24 109.0
Usual activities 0.97 0.51 1.87 1.27 1.03 1.57 1.58 0.77 3.26
Pain/discomfort 1.11 0.77 1.62 1.26 1.12 1.42 2.05 1.33 3.16
Anxiety/
depression
1.74 1.16 2.63 0.94 0.83 1.07 1.41 0.87 2.28
(continued)
40 A. Szende and B. Janssen

Socio-demographic factors explained the smallest proportion of health inequalities
in New Zealand (2.4 %), Korea (3.0 %), and Sweden (4.0 %), while they explained
higher proportions in Slovenia (27.6 %) and Hungary (24.4 %).
The five dimensions of EQ-5D were generally more powerful in explaining
overall self-assessed health. The explained proportion of the index varied from
14.6 % in Thailand to 54.3 % in Slovenia and Greece.
Within the socio-demographic variables, gender played the smallest role in
explaining overall inequalities in self-assessed health (0–21.7 %), while age was
generally the most important determinant (0–97.8 %). Education played a variable
role in explaining inequalities in each country, from 0.3 % in Belgium to 93.9 % in
Korea.
The health inequality profile according to the EQ-5D dimensions showed differ-
ent patterns across countries. Pain/discomfort and usual activities were the highest
contributors to overall inequalities in self-assessed health in most countries (n ¼ 8
and n ¼ 7, respectively). In Greece and Germany, mobility was the most important
factor among the five dimensions. The relative share of mobility was the highest in
Greece (37.5 %), while New Zealand had the highest relative share of self-care
(21.7 %). Problems with usual activities contributed with the highest relative share
in The Netherlands (48.0 %). Pain/discomfort had a particularly high relative share
in Thailand (57.2 %) and Korea (49.6 %). The relative share of anxiety/depression
was highest in China (36.4 %) in explaining overall inequalities in self-assessed
health.
Table 5.1 (continued)
Country Dimension Gender 95 % CI Age 95 % CI Edu 95 % CI
Thailanda Mobility 1.30 1.01 1.67 1.57 1.42 1.72 – – –
Self-care 0.93 0.64 1.36 1.40 1.22 1.61 – – –
Usual activities 0.97 0.75 1.24 1.22 1.11 1.34 – – –
Pain/discomfort 1.37 1.09 1.71 1.31 1.20 1.43 – – –
Anxiety/
depression
1.44 1.17 1.79 1.14 1.05 1.23 – – –
United KingdomMobility 0.90 0.75 1.09 1.65 1.56 1.76 1.68 1.37 2.06
Self-care 0.80 0.57 1.13 1.45 1.30 1.62 1.85 1.26 2.71
Usual activities 0.88 0.72 1.07 1.40 1.32 1.48 1.56 1.27 1.92
Pain/discomfort 1.02 0.87 1.19 1.39 1.33 1.46 1.77 1.50 2.09
Anxiety/
depression
1.35 1.14 1.61 1.13 1.07 1.18 1.52 1.26 1.82
United States Mobility 1.25 1.17 1.34 1.73 1.70 1.77 1.96 1.80 2.14
Self-care 1.04 0.93 1.16 1.61 1.55 1.68 2.33 2.06 2.63
Usual activities 1.43 1.35 1.52 1.54 1.51 1.57 1.84 1.69 2.01
Pain/discomfort 1.30 1.24 1.37 1.46 1.43 1.48 1.45 1.35 1.57
Anxiety/
depression
1.49 1.42 1.57 1.12 1.10 1.14 1.42 1.33 1.51
aEducation variable not available
5 Socio-demographic Indicators Based on EQ-5D 41

The decomposition analysis that combined both the socio-demographic
variables and reported problems along the five dimensions confirmed the above
findings. However, in this analysis, problems with usual activities became the
strongest contributor to overall inequalities in the majority of countries (n¼9)
followed by pain/discomfort.
Table 5.2 Health inequality profile of 17 countries by socio-demographic factors (explained
share in absolute and relative percentages)
Country
Inequality
index*
Socio-demographic factor (percentages)
Explained
share Gender Age Education
Belgium 0.126 7.9 0.2 7.7 0.0
100.0 1.9 97.8 0.3
China 0.095 21.7 0.1 12.9 8.6
100.0 0.6 59.6 39.7
Denmark 0.094 7.0 0.0 4.3 2.7
100.0 0.0 61.2 38.8
France 0.132 12.8 0.0 11.9 0.9
100.0 0.0 93.3 6.7
Germany 0.131 17.8 0.1 16.9 0.8
100.0 0.5 95.2 4.3
Greece 0.125 16.5 0.5 12.7 3.3
100.0 2.9 77.2 19.9
Hungary 0.157 24.4 0.4 19.6 4.4
100.0 1.5 80.2 18.2
Italy 0.133 19.0 0.7 17.6 0.7
100.0 3.6 92.5 3.9
Korea 0.090 3.0 0.2 0.0 2.8
100.0 6.1 0.0 93.9
Netherlands 0.104 4.7 0.4 3.7 0.6
100.0 8.8 78.1 13.0
New Zealand 0.103 2.4 0.1 2.1 0.2
100.0 2.9 86.8 10.3
Slovenia 0.136 27.6 0.3 15.9 11.4
100.0 1.1 57.7 41.2
Spain 0.173 7.5 0.5 6.7 0.4
100.0 6.4 88.8 4.9
Sweden 0.103 4.0 0.1 1.6 2.3
100.0 2.7 40.1 57.2
Thailanda 0.108 0.9 0.2 0.7 –
100.0 21.7 78.3 –
United Kingdom 0.110 9.0 0.0 5.9 3.1
100.0 0.1 65.6 34.3
United States 0.112 9.3 0.3 7.6 1.4
100.0 3.7 81.5 14.8*p<0.05 in all countriesaEducation variable is not available in Thailand
42 A. Szende and B. Janssen

Table 5.3 Health inequality profile of 17 countries by quality of life dimensions (explained share
in absolute and relative percentages)
Country
Inequality
index*
Quality of life factors (percentages)
Explained
share Mobility
Self-
care
Usual
activities
Pain/
discomfort
Anxiety/
depression
Belgium 0.126 24.9 5.2 3.5 8.2 4.7 3.4
100.0 20.9 13.9 32.9 18.8 13.5
China 0.095 24.4 3.1 0.2 2.8 9.5 8.9
100.0 12.5 0.8 11.4 38.9 36.4
Denmark 0.094 36.5 7.0 2.6 12.7 8.4 5.8
100.0 19.3 7.2 34.7 23.0 15.8
France 0.132 24.2 5.4 3.0 4.6 7.4 3.7
100.0 22.5 12.5 19.1 30.5 15.4
Germany 0.131 34.6 11.3 1.6 9.1 9.3 3.3
100.0 32.8 4.6 26.4 26.8 9.4
Greece 0.125 54.3 20.4 0.2 16.5 11.7 5.6
100.0 37.5 0.4 30.3 21.5 10.3
Hungary 0.157 46.3 9.0 2.9 6.8 18.3 9.3
100.0 19.5 6.3 14.7 39.5 20.0
Italy 0.133 35.2 7.7 2.7 9.2 10.8 4.8
100.0 21.8 7.6 26.2 30.7 13.7
Korea 0.090 16.8 0.3 0.3 2.8 8.3 5.1
100.0 1.8 2.0 16.6 49.6 30.1
Netherlands 0.104 30.7 6.5 0.4 14.7 8.3 0.9
100.0 21.1 1.2 48.0 26.9 2.8
New Zealand 0.103 37.4 7.3 8.1 10.6 5.0 6.4
100.0 19.5 21.7 28.3 13.4 17.2
Slovenia 0.136 54.3 13.0 9.3 14.6 11.9 5.5
100.0 24.0 17.1 26.8 21.9 10.1
Spain 0.173 21.5 5.1 0.6 5.5 7.7 2.7
100.0 23.5 2.9 25.5 35.7 12.5
Sweden 0.103 43.9 2.6 2.6 9.6 16.6 12.6
100.0 5.9 5.9 21.8 37.7 28.6
Thailand 0.108 14.6 1.5 0.0 2.2 8.4 2.7
100.0 10.2 0.0 15.1 57.2 18.5
United
Kingdom
0.110 35.0 7.1 1.6 9.7 9.6 7.0
100.0 20.3 4.5 27.7 27.4 20.1
United States 0.112 42.6 8.2 4.3 13.8 7.8 8.5
100.0 19.3 10.1 32.5 18.2 19.9*p<0.05 in all countries
5 Socio-demographic Indicators Based on EQ-5D 43

Table
5.4
Healthinequalityprofile
of17countriesbysocio-dem
ographic
andqualityoflife
dim
ensions(explained
sharein
absolute
andrelative
percentages)
Inequalityindex
*Explained
share
Gender
Age
Education
Mobility
Self-care
Usual
activities
Pain/discomfort
Anxiety/
depression
Belgium
0.126
26.8
0.0
3.8
0.0
4.3
3.4
7.8
4.2
3.4
100.0
0.0
14.0
0.0
16.1
12.6
29.0
15.5
12.7
China
0.095
36.6
0.1
11.5
4.1
2.3
0.2
2.4
7.4
8.6
100.0
0.3
31.3
11.3
6.2
0.7
6.5
20.3
23.4
Denmark
0.094
38.4
0.1
1.6
1.7
7.1
2.4
12.0
8.1
5.5
100.0
0.1
4.2
4.3
18.5
6.3
31.1
21.1
14.4
France
0.132
28.6
0.0
7.0
0.7
3.5
2.9
4.5
6.1
4.0
100.0
0.0
24.5
2.4
12.1
10.0
15.7
21.4
13.8
Germany
0.131
39.4
0.0
9.0
0.3
8.3
1.3
8.7
8.5
3.4
100.0
0.0
22.9
0.7
21.1
3.2
22.0
21.4
8.7
Greece
0.126
55.2
0.1
2.6
0.3
20.4
0.0
15.4
10.4
6.0
100.0
0.1
4.7
0.5
37.1
0.0
27.9
18.9
10.8
Hungary
0.157
50.6
0.0
9.4
1.2
6.6
2.4
5.9
15.8
9.2
100.0
0.0
18.7
2.3
13.1
4.8
11.8
31.3
18.1
Italy
0.133
38.8
0.0
8.0
0.1
5.6
2.5
8.7
9.1
4.8
100.0
0.0
20.5
0.2
14.5
6.4
22.4
23.5
12.4
Korea
0.090
19.3
0.0
0.0
1.5
0.4
0.4
2.7
9.0
5.3
100.0
0.0
0.0
7.9
2.1
2.0
14.0
46.6
27.4
Netherlands
0.104
31.4
0.0
1.4
0.4
5.7
0.4
14.7
8.0
0.9
100.0
0.0
4.4
1.2
18.2
1.2
46.7
25.4
2.8
New
Zealand
0.103
38.9
0.1
0.0
0.1
8.1
8.1
10.6
5.3
6.5
100.0
0.2
0.0
0.3
20.8
20.9
27.3
13.8
16.8
Slovenia
0.136
57.7
0.3
4.1
6.2
8.8
7.4
13.9
11.3
5.7
100.0
0.5
7.2
10.7
15.3
12.7
24.2
19.6
9.9
Spain
0.173
22.8
0.1
2.8
0.1
4.0
0.6
5.2
7.2
2.7
100.0
0.6
12.4
0.6
17.5
2.5
22.9
31.6
12.0
44 A. Szende and B. Janssen
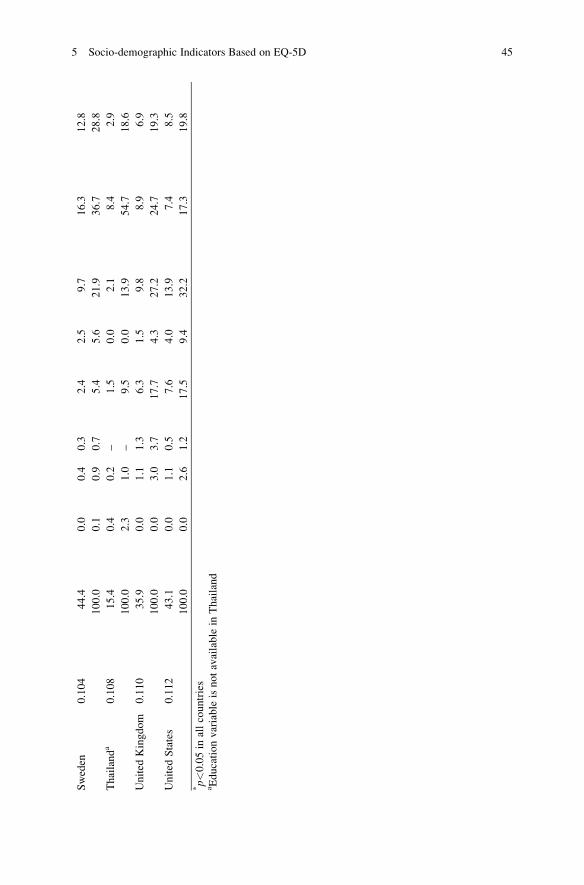
Sweden
0.104
44.4
0.0
0.4
0.3
2.4
2.5
9.7
16.3
12.8
100.0
0.1
0.9
0.7
5.4
5.6
21.9
36.7
28.8
Thailanda
0.108
15.4
0.4
0.2
–1.5
0.0
2.1
8.4
2.9
100.0
2.3
1.0
–9.5
0.0
13.9
54.7
18.6
United
Kingdom
0.110
35.9
0.0
1.1
1.3
6.3
1.5
9.8
8.9
6.9
100.0
0.0
3.0
3.7
17.7
4.3
27.2
24.7
19.3
United
States
0.112
43.1
0.0
1.1
0.5
7.6
4.0
13.9
7.4
8.5
100.0
0.0
2.6
1.2
17.5
9.4
32.2
17.3
19.8
*p<0.05in
allcountries
aEducationvariable
isnotavailable
inThailand
5 Socio-demographic Indicators Based on EQ-5D 45

5.4 Conclusions
Evidence from these analyses shows that inequalities in self-reported health
measured by the EQ-5D exist across many countries despite different demographic,
economic and cultural characteristics. The individual health inequality profile of
each country deserves the attention of policy makers to promote greater equity.
Both the analysis of odds ratios and concentration indices showed that age is the
most important overall predictor of experiencing lower EQ VAS and problems on
mobility, self-care, usual activities, and pain/discomfort in all countries. Gender
does play an additional role, although its role is much smaller. Having attained at
least a medium level of education, adjusted for age and gender, translated into lower
odds of reporting problems on any dimension of EQ-5D in almost all surveyed
countries. However, this relationship seemed to possess some country-specific traits
that deserve the attention of policy makers.
In addition, the decomposition analysis of the concentration index provided a
unique insight into the role of each individual EQ-5D dimension in explaining
overall inequalities in EQ VAS. This analysis, in particular, highlighted the wide-
spread importance of problems with pain/discomfort and usual activities in
explaining inequalities in overall self-assessed health.
Finally, it has to be noted that the above results should not be used for ranking
countries based on health inequality among their populations. Neither was the
analysis designed to account for potential differences in demographic or other
sample characteristics across countries. Each country should consider the results
within the light of their own social and health care context. Further data collection
and research by population subgroups that were not included in this study – such as
social, ethnic, or patient groups – could help prioritize and further refine inequality
reduction programs.
Another limitation of this study derives from the simple, generic nature of the
EQ-5D questionnaire. The domains described by the EQ-5D-3L are generic and
response options are limited to three levels. While these characteristics make the
EQ-5D feasible to administer in large population surveys, they also lead to some
limitations in interpreting results. For example, it is not possible to determine what
proportion of reported pain related to acute, sub-acute, or chronic pain, or what
were the key types of usual activities people had problem with. Targeted research
along each important quality of life domain could further help understand in-depth
characteristics of inequalities and identify strategies to tackle them efficiently.
Open Access This chapter is distributed under the terms of the Creative Commons Attribution
Noncommercial License, which permits any noncommercial use, distribution, and reproduction in
any medium, provided the original author(s) and source are credited.
46 A. Szende and B. Janssen
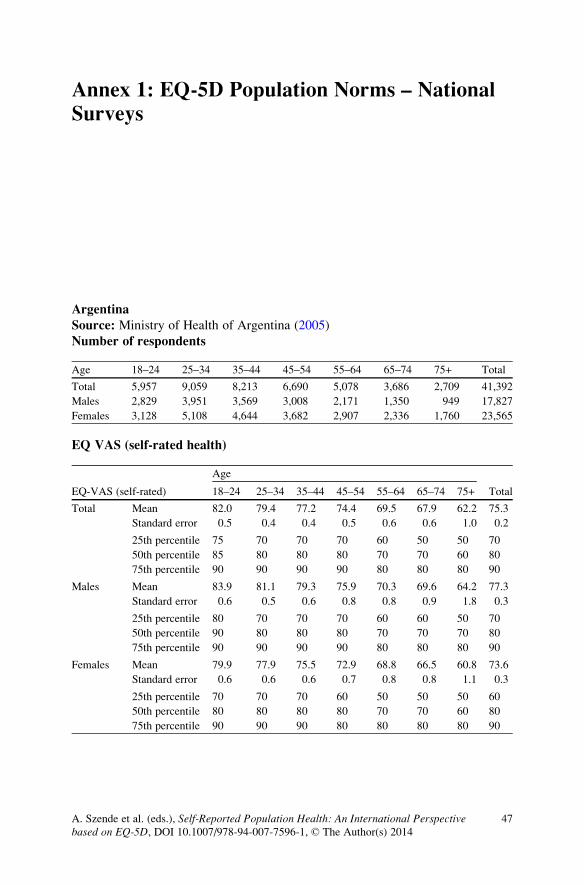
Annex 1: EQ-5D Population Norms – National
Surveys
Argentina
Source: Ministry of Health of Argentina (2005)
Number of respondents
Age 18–24 25–34 35–44 45–54 55–64 65–74 75+ Total
Total 5,957 9,059 8,213 6,690 5,078 3,686 2,709 41,392
Males 2,829 3,951 3,569 3,008 2,171 1,350 949 17,827
Females 3,128 5,108 4,644 3,682 2,907 2,336 1,760 23,565
EQ VAS (self-rated health)
EQ-VAS (self-rated)
Age
Total18–24 25–34 35–44 45–54 55–64 65–74 75+
Total Mean 82.0 79.4 77.2 74.4 69.5 67.9 62.2 75.3
Standard error 0.5 0.4 0.4 0.5 0.6 0.6 1.0 0.2
25th percentile 75 70 70 70 60 50 50 70
50th percentile 85 80 80 80 70 70 60 80
75th percentile 90 90 90 90 80 80 80 90
Males Mean 83.9 81.1 79.3 75.9 70.3 69.6 64.2 77.3
Standard error 0.6 0.5 0.6 0.8 0.8 0.9 1.8 0.3
25th percentile 80 70 70 70 60 60 50 70
50th percentile 90 80 80 80 70 70 70 80
75th percentile 90 90 90 90 80 80 80 90
Females Mean 79.9 77.9 75.5 72.9 68.8 66.5 60.8 73.6
Standard error 0.6 0.6 0.6 0.7 0.8 0.8 1.1 0.3
25th percentile 70 70 70 60 50 50 50 60
50th percentile 80 80 80 80 70 70 60 80
75th percentile 90 90 90 80 80 80 80 90
A. Szende et al. (eds.), Self-Reported Population Health: An International Perspectivebased on EQ-5D, DOI 10.1007/978-94-007-7596-1, © The Author(s) 2014
47

Problemsreported
bydim
ension(raw
numbers,weightedproportions)
Age
Total
18–24
25–34
35–44
45–54
55–64
65–74
75+
n%
n%
n%
n%
n%
n%
n%
Mobility
Noproblems
5,800
97.3
8,743
96.6
7,715
94.6
5,960
90.9
4,084
82.5
2,592
74.0
1,486
56.5
Someproblems
142
2.6
303
3.3
477
5.2
709
8.9
969
17.2
1,051
24.8
1,140
40.8
Confined
tobed
15
0.2
13
0.1
21
0.3
21
0.2
25
0.4
43
1.3
83
2.7
Self-care
Noproblems
5,917
98.8
8,996
99.1
8,130
98.3
6,557
98.4
4,892
97.1
3,409
93.4
2,234
83.6
Someproblems
30
1.1
50
0.8
71
1.6
117
1.5
174
2.8
251
5.1
382
13.5
Unable
to10
0.1
13
0.0
12
0.1
16
0.1
12
0.1
26
1.4
93
2.9
Usual
activities
Noproblems
5,794
97.4
8,769
96.6
7,775
95.6
6,103
93.8
4,359
87.8
2,965
82.2
1,769
68.0
Someproblems
153
2.6
278
3.1
416
4.2
565
6.0
677
11.6
651
15.9
770
27.0
Unable
to10
0.1
12
0.3
22
0.2
22
0.2
42
0.5
70
2.0
170
4.9
Pain/discomfort
No
4,804
83.0
6,996
78.0
5,797
71.1
4,161
65.6
2,843
60.7
1,804
53.3
1,064
41.9
Some
1,076
16.1
1,890
19.7
2,150
26.2
2,176
29.3
1,873
34.5
1,565
39.5
1,305
45.0
Extrem
e77
0.9
173
2.4
266
2.7
353
5.0
362
4.8
317
7.2
340
13.2
Anxiety/depression
No
4,922
83.2
7,288
79.9
6,238
76.4
4,929
74.8
3,668
74.5
2,623
73.8
1,882
69.4
Some
918
14.9
1,545
17.9
1,726
20.9
1,503
22.0
1,150
20.8
879
21.8
680
25.2
Extrem
e117
1.9
226
2.3
249
2.7
258
3.1
260
4.7
184
4.4
147
5.3
48 Annex 1: EQ-5D Population Norms – National Surveys

Age
Males
18–24
25–34
35–44
45–54
55–64
65–74
75+
n%
n%
n%
n%
n%
n%
n%
Mobility
Noproblems
2,757
97.5
3,817
97.0
3,399
95.4
2,773
92.5
1,826
84.9
992
78.4
574
65.2
Someproblems
65
2.4
130
3.0
161
4.5
230
7.4
336
14.9
339
20.4
354
32.8
Confined
tobed
70.1
40.1
90.1
50.1
90.2
19
1.2
21
2.0
Self-care
Noproblems
2,812
99.2
3,922
99.3
3,537
99.2
2,965
98.2
2,103
97.4
1,262
93.1
821
86.9
Someproblems
12
0.8
21
0.7
28
0.8
36
1.7
61
2.5
77
4.9
98
10.4
Unable
to5
0.1
80.0
40.1
70.1
70.1
11
1.9
30
2.7
Usual
activities
Noproblems
2,750
97.5
3,845
96.9
3,433
96.6
2,854
95.8
1,919
89.6
1,121
85.8
694
78.9
Someproblems
72
2.4
98
3.0
128
3.3
144
4.0
235
10.1
204
12.4
208
17.0
Unable
to7
0.1
80.1
80.1
10
0.2
17
0.3
25
1.8
47
4.1
Pain/discomfort
No
2,405
87.0
3,230
81.0
2,781
78.0
2,085
70.5
1,380
65.5
774
61.1
433
48.3
Some
406
12.6
672
17.5
715
19.9
823
24.7
673
31.1
490
32.4
420
40.3
Extrem
e18
0.4
49
1.5
73
2.1
100
4.8
118
3.4
86
6.5
96
11.4
Anxiety/depression
No
2,420
85.8
3,347
82.4
2,927
82.2
2,397
79.8
1,663
76.9
1,034
76.9
714
74.6
Some
371
12.9
535
15.7
590
16.4
536
18.0
425
18.4
276
20.6
202
21.2
Extrem
e38
1.4
69
1.8
52
1.5
75
2.3
83
4.7
40
2.4
33
4.2
(continued)
Annex 1: EQ-5D Population Norms – National Surveys 49

Age
Fem
ales
18–24
25–34
35–44
45–54
55–64
65–74
75+
n%
n%
n%
n%
n%
n%
n%
Mobility
Noproblems
3,043
96.9
4,926
96.3
4,316
93.9
3,187
89.4
2,258
80.2
1,600
70.6
912
50.7
Someproblems
77
2.8
173
3.6
316
5.8
479
10.3
633
19.3
712
28.1
786
46.1
Confined
tobed
80.3
90.2
12
0.4
16
0.4
16
0.5
24
1.3
62
3.2
Self-care
Noproblems
3,105
98.5
5,074
99.0
4,593
97.5
3,592
98.7
2,789
96.7
2,147
93.7
1,413
81.4
Someproblems
18
1.5
29
1.0
43
2.3
81
1.3
113
3.2
174
5.3
284
15.6
Unable
to5
0.0
50.0
80.2
90.1
50.1
15
1.0
63
3.1
Usual
activities
Noproblems
3,044
97.2
4,924
96.3
4,342
94.7
3,249
91.8
2,440
86.1
1,844
79.5
1,075
60.7
Someproblems
81
2.8
180
3.2
288
5.0
421
8.0
442
13.2
447
18.5
562
33.8
Unable
to3
0.0
40.5
14
0.3
12
0.2
25
0.7
45
2.1
123
5.5
Pain/discomfort
No
2,399
78.6
3,766
75.4
3,016
65.2
2,076
60.9
1,463
56.0
1,030
47.2
631
37.5
Some
670
20.1
1,218
21.6
1,435
31.6
1,353
33.8
1,200
37.9
1,075
45.0
885
48.1
Extrem
e59
1.4
124
3.1
193
3.2
253
5.3
244
6.1
231
7.8
244
14.4
Anxiety/depression
No
2,502
80.3
3,941
77.7
3,311
71.5
2,532
70.0
2,005
72.2
1,589
71.4
1,168
66.0
Some
547
17.2
1,010
19.7
1,136
24.7
967
26.0
725
23.0
603
22.7
478
28.0
Extrem
e79
2.5
157
2.6
197
3.8
183
4.0
177
4.8
144
5.9
114
6.1
(continued)
50 Annex 1: EQ-5D Population Norms – National Surveys
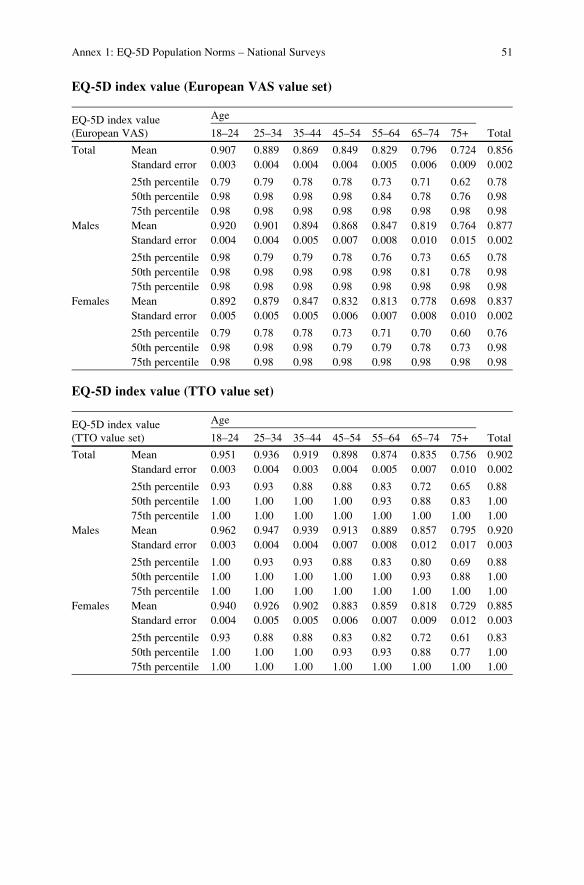
EQ-5D index value (European VAS value set)
EQ-5D index value
(European VAS)
Age
Total18–24 25–34 35–44 45–54 55–64 65–74 75+
Total Mean 0.907 0.889 0.869 0.849 0.829 0.796 0.724 0.856
Standard error 0.003 0.004 0.004 0.004 0.005 0.006 0.009 0.002
25th percentile 0.79 0.79 0.78 0.78 0.73 0.71 0.62 0.78
50th percentile 0.98 0.98 0.98 0.98 0.84 0.78 0.76 0.98
75th percentile 0.98 0.98 0.98 0.98 0.98 0.98 0.98 0.98
Males Mean 0.920 0.901 0.894 0.868 0.847 0.819 0.764 0.877
Standard error 0.004 0.004 0.005 0.007 0.008 0.010 0.015 0.002
25th percentile 0.98 0.79 0.79 0.78 0.76 0.73 0.65 0.78
50th percentile 0.98 0.98 0.98 0.98 0.98 0.81 0.78 0.98
75th percentile 0.98 0.98 0.98 0.98 0.98 0.98 0.98 0.98
Females Mean 0.892 0.879 0.847 0.832 0.813 0.778 0.698 0.837
Standard error 0.005 0.005 0.005 0.006 0.007 0.008 0.010 0.002
25th percentile 0.79 0.78 0.78 0.73 0.71 0.70 0.60 0.76
50th percentile 0.98 0.98 0.98 0.79 0.79 0.78 0.73 0.98
75th percentile 0.98 0.98 0.98 0.98 0.98 0.98 0.98 0.98
EQ-5D index value (TTO value set)
EQ-5D index value
(TTO value set)
Age
Total18–24 25–34 35–44 45–54 55–64 65–74 75+
Total Mean 0.951 0.936 0.919 0.898 0.874 0.835 0.756 0.902
Standard error 0.003 0.004 0.003 0.004 0.005 0.007 0.010 0.002
25th percentile 0.93 0.93 0.88 0.88 0.83 0.72 0.65 0.88
50th percentile 1.00 1.00 1.00 1.00 0.93 0.88 0.83 1.00
75th percentile 1.00 1.00 1.00 1.00 1.00 1.00 1.00 1.00
Males Mean 0.962 0.947 0.939 0.913 0.889 0.857 0.795 0.920
Standard error 0.003 0.004 0.004 0.007 0.008 0.012 0.017 0.003
25th percentile 1.00 0.93 0.93 0.88 0.83 0.80 0.69 0.88
50th percentile 1.00 1.00 1.00 1.00 1.00 0.93 0.88 1.00
75th percentile 1.00 1.00 1.00 1.00 1.00 1.00 1.00 1.00
Females Mean 0.940 0.926 0.902 0.883 0.859 0.818 0.729 0.885
Standard error 0.004 0.005 0.005 0.006 0.007 0.009 0.012 0.003
25th percentile 0.93 0.88 0.88 0.83 0.82 0.72 0.61 0.83
50th percentile 1.00 1.00 1.00 0.93 0.93 0.88 0.77 1.00
75th percentile 1.00 1.00 1.00 1.00 1.00 1.00 1.00 1.00
Annex 1: EQ-5D Population Norms – National Surveys 51

EQ-5D index value (VAS value set)
EQ-5D index value
(VAS value set)
Age
Total18–24 25–34 35–44 45–54 55–64 65–74 75+
Total Mean 0.928 0.911 0.888 0.867 0.837 0.793 0.712 0.871
Standard error 0.003 0.004 0.004 0.005 0.006 0.008 0.010 0.002
25th percentile 0.84 0.84 0.81 0.81 0.72 0.62 0.51 0.81
50th percentile 1.00 1.00 1.00 1.00 0.84 0.81 0.72 1.00
75th percentile 1.00 1.00 1.00 1.00 1.00 1.00 1.00 1.00
Males Mean 0.941 0.923 0.913 0.887 0.856 0.819 0.761 0.893
Standard error 0.004 0.005 0.005 0.007 0.009 0.012 0.016 0.003
25th percentile 1.00 0.84 0.84 0.81 0.72 0.66 0.57 0.81
50th percentile 1.00 1.00 1.00 1.00 1.00 0.84 0.81 1.00
75th percentile 1.00 1.00 1.00 1.00 1.00 1.00 1.00 1.00
Females Mean 0.914 0.900 0.866 0.846 0.819 0.772 0.679 0.850
Standard error 0.005 0.005 0.006 0.006 0.008 0.009 0.011 0.003
25th percentile 0.84 0.81 0.81 0.72 0.72 0.61 0.50 0.72
50th percentile 1.00 1.00 1.00 0.84 0.84 0.81 0.65 1.00
75th percentile 1.00 1.00 1.00 1.00 1.00 1.00 0.84 1.00
52 Annex 1: EQ-5D Population Norms – National Surveys

Belgium
Source: ESEMeD; Konig et al. (2009)
Number of respondents
Age 18–24 25–34 35–44 45–54 55–64 65–74 75+ Total
Total 165 405 560 433 349 302 197 2,411
Males 74 205 283 215 179 145 87 1,188
Females 91 200 277 218 170 157 110 1,223
EQ VAS (self-rated health)
EQ-VAS (self-rated)
Age
Total18–24 25–34 35–44 45–54 55–64 65–74 75+
Total Mean 84.0 82.0 80.2 77.2 74.2 71.3 69.4 77.6
Standard error 1.0 1.2 1.2 1.4 1.6 1.3 1.7 0.5
25th percentile 80 80 80 70 70 65 60 70
50th percentile 85 85 85 80 80 75 75 80
75th percentile 90 95 90 90 90 85 80 90
Males Mean 84.3 81.6 81.7 78.8 75.8 70.6 69.2 78.6
Standard error 1.2 1.9 1.5 2.0 2.2 1.9 2.8 0.8
25th percentile 80 80 80 75 70 65 60 70
50th percentile 85 85 85 80 80 75 75 80
75th percentile 90 90 90 90 90 85 80 90
Females Mean 83.7 82.5 78.7 75.4 72.4 71.7 69.6 76.7
Standard error 1.7 1.5 1.9 2.0 2.3 1.8 2.1 0.8
25th percentile 80 80 75 70 70 65 60 70
50th percentile 87 88 85 80 80 75 70 80
75th percentile 95 95 90 90 90 80 80 90
Annex 1: EQ-5D Population Norms – National Surveys 53

Problemsreported
bydim
ension(raw
numbers,weightedproportions)
Age
Total
18–24
25–34
35–44
45–54
55–64
65–74
75+
n%
n%
n%
n%
n%
n%
n%
Mobility
Noproblems
157
95.1
384
95.1
526
94.1
380
87.1
300
86.3
234
76.0
124
55.5
Someproblems
84.9
20
4.0
31
5.5
50
12.5
49
13.7
67
23.9
71
43.4
Confined
tobed
00.0
10.9
30.5
30.4
00.0
10.1
21.1
Self-care
Noproblems
163
99.4
396
97.7
549
98.5
416
94.4
336
97.0
285
93.4
163
81.5
Someproblems
20.6
71.4
91.3
16
5.5
13
3.0
15
6.2
28
15.8
Unable
to0
0.0
21.0
20.3
10.1
00.0
20.5
62.7
Usual
activities
Noproblems
161
96.5
381
94.6
518
92.6
373
85.2
309
88.7
242
79.3
128
62.7
Someproblems
43.5
20
4.7
37
6.7
54
14.1
38
10.7
56
19.4
52
28.0
Unable
to0
0.0
40.7
50.7
60.7
20.6
41.2
17
9.4
Pain/discomfort
No
140
87.7
325
78.3
434
78.1
298
68.1
229
64.1
193
57.8
106
49.1
Some
24
12.0
75
20.1
117
20.4
119
29.3
113
33.0
102
40.7
82
45.4
Extrem
e1
0.4
51.6
91.5
16
2.6
72.9
71.6
95.5
Anxiety/depression
No
160
96.6
378
93.9
526
93.2
401
93.4
325
93.8
278
91.9
185
94.1
Some
53.4
22
5.4
27
5.1
27
5.8
20
5.3
21
7.0
11
5.1
Extrem
e0
0.0
50.7
71.7
50.8
40.9
31.0
10.8
54 Annex 1: EQ-5D Population Norms – National Surveys

Age
Males
18–24
25–34
35–44
45–54
55–64
65–74
75+
n%
n%
n%
n%
n%
n%
n%
Mobility
Noproblems
68
91.4
202
97.7
269
94.6
190
89.0
159
90.5
115
75.0
63
64.7
Someproblems
68.6
20.6
12
4.8
22
10.2
20
9.5
29
24.7
24
35.3
Confined
tobed
00.0
11.6
20.6
30.7
00.0
10.3
00.0
Self-care
Noproblems
73
99.1
202
97.8
276
98.0
204
93.9
174
97.4
139
94.6
79
90.4
Someproblems
10.9
10.3
51.4
10
5.8
52.6
65.4
78.3
Unable
to0
0.0
21.8
20.6
10.3
00.0
00.0
11.2
Usual
activities
Noproblems
73
97.4
196
95.7
263
93.1
190
87.0
158
88.6
124
81.7
67
77.0
Someproblems
12.6
84.1
15
5.4
22
12.3
19
10.3
18
15.8
14
16.4
Unable
to0
0.0
10.2
51.4
30.6
21.1
32.5
66.5
Pain/discomfort
No
61
82.6
170
79.9
218
78.5
156
74.1
125
68.1
99
61.0
56
64.5
Some
12
16.7
34
18.4
61
20.1
50
24.0
50
28.3
43
37.5
29
33.3
Extrem
e1
0.7
11.6
41.4
91.9
43.6
31.5
22.2
Anxiety/depression
No
70
94.7
193
94.6
270
95.1
208
97.8
164
92.9
138
95.4
83
95.1
Some
45.3
94.5
92.8
62.0
14
6.8
74.6
44.9
Extrem
e0
0.0
30.9
42.0
10.2
10.3
00.0
00.0
(continued)
Annex 1: EQ-5D Population Norms – National Surveys 55

Age
Fem
ales
18–24
25–34
35–44
45–54
55–64
65–74
75+
n%
n%
n%
n%
n%
n%
n%
Mobility
Noproblems
89
99.0
182
92.2
257
93.6
190
85.1
141
81.3
119
76.7
61
49.4
Someproblems
21.0
18
7.8
19
6.1
28
14.9
29
18.7
38
23.3
47
48.8
Confined
tobed
00.0
00.0
10.3
00.0
00.0
00.0
21.8
Self-care
Noproblems
90
99.6
194
97.5
273
98.9
212
94.9
162
96.5
146
92.4
84
75.6
Someproblems
10.4
62.5
41.1
65.1
83.5
96.7
21
20.7
Unable
to0
0.0
00.0
00.0
00.0
00.0
20.8
53.7
Usual
activities
Noproblems
88
95.6
185
93.3
255
92.2
183
83.2
151
88.9
118
77.7
61
53.3
Someproblems
34.4
12
5.5
22
7.8
32
16.0
19
11.1
38
22.0
38
35.5
Unable
to0
0.0
31.2
00.0
30.8
00.0
10.3
11
11.2
Pain/discomfort
No
79
93.2
155
76.6
216
77.7
142
61.8
104
59.4
94
55.4
50
39.1
Some
12
6.8
41
21.9
56
20.7
69
34.9
63
38.5
59
43.0
53
53.4
Extrem
e0
0.0
41.5
51.6
73.3
32.1
41.6
77.6
Anxiety/depression
No
90
98.6
185
93.1
256
91.4
193
88.7
161
94.8
140
89.4
102
93.5
Some
11.4
13
6.4
18
7.2
21
9.9
63.6
14
8.8
75.2
Extrem
e0
0.0
20.6
31.4
41.5
31.6
31.8
11.3
(continued)
56 Annex 1: EQ-5D Population Norms – National Surveys

EQ-5D index value (European VAS value set)
EQ-5D index value
(European VAS)
Age
Total18–24 25–34 35–44 45–54 55–64 65–74 75+
Total Mean 0.953 0.921 0.920 0.889 0.881 0.848 0.761 0.891
Standard error 0.008 0.010 0.007 0.010 0.011 0.011 0.020 0.004
25th percentile 1.00 0.78 0.78 0.78 0.78 0.71 0.66 0.78
50th percentile 1.00 1.00 1.00 1.00 1.00 0.85 0.78 1.00
75th percentile 1.00 1.00 1.00 1.00 1.00 1.00 1.00 1.00
Males Mean 0.933 0.925 0.921 0.912 0.890 0.862 0.834 0.905
Standard error 0.014 0.017 0.010 0.013 0.016 0.017 0.024 0.006
25th percentile 0.81 0.85 0.81 0.78 0.78 0.75 0.71 0.78
50th percentile 1.00 1.00 1.00 1.00 1.00 1.00 1.00 1.00
75th percentile 1.00 1.00 1.00 1.00 1.00 1.00 1.00 1.00
Females Mean 0.976 0.918 0.919 0.864 0.871 0.838 0.714 0.878
Standard error 0.007 0.011 0.010 0.015 0.015 0.015 0.027 0.006
25th percentile 1.00 0.78 0.78 0.75 0.78 0.71 0.57 0.78
50th percentile 1.00 1.00 1.00 1.00 1.00 0.78 0.78 1.00
75th percentile 1.00 1.00 1.00 1.00 1.00 1.00 1.00 1.00
EQ-5D index value (VAS value set)
EQ-5D index value
(VAS value set)
Age
Total18–24 25–34 35–44 45–54 55–64 65–74 75+
Total Mean 0.949 0.915 0.912 0.881 0.871 0.836 0.748 0.883
Standard error 0.009 0.011 0.008 0.011 0.012 0.012 0.020 0.005
25th percentile 1.00 0.76 0.76 0.76 0.76 0.69 0.66 0.76
50th percentile 1.00 1.00 1.00 1.00 1.00 0.82 0.76 1.00
75th percentile 1.00 1.00 1.00 1.00 1.00 1.00 1.00 1.00
Males Mean 0.926 0.918 0.913 0.907 0.881 0.852 0.823 0.897
Standard error 0.016 0.018 0.012 0.014 0.017 0.018 0.025 0.006
25th percentile 0.77 0.82 0.77 0.76 0.76 0.73 0.69 0.76
50th percentile 1.00 1.00 1.00 1.00 1.00 1.00 1.00 1.00
75th percentile 1.00 1.00 1.00 1.00 1.00 1.00 1.00 1.00
Females Mean 0.973 0.911 0.911 0.853 0.860 0.825 0.699 0.869
Standard error 0.008 0.012 0.011 0.016 0.017 0.016 0.027 0.006
25th percentile 1.00 0.76 0.76 0.73 0.76 0.69 0.58 0.76
50th percentile 1.00 1.00 1.00 1.00 1.00 0.77 0.74 1.00
75th percentile 1.00 1.00 1.00 1.00 1.00 1.00 1.00 1.00
Annex 1: EQ-5D Population Norms – National Surveys 57

China
Source: Household Health Survey (2010), Sun et al. (2011)
Number of respondents
Age 18–24 25–34 35–44 45–54 55–64 65–74 75+ Total
Total 1,095 958 1,782 1,491 1,401 884 420 8,031
Males 549 450 853 721 675 444 184 3,876
Females 546 508 929 770 726 440 236 4,155
EQ VAS (self-rated health)
EQ-VAS (self-rated)
Age
Total18–24 25–34 35–44 45–54 55–64 65–74 75+
Total Mean 89.1 85.7 82.7 79.4 76.5 72.2 69.4 80.4
Standard error 0.3 0.4 0.3 0.3 0.4 0.5 0.8 0.2
25th percentile 80 80 80 70 70 60 60 73
50th percentile 90 90 90 80 80 75 70 84
75th percentile 100 90 90 90 90 80 80 90
Males Mean 89.3 86.1 83.1 80.7 77.8 73.1 72.0 81.3
Standard error 0.5 0.6 0.4 0.5 0.5 0.7 1.1 0.2
25th percentile 85 80 80 75 70 65 60 75
50th percentile 90 90 90 80 80 80 70 84
75th percentile 100 90 90 90 90 80 80 90
Females Mean 88.9 85.4 82.4 78.2 75.3 71.3 67.4 79.6
Standard error 0.4 0.5 0.4 0.5 0.5 0.7 1.1 0.2
25th percentile 80 80 80 70 70 60 60 73
50th percentile 90 90 85 80 80 70 70 82
75th percentile 98 90 90 90 85 80 80 89
58 Annex 1: EQ-5D Population Norms – National Surveys

Problemsreported
bydim
ension
Age
Total
18–24
25–34
35–44
45–54
55–64
65–74
75+
n%
n%
n%
n%
n%
n%
n%
Mobility
Noproblems
1,084
99.0
942
98.3
1,737
97.5
1,448
97.0
1,310
93.5
783
88.6
316
75.3
Someproblems
10
0.9
14
1.5
41
2.3
42
2.8
87
6.2
94
10.6
95
22.6
Confined
tobed
10.1
20.2
40.2
30.2
40.3
70.8
92.1
Self-care
Noproblems
1,076
98.2
949
99.1
1,761
98.8
1,464
98.2
1,358
97.0
832
94.1
362
86.2
Someproblems
18
1.6
70.7
18
1.0
24
1.6
36
2.6
46
5.2
48
11.4
Unable
to2
0.2
20.2
40.2
30.2
60.4
60.7
10
2.4
Usual
activities
Noproblems
1,080
98.6
940
98.1
1,736
97.4
1,439
96.4
1,306
93.2
799
90.4
319
75.9
Someproblems
13
1.2
16
1.7
39
2.2
49
3.3
85
6.1
68
7.7
75
17.9
Unable
to2
0.2
20.2
70.4
40.3
10
0.7
17
1.9
26
6.2
Pain/discomfort
No
1,073
98.0
919
95.9
1,688
94.7
1,331
89.3
1,170
83.5
698
79.0
296
70.5
Some
22
2.0
37
3.9
89
5.0
155
10.4
224
16.0
176
19.9
119
28.3
Extrem
e0
0.0
20.2
50.3
40.3
70.5
10
1.1
51.2
Anxiety/depression
No
1,064
97.2
908
94.8
1,657
93.1
1,370
91.8
1,238
88.4
754
85.3
338
80.5
Some
30
2.7
45
4.7
119
6.7
115
7.7
156
11.1
120
13.6
77
18.3
Extrem
e1
0.1
50.5
40.2
70.5
70.5
10
1.1
51.2
(continued)
Annex 1: EQ-5D Population Norms – National Surveys 59

Age
Males
18–24
25–34
35–44
45–54
55–64
65–74
75+
n%
n%
n%
n%
n%
n%
n%
Mobility
Noproblems
544
99.1
440
97.8
834
97.8
703
97.5
632
93.6
409
92.1
141
76.6
Someproblems
40.7
81.8
17
2.0
17
2.4
41
6.1
32
7.2
43
23.4
Confined
tobed
10.2
20.4
20.2
10.1
20.3
30.7
00.0
Self-care
Noproblems
540
98.3
445
98.9
843
98.9
707
98.1
654
96.9
422
95.0
164
89.2
Someproblems
81.5
30.7
80.9
13
1.8
16
2.4
18
4.1
17
9.2
Unable
to1
0.2
20.4
20.2
10.1
50.7
40.9
31.6
Usual
activities
Noproblems
542
98.7
442
98.3
834
97.8
703
97.5
630
93.3
409
92.1
147
79.8
Someproblems
61.1
61.3
14
1.6
17
2.4
39
5.8
28
6.3
31
16.9
Unable
to1
0.2
20.4
50.6
10.1
60.9
71.6
63.3
Pain/discomfort
No
541
98.5
435
96.7
822
96.4
670
92.9
587
87.0
371
83.6
141
76.6
Some
81.5
14
3.1
30
3.5
51
7.1
86
12.7
68
15.3
43
23.4
Extrem
e0
0.0
10.2
10.1
00.0
20.3
51.1
00.0
Anxiety/depression
No
535
97.4
432
96.0
801
93.9
667
92.5
611
90.5
387
87.2
153
83.2
Some
13
2.4
16
3.6
49
5.7
52
7.2
60
8.9
52
11.7
30
16.3
Extrem
e1
0.2
20.4
30.4
20.3
40.6
51.1
10.5
(continued)
60 Annex 1: EQ-5D Population Norms – National Surveys
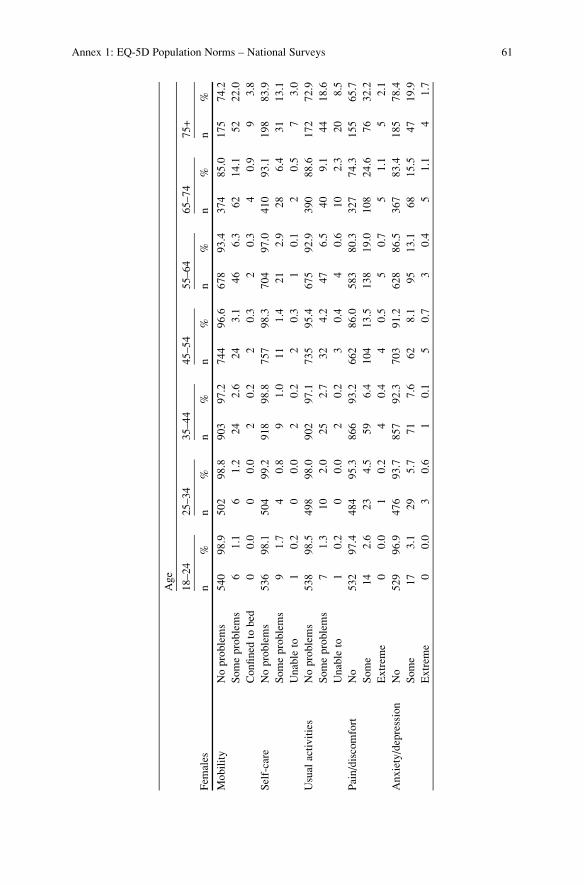
Age
Fem
ales
18–24
25–34
35–44
45–54
55–64
65–74
75+
n%
n%
n%
n%
n%
n%
n%
Mobility
Noproblems
540
98.9
502
98.8
903
97.2
744
96.6
678
93.4
374
85.0
175
74.2
Someproblems
61.1
61.2
24
2.6
24
3.1
46
6.3
62
14.1
52
22.0
Confined
tobed
00.0
00.0
20.2
20.3
20.3
40.9
93.8
Self-care
Noproblems
536
98.1
504
99.2
918
98.8
757
98.3
704
97.0
410
93.1
198
83.9
Someproblems
91.7
40.8
91.0
11
1.4
21
2.9
28
6.4
31
13.1
Unable
to1
0.2
00.0
20.2
20.3
10.1
20.5
73.0
Usual
activities
Noproblems
538
98.5
498
98.0
902
97.1
735
95.4
675
92.9
390
88.6
172
72.9
Someproblems
71.3
10
2.0
25
2.7
32
4.2
47
6.5
40
9.1
44
18.6
Unable
to1
0.2
00.0
20.2
30.4
40.6
10
2.3
20
8.5
Pain/discomfort
No
532
97.4
484
95.3
866
93.2
662
86.0
583
80.3
327
74.3
155
65.7
Some
14
2.6
23
4.5
59
6.4
104
13.5
138
19.0
108
24.6
76
32.2
Extrem
e0
0.0
10.2
40.4
40.5
50.7
51.1
52.1
Anxiety/depression
No
529
96.9
476
93.7
857
92.3
703
91.2
628
86.5
367
83.4
185
78.4
Some
17
3.1
29
5.7
71
7.6
62
8.1
95
13.1
68
15.5
47
19.9
Extrem
e0
0.0
30.6
10.1
50.7
30.4
51.1
41.7
Annex 1: EQ-5D Population Norms – National Surveys 61

EQ-5D index value (European VAS value set)
EQ-5D index value
(European VAS)
Age
Total18–24 25–34 35–44 45–54 55–64 65–74 75+
Total Mean 0.990 0.980 0.970 0.960 0.930 0.900 0.840 0.951
Standard error 0.002 0.003 0.002 0.003 0.004 0.006 0.011 0.001
25th percentile 1.00 1.00 1.00 1.00 1.00 0.78 0.69 0.96
50th percentile 1.00 1.00 1.00 1.00 1.00 1.00 1.00 1.00
75th percentile 1.00 1.00 1.00 1.00 1.00 1.00 1.00 1.00
Males Mean 0.990 0.980 0.970 0.960 0.940 0.920 0.870 0.956
Standard error 0.003 0.004 0.003 0.004 0.005 0.008 0.014 0.002
25th percentile 1.00 1.00 1.00 1.00 1.00 1.00 0.78 0.99
50th percentile 1.00 1.00 1.00 1.00 1.00 1.00 1.00 1.00
75th percentile 1.00 1.00 1.00 1.00 1.00 1.00 1.00 1.00
Females Mean 0.980 0.970 0.970 0.950 0.920 0.880 0.810 0.940
Standard error 0.003 0.004 0.004 0.005 0.006 0.009 0.018 0.002
25th percentile 1.00 1.00 1.00 1.00 0.78 0.78 0.69 0.92
50th percentile 1.00 1.00 1.00 1.00 1.00 1.00 1.00 1.00
75th percentile 1.00 1.00 1.00 1.00 1.00 1.00 1.00 1.00
62 Annex 1: EQ-5D Population Norms – National Surveys

Denmark
Source: Sørensen et al. (2009)
Number of respondents
Age 18–24 25–34 35–44 45–54 55–64 65–74 75+ Total
Total 1,580 2,974 3,277 3,341 2,737 1,824 1,128 16,861
Males 733 1,358 1,475 1,615 1,347 862 510 7,900
Females 847 1,616 1,802 1,726 1,390 962 618 8,961
EQ VAS (self-rated health)*
EQ-VAS (self-rated)
Age
Total18–24 25–34 35–44 45–54 55–64 65–74 75+
Total Mean 86.2 87.9 85.8 83.0 81.6 78.3 76.2 83.7
Standard error 0.5 0.3 0.4 0.5 0.5 0.7 1.0 0.2
25th percentile 80 82 80 75 75 70 67.5 80
50th percentile 90 90 90 89 85 80 80 90
75th percentile 95 95 95 95 95 90 90 95
Males Mean 86.2 88.1 85.7 82.5 82.3 79.6 75.6 83.8
Standard error 0.8 0.5 0.6 0.7 0.7 1.0 1.5 0.3
25th percentile 80 82 80 75 75 75 65.25 80
50th percentile 90 90 90 85 85 83 80 90
75th percentile 95 95 95 94 95 90 90 95
Females Mean 86.1 87.7 85.9 83.5 80.9 77.1 76.7 83.5
Standard error 0.8 0.5 0.5 0.6 0.7 1.0 1.3 0.3
25th percentile 80 82.25 80 75 75 67 69 75
50th percentile 90 90 90 90 85 80 80 90
75th percentile 95 95 95 95 95 90 90 95
*N ¼ 6,500; EQ VAS was included in two of three sub-studies
Annex 1: EQ-5D Population Norms – National Surveys 63
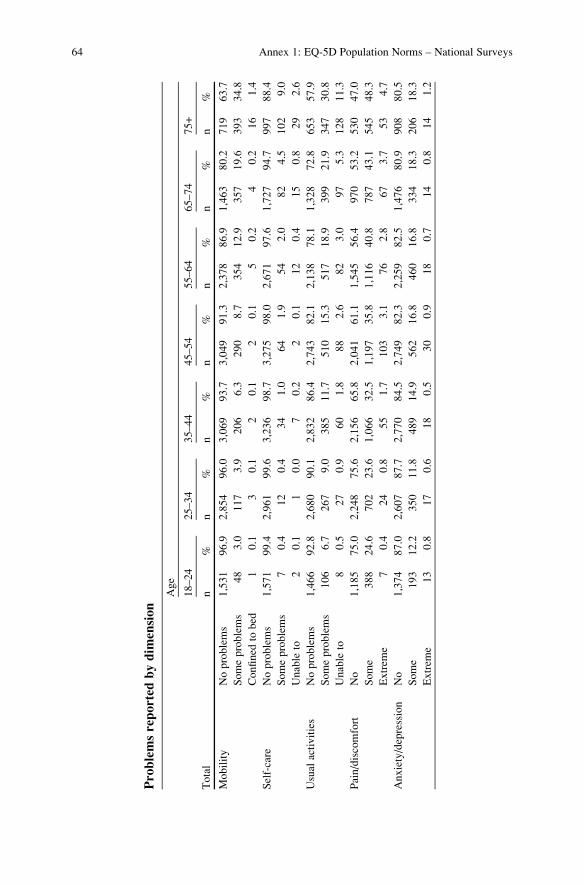
Problemsreported
bydim
ension
Age
Total
18–24
25–34
35–44
45–54
55–64
65–74
75+
n%
n%
n%
n%
n%
n%
n%
Mobility
Noproblems
1,531
96.9
2,854
96.0
3,069
93.7
3,049
91.3
2,378
86.9
1,463
80.2
719
63.7
Someproblems
48
3.0
117
3.9
206
6.3
290
8.7
354
12.9
357
19.6
393
34.8
Confined
tobed
10.1
30.1
20.1
20.1
50.2
40.2
16
1.4
Self-care
Noproblems
1,571
99.4
2,961
99.6
3,236
98.7
3,275
98.0
2,671
97.6
1,727
94.7
997
88.4
Someproblems
70.4
12
0.4
34
1.0
64
1.9
54
2.0
82
4.5
102
9.0
Unable
to2
0.1
10.0
70.2
20.1
12
0.4
15
0.8
29
2.6
Usual
activities
Noproblems
1,466
92.8
2,680
90.1
2,832
86.4
2,743
82.1
2,138
78.1
1,328
72.8
653
57.9
Someproblems
106
6.7
267
9.0
385
11.7
510
15.3
517
18.9
399
21.9
347
30.8
Unable
to8
0.5
27
0.9
60
1.8
88
2.6
82
3.0
97
5.3
128
11.3
Pain/discomfort
No
1,185
75.0
2,248
75.6
2,156
65.8
2,041
61.1
1,545
56.4
970
53.2
530
47.0
Some
388
24.6
702
23.6
1,066
32.5
1,197
35.8
1,116
40.8
787
43.1
545
48.3
Extrem
e7
0.4
24
0.8
55
1.7
103
3.1
76
2.8
67
3.7
53
4.7
Anxiety/depression
No
1,374
87.0
2,607
87.7
2,770
84.5
2,749
82.3
2,259
82.5
1,476
80.9
908
80.5
Some
193
12.2
350
11.8
489
14.9
562
16.8
460
16.8
334
18.3
206
18.3
Extrem
e13
0.8
17
0.6
18
0.5
30
0.9
18
0.7
14
0.8
14
1.2
64 Annex 1: EQ-5D Population Norms – National Surveys

Age
Males
18–24
25–34
35–44
45–54
55–64
65–74
75+
n%
n%
n%
n%
n%
n%
n%
Mobility
Noproblems
716
97.7
1,311
96.5
1,388
94.1
1,484
91.9
1,195
88.7
701
81.3
340
66.7
Someproblems
16
2.2
44
3.2
86
5.8
129
8.0
150
11.1
160
18.6
165
32.4
Confined
tobed
10.1
30.2
10.1
20.1
20.1
10.1
51.0
Self-care
Noproblems
728
99.3
1,354
99.7
1,454
98.6
1,581
97.9
1,321
98.1
824
95.6
456
89.4
Someproblems
40.5
40.3
16
1.1
33
2.0
22
1.6
31
3.6
45
8.8
Unable
to1
0.1
00.0
50.3
10.1
40.3
70.8
91.8
Usual
activities
Noproblems
693
94.5
1,246
91.8
1,314
89.1
1,376
85.2
1,097
81.4
658
76.3
326
63.9
Someproblems
35
4.8
104
7.7
137
9.3
205
12.7
214
15.9
161
18.7
145
28.4
Unable
to5
0.7
80.6
24
1.6
34
2.1
36
2.7
43
5.0
39
7.6
Pain/discomfort
No
583
79.5
1,070
78.8
1,030
69.8
1,059
65.6
807
59.9
505
58.6
269
52.7
Some
146
19.9
277
20.4
432
29.3
513
31.8
509
37.8
337
39.1
224
43.9
Extrem
e4
0.5
11
0.8
13
0.9
43
2.7
31
2.3
20
2.3
17
3.3
Anxiety/depression
No
667
91.0
1,232
90.7
1,300
88.1
1,369
84.8
1,168
86.7
736
85.4
441
86.5
Some
62
8.5
118
8.7
171
11.6
239
14.8
175
13.0
122
14.2
63
12.4
Extrem
e4
0.5
80.6
40.3
70.4
40.3
40.5
61.2
(continued)
Annex 1: EQ-5D Population Norms – National Surveys 65

Age
Fem
ales
18–24
25–34
35–44
45–54
55–64
65–74
75+
n%
n%
n%
n%
n%
n%
n%
Mobility
Noproblems
815
96.2
1,543
95.5
1,681
93.3
1,565
90.7
1,183
85.1
762
79.2
379
61.3
Someproblems
32
3.8
73
4.5
120
6.7
161
9.3
204
14.7
197
20.5
228
36.9
Confined
tobed
00.0
00.0
10.1
00.0
30.2
30.3
11
1.8
Self-care
Noproblems
843
99.5
1,607
99.4
1,782
98.9
1,694
98.1
1,350
97.1
903
93.9
541
87.5
Someproblems
30.4
80.5
18
1.0
31
1.8
32
2.3
51
5.3
57
9.2
Unable
to1
0.1
10.1
20.1
10.1
80.6
80.8
20
3.2
Usual
activities
Noproblems
773
91.3
1,434
88.7
1,518
84.2
1,367
79.2
1,041
74.9
670
69.6
327
52.9
Someproblems
71
8.4
163
10.1
248
13.8
305
17.7
303
21.8
238
24.7
202
32.7
Unable
to3
0.4
19
1.2
36
2.0
54
3.1
46
3.3
54
5.6
89
14.4
Pain/discomfort
No
602
71.1
1,178
72.9
1,126
62.5
982
56.9
738
53.1
465
48.3
261
42.2
Some
242
28.6
425
26.3
634
35.2
684
39.6
607
43.7
450
46.8
321
51.9
Extrem
e3
0.4
13
0.8
42
2.3
60
3.5
45
3.2
47
4.9
36
5.8
Anxiety/depression
No
707
83.5
1,375
85.1
1,470
81.6
1,380
80.0
1,091
78.5
740
76.9
467
75.6
Some
131
15.5
232
14.4
318
17.6
323
18.7
285
20.5
212
22.0
143
23.1
Extrem
e9
1.1
90.6
14
0.8
23
1.3
14
1.0
10
1.0
81.3
(continued)
66 Annex 1: EQ-5D Population Norms – National Surveys

EQ-5D index value (European VAS value set)
EQ-5D index value
(European VAS)
Age
Total18–24 25–34 35–44 45–54 55–64 65–74 75+
Total Mean 0.914 0.914 0.881 0.861 0.845 0.818 0.753 0.866
Standard error 0.003 0.003 0.003 0.003 0.004 0.005 0.007 0.001
25th percentile 0.78 0.78 0.78 0.78 0.75 0.71 0.66 0.78
50th percentile 1.00 1.00 1.00 1.00 0.85 0.78 0.78 1.00
75th percentile 1.00 1.00 1.00 1.00 1.00 1.00 1.00 1.00
Males Mean 0.930 0.928 0.899 0.877 0.864 0.842 0.791 0.884
Standard error 0.005 0.004 0.004 0.004 0.005 0.007 0.010 0.002
25th percentile 0.78 0.78 0.78 0.78 0.78 0.75 0.69 0.78
50th percentile 1.00 1.00 1.00 1.00 1.00 1.00 0.78 1.00
75th percentile 1.00 1.00 1.00 1.00 1.00 1.00 1.00 1.00
Females Mean 0.900 0.902 0.867 0.847 0.828 0.796 0.722 0.850
Standard error 0.005 0.004 0.004 0.004 0.005 0.007 0.010 0.002
25th percentile 0.78 0.78 0.78 0.75 0.71 0.69 0.60 0.75
50th percentile 1.00 1.00 1.00 1.00 0.78 0.78 0.75 1.00
75th percentile 1.00 1.00 1.00 1.00 1.00 1.00 1.00 1.00
EQ-5D index value (TTO value set)
EQ-5D index value
(TTO value set)
Age
Total18–24 25–34 35–44 45–54 55–64 65–74 75+
Total Mean 0.928 0.927 0.901 0.882 0.870 0.847 0.794 0.887
Standard error 0.003 0.002 0.002 0.003 0.003 0.004 0.006 0.001
25th percentile 0.82 0.82 0.82 0.82 0.78 0.77 0.72 0.82
50th percentile 1.00 1.00 1.00 1.00 0.84 0.82 0.82 1.00
75th percentile 1.00 1.00 1.00 1.00 1.00 1.00 1.00 1.00
Males Mean 0.942 0.938 0.917 0.896 0.886 0.869 0.825 0.903
Standard error 0.004 0.003 0.003 0.004 0.004 0.006 0.009 0.002
25th percentile 0.82 0.82 0.82 0.82 0.82 0.78 0.72 0.82
50th percentile 1.00 1.00 1.00 1.00 1.00 1.00 0.82 1.00
75th percentile 1.00 1.00 1.00 1.00 1.00 1.00 1.00 1.00
Females Mean 0.917 0.918 0.888 0.869 0.854 0.827 0.768 0.873
Standard error 0.004 0.003 0.004 0.004 0.005 0.006 0.009 0.002
25th percentile 0.82 0.82 0.82 0.78 0.77 0.76 0.69 0.78
50th percentile 1.00 1.00 1.00 1.00 0.82 0.82 0.78 1.00
75th percentile 1.00 1.00 1.00 1.00 1.00 1.00 1.00 1.00
Annex 1: EQ-5D Population Norms – National Surveys 67

EQ-5D index value (VAS value set)
EQ-5D index value
(VAS value set)
Age
Total18–24 25–34 35–44 45–54 55–64 65–74 75+
Total Mean 0.885 0.884 0.845 0.822 0.799 0.766 0.691 0.826
Standard error 0.004 0.003 0.003 0.004 0.004 0.006 0.008 0.002
25th percentile 0.70 0.70 0.70 0.68 0.63 0.61 0.51 0.68
50th percentile 1.00 1.00 1.00 1.00 0.71 0.70 0.68 1.00
75th percentile 1.00 1.00 1.00 1.00 1.00 1.00 1.00 1.00
Males Mean 0.907 0.903 0.866 0.841 0.822 0.794 0.730 0.848
Standard error 0.006 0.005 0.005 0.005 0.006 0.008 0.011 0.002
25th percentile 0.70 0.70 0.70 0.70 0.68 0.63 0.51 0.70
50th percentile 1.00 1.00 1.00 1.00 1.00 1.00 0.70 1.00
75th percentile 1.00 1.00 1.00 1.00 1.00 1.00 1.00 1.00
Females Mean 0.865 0.869 0.828 0.804 0.777 0.741 0.659 0.806
Standard error 0.006 0.005 0.005 0.005 0.006 0.008 0.010 0.002
25th percentile 0.70 0.70 0.68 0.63 0.61 0.57 0.51 0.63
50th percentile 1.00 1.00 1.00 1.00 0.70 0.70 0.63 1.00
75th percentile 1.00 1.00 1.00 1.00 1.00 1.00 1.00 1.00
68 Annex 1: EQ-5D Population Norms – National Surveys

England
Source: Health Survey for England (2008)
Number of respondents
Age 18–24 25–34 35–44 45–54 55–64 65–74 75+ Total
Total 1,259 2,143 2,709 2,524 2,544 1,937 1,647 14,763
Males 572 937 1,197 1,130 1,181 900 676 6,593
Females 687 1,206 1,512 1,394 1,363 1,037 971 8,170
EQ VAS (self-rated health)
Not included in survey
Annex 1: EQ-5D Population Norms – National Surveys 69

Problemsreported
bydim
ension(raw
numbers,weightedproportions)
Age
Total
18–24
25–34
35–44
45–54
55–64
65–74
75+
n%
n%
n%
n%
n%
n%
n%
Mobility
Noproblems
1,135
96.0
1,926
95.1
2,343
91.3
2,056
86.3
1,900
77.8
1,222
65.6
735
47.4
Someproblems
50
3.9
104
4.9
219
8.6
337
13.4
547
22.0
633
34.1
816
52.3
Confined
tobed
10.1
10.1
10.0
60.3
70.3
70.4
50.3
Self-care
Noproblems
1,177
99.2
1,998
98.5
2,505
98.0
2,285
95.6
2,255
92.6
1,663
90.1
1,293
85.1
Someproblems
10
0.8
30
1.4
55
2.0
102
4.0
174
6.9
175
9.4
208
13.6
Unable
to0
0.0
10.0
00.0
80.4
11
0.5
90.5
21
1.4
Usual
activities
Noproblems
1,129
95.7
1,911
94.5
2,327
91.0
2,061
86.9
1,928
79.2
1,351
73.1
898
58.8
Someproblems
53
4.1
110
5.1
215
8.2
292
11.6
445
17.9
436
23.8
542
35.4
Unable
to3
0.3
80.4
19
0.7
38
1.5
73
3.0
57
3.1
90
5.8
Pain/discomfort
No
994
84.0
1,672
83.0
1,942
75.6
1,582
66.4
1,406
57.6
894
48.0
591
38.1
Some
186
15.5
330
16.0
561
22.2
717
29.9
881
36.1
829
44.5
818
52.7
Extrem
e7
0.5
23
1.1
59
2.2
95
3.7
160
6.3
141
7.5
142
9.2
Anxiety/depression
No
996
84.4
1,678
83.3
2,102
82.4
1,894
79.9
1,950
80.0
1,487
80.2
1,171
76.7
Some
178
14.6
307
15.0
412
15.8
441
17.8
440
17.7
338
18.5
330
21.8
Extrem
e13
1.0
39
1.7
45
1.8
56
2.2
56
2.2
24
1.3
23
1.5
70 Annex 1: EQ-5D Population Norms – National Surveys

Age
Males
18–24
25–34
35–44
45–54
55–64
65–74
75+
n%
n%
n%
n%
n%
n%
n%
Mobility
Noproblems
515
96.6
830
95.8
1,011
90.6
938
88.8
892
79.1
594
68.6
327
51.3
Someproblems
18
3.1
36
4.0
107
9.4
120
10.9
237
20.6
265
31.0
307
48.1
Confined
tobed
10.3
10.1
00.0
30.3
30.2
40.4
40.6
Self-care
Noproblems
531
99.4
853
98.7
1,092
97.9
1,023
96.6
1,043
92.9
781
91.0
541
86.7
Someproblems
30.6
12
1.3
25
2.1
32
2.9
76
6.4
71
8.3
74
11.7
Unable
to0
0.0
00.0
00.0
40.4
70.6
60.7
10
1.6
Usual
activities
Noproblems
517
97.5
823
95.2
1,022
91.8
940
89.1
893
79.5
647
75.4
400
64.0
Someproblems
14
2.2
39
4.3
82
7.3
106
9.9
200
17.2
177
21.1
187
30.0
Unable
to2
0.3
40.5
11
0.9
12
1.0
37
3.3
31
3.5
38
6.0
Pain/discomfort
No
457
85.7
726
84.3
825
73.7
722
68.2
686
60.7
457
52.7
268
42.4
Some
74
13.8
129
14.8
271
24.4
307
29.1
377
33.4
359
41.7
326
51.6
Extrem
e3
0.5
80.8
22
1.9
31
2.8
69
5.8
49
5.6
38
6.0
Anxiety/depression
No
469
87.8
748
86.6
938
84.1
874
83.2
946
83.9
727
84.2
507
80.9
Some
61
11.5
104
12.1
156
13.8
170
15.5
166
14.6
127
14.8
110
17.9
Extrem
e4
0.7
11
1.2
22
2.0
14
1.3
17
1.5
80.9
81.3
(continued)
Annex 1: EQ-5D Population Norms – National Surveys 71

Age
Fem
ales
18–24
25–34
35–44
45–54
55–64
65–74
75+
n%
n%
n%
n%
n%
n%
n%
Mobility
Noproblems
620
95.3
1,096
94.3
1,332
92.1
1,118
83.9
1,008
76.5
628
62.9
408
44.6
Someproblems
32
4.7
68
5.7
112
7.9
217
15.8
310
23.2
368
36.8
509
55.3
Confined
tobed
00.0
00.0
10.1
30.3
40.3
30.3
10.1
Self-care
Noproblems
646
99.0
1,145
98.4
1,413
98.0
1,262
94.6
1,212
92.2
882
89.3
752
83.9
Someproblems
71.0
18
1.5
30
2.0
70
5.0
98
7.4
104
10.4
134
14.9
Unable
to0
0.0
10.1
00.0
40.4
40.4
30.3
11
1.2
Usual
activities
Noproblems
612
93.9
1,088
93.8
1,305
90.3
1,121
84.7
1,035
78.8
704
71.0
498
55.2
Someproblems
39
6.0
71
5.9
133
9.2
186
13.4
245
18.5
259
26.3
355
39.2
Unable
to1
0.2
40.3
80.5
26
1.9
36
2.6
26
2.7
52
5.7
Pain/discomfort
No
537
82.2
946
81.7
1,117
77.3
860
64.6
720
54.6
437
43.8
323
35.1
Some
112
17.3
201
17.0
290
20.2
410
30.7
504
38.6
470
47.0
492
53.5
Extrem
e4
0.5
15
1.3
37
2.6
64
4.6
91
6.8
92
9.2
104
11.4
Anxiety/depression
No
527
81.0
930
80.1
1,164
80.8
1,020
76.7
1,004
76.3
760
76.6
664
73.7
Some
117
17.6
203
17.7
256
17.7
271
20.1
274
20.7
211
21.8
220
24.6
Extrem
e9
1.4
28
2.2
23
1.5
42
3.1
39
3.0
16
1.6
15
1.6
(continued)
72 Annex 1: EQ-5D Population Norms – National Surveys

EQ-5D index value (European VAS value set)
EQ-5D index value
(European VAS)
Age
Total18–24 25–34 35–44 45–54 55–64 65–74 75+
Total Mean 0.926 0.918 0.895 0.862 0.825 0.790 0.726 0.862
Standard error 0.004 0.003 0.003 0.004 0.005 0.005 0.006 0.002
25th percentile 0.78 0.78 0.78 0.78 0.71 0.69 0.62 0.78
50th percentile 1.00 1.00 1.00 1.00 1.00 0.78 0.71 1.00
75th percentile 1.00 1.00 1.00 1.00 1.00 1.00 1.00 1.00
Males Mean 0.936 0.929 0.894 0.877 0.839 0.813 0.755 0.877
Standard error 0.006 0.005 0.005 0.006 0.007 0.008 0.009 0.002
25th percentile 1.00 1.00 0.78 0.78 0.71 0.69 0.69 0.78
50th percentile 1.00 1.00 1.00 1.00 1.00 0.78 0.78 1.00
75th percentile 1.00 1.00 1.00 1.00 1.00 1.00 1.00 1.00
Females Mean 0.915 0.907 0.896 0.847 0.811 0.770 0.706 0.848
Standard error 0.006 0.005 0.005 0.006 0.006 0.008 0.008 0.002
25th percentile 0.78 0.78 0.78 0.78 0.71 0.69 0.60 0.78
50th percentile 1.00 1.00 1.00 1.00 0.78 0.78 0.71 1.00
75th percentile 1.00 1.00 1.00 1.00 1.00 1.00 0.85 1.00
EQ-5D index value (TTO value set)
EQ-5D index value
(TTO value set)
Age
Total18–24 25–34 35–44 45–54 55–64 65–74 75+
Total Mean 0.933 0.923 0.898 0.862 0.819 0.784 0.717 0.862
Standard error 0.004 0.004 0.004 0.005 0.006 0.006 0.007 0.002
25th percentile 0.85 0.85 0.80 0.80 0.73 0.69 0.66 0.80
50th percentile 1.00 1.00 1.00 1.00 1.00 0.80 0.74 1.00
75th percentile 1.00 1.00 1.00 1.00 1.00 1.00 1.00 1.00
Males Mean 0.942 0.934 0.897 0.879 0.833 0.810 0.753 0.878
Standard error 0.006 0.005 0.006 0.006 0.008 0.009 0.010 0.003
25th percentile 1.00 1.00 0.80 0.80 0.74 0.73 0.69 0.80
50th percentile 1.00 1.00 1.00 1.00 1.00 0.85 0.80 1.00
75th percentile 1.00 1.00 1.00 1.00 1.00 1.00 1.00 1.00
Females Mean 0.924 0.913 0.900 0.846 0.804 0.760 0.692 0.847
Standard error 0.006 0.005 0.005 0.007 0.008 0.009 0.010 0.003
25th percentile 0.85 0.85 0.85 0.80 0.73 0.69 0.62 0.80
50th percentile 1.00 1.00 1.00 1.00 0.85 0.80 0.73 1.00
75th percentile 1.00 1.00 1.00 1.00 1.00 1.00 0.88 1.00
Annex 1: EQ-5D Population Norms – National Surveys 73
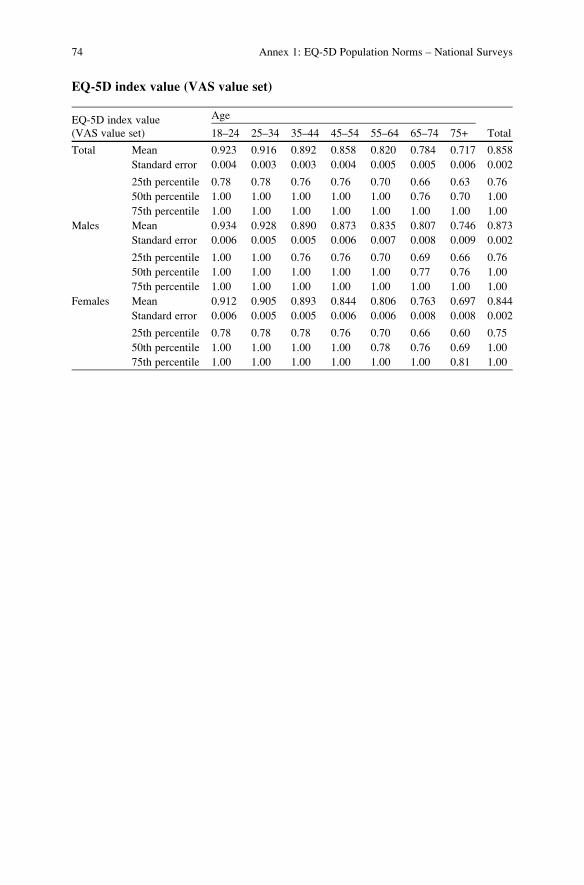
EQ-5D index value (VAS value set)
EQ-5D index value
(VAS value set)
Age
Total18–24 25–34 35–44 45–54 55–64 65–74 75+
Total Mean 0.923 0.916 0.892 0.858 0.820 0.784 0.717 0.858
Standard error 0.004 0.003 0.003 0.004 0.005 0.005 0.006 0.002
25th percentile 0.78 0.78 0.76 0.76 0.70 0.66 0.63 0.76
50th percentile 1.00 1.00 1.00 1.00 1.00 0.76 0.70 1.00
75th percentile 1.00 1.00 1.00 1.00 1.00 1.00 1.00 1.00
Males Mean 0.934 0.928 0.890 0.873 0.835 0.807 0.746 0.873
Standard error 0.006 0.005 0.005 0.006 0.007 0.008 0.009 0.002
25th percentile 1.00 1.00 0.76 0.76 0.70 0.69 0.66 0.76
50th percentile 1.00 1.00 1.00 1.00 1.00 0.77 0.76 1.00
75th percentile 1.00 1.00 1.00 1.00 1.00 1.00 1.00 1.00
Females Mean 0.912 0.905 0.893 0.844 0.806 0.763 0.697 0.844
Standard error 0.006 0.005 0.005 0.006 0.006 0.008 0.008 0.002
25th percentile 0.78 0.78 0.78 0.76 0.70 0.66 0.60 0.75
50th percentile 1.00 1.00 1.00 1.00 0.78 0.76 0.69 1.00
75th percentile 1.00 1.00 1.00 1.00 1.00 1.00 0.81 1.00
74 Annex 1: EQ-5D Population Norms – National Surveys

Finland
Source: HEALTH (2000), Aromaa and Koskinen (2004)
Number of respondents
Age 18–24 25–34 35–44 45–54 55–64 65–74 75+ Total
Total 0 856 1,813 1,920 1,282 993 1,164 8,028
Males 0 415 901 963 612 422 324 3,637
Females 0 441 912 957 670 571 840 4,391
EQ VAS (self-rated health)
Not included in survey
Annex 1: EQ-5D Population Norms – National Surveys 75

Problemsreported
bydim
ension
Age
Total
18–24
25–34
35–44
45–54
55–64
65–74
75+
n%
n%
n%
n%
n%
n%
n%
Mobility
Noproblems
––
681
95.6
1,401
93.1
1,383
83.1
761
68.0
465
55.4
202
23.5
Someproblems
––
31
4.4
102
6.8
278
16.7
357
31.9
370
44.0
601
69.9
Confined
tobed
––
00.0
20.1
30.2
10.1
50.6
57
6.6
Self-care
Noproblems
––
703
98.6
1,476
98.1
1,580
94.9
1,026
91.4
748
88.8
478
55.9
Someproblems
––
81.1
22
1.5
83
5.0
91
8.1
84
10.0
256
29.9
Unable
to–
–2
0.3
60.4
20.1
50.4
10
1.2
121
14.2
Usual
activities
Noproblems
––
677
95.6
1,394
93.9
1,414
85.8
862
77.4
585
70.5
294
35.3
Someproblems
––
28
4.0
82
5.5
220
13.3
233
20.9
213
25.7
324
38.8
Unable
to–
–3
0.4
90.6
14
0.8
18
1.6
32
3.9
216
25.9
Pain/discomfort
No
––
535
75.8
990
67.4
934
57.1
467
42.6
282
34.3
221
26.3
Some
––
170
24.1
469
31.9
682
41.7
611
55.7
521
63.4
580
69.0
Extrem
e–
–1
0.1
10
0.7
19
1.2
19
1.7
19
2.3
39
4.6
Anxiety/depression
No
––
620
91.4
1,256
89.0
1,341
87.0
919
86.9
675
84.6
598
75.4
Some
––
49
7.2
139
9.8
187
12.1
132
12.5
118
14.8
184
23.2
Extrem
e–
–9
1.3
17
1.2
14
0.9
60.6
50.6
11
1.4
76 Annex 1: EQ-5D Population Norms – National Surveys

Age
Males
18–24
25–34
35–44
45–54
55–64
65–74
75+
n%
n%
n%
n%
n%
n%
n%
Mobility
Noproblems
––
315
95.5
661
92.6
662
81.7
352
67.8
206
57.9
70
28.5
Someproblems
––
15
4.5
52
7.3
146
18.0
166
32.0
148
41.6
167
67.9
Confined
tobed
––
00.0
10.1
20.2
10.2
20.6
93.7
Self-care
Noproblems
––
327
98.5
699
97.9
760
93.8
478
91.9
312
86.9
143
58.4
Someproblems
––
41.2
11
1.5
49
6.0
41
7.9
44
12.3
77
31.4
Unable
to–
–1
0.3
40.6
10.1
10.2
30.8
25
10.2
Usual
activities
Noproblems
––
312
94.5
651
92.9
681
85.4
405
78.9
261
73.9
106
44.0
Someproblems
––
17
5.2
44
6.3
108
13.6
101
19.7
79
22.4
89
36.9
Unable
to–
–1
0.3
60.9
81.0
71.4
13
3.7
46
19.1
Pain/discomfort
No
––
254
77.2
486
69.8
483
61.0
233
45.8
146
41.5
67
27.7
Some
––
75
22.8
205
29.5
301
38.0
267
52.5
196
55.7
165
68.2
Extrem
e–
–0
0.0
50.7
81.0
91.8
10
2.8
10
4.1
Anxiety/depression
No
––
292
92.4
596
90.0
650
87.7
429
89.2
301
88.3
167
73.2
Some
––
19
6.0
54
8.2
84
11.3
49
10.2
39
11.4
59
25.9
Extrem
e–
–5
1.6
12
1.8
70.9
30.6
10.3
20.9
(continued)
Annex 1: EQ-5D Population Norms – National Surveys 77

Age
Fem
ales
18–24
25–34
35–44
45–54
55–64
65–74
75+
n%
n%
n%
n%
n%
n%
n%
Mobility
Noproblems
––
366
95.8
740
93.6
721
84.4
409
68.2
259
53.5
132
21.5
Someproblems
––
16
4.2
50
6.3
132
15.5
191
31.8
222
45.9
434
70.7
Confined
tobed
––
00.0
10.1
10.1
00.0
30.6
48
7.8
Self-care
Noproblems
––
376
98.7
777
98.4
820
95.9
548
91.0
436
90.3
335
54.9
Someproblems
––
41.0
11
1.4
34
4.0
50
8.3
40
8.3
179
29.3
Unable
to–
–1
0.3
20.3
10.1
40.7
71.4
96
15.7
Usual
activities
Noproblems
––
365
96.6
743
94.8
733
86.1
457
76.2
324
67.9
188
31.7
Someproblems
––
11
2.9
38
4.8
112
13.2
132
22.0
134
28.1
235
39.6
Unable
to–
–2
0.5
30.4
60.7
11
1.8
19
4.0
170
28.7
Pain/discomfort
No
––
281
74.5
504
65.2
451
53.5
234
39.8
136
28.9
154
25.8
Some
––
95
25.2
264
34.2
381
45.2
344
58.5
325
69.1
415
69.4
Extrem
e–
–1
0.3
50.6
11
1.3
10
1.7
91.9
29
4.8
Anxiety/depression
No
––
328
90.6
660
88.0
691
86.3
490
85.1
374
81.8
431
76.3
Some
––
30
8.3
85
11.3
103
12.9
83
14.4
79
17.3
125
22.1
Extrem
e–
–4
1.1
50.7
70.9
30.5
40.9
91.6
(continued)
78 Annex 1: EQ-5D Population Norms – National Surveys

EQ-5D index value (European VAS value set)
EQ-5D index value
(European VAS)
Age
Total18–24 25–34 35–44 45–54 55–64 65–74 75+
Total Mean – 0.923 0.897 0.859 0.810 0.768 0.578 0.820
Standard error – 0.005 0.004 0.004 0.006 0.007 0.010 0.003
25th percentile – 0.78 0.78 0.78 0.71 0.69 0.34 0.71
50th anxiety – 1.00 1.00 1.00 0.78 0.78 0.66 0.78
75th percentile – 1.00 1.00 1.00 1.00 1.00 0.78 1.00
Males Mean – 0.927 0.899 0.866 0.824 0.781 0.617 0.843
Standard error – 0.008 0.006 0.006 0.008 0.011 0.017 0.004
25th percentile – 0.78 0.78 0.78 0.71 0.69 0.48 0.71
50th percentile – 1.00 1.00 1.00 0.78 0.78 0.69 1.00
75th percentile – 1.00 1.00 1.00 1.00 1.00 0.78 1.00
Females Mean – 0.919 0.894 0.852 0.798 0.757 0.562 0.802
Standard error – 0.007 0.005 0.006 0.007 0.009 0.012 0.004
25th percentile – 0.78 0.78 0.78 0.69 0.69 0.28 0.69
50th percentile – 1.00 1.00 0.78 0.78 0.78 0.64 0.78
75th percentile – 1.00 1.00 1.00 1.00 0.81 0.75 1.00
EQ-5D index value (VAS value set)
EQ-5D index value
(VAS value set)
Age
Total18–24 25–34 35–44 45–54 55–64 65–74 75+
Total Mean – 0.907 0.876 0.832 0.778 0.735 0.578 0.798
Standard error – 0.006 0.005 0.005 0.006 0.007 0.008 0.003
25th percentile – 0.73 0.73 0.68 0.67 0.63 0.41 0.67
50th percentile – 1.00 1.00 1.00 0.73 0.73 0.63 0.73
75th percentile – 1.00 1.00 1.00 1.00 1.00 0.73 1.00
Males Mean – 0.914 0.882 0.842 0.795 0.755 0.607 0.822
Standard error – 0.009 0.007 0.007 0.009 0.011 0.015 0.004
25th percentile – 0.73 0.73 0.68 0.67 0.63 0.44 0.67
50th percentile – 1.00 1.00 1.00 0.73 0.73 0.63 1.00
75th percentile – 1.00 1.00 1.00 1.00 1.00 0.73 1.00
Females Mean – 0.902 0.871 0.823 0.764 0.719 0.566 0.778
Standard error – 0.008 0.006 0.007 0.008 0.009 0.009 0.004
25th percentile – 0.73 0.73 0.68 0.63 0.63 0.40 0.63
50th percentile – 1.00 1.00 0.73 0.73 0.73 0.57 0.73
75th percentile – 1.00 1.00 1.00 1.00 0.78 0.68 1.00
Annex 1: EQ-5D Population Norms – National Surveys 79

France
Source: ESEMeD; Konig et al. (2009)
Number of respondents
Age 18–24 25–34 35–44 45–54 55–64 65–74 75+ Total
Total 233 510 655 610 395 319 170 2,892
Males 111 233 319 286 185 127 67 1,328
Females 122 277 336 324 210 192 103 1,564
EQ VAS (self-rated health)
EQ-VAS (self-rated)
Age
Total18–24 25–34 35–44 45–54 55–64 65–74 75+
Total Mean 83.9 83.2 78.7 77.9 74.2 68.1 61.5 76.8
Standard error 1.6 0.9 0.9 1.0 1.1 1.4 2.4 0.5
25th percentile 80 80 70 70 70 60 50 70
50th percentile 90 90 80 80 80 70 70 80
75th percentile 95 90 90 90 90 80 80 90
Males Mean 83.5 82.0 79.2 78.0 73.1 70.0 63.7 77.4
Standard error 2.7 1.4 1.1 1.3 1.6 1.9 2.9 0.6
25th percentile 80 80 70 70 70 60 50 70
50th percentile 90 85 80 80 80 70 70 80
75th percentile 95 90 90 90 85 80 80 90
Females Mean 84.4 84.4 78.2 77.7 75.3 66.7 60.3 76.3
Standard error 1.6 1.2 1.5 1.5 1.3 1.9 3.4 0.7
25th percentile 80 80 70 70 70 60 50 70
50th percentile 90 90 80 80 80 70 60 80
75th percentile 90 90 90 90 90 80 80 90
80 Annex 1: EQ-5D Population Norms – National Surveys
Problemsreported
bydim
ension(raw
numbers,weightedproportions)
Age
Total
18–24
25–34
35–44
45–54
55–64
65–74
75+
n%
n%
n%
n%
n%
n%
n%
Mobility
Noproblems
227
98.4
492
96.7
610
93.1
556
93.1
313
80.0
213
67.8
93
53.9
Someproblems
61.6
18
3.3
44
6.5
53
6.8
82
20.0
104
31.6
76
45.0
Confined
tobed
00.0
00.0
10.3
10.1
00.0
20.6
11.1
Self-care
Noproblems
232
99.4
503
98.5
637
97.6
594
98.3
369
93.5
296
91.9
142
83.7
Someproblems
10.6
61.4
17
2.4
15
1.5
26
6.5
21
7.4
25
13.3
Unable
to0
0.0
10.1
10.1
10.2
00.0
20.8
33.0
Usual
activities
Noproblems
228
96.4
487
96.3
605
92.7
565
94.3
339
84.7
265
82.1
114
68.2
Someproblems
53.6
22
3.5
46
6.4
42
5.4
53
14.7
49
15.8
52
28.3
Unable
to0
0.0
10.2
40.9
30.3
30.7
52.0
43.5
Pain/discomfort
No
193
81.4
389
80.0
450
67.2
398
66.8
211
55.1
146
45.5
67
37.7
Some
38
17.1
116
19.5
199
31.6
204
32.4
173
41.8
160
49.2
95
57.3
Extrem
e2
1.5
50.5
61.1
80.8
11
3.2
13
5.3
84.9
Anxiety/depression
No
206
87.5
438
85.8
549
83.4
516
86.0
322
83.0
279
87.6
147
85.0
Some
24
10.0
69
13.5
100
15.7
88
13.4
66
15.8
36
11.5
21
14.0
Extrem
e3
2.6
30.7
60.9
60.6
71.2
40.9
21.1
(continued)
Annex 1: EQ-5D Population Norms – National Surveys 81

Age
Males
18–24
25–34
35–44
45–54
55–64
65–74
75+
n%
n%
n%
n%
n%
n%
n%
Mobility
Noproblems
109
99.1
222
96.0
302
94.6
262
94.5
152
81.6
94
78.3
45
65.1
Someproblems
20.9
11
4.0
17
5.4
23
5.3
33
18.4
33
21.7
22
34.9
Confined
tobed
00.0
00.0
00.0
10.1
00.0
00.0
00.0
Self-care
Noproblems
110
98.9
230
98.9
309
98.0
278
98.0
174
94.2
119
93.0
55
77.0
Someproblems
11.1
31.1
91.9
71.6
11
5.8
87.0
12
23.0
Unable
to0
0.0
00.0
10.1
10.5
00.0
00.0
00.0
Usual
activities
Noproblems
109
96.6
219
95.2
293
92.0
265
94.7
163
86.4
112
89.8
48
69.4
Someproblems
23.4
13
4.4
24
7.5
18
4.7
20
12.7
14
8.2
18
29.2
Unable
to0
0.0
10.4
20.5
30.6
21.0
12.1
11.4
Pain/discomfort
No
90
79.4
181
81.4
220
68.1
192
67.2
107
57.8
65
53.9
29
43.0
Some
20
18.4
50
18.3
97
31.2
90
32.2
72
38.2
61
44.0
37
55.6
Extrem
e1
2.2
20.3
20.7
40.6
63.9
12.1
11.4
Anxiety/depression
No
97
86.2
207
89.1
267
83.1
251
86.8
155
83.7
116
90.3
57
84.6
Some
12
11.0
26
10.9
49
15.4
31
12.6
28
15.6
11
9.7
10
15.4
Extrem
e2
2.8
00.0
31.5
40.6
20.7
00.0
00.0
(continued)
82 Annex 1: EQ-5D Population Norms – National Surveys

Age
Fem
ales
18–24
25–34
35–44
45–54
55–64
65–74
75+
n%
n%
n%
n%
n%
n%
n%
Mobility
Noproblems
118
97.7
270
97.4
308
91.7
294
91.8
161
78.4
119
60.6
48
47.6
Someproblems
42.3
72.6
27
7.7
30
8.2
49
21.6
71
38.4
54
50.6
Confined
tobed
00.0
00.0
10.6
00.0
00.0
21.0
11.8
Self-care
Noproblems
122
100.0
273
98.1
328
97.1
316
98.6
195
92.8
177
91.1
87
87.4
Someproblems
00.0
31.6
82.9
81.4
15
7.2
13
7.6
13
7.9
Unable
to0
0.0
10.3
00.0
00.0
00.0
21.3
34.7
Usual
activities
Noproblems
119
96.1
268
97.4
312
93.4
300
93.9
176
83.0
153
76.9
66
67.5
Someproblems
33.9
92.6
22
5.4
24
6.1
33
16.6
35
21.1
34
27.8
Unable
to0
0.0
00.0
21.3
00.0
10.3
42.0
34.7
Pain/discomfort
No
103
83.4
208
78.5
230
66.4
206
66.4
104
52.4
81
39.7
38
34.7
Some
18
15.8
66
20.8
102
32.1
114
32.6
101
45.2
99
52.8
58
58.3
Extrem
e1
0.8
30.7
41.5
40.9
52.4
12
7.6
76.9
Anxiety/depression
No
109
88.8
231
82.4
282
83.7
265
85.3
167
82.3
163
85.7
90
85.2
Some
12
8.9
43
16.1
51
16.0
57
14.2
38
15.9
25
12.7
11
13.2
Extrem
e1
2.3
31.4
30.3
20.6
51.8
41.6
21.7
Annex 1: EQ-5D Population Norms – National Surveys 83

EQ-5D index value (European VAS value set)
EQ-5D index value
(European VAS)
Age
Total18–24 25–34 35–44 45–54 55–64 65–74 75+
Total Mean 0.924 0.921 0.883 0.893 0.836 0.804 0.756 0.872
Standard error 0.012 0.007 0.007 0.007 0.011 0.014 0.020 0.004
25th percentile 0.78 0.78 0.78 0.78 0.75 0.71 0.69 0.78
50th percentile 1.00 1.00 1.00 1.00 0.78 0.78 0.78 1.00
75th percentile 1.00 1.00 1.00 1.00 1.00 1.00 1.00 1.00
Males Mean 0.918 0.931 0.889 0.893 0.843 0.846 0.781 0.885
Standard error 0.018 0.009 0.010 0.010 0.016 0.020 0.027 0.005
25th percentile 0.78 0.78 0.78 0.78 0.78 0.78 0.69 0.78
50th percentile 1.00 1.00 1.00 1.00 0.81 0.78 0.78 1.00
75th percentile 1.00 1.00 1.00 1.00 1.00 1.00 1.00 1.00
Females Mean 0.931 0.911 0.877 0.892 0.829 0.775 0.742 0.859
Standard error 0.016 0.010 0.011 0.009 0.015 0.018 0.027 0.006
25th percentile 0.78 0.78 0.78 0.78 0.75 0.69 0.69 0.78
50th percentile 1.00 1.00 1.00 1.00 0.78 0.78 0.71 1.00
75th percentile 1.00 1.00 1.00 1.00 1.00 1.00 1.00 1.00
EQ-5D index value (TTO value set)
EQ-5D index value
(TTO value set)
Age
Total18–24 25–34 35–44 45–54 55–64 65–74 75+
Total Mean 0.948 0.946 0.913 0.922 0.853 0.810 0.735 0.892
Standard error 0.012 0.006 0.008 0.006 0.013 0.017 0.028 0.004
25th percentile 0.91 0.91 0.89 0.89 0.80 0.73 0.58 0.89
50th percentile 1.00 1.00 1.00 1.00 0.91 0.89 0.85 1.00
75th percentile 1.00 1.00 1.00 1.00 1.00 1.00 1.00 1.00
Males Mean 0.944 0.952 0.917 0.925 0.862 0.868 0.767 0.908
Standard error 0.019 0.007 0.009 0.008 0.019 0.024 0.041 0.006
25th percentile 0.91 0.91 0.89 0.89 0.85 0.80 0.63 0.89
50th percentile 1.00 1.00 1.00 1.00 0.91 0.91 0.89 1.00
75th percentile 1.00 1.00 1.00 1.00 1.00 1.00 1.00 1.00
Females Mean 0.953 0.941 0.910 0.920 0.843 0.771 0.717 0.877
Standard error 0.014 0.009 0.012 0.009 0.018 0.024 0.037 0.007
25th percentile 0.91 0.91 0.89 0.89 0.80 0.64 0.58 0.89
50th percentile 1.00 1.00 1.00 1.00 0.89 0.89 0.73 1.00
75th percentile 1.00 1.00 1.00 1.00 1.00 1.00 1.00 1.00
84 Annex 1: EQ-5D Population Norms – National Surveys
Germany
Source: ESEMeD; Konig et al. (2009)
Number of respondents
Age 18–24 25–34 35–44 45–54 55–64 65–74 75+ Total
Total 264 551 838 637 597 418 247 3,552
Males 127 259 389 290 292 205 98 1,660
Females 137 292 449 347 305 213 149 1,892
EQ VAS (self-rated health)
EQ-VAS (self-rated)
Age
Total18–24 25–34 35–44 45–54 55–64 65–74 75+
Total Mean 85.3 84.0 82.5 78.5 72.9 68.6 60.5 77.3
Standard error 1.1 0.8 0.6 0.7 1.0 1.1 1.5 0.4
25th percentile 80 80 80 70 60 60 50 70
50th percentile 90 90 88 80 80 70 65 80
75th percentile 95 95 90 90 90 80 75 90
Males Mean 84.6 84.2 82.3 78.0 73.2 72.0 61.5 78.4
Standard error 1.7 1.2 0.8 1.1 1.3 1.3 2.2 0.5
25th percentile 80 80 80 70 60 60 50 70
50th percentile 90 90 85 80 80 75 60 80
75th percentile 95 95 90 90 90 80 80 90
Females Mean 86.0 83.8 82.7 79.0 72.5 66.2 60.0 76.3
Standard error 1.4 1.0 0.9 1.0 1.4 1.5 1.9 0.5
25th percentile 80 80 80 70 60 50 50 70
50th percentile 90 90 90 80 80 70 65 80
75th percentile 95 95 90 90 90 80 75 90
Annex 1: EQ-5D Population Norms – National Surveys 85

Problemsreported
bydim
ension(raw
numbers,weightedproportions)
Age
Total
18–24
25–34
35–44
45–54
55–64
65–74
75+
n%
n%
n%
n%
n%
n%
n%
Mobility
Noproblems
257
98.1
529
95.6
794
94.6
547
85.5
468
76.1
276
66.5
115
45.8
Someproblems
71.9
22
4.4
41
5.0
90
14.5
129
23.9
139
32.9
130
53.5
Confined
tobed
00.0
00.0
30.4
00.0
00.0
30.6
20.7
Self-care
Noproblems
263
99.8
549
99.8
829
99.1
625
98.3
584
97.6
394
94.4
208
84.0
Someproblems
10.2
20.2
70.7
91.1
12
2.1
21
4.9
35
14.6
Unable
to0
0.0
00.0
20.2
30.6
10.3
30.6
41.4
Usual
activities
Noproblems
254
96.6
533
97.1
806
96.2
587
92.3
518
86.0
340
80.7
164
66.2
Someproblems
10
3.4
18
2.9
29
3.5
45
6.9
78
13.8
73
18.2
78
31.9
Unable
to0
0.0
00.0
30.2
50.9
10.2
51.0
51.9
Pain/discomfort
No
230
84.8
453
83.0
680
81.0
461
72.6
389
65.5
241
56.1
117
47.8
Some
32
13.6
95
16.5
150
18.2
170
26.6
196
32.4
166
41.2
119
47.8
Extrem
e2
1.6
30.4
80.8
60.8
12
2.1
11
2.7
11
4.5
Anxiety/depression
No
252
94.5
531
96.2
810
96.8
606
95.1
571
95.6
398
95.3
232
93.4
Some
12
5.5
18
3.5
27
3.1
29
4.5
23
3.9
17
4.0
14
6.2
Extrem
e0
0.0
20.3
10.1
20.4
30.5
30.7
10.4
86 Annex 1: EQ-5D Population Norms – National Surveys

Age
Males
18–24
25–34
35–44
45–54
55–64
65–74
75+
n%
n%
n%
n%
n%
n%
n%
Mobility
Noproblems
126
99.5
251
95.9
364
93.8
240
82.5
231
75.9
143
74.5
57
57.5
Someproblems
10.5
84.1
23
5.7
50
17.5
61
24.1
60
24.6
40
41.7
Confined
tobed
00.0
00.0
20.5
00.0
00.0
20.9
10.7
Self-care
Noproblems
127
100.0
258
99.8
386
99.4
285
98.5
285
97.0
196
96.3
87
88.9
Someproblems
00.0
10.2
30.6
30.7
62.4
72.8
10
10.4
Unable
to0
0.0
00.0
00.0
20.8
10.6
20.9
10.7
Usual
activities
Noproblems
123
96.1
254
98.4
374
96.0
259
90.0
260
88.4
169
83.3
73
73.4
Someproblems
43.9
51.6
15
4.0
26
8.2
31
11.2
33
15.5
24
25.8
Unable
to0
0.0
00.0
00.0
51.8
10.4
31.2
10.7
Pain/discomfort
No
115
89.2
213
82.3
325
83.6
208
72.4
199
68.1
129
64.0
57
61.0
Some
10
7.8
45
17.4
62
15.9
79
26.5
88
30.7
72
34.0
37
35.3
Extrem
e2
3.1
10.3
20.4
31.1
51.2
42.0
43.8
Anxiety/depression
No
122
96.2
251
97.1
380
98.0
277
94.9
280
95.4
197
96.7
93
94.5
Some
53.8
72.7
92.0
12
4.5
93.6
72.8
55.5
Extrem
e0
0.0
10.3
00.0
10.6
31.0
10.6
00.0
(continued)
Annex 1: EQ-5D Population Norms – National Surveys 87

Age
Fem
ales
18–24
25–34
35–44
45–54
55–64
65–74
75+
n%
n%
n%
n%
n%
n%
n%
Mobility
Noproblems
131
96.6
278
95.4
430
95.4
307
88.4
237
76.4
133
60.5
58
40.2
Someproblems
63.4
14
4.6
18
4.3
40
11.6
68
23.6
79
39.1
90
59.2
Confined
tobed
00.0
00.0
10.3
00.0
00.0
10.4
10.7
Self-care
Noproblems
136
99.6
291
99.8
443
98.9
340
98.1
299
98.2
198
93.0
121
81.6
Someproblems
10.4
10.2
40.7
61.5
61.8
14
6.6
25
16.6
Unable
to0
0.0
00.0
20.4
10.4
00.0
10.4
31.8
Usual
activities
Noproblems
131
97.1
279
95.7
432
96.5
328
94.4
258
83.6
171
78.8
91
62.7
Someproblems
62.9
13
4.3
14
3.0
19
5.6
47
16.4
40
20.2
54
34.8
Unable
to0
0.0
00.0
30.5
00.0
00.0
20.9
42.4
Pain/discomfort
No
115
80.2
240
83.8
355
78.3
253
72.8
190
62.8
112
50.2
60
41.4
Some
22
19.8
50
15.6
88
20.6
91
26.7
108
34.2
94
46.6
82
53.7
Extrem
e0
0.0
20.6
61.2
30.6
73.0
73.3
74.8
Anxiety/depression
No
130
92.8
280
95.3
430
95.6
329
95.4
291
95.8
201
94.3
139
92.8
Some
77.2
11
4.3
18
4.3
17
4.4
14
4.2
10
4.9
96.5
Extrem
e0
0.0
10.4
10.1
10.2
00.0
20.8
10.7
(continued)
88 Annex 1: EQ-5D Population Norms – National Surveys

EQ-5D index value (European VAS value set)
EQ-5D index value
(European VAS)
Age
Total18–24 25–34 35–44 45–54 55–64 65–74 75+
Total Mean 0.950 0.949 0.943 0.908 0.881 0.838 0.771 0.902
Standard error 0.009 0.005 0.005 0.006 0.008 0.009 0.013 0.003
25th percentile 1.00 1.00 1.00 0.78 0.78 0.71 0.69 0.78
50th percentile 1.00 1.00 1.00 1.00 1.00 0.81 0.78 1.00
75th percentile 1.00 1.00 1.00 1.00 1.00 1.00 1.00 1.00
Males Mean 0.960 0.949 0.951 0.901 0.885 0.870 0.819 0.916
Standard error 0.015 0.007 0.006 0.010 0.011 0.012 0.018 0.004
25th percentile 1.00 1.00 1.00 0.78 0.78 0.78 0.71 0.78
50th percentile 1.00 1.00 1.00 1.00 1.00 1.00 0.81 1.00
75th percentile 1.00 1.00 1.00 1.00 1.00 1.00 1.00 1.00
Females Mean 0.938 0.949 0.934 0.914 0.877 0.815 0.748 0.889
Standard error 0.012 0.007 0.007 0.008 0.011 0.013 0.017 0.004
25th percentile 0.81 1.00 1.00 0.78 0.78 0.71 0.69 0.78
50th percentile 1.00 1.00 1.00 1.00 1.00 0.78 0.75 1.00
75th percentile 1.00 1.00 1.00 1.00 1.00 1.00 0.85 1.00
EQ-5D index value (TTO value set)
EQ-5D index value
(TTO value set)
Age
Total18–24 25–34 35–44 45–54 55–64 65–74 75+
Total Mean 0.972 0.973 0.966 0.945 0.922 0.891 0.839 0.938
Standard error 0.008 0.003 0.004 0.005 0.007 0.008 0.013 0.002
25th percentile 1.00 1.00 1.00 0.89 0.89 0.79 0.79 0.89
50th percentile 1.00 1.00 1.00 1.00 1.00 0.90 0.89 1.00
75th percentile 1.00 1.00 1.00 1.00 1.00 1.00 1.00 1.00
Males Mean 0.971 0.973 0.970 0.940 0.927 0.915 0.880 0.948
Standard error 0.014 0.005 0.005 0.008 0.008 0.011 0.016 0.003
25th percentile 1.00 1.00 1.00 0.89 0.89 0.89 0.79 0.90
50th percentile 1.00 1.00 1.00 1.00 1.00 1.00 0.90 1.00
75th percentile 1.00 1.00 1.00 1.00 1.00 1.00 1.00 1.00
Females Mean 0.974 0.972 0.962 0.950 0.917 0.874 0.820 0.929
Standard error 0.005 0.005 0.005 0.006 0.010 0.012 0.017 0.004
25th percentile 1.00 1.00 1.00 0.89 0.89 0.79 0.79 0.89
50th percentile 1.00 1.00 1.00 1.00 1.00 0.89 0.89 1.00
75th percentile 1.00 1.00 1.00 1.00 1.00 1.00 1.00 1.00
Annex 1: EQ-5D Population Norms – National Surveys 89

EQ-5D index value (VAS value set)
EQ-5D index value
(VAS value set)
Age
Total18–24 25–34 35–44 45–54 55–64 65–74 75+
Total Mean 0.963 0.966 0.962 0.937 0.915 0.882 0.817 0.930
Standard error 0.009 0.004 0.004 0.005 0.007 0.008 0.013 0.003
25th percentile 1.00 1.00 1.00 0.90 0.87 0.85 0.75 0.90
50th percentile 1.00 1.00 1.00 1.00 1.00 0.90 0.85 1.00
75th percentile 1.00 1.00 1.00 1.00 1.00 1.00 1.00 1.00
Males Mean 0.966 0.969 0.968 0.930 0.919 0.906 0.854 0.941
Standard error 0.015 0.005 0.005 0.009 0.009 0.011 0.018 0.003
25th percentile 1.00 1.00 1.00 0.90 0.87 0.85 0.77 0.90
50th percentile 1.00 1.00 1.00 1.00 1.00 1.00 0.90 1.00
75th percentile 1.00 1.00 1.00 1.00 1.00 1.00 1.00 1.00
Females Mean 0.959 0.964 0.956 0.944 0.911 0.864 0.799 0.920
Standard error 0.008 0.006 0.005 0.006 0.010 0.012 0.017 0.004
25th percentile 0.90 1.00 1.00 0.90 0.85 0.79 0.75 0.90
50th percentile 1.00 1.00 1.00 1.00 1.00 0.90 0.85 1.00
75th percentile 1.00 1.00 1.00 1.00 1.00 1.00 0.90 1.00
90 Annex 1: EQ-5D Population Norms – National Surveys

Greece
Source: Yfantopoulos et al. (1999)
Number of respondents
Age 18–24 25–34 35–44 45–54 55–64 65–74 75+ Total
Total 86 97 78 83 60 48 12 464
Males 43 55 37 44 35 29 8 251
Females 43 42 41 39 25 19 4 213
EQ VAS (self-rated health)
EQ-VAS (self-rated)
Age
Total18–24 25–34 35–44 45–54 55–64 65–74 75+
Total Mean 83.5 85.8 84.7 78.0 69.9 67.0 56.0 79.0
Standard error 1.5 1.5 1.9 1.9 2.9 2.9 7.8 0.9
25th percentile 78 80 80 69.75 59.25 58 40 70
50th percentile 89 90 90 80 73.5 70 53 83
75th percentile 91 96.5 95 90 90 81.5 70 90
Males Mean 85.0 85.2 86.5 78.7 77.5 65.3 61.1 80.1
Standard error 1.9 1.8 2.9 2.5 3.4 3.2 11.0 1.1
25th percentile 79.5 75 80 69 61 58 40 70
50th percentile 90 89 90 82 84 61 59 85
75th percentile 90 96 100 90 91 80 95 92
Females Mean 82.1 86.5 83.1 77.2 59.4 69.5 47.0 77.8
Standard error 2.4 2.5 2.4 2.8 4.4 5.4 9.6 1.4
25th percentile 75 83.75 80 70 45 50 28.75 70
50th percentile 85 90 87 80 60 79 46.5 80
75th percentile 95 97 92.5 92 78.5 90 65.75 90
Annex 1: EQ-5D Population Norms – National Surveys 91

Problemsreported
bydim
ension
Age
Total
18–24
25–34
35–44
45–54
55–64
65–74
75+
n%
n%
n%
n%
n%
n%
n%
Mobility
Noproblems
71
97.3
84
98.8
64
92.8
68
87.2
40
69.0
31
68.9
650.0
Someproblems
22.7
11.2
57.2
10
12.8
17
29.3
12
26.7
650.0
Confined
tobed
00.0
00.0
00.0
00.0
11.7
24.4
00.0
Self-care
Noproblems
73
100.0
85
100.0
66
95.7
75
96.2
53
91.4
37
80.4
866.7
Someproblems
00.0
00.0
34.3
33.8
58.6
715.2
433.3
Unable
to0
0.0
00.0
00.0
00.0
00.0
24.3
00.0
Usual
activities
Noproblems
71
100.0
84
98.8
67
97.1
73
93.6
43
74.1
31
66.0
758.3
Someproblems
00.0
11.2
22.9
56.4
15
25.9
15
31.9
541.7
Unable
to0
0.0
00.0
00.0
00.0
00.0
12.1
00.0
Pain/discomfort
No
74
92.5
83
94.3
67
91.8
69
85.2
39
65.0
29
61.7
650.0
Some
67.5
55.7
68.2
11
13.6
16
26.7
16
34.0
433.3
Extrem
e0
0.0
00.0
00.0
11.2
58.3
24.3
216.7
Anxiety/depression
No
70
97.2
79
91.9
65
92.9
68
87.2
47
81.0
35
79.5
11
91.7
Some
11.4
67.0
45.7
810.3
915.5
613.6
18.3
Extrem
e1
1.4
11.2
11.4
22.6
23.4
36.8
00.0
92 Annex 1: EQ-5D Population Norms – National Surveys

Age
Males
18–24
25–34
35–44
45–54
55–64
65–74
75+
n%
n%
n%
n%
n%
n%
n%
Mobility
Noproblems
38
97.4
48
98.0
31
88.6
37
90.2
28
82.4
17
63.0
450.0
Someproblems
12.6
12.0
411.4
49.8
617.6
933.3
450.0
Confined
tobed
00.0
00.0
00.0
00.0
00.0
13.7
00.0
Self-care
Noproblems
39
100.0
49
100.0
34
97.1
41
100.0
34
100.0
23
85.2
675.0
Someproblems
00.0
00.0
12.9
00.0
00.0
311.1
225.0
Unable
to0
0.0
00.0
00.0
00.0
00.0
13.7
00.0
Usual
activities
Noproblems
38
100.0
48
98.0
34
97.1
39
95.1
29
85.3
18
64.3
562.5
Someproblems
00.0
12.0
12.9
24.9
514.7
10
35.7
337.5
Unable
to0
0.0
00.0
00.0
00.0
00.0
00.0
00.0
Pain/discomfort
No
40
95.2
46
92.0
35
94.6
36
83.7
29
82.9
18
64.3
562.5
Some
24.8
48.0
25.4
716.3
514.3
10
35.7
337.5
Extrem
e0
0.0
00.0
00.0
00.0
12.9
00.0
00.0
Anxiety/depression
No
38
97.4
45
90.0
33
94.3
37
90.2
28
82.4
22
84.6
787.5
Some
12.6
48.0
12.9
24.9
514.7
27.7
112.5
Extrem
e0
0.0
12.0
12.9
24.9
12.9
27.7
00.0
(continued)
Annex 1: EQ-5D Population Norms – National Surveys 93

Age
Fem
ales
18–24
25–34
35–44
45–54
55–64
65–74
75+
n%
n%
n%
n%
n%
n%
n%
Mobility
Noproblems
33
97.1
36
100.0
33
97.1
31
83.8
12
50.0
14
77.8
250.0
Someproblems
12.9
00.0
12.9
616.2
11
45.8
316.7
250.0
Confined
tobed
00.0
00.0
00.0
00.0
14.2
15.6
00.0
Self-care
Noproblems
34
100.0
36
100.0
32
94.1
34
91.9
19
79.2
14
73.7
250.0
Someproblems
00.0
00.0
25.9
38.1
520.8
421.1
250.0
Unable
to0
0.0
00.0
00.0
00.0
00.0
15.3
00.0
Usual
activities
Noproblems
33
100.0
36
100.0
33
97.1
34
91.9
14
58.3
13
68.4
250.0
Someproblems
00.0
00.0
12.9
38.1
10
41.7
526.3
250.0
Unable
to0
0.0
00.0
00.0
00.0
00.0
15.3
00.0
Pain/discomfort
No
34
89.5
37
97.4
32
88.9
33
86.8
10
40.0
11
57.9
125.0
Some
410.5
12.6
411.1
410.5
11
44.0
631.6
125.0
Extrem
e0
0.0
00.0
00.0
12.6
416.0
210.5
250.0
Anxiety/depression
No
32
97.0
34
94.4
32
91.4
31
83.8
19
79.2
13
72.2
4100.0
Some
00.0
25.6
38.6
616.2
416.7
422.2
00.0
Extrem
e1
3.0
00.0
00.0
00.0
14.2
15.6
00.0
(continued)
94 Annex 1: EQ-5D Population Norms – National Surveys

EQ-5D index value (European VAS value set)
EQ-5D index value
(European VAS)
Age
Total18–24 25–34 35–44 45–54 55–64 65–74 75+
Total Mean 0.979 0.972 0.957 0.916 0.817 0.793 0.739 0.913
Standard error 0.010 0.010 0.016 0.019 0.032 0.040 0.074 0.009
25th percentile 1.00 1.00 1.00 0.81 0.69 0.71 0.50 1.00
50th percentile 1.00 1.00 1.00 1.00 1.00 0.85 0.70 1.00
75th percentile 1.00 1.00 1.00 1.00 1.00 1.00 1.00 1.00
Males Mean 0.989 0.960 0.952 0.923 0.894 0.783 0.818 0.923
Standard error 0.008 0.017 0.025 0.024 0.032 0.045 0.073 0.011
25th percentile 1.00 1.00 1.00 0.90 0.81 0.71 0.67 1.00
50th percentile 1.00 1.00 1.00 1.00 1.00 0.81 0.86 1.00
75th percentile 1.00 1.00 1.00 1.00 1.00 1.00 1.00 1.00
Females Mean 0.967 0.988 0.963 0.907 0.708 0.809 0.580 0.902
Standard error 0.020 0.008 0.021 0.029 0.057 0.076 0.153 0.015
25th percentile 1.00 1.00 1.00 0.81 0.57 0.73 0.32 1.00
50th percentile 1.00 1.00 1.00 1.00 0.75 1.00 0.52 1.00
75th percentile 1.00 1.00 1.00 1.00 1.00 1.00 0.89 1.00
Annex 1: EQ-5D Population Norms – National Surveys 95

Hungary
Source: Szende and Nemeth (2003)
Number of respondents
Age 18–24 25–34 35–44 45–54 55–64 65–74 75+ Total
Total 742 907 958 1,022 821 668 385 5,503
Males 369 442 437 480 351 256 132 2,467
Females 373 465 521 542 470 412 253 3,036
EQ VAS (self-rated health)
EQ-VAS (self-rated)
Age
Total18–24 25–34 35–44 45–54 55–64 65–74 75+
Total Mean 83.3 81.1 75.3 69.1 63.7 59.0 53.9 71.1
Standard error 0.5 0.5 0.6 0.6 0.7 0.8 1.1 0.3
25th percentile 80 75 70 50 50 50 40 58
50th percentile 85 85 80 70 65 60 50 75
75th percentile 90 90 90 83 80 75 70 89
Males Mean 84.1 81.9 75.8 70.2 65.7 62.5 55.2 73.3
Standard error 0.6 0.7 0.8 0.9 1.1 1.3 1.9 0.4
25th percentile 80 75 70 55 50 50 40 60
50th percentile 85 85 80 73.5 70 60 50 80
75th percentile 90 90 86.25 85 80 79.75 70 90
Females Mean 82.5 80.3 74.9 68.0 62.2 56.8 53.2 69.3
Standard error 0.7 0.7 0.8 0.8 0.9 1.1 1.4 0.4
25th percentile 75 70 70 50 50 45 40 50
50th percentile 85 84 80 70 60 50 50 70.5
75th percentile 90 90 90 80 80 70 70 85
96 Annex 1: EQ-5D Population Norms – National Surveys

Problemsreported
bydim
ension
Age
Total
18–24
25–34
35–44
45–54
55–64
65–74
75+
n%
n%
n%
n%
n%
n%
n%
Mobility
Noproblems
725
99.0
853
95.4
860
91.4
790
78.8
553
69.7
386
60.4
160
42.4
Someproblems
60.8
36
4.0
71
7.5
199
19.8
236
29.8
241
37.7
213
56.5
Confined
tobed
10.1
50.6
10
1.1
14
1.4
40.5
12
1.9
41.1
Self-care
Noproblems
729
99.6
889
99.2
922
98.3
944
94.9
713
90.0
547
85.6
271
73.2
Someproblems
30.4
40.4
14
1.5
41
4.1
69
8.7
74
11.6
85
23.0
Unable
to0
0.0
30.3
20.2
10
1.0
10
1.3
18
2.8
14
3.8
Usual
activities
Noproblems
717
98.2
871
97.1
872
93.3
826
83.3
611
77.7
452
71.2
206
55.8
Someproblems
10
1.4
22
2.5
52
5.6
145
14.6
146
18.6
145
22.8
131
35.5
Unable
to3
0.4
40.4
11
1.2
21
2.1
29
3.7
38
6.0
32
8.7
Pain/discomfort
No
625
85.5
726
81.5
649
69.5
534
53.9
355
45.2
248
38.9
114
30.4
Some
105
14.4
159
17.8
274
29.3
424
42.8
394
50.2
335
52.5
223
59.5
Extrem
e1
0.1
60.7
11
1.2
33
3.3
36
4.6
55
8.6
38
10.1
Anxiety/depression
No
604
83.0
675
76.1
653
70.1
598
60.5
415
52.9
337
53.1
167
45.0
Some
115
15.8
192
21.6
262
28.1
351
35.5
326
41.6
257
40.5
176
47.4
Extrem
e9
1.2
20
2.3
17
1.8
40
4.0
43
5.5
41
6.5
28
7.5
(continued)
Annex 1: EQ-5D Population Norms – National Surveys 97
Age
Males
18–24
25–34
35–44
45–54
55–64
65–74
75+
n%
n%
n%
n%
n%
n%
n%
Mobility
Noproblems
360
99.2
421
96.1
393
91.4
384
81.4
245
73.1
163
66.5
63
48.8
Someproblems
30.8
16
3.7
31
7.2
81
17.2
88
26.3
76
31.0
64
49.6
Confined
tobed
00.0
10.2
61.4
71.5
20.6
62.4
21.6
Self-care
Noproblems
360
99.2
435
99.1
421
98.4
447
95.3
300
90.1
212
86.9
92
73.0
Someproblems
30.8
30.7
61.4
17
3.6
26
7.8
23
9.4
30
23.8
Unable
to0
0.0
10.2
10.2
51.1
72.1
93.7
43.2
Usual
activities
Noproblems
359
98.9
428
97.5
401
93.9
395
84.8
262
79.2
178
73.0
74
59.7
Someproblems
41.1
10
2.3
21
4.9
59
12.7
55
16.6
48
19.7
38
30.6
Unable
to0
0.0
10.2
51.2
12
2.6
14
4.2
18
7.4
12
9.7
Pain/discomfort
No
313
86.2
370
84.7
315
73.8
282
60.6
181
54.4
119
49.0
44
34.1
Some
50
13.8
66
15.1
108
25.3
170
36.6
145
43.5
112
46.1
77
59.7
Extrem
e0
0.0
10.2
40.9
13
2.8
72.1
12
4.9
86.2
Anxiety/depression
No
319
87.9
363
83.1
328
76.5
314
67.4
208
63.2
156
64.7
61
48.0
Some
40
11.0
69
15.8
93
21.7
138
29.6
111
33.7
76
31.5
60
47.2
Extrem
e4
1.1
51.1
81.9
14
3.0
10
3.0
93.7
64.7
(continued)
98 Annex 1: EQ-5D Population Norms – National Surveys
Age
Fem
ales
18–24
25–34
35–44
45–54
55–64
65–74
75+
n%
n%
n%
n%
n%
n%
n%
Mobility
Noproblems
365
98.9
432
94.7
467
91.4
406
76.5
308
67.2
223
56.6
97
39.1
Someproblems
30.8
20
4.4
40
7.8
118
22.2
148
32.3
165
41.9
149
60.1
Confined
tobed
10.3
40.9
40.8
71.3
20.4
61.5
20.8
Self-care
Noproblems
369
100.0
454
99.3
501
98.2
497
94.5
413
90.0
335
84.8
179
73.4
Someproblems
00.0
10.2
81.6
24
4.6
43
9.4
51
12.9
55
22.5
Unable
to0
0.0
20.4
10.2
51.0
30.7
92.3
10
4.1
Usual
activities
Noproblems
358
97.5
443
96.7
471
92.7
431
81.9
349
76.7
274
70.1
132
53.9
Someproblems
61.6
12
2.6
31
6.1
86
16.3
91
20.0
97
24.8
93
38.0
Unable
to3
0.8
30.7
61.2
91.7
15
3.3
20
5.1
20
8.2
Pain/discomfort
No
312
84.8
356
78.4
334
65.9
252
47.9
174
38.5
129
32.7
70
28.5
Some
55
14.9
93
20.5
166
32.7
254
48.3
249
55.1
223
56.5
146
59.3
Extrem
e1
0.3
51.1
71.4
20
3.8
29
6.4
43
10.9
30
12.2
Anxiety/depression
No
285
78.1
312
69.3
325
64.6
284
54.3
207
45.5
181
45.9
106
43.4
Some
75
20.5
123
27.3
169
33.6
213
40.7
215
47.3
181
45.9
116
47.5
Extrem
e5
1.4
15
3.3
91.8
26
5.0
33
7.3
32
8.1
22
9.0
Annex 1: EQ-5D Population Norms – National Surveys 99

EQ-5D index value (European VAS value set)
EQ-5D index value
(European VAS)
Age
Total18–24 25–34 35–44 45–54 55–64 65–74 75+
Total Mean 0.934 0.911 0.873 0.802 0.755 0.716 0.639 0.823
Standard error 0.005 0.005 0.006 0.007 0.008 0.011 0.014 0.003
25th percentile 1.00 0.78 0.78 0.69 0.62 0.60 0.48 0.69
50th percentile 1.00 1.00 1.00 0.78 0.78 0.71 0.69 1.00
75th percentile 1.00 1.00 1.00 1.00 1.00 1.00 0.78 1.00
Males Mean 0.946 0.933 0.886 0.828 0.798 0.762 0.666 0.857
Standard error 0.006 0.006 0.009 0.010 0.013 0.017 0.024 0.004
25th percentile 1.00 1.00 0.78 0.69 0.69 0.62 0.48 0.75
50th percentile 1.00 1.00 1.00 1.00 0.78 0.78 0.69 1.00
75th percentile 1.00 1.00 1.00 1.00 1.00 1.00 0.81 1.00
Females Mean 0.922 0.889 0.861 0.780 0.724 0.687 0.626 0.796
Standard error 0.007 0.008 0.008 0.010 0.011 0.013 0.017 0.004
25th percentile 0.78 0.78 0.71 0.69 0.62 0.55 0.48 0.69
50th percentile 1.00 1.00 1.00 0.78 0.71 0.69 0.66 0.78
75th percentile 1.00 1.00 1.00 1.00 1.00 1.00 0.78 1.00
100 Annex 1: EQ-5D Population Norms – National Surveys

Italy
Source: ESEMeD; Konig et al. (2009)
Number of respondents
Age 18–24 25–34 35–44 45–54 55–64 65–74 75+ Total
Total 425 901 955 874 715 520 319 4,709
Males 201 454 472 434 352 273 133 2,319
Females 224 447 483 440 363 247 186 2,390
EQ VAS (self-rated health)
EQ-VAS (self-rated)
Age
Total18–24 25–34 35–44 45–54 55–64 65–74 75+
Total Mean 87.5 83.9 81.4 77.0 74.0 67.8 60.0 77.1
Standard error 0.6 0.6 0.5 0.6 0.8 1.0 1.4 0.3
25th percentile 80 80 80 70 60 60 50 70
50th percentile 90 90 80 80 80 70 60 80
75th percentile 98 95 90 90 90 80 80 90
Males Mean 89.1 84.3 82.2 78.1 75.5 70.7 61.0 79.0
Standard error 0.7 0.9 0.8 0.8 1.1 1.3 2.1 0.4
25th percentile 80 80 80 70 70 60 50 70
50th percentile 90 90 85 80 80 70 60 80
75th percentile 99.5 95 90 90 90 85 80 90
Females Mean 85.8 83.4 80.6 75.9 72.5 65.3 59.5 75.3
Standard error 1.0 0.9 0.7 0.8 1.0 1.5 1.8 0.5
25th percentile 80 80 70 70 60 50 50 70
50th percentile 90 90 80 80 80 70 60 80
75th percentile 95 95 90 90 90 80 80 90
Annex 1: EQ-5D Population Norms – National Surveys 101

Problemsreported
bydim
ension(raw
numbers,weightedproportions)
Age
Total
18–24
25–34
35–44
45–54
55–64
65–74
75+
n%
n%
n%
n%
n%
n%
n%
Mobility
Noproblems
420
99.0
883
98.2
934
97.5
818
93.5
618
86.2
387
72.6
156
47.6
Someproblems
40.8
16
1.6
21
2.5
54
6.3
95
13.6
132
27.2
157
50.4
Confined
tobed
10.2
20.2
00.0
20.2
20.2
10.2
62.0
Self-care
Noproblems
422
99.3
892
99.1
952
99.6
860
98.4
684
95.7
481
91.2
253
77.2
Someproblems
30.7
80.8
30.4
12
1.3
27
3.8
36
8.2
57
19.8
Unable
to0
0.0
10.1
00.0
20.2
40.5
30.6
93.0
Usual
activities
Noproblems
416
98.2
876
97.3
934
97.5
813
92.7
627
87.6
417
78.2
182
55.1
Someproblems
81.6
22
2.4
20
2.4
59
7.0
81
11.5
96
20.3
117
38.1
Unable
to1
0.2
30.4
10.1
20.3
70.9
71.5
20
6.8
Pain/discomfort
No
387
91.4
788
87.8
776
81.6
629
72.3
461
65.0
289
53.7
127
37.1
Some
37
8.5
108
11.6
176
18.2
236
26.6
242
33.3
210
41.5
175
57.1
Extrem
e1
0.1
50.6
30.2
91.1
12
1.8
21
4.8
17
5.8
Anxiety/depression
No
404
94.8
852
94.5
896
93.6
802
91.6
631
88.3
448
84.5
268
82.9
Some
21
5.2
47
5.3
56
6.1
69
8.0
79
11.0
67
14.4
47
15.9
Extrem
e0
0.0
20.2
30.3
30.4
50.7
51.0
41.2
102 Annex 1: EQ-5D Population Norms – National Surveys
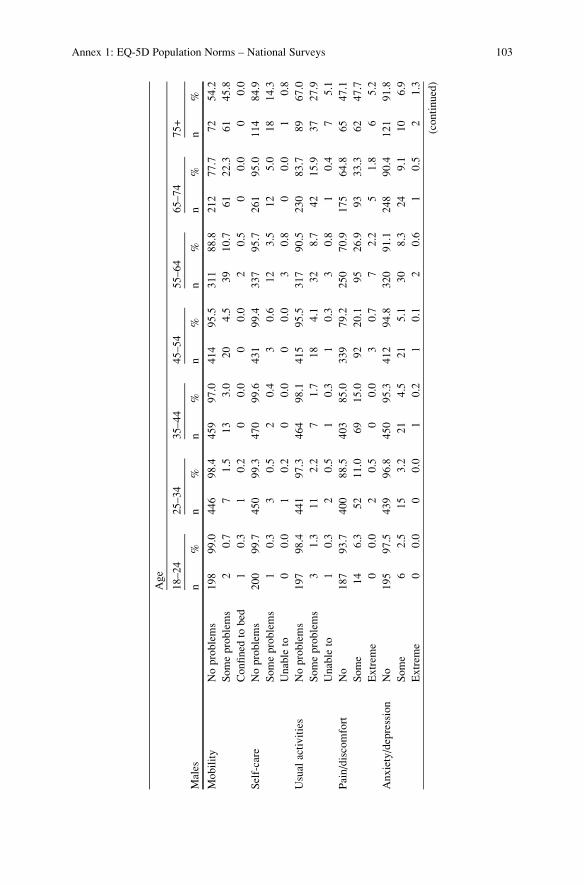
Age
Males
18–24
25–34
35–44
45–54
55–64
65–74
75+
n%
n%
n%
n%
n%
n%
n%
Mobility
Noproblems
198
99.0
446
98.4
459
97.0
414
95.5
311
88.8
212
77.7
72
54.2
Someproblems
20.7
71.5
13
3.0
20
4.5
39
10.7
61
22.3
61
45.8
Confined
tobed
10.3
10.2
00.0
00.0
20.5
00.0
00.0
Self-care
Noproblems
200
99.7
450
99.3
470
99.6
431
99.4
337
95.7
261
95.0
114
84.9
Someproblems
10.3
30.5
20.4
30.6
12
3.5
12
5.0
18
14.3
Unable
to0
0.0
10.2
00.0
00.0
30.8
00.0
10.8
Usual
activities
Noproblems
197
98.4
441
97.3
464
98.1
415
95.5
317
90.5
230
83.7
89
67.0
Someproblems
31.3
11
2.2
71.7
18
4.1
32
8.7
42
15.9
37
27.9
Unable
to1
0.3
20.5
10.3
10.3
30.8
10.4
75.1
Pain/discomfort
No
187
93.7
400
88.5
403
85.0
339
79.2
250
70.9
175
64.8
65
47.1
Some
14
6.3
52
11.0
69
15.0
92
20.1
95
26.9
93
33.3
62
47.7
Extrem
e0
0.0
20.5
00.0
30.7
72.2
51.8
65.2
Anxiety/depression
No
195
97.5
439
96.8
450
95.3
412
94.8
320
91.1
248
90.4
121
91.8
Some
62.5
15
3.2
21
4.5
21
5.1
30
8.3
24
9.1
10
6.9
Extrem
e0
0.0
00.0
10.2
10.1
20.6
10.5
21.3
(continued)
Annex 1: EQ-5D Population Norms – National Surveys 103
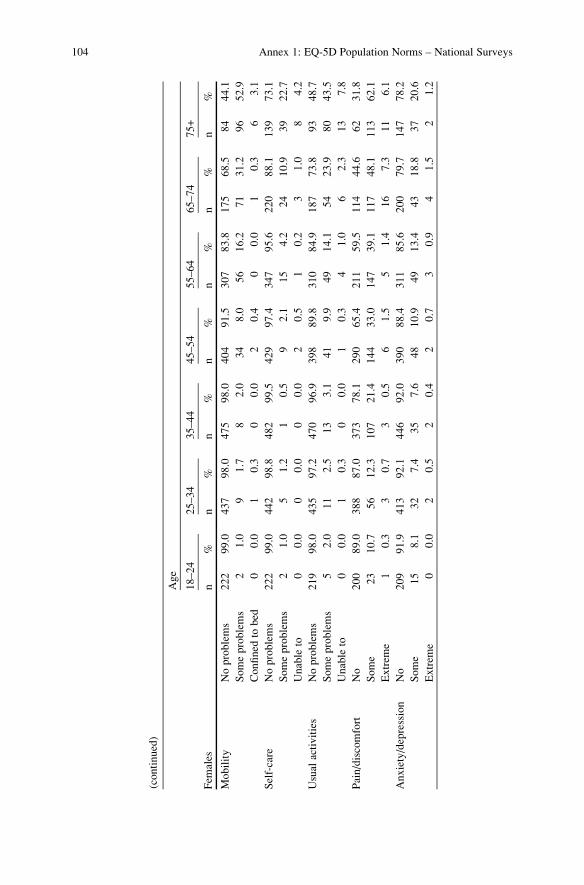
Age
Fem
ales
18–24
25–34
35–44
45–54
55–64
65–74
75+
n%
n%
n%
n%
n%
n%
n%
Mobility
Noproblems
222
99.0
437
98.0
475
98.0
404
91.5
307
83.8
175
68.5
84
44.1
Someproblems
21.0
91.7
82.0
34
8.0
56
16.2
71
31.2
96
52.9
Confined
tobed
00.0
10.3
00.0
20.4
00.0
10.3
63.1
Self-care
Noproblems
222
99.0
442
98.8
482
99.5
429
97.4
347
95.6
220
88.1
139
73.1
Someproblems
21.0
51.2
10.5
92.1
15
4.2
24
10.9
39
22.7
Unable
to0
0.0
00.0
00.0
20.5
10.2
31.0
84.2
Usual
activities
Noproblems
219
98.0
435
97.2
470
96.9
398
89.8
310
84.9
187
73.8
93
48.7
Someproblems
52.0
11
2.5
13
3.1
41
9.9
49
14.1
54
23.9
80
43.5
Unable
to0
0.0
10.3
00.0
10.3
41.0
62.3
13
7.8
Pain/discomfort
No
200
89.0
388
87.0
373
78.1
290
65.4
211
59.5
114
44.6
62
31.8
Some
23
10.7
56
12.3
107
21.4
144
33.0
147
39.1
117
48.1
113
62.1
Extrem
e1
0.3
30.7
30.5
61.5
51.4
16
7.3
11
6.1
Anxiety/depression
No
209
91.9
413
92.1
446
92.0
390
88.4
311
85.6
200
79.7
147
78.2
Some
15
8.1
32
7.4
35
7.6
48
10.9
49
13.4
43
18.8
37
20.6
Extrem
e0
0.0
20.5
20.4
20.7
30.9
41.5
21.2
(continued)
104 Annex 1: EQ-5D Population Norms – National Surveys

EQ-5D index value (European VAS value set)
EQ-5D index value
(European VAS)
Age
Total18–24 25–34 35–44 45–54 55–64 65–74 75+
Total Mean 0.969 0.956 0.943 0.910 0.877 0.823 0.724 0.899
Standard error 0.005 0.004 0.004 0.005 0.007 0.010 0.014 0.003
25th percentile 1.00 1.00 1.00 0.78 0.78 0.71 0.60 0.78
50th percentile 1.00 1.00 1.00 1.00 1.00 0.81 0.75 1.00
75th percentile 1.00 1.00 1.00 1.00 1.00 1.00 1.00 1.00
Males Mean 0.978 0.962 0.953 0.935 0.897 0.873 0.777 0.926
Standard error 0.005 0.005 0.005 0.006 0.009 0.011 0.019 0.003
25th percentile 1.00 1.00 1.00 0.78 0.78 0.78 0.69 0.78
50th percentile 1.00 1.00 1.00 1.00 1.00 1.00 0.78 1.00
75th percentile 1.00 1.00 1.00 1.00 1.00 1.00 1.00 1.00
Females Mean 0.959 0.950 0.933 0.884 0.858 0.783 0.695 0.874
Standard error 0.007 0.006 0.006 0.008 0.009 0.015 0.018 0.004
25th percentile 1.00 1.00 0.78 0.78 0.78 0.69 0.57 0.78
50th percentile 1.00 1.00 1.00 1.00 1.00 0.78 0.71 1.00
75th percentile 1.00 1.00 1.00 1.00 1.00 1.00 1.00 1.00
EQ-5D index value (TTO value set)
EQ-5D index value
(TTO value set)
Age
Total18–24 25–34 35–44 45–54 55–64 65–74 75+
Total Mean 0.985 0.978 0.973 0.955 0.937 0.904 0.839 0.947
Standard error 0.003 0.002 0.002 0.003 0.004 0.007 0.011 0.002
25th percentile 1.00 1.00 1.00 0.90 0.90 0.86 0.78 0.90
50th percentile 1.00 1.00 1.00 1.00 1.00 0.91 0.87 1.00
75th percentile 1.00 1.00 1.00 1.00 1.00 1.00 1.00 1.00
Males Mean 0.988 0.981 0.978 0.969 0.944 0.935 0.880 0.962
Standard error 0.003 0.003 0.002 0.003 0.006 0.006 0.012 0.002
25th percentile 1.00 1.00 1.00 0.91 0.90 0.90 0.83 0.92
50th percentile 1.00 1.00 1.00 1.00 1.00 1.00 0.90 1.00
75th percentile 1.00 1.00 1.00 1.00 1.00 1.00 1.00 1.00
Females Mean 0.981 0.975 0.968 0.941 0.929 0.879 0.817 0.932
Standard error 0.004 0.004 0.003 0.005 0.005 0.011 0.015 0.003
25th percentile 1.00 1.00 0.91 0.90 0.90 0.85 0.77 0.90
50th percentile 1.00 1.00 1.00 1.00 1.00 0.90 0.85 1.00
75th percentile 1.00 1.00 1.00 1.00 1.00 1.00 0.92 1.00
Annex 1: EQ-5D Population Norms – National Surveys 105
Korea
Source: Lee et al. (2009)
Number of respondents
Age 18–24 25–34 35–44 45–54 55–64 65–74 75+ Total
Total 142 256 353 268 184 99 5 1,307
Males 69 138 174 132 81 44 3 641
Females 73 118 179 136 103 55 2 666
EQ VAS (self-rated health)
EQ-VAS (self-rated)
Age
Total18–24 25–34 35–44 45–54 55–64 65–74 75+
Total Mean 78.9 80.7 80.6 80.4 76.9 76.5 – 79.5
Standard error 1.1 0.8 0.7 0.8 1.0 1.6 – 0.4
25th percentile 70 70 70 70 70 70 – 70
50th percentile 80 80 80 80 80 80 – 80
75th percentile 90 90 90 90 90 90 – 90
Males Mean 78.9 81.7 80.5 79.8 80.8 79.1 – 80.4
Standard error 1.6 1.1 0.9 1.2 1.5 2.2 – 0.5
25th percentile 70 73.75 70 70 70 70 – 70
50th percentile 80 80 80 80 80 80 – 80
75th percentile 90 90 90 90 90 90 – 90
Females Mean 78.9 79.4 80.7 81.0 73.8 74.4 – 78.7
Standard error 1.6 1.1 0.9 1.2 1.3 2.2 – 0.5
25th percentile 70 70 70 75 70 70 – 70
50th percentile 80 80 80 80 75 80 – 80
75th percentile 90 90 90 90 80 90 – 90
106 Annex 1: EQ-5D Population Norms – National Surveys

Problemsreported
bydim
ension
Age
Total
18–24
25–34
35–44
45–54
55–64
65–74
75+
n%
n%
n%
n%
n%
n%
n%
Mobility
Noproblems
140
98.6
254
99.2
346
98.0
256
95.5
152
82.6
77
77.8
5100.0
Someproblems
21.4
20.8
72.0
12
4.5
32
17.4
22
22.2
00.0
Confined
tobed
00.0
00.0
00.0
00.0
00.0
00.0
00.0
Self-care
Noproblems
142
100.0
256
100.0
353
100.0
268
100.0
180
97.8
93
93.9
5100.0
Someproblems
00.0
00.0
00.0
00.0
42.2
66.1
00.0
Unable
to0
0.0
00.0
00.0
00.0
00.0
00.0
00.0
Usual
activities
Noproblems
141
99.3
255
99.6
348
98.6
263
98.1
162
88.0
80
80.8
5100.0
Someproblems
10.7
10.4
51.4
51.9
20
10.9
19
19.2
00.0
Unable
to0
0.0
00.0
00.0
00.0
21.1
00.0
00.0
Pain/discomfort
No
128
90.1
236
92.2
312
88.4
207
77.2
105
57.1
40
40.4
120.0
Some
13
9.2
20
7.8
39
11.0
58
21.6
71
38.6
54
54.5
480.0
Extrem
e1
0.7
00.0
20.6
31.1
84.3
55.1
00.0
Anxiety/depression
No
126
88.7
222
86.7
312
88.4
223
83.2
129
70.1
65
65.7
240.0
Some
16
11.3
34
13.3
39
11.0
43
16.0
54
29.3
34
34.3
360.0
Extrem
e0
0.0
00.0
20.6
20.7
10.5
00.0
00.0
(continued)
Annex 1: EQ-5D Population Norms – National Surveys 107
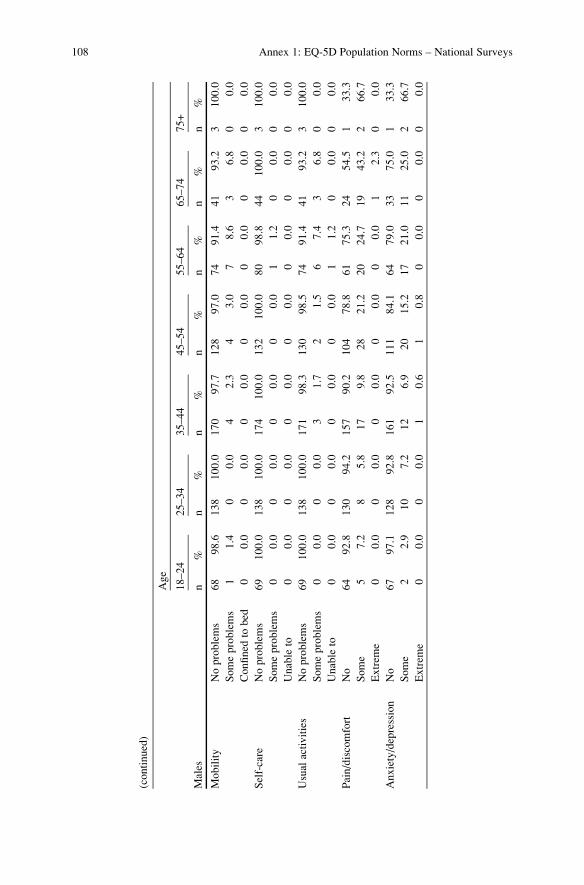
Age
Males
18–24
25–34
35–44
45–54
55–64
65–74
75+
n%
n%
n%
n%
n%
n%
n%
Mobility
Noproblems
68
98.6
138
100.0
170
97.7
128
97.0
74
91.4
41
93.2
3100.0
Someproblems
11.4
00.0
42.3
43.0
78.6
36.8
00.0
Confined
tobed
00.0
00.0
00.0
00.0
00.0
00.0
00.0
Self-care
Noproblems
69
100.0
138
100.0
174
100.0
132
100.0
80
98.8
44
100.0
3100.0
Someproblems
00.0
00.0
00.0
00.0
11.2
00.0
00.0
Unable
to0
0.0
00.0
00.0
00.0
00.0
00.0
00.0
Usual
activities
Noproblems
69
100.0
138
100.0
171
98.3
130
98.5
74
91.4
41
93.2
3100.0
Someproblems
00.0
00.0
31.7
21.5
67.4
36.8
00.0
Unable
to0
0.0
00.0
00.0
00.0
11.2
00.0
00.0
Pain/discomfort
No
64
92.8
130
94.2
157
90.2
104
78.8
61
75.3
24
54.5
133.3
Some
57.2
85.8
17
9.8
28
21.2
20
24.7
19
43.2
266.7
Extrem
e0
0.0
00.0
00.0
00.0
00.0
12.3
00.0
Anxiety/depression
No
67
97.1
128
92.8
161
92.5
111
84.1
64
79.0
33
75.0
133.3
Some
22.9
10
7.2
12
6.9
20
15.2
17
21.0
11
25.0
266.7
Extrem
e0
0.0
00.0
10.6
10.8
00.0
00.0
00.0
(continued)
108 Annex 1: EQ-5D Population Norms – National Surveys

Age
Fem
ales
18–24
25–34
35–44
45–54
55–64
65–74
75+
n%
n%
n%
n%
n%
n%
n%
Mobility
Noproblems
72
98.6
116
98.3
176
98.3
128
94.1
78
75.7
36
65.5
2100.0
Someproblems
11.4
21.7
31.7
85.9
25
24.3
19
34.5
00.0
Confined
tobed
00.0
00.0
00.0
00.0
00.0
00.0
00.0
Self-care
Noproblems
73
100.0
118
100.0
179
100.0
136
100.0
100
97.1
49
89.1
2100.0
Someproblems
00.0
00.0
00.0
00.0
32.9
610.9
00.0
Unable
to0
0.0
00.0
00.0
00.0
00.0
00.0
00.0
Usual
activities
Noproblems
72
98.6
117
99.2
177
98.9
133
97.8
88
85.4
39
70.9
2100.0
Someproblems
11.4
10.8
21.1
32.2
14
13.6
16
29.1
00.0
Unable
to0
0.0
00.0
00.0
00.0
11.0
00.0
00.0
Pain/discomfort
No
64
87.7
106
89.8
155
86.6
103
75.7
44
42.7
16
29.1
00.0
Some
811.0
12
10.2
22
12.3
30
22.1
51
49.5
35
63.6
2100.0
Extrem
e1
1.4
00.0
21.1
32.2
87.8
47.3
00.0
Anxiety/depression
No
59
80.8
94
79.7
151
84.4
112
82.4
65
63.1
32
58.2
150.0
Some
14
19.2
24
20.3
27
15.1
23
16.9
37
35.9
23
41.8
150.0
Extrem
e0
0.0
00.0
10.6
10.7
11.0
00.0
00.0
Annex 1: EQ-5D Population Norms – National Surveys 109
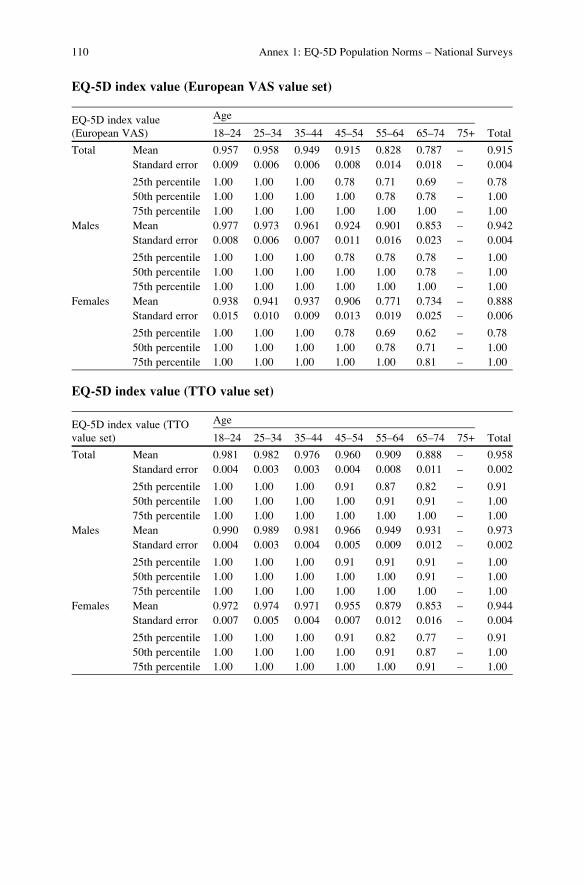
EQ-5D index value (European VAS value set)
EQ-5D index value
(European VAS)
Age
Total18–24 25–34 35–44 45–54 55–64 65–74 75+
Total Mean 0.957 0.958 0.949 0.915 0.828 0.787 – 0.915
Standard error 0.009 0.006 0.006 0.008 0.014 0.018 – 0.004
25th percentile 1.00 1.00 1.00 0.78 0.71 0.69 – 0.78
50th percentile 1.00 1.00 1.00 1.00 0.78 0.78 – 1.00
75th percentile 1.00 1.00 1.00 1.00 1.00 1.00 – 1.00
Males Mean 0.977 0.973 0.961 0.924 0.901 0.853 – 0.942
Standard error 0.008 0.006 0.007 0.011 0.016 0.023 – 0.004
25th percentile 1.00 1.00 1.00 0.78 0.78 0.78 – 1.00
50th percentile 1.00 1.00 1.00 1.00 1.00 0.78 – 1.00
75th percentile 1.00 1.00 1.00 1.00 1.00 1.00 – 1.00
Females Mean 0.938 0.941 0.937 0.906 0.771 0.734 – 0.888
Standard error 0.015 0.010 0.009 0.013 0.019 0.025 – 0.006
25th percentile 1.00 1.00 1.00 0.78 0.69 0.62 – 0.78
50th percentile 1.00 1.00 1.00 1.00 0.78 0.71 – 1.00
75th percentile 1.00 1.00 1.00 1.00 1.00 0.81 – 1.00
EQ-5D index value (TTO value set)
EQ-5D index value (TTO
value set)
Age
Total18–24 25–34 35–44 45–54 55–64 65–74 75+
Total Mean 0.981 0.982 0.976 0.960 0.909 0.888 – 0.958
Standard error 0.004 0.003 0.003 0.004 0.008 0.011 – 0.002
25th percentile 1.00 1.00 1.00 0.91 0.87 0.82 – 0.91
50th percentile 1.00 1.00 1.00 1.00 0.91 0.91 – 1.00
75th percentile 1.00 1.00 1.00 1.00 1.00 1.00 – 1.00
Males Mean 0.990 0.989 0.981 0.966 0.949 0.931 – 0.973
Standard error 0.004 0.003 0.004 0.005 0.009 0.012 – 0.002
25th percentile 1.00 1.00 1.00 0.91 0.91 0.91 – 1.00
50th percentile 1.00 1.00 1.00 1.00 1.00 0.91 – 1.00
75th percentile 1.00 1.00 1.00 1.00 1.00 1.00 – 1.00
Females Mean 0.972 0.974 0.971 0.955 0.879 0.853 – 0.944
Standard error 0.007 0.005 0.004 0.007 0.012 0.016 – 0.004
25th percentile 1.00 1.00 1.00 0.91 0.82 0.77 – 0.91
50th percentile 1.00 1.00 1.00 1.00 0.91 0.87 – 1.00
75th percentile 1.00 1.00 1.00 1.00 1.00 0.91 – 1.00
110 Annex 1: EQ-5D Population Norms – National Surveys

Netherlands
Source: ESEMeD; Konig et al. (2009)
Number of respondents
Age 18–24 25–34 35–44 45–54 55–64 65–74 75+ Total
Total 133 431 495 453 405 286 164 2,367
Males 52 197 199 206 188 133 55 1,030
Females 81 234 296 247 217 153 109 1,337
EQ VAS (self-rated health)
EQ-VAS (self-rated)
Age
Total18–24 25–34 35–44 45–54 55–64 65–74 75+
Total Mean 85.7 84.6 83.7 81.0 80.7 78.0 72.9 82.0
Standard error 1.2 0.8 1.1 1.0 1.0 1.4 1.9 0.4
25th percentile 80 75 75 75 75 70 60 75
50th percentile 85 90 90 85 85 80 75 85
75th percentile 95 95 95 95 95 90 90 95
Males Mean 89.4 85.2 84.9 82.3 80.3 76.7 78.6 83.3
Standard error 1.3 1.0 1.2 1.2 1.4 2.6 2.6 0.6
25th percentile 85 80 80 75 70 70 70 77
50th percentile 90 90 90 85 85 80 85 85
75th percentile 95 95 95 95 90 90 90 95
Females Mean 82.3 84.0 82.6 79.6 81.1 79.1 69.8 80.8
Standard error 1.7 1.3 1.7 1.6 1.5 1.4 2.3 0.6
25th percentile 75 75 75 70 75 70 60 75
50th percentile 85 90 90 85 85 80 75 85
75th percentile 95 95 95 95 95 90 80 95
Annex 1: EQ-5D Population Norms – National Surveys 111

Problemsreported
bydim
ension(raw
numbers,weightedproportions)
Age
Total
18–24
25–34
35–44
45–54
55–64
65–74
75+
n%
n%
n%
n%
n%
n%
n%
Mobility
Noproblems
129
97.5
405
95.2
469
95.1
402
88.3
343
84.6
241
82.1
105
63.5
Someproblems
42.5
25
4.7
24
4.8
50
11.6
61
14.2
43
17.1
58
35.9
Confined
tobed
00.0
10.1
20.2
10.1
11.2
20.7
10.6
Self-care
Noproblems
130
96.8
423
98.9
490
99.2
437
95.7
390
96.3
269
94.4
145
88.3
Someproblems
33.2
81.1
30.4
92.4
11
2.0
15
5.0
17
10.8
Unable
to0
0.0
00.0
20.4
71.9
41.7
20.7
20.9
Usual
activities
Noproblems
125
95.9
386
91.6
452
91.7
381
84.4
350
86.9
233
81.1
120
74.0
Someproblems
84.1
38
7.4
40
7.9
63
12.6
49
10.9
48
17.3
41
23.2
Unable
to0
0.0
71.0
30.3
93.0
62.1
51.6
32.8
Pain/discomfort
No
106
82.3
299
71.4
356
73.1
288
64.9
245
60.4
177
59.9
86
51.5
Some
25
16.0
120
26.8
127
24.3
140
29.2
142
35.6
94
35.0
65
39.7
Extrem
e2
1.7
12
1.8
12
2.7
25
5.9
18
4.0
15
5.1
13
8.8
Anxiety/depression
No
128
95.5
409
95.4
484
98.3
432
95.7
392
96.1
281
99.0
158
96.4
Some
54.5
19
3.8
10
1.5
19
3.8
10
2.2
20.3
42.6
Extrem
e0
0.0
30.8
10.2
20.5
31.7
30.7
21.0
112 Annex 1: EQ-5D Population Norms – National Surveys

Age
Males
18–24
25–34
35–44
45–54
55–64
65–74
75+
n%
n%
n%
n%
n%
n%
n%
Mobility
Noproblems
52
100.0
187
95.8
192
96.6
186
90.4
160
84.2
114
85.1
43
83.9
Someproblems
00.0
10
4.2
73.4
20
9.6
28
15.8
17
13.3
12
16.1
Confined
tobed
00.0
00.0
00.0
00.0
00.0
21.7
00.0
Self-care
Noproblems
52
100.0
196
99.5
198
99.2
199
97.5
184
98.4
125
95.4
51
94.9
Someproblems
00.0
10.5
00.0
41.5
41.6
63.1
45.1
Unable
to0
0.0
00.0
10.8
31.0
00.0
21.5
00.0
Usual
activities
Noproblems
51
99.7
185
94.8
192
96.7
178
87.3
164
88.4
108
81.1
47
89.9
Someproblems
10.3
11
4.7
73.3
25
10.3
22
11.0
22
16.4
77.9
Unable
to0
0.0
10.5
00.0
32.4
20.5
32.4
12.2
Pain/discomfort
No
47
88.2
143
72.8
154
77.5
138
67.8
117
60.8
85
64.0
40
75.5
Some
511.8
51
26.2
42
21.3
60
27.6
65
36.9
37
27.6
13
20.7
Extrem
e0
0.0
31.0
31.2
84.6
62.3
11
8.4
23.9
Anxiety/depression
No
51
97.4
193
98.9
199
100.0
197
94.7
184
98.2
130
98.7
53
96.1
Some
12.6
30.7
00.0
84.7
41.8
20.7
12.2
Extrem
e0
0.0
10.4
00.0
10.6
00.0
10.6
11.7
(continued)
Annex 1: EQ-5D Population Norms – National Surveys 113

Age
Fem
ales
18–24
25–34
35–44
45–54
55–64
65–74
75+
n%
n%
n%
n%
n%
n%
n%
Mobility
Noproblems
77
95.2
218
94.6
277
93.6
216
86.0
183
84.9
127
79.7
62
52.5
Someproblems
44.8
15
5.3
17
6.1
30
13.8
33
12.5
26
20.3
46
46.6
Confined
tobed
00.0
10.1
20.3
10.2
12.5
00.0
10.9
Self-care
Noproblems
78
93.9
227
98.2
292
99.2
238
93.8
206
94.2
144
93.5
94
84.7
Someproblems
36.1
71.8
30.7
53.3
72.3
96.5
13
13.8
Unable
to0
0.0
00.0
10.1
42.9
43.5
00.0
21.5
Usual
activities
Noproblems
74
92.3
201
88.2
260
86.9
203
81.3
186
85.4
125
81.0
73
65.5
Someproblems
77.7
27
10.2
33
12.5
38
15.1
27
10.8
26
18.0
34
31.5
Unable
to0
0.0
61.6
30.7
63.6
43.8
20.9
23.1
Pain/discomfort
No
59
76.8
156
69.9
202
68.8
150
61.8
128
59.9
92
56.5
46
38.5
Some
20
20.0
69
27.4
85
27.2
80
30.9
77
34.4
57
41.0
52
50.0
Extrem
e2
3.2
92.7
94.0
17
7.3
12
5.7
42.4
11
11.5
Anxiety/depression
No
77
93.7
216
91.7
285
96.6
235
96.7
208
93.9
151
99.3
105
96.5
Some
46.3
16
7.1
10
3.1
11
2.9
62.6
00.0
32.9
Extrem
e0
0.0
21.2
10.4
10.4
33.5
20.7
10.6
(continued)
114 Annex 1: EQ-5D Population Norms – National Surveys

EQ-5D index value (European VAS value set)
EQ-5D index value
(European VAS)
Age
Total18–24 25–34 35–44 45–54 55–64 65–74 75+
Total Mean 0.938 0.910 0.922 0.874 0.869 0.863 0.798 0.892
Standard error 0.013 0.008 0.008 0.013 0.015 0.013 0.021 0.005
25th percentile 1.00 0.78 0.78 0.78 0.78 0.78 0.71 0.78
50th percentile 1.00 1.00 1.00 1.00 1.00 1.00 0.78 1.00
75th percentile 1.00 1.00 1.00 1.00 1.00 1.00 1.00 1.00
Males Mean 0.968 0.928 0.940 0.887 0.886 0.864 0.894 0.914
Standard error 0.012 0.010 0.010 0.018 0.013 0.021 0.028 0.006
25th percentile 1.00 0.78 1.00 0.78 0.78 0.78 0.78 0.78
50th percentile 1.00 1.00 1.00 1.00 1.00 1.00 1.00 1.00
75th percentile 1.00 1.00 1.00 1.00 1.00 1.00 1.00 1.00
Females Mean 0.910 0.891 0.903 0.860 0.851 0.862 0.746 0.872
Standard error 0.021 0.012 0.013 0.019 0.027 0.016 0.025 0.007
25th percentile 0.78 0.78 0.78 0.78 0.78 0.75 0.69 0.78
50th percentile 1.00 1.00 1.00 1.00 1.00 1.00 0.75 1.00
75th percentile 1.00 1.00 1.00 1.00 1.00 1.00 1.00 1.00
EQ-5D index value (TTO value set)
EQ-5D index value
(TTO value set)
Age
Total18–24 25–34 35–44 45–54 55–64 65–74 75+
Total Mean 0.950 0.927 0.935 0.890 0.890 0.886 0.830 0.910
Standard error 0.012 0.007 0.008 0.014 0.017 0.012 0.021 0.005
25th percentile 1.00 0.84 0.84 0.84 0.84 0.84 0.81 0.84
50th percentile 1.00 1.00 1.00 1.00 1.00 1.00 0.84 1.00
75th percentile 1.00 1.00 1.00 1.00 1.00 1.00 1.00 1.00
Males Mean 0.976 0.945 0.953 0.902 0.913 0.878 0.910 0.930
Standard error 0.009 0.008 0.009 0.019 0.010 0.022 0.027 0.005
25th percentile 1.00 0.84 1.00 0.84 0.84 0.84 0.84 0.84
50th percentile 1.00 1.00 1.00 1.00 1.00 1.00 1.00 1.00
75th percentile 1.00 1.00 1.00 1.00 1.00 1.00 1.00 1.00
Females Mean 0.925 0.907 0.917 0.877 0.866 0.894 0.787 0.891
Standard error 0.021 0.011 0.014 0.020 0.033 0.013 0.026 0.008
25th percentile 0.84 0.84 0.84 0.84 0.84 0.81 0.78 0.84
50th percentile 1.00 1.00 1.00 1.00 1.00 1.00 0.81 1.00
75th percentile 1.00 1.00 1.00 1.00 1.00 1.00 1.00 1.00
Annex 1: EQ-5D Population Norms – National Surveys 115

New Zealand
Source: Devlin et al. (2000)
Number of respondents
Age 18–24 25–34 35–44 45–54 55–64 65–74 75+ Total
Total 91 177 272 268 220 178 121 1,327
Males 39 73 123 105 97 78 59 574
Females 52 104 149 163 123 100 62 753
EQ VAS (self-rated health)
EQ-VAS (self-rated)
Age
Total18–24 25–34 35–44 45–54 55–64 65–74 75+
Total Mean 82.4 82.3 82.5 82.2 81.6 79.6 70.8 80.8
Standard error 1.3 1.0 0.8 1.0 1.1 1.2 1.8 0.4
25th percentile 73 75 76.5 77 72 70 55 74
50th percentile 82 85 85 87.5 85 80 75 85
75th percentile 94 90.5 90 95 95 90 87.5 90
Males Mean 81.1 82.5 81.2 82.5 80.6 78.6 73.5 80.4
Standard error 1.9 1.8 1.2 1.5 1.7 2.0 2.6 0.7
25th percentile 70 75 75 75 70 70 60 73
50th percentile 80 85 85 85 80 80 79 85
75th percentile 94 95 90 94.5 95 90 90 90
Females Mean 83.3 82.3 83.7 82.0 82.3 80.3 68.1 81.2
Standard error 1.8 1.2 1.1 1.3 1.5 1.5 2.4 0.6
25th percentile 75.75 75.25 79 78 75 70 50 75
50th percentile 85 84.5 87 89 90 81.5 70 85
75th percentile 94.5 90 94.5 95 95 90 83.75 90
116 Annex 1: EQ-5D Population Norms – National Surveys

Problemsreported
bydim
ension
Age
Total
18–24
25–34
35–44
45–54
55–64
65–74
75+
n%
n%
n%
n%
n%
n%
n%
Mobility
Noproblems
84
96.6
163
93.1
238
88.8
233
87.3
159
75.4
117
66.5
48
40.7
Someproblems
33.4
12
6.9
29
10.8
34
12.7
51
24.2
59
33.5
68
57.6
Confined
tobed
00.0
00.0
10.4
00.0
10.5
00.0
21.7
Self-care
Noproblems
87
100.0
174
98.9
263
98.5
257
96.6
198
94.3
160
93.0
97
84.3
Someproblems
00.0
21.1
31.1
93.4
12
5.7
12
7.0
14
12.2
Unable
to0
0.0
00.0
10.4
00.0
00.0
00.0
43.5
Usual
activities
Noproblems
82
94.3
158
89.8
233
86.9
221
82.8
162
76.4
117
66.9
50
42.4
Someproblems
55.7
18
10.2
33
12.3
45
16.9
49
23.1
57
32.6
62
52.5
Unable
to0
0.0
00.0
20.7
10.4
10.5
10.6
65.1
Pain/discomfort
No
69
79.3
130
75.6
193
72.3
161
61.0
104
49.3
71
40.6
39
32.8
Some
16
18.4
41
23.8
71
26.6
99
37.5
100
47.4
102
58.3
72
60.5
Extrem
e2
2.3
10.6
31.1
41.5
73.3
21.1
86.7
Anxiety/depression
No
73
83.9
141
80.6
222
83.5
205
77.9
160
76.6
137
78.7
76
67.3
Some
14
16.1
34
19.4
42
15.8
55
20.9
46
22.0
36
20.7
36
31.9
Extrem
e0
0.0
00.0
20.8
31.1
31.4
10.6
10.9
(continued)
Annex 1: EQ-5D Population Norms – National Surveys 117

Age
Males
18–24
25–34
35–44
45–54
55–64
65–74
75+
n%
n%
n%
n%
n%
n%
n%
Mobility
Noproblems
34
91.9
68
95.8
106
86.9
96
92.3
72
78.3
46
59.7
26
44.8
Someproblems
38.1
34.2
15
12.3
87.7
20
21.7
31
40.3
31
53.4
Confined
tobed
00.0
00.0
10.8
00.0
00.0
00.0
11.7
Self-care
Noproblems
37
100.0
72
100.0
119
98.3
99
95.2
86
92.5
67
88.2
51
89.5
Someproblems
00.0
00.0
10.8
54.8
77.5
911.8
47.0
Unable
to0
0.0
00.0
10.8
00.0
00.0
00.0
23.5
Usual
activities
Noproblems
35
94.6
66
91.7
106
86.9
92
88.5
72
77.4
45
58.4
28
49.1
Someproblems
25.4
68.3
14
11.5
12
11.5
20
21.5
31
40.3
26
45.6
Unable
to0
0.0
00.0
21.6
00.0
11.1
11.3
35.3
Pain/discomfort
No
30
81.1
58
80.6
86
70.5
67
65.0
47
50.5
28
36.8
20
34.5
Some
616.2
14
19.4
34
27.9
34
33.0
42
45.2
46
60.5
35
60.3
Extrem
e1
2.7
00.0
21.6
21.9
44.3
22.6
35.2
Anxiety/depression
No
31
83.8
63
87.5
106
87.6
82
79.6
74
79.6
59
77.6
40
74.1
Some
616.2
912.5
14
11.6
20
19.4
18
19.4
16
21.1
14
25.9
Extrem
e0
0.0
00.0
10.8
11.0
11.1
11.3
00.0
(continued)
118 Annex 1: EQ-5D Population Norms – National Surveys
Age
Fem
ales
18–24
25–34
35–44
45–54
55–64
65–74
75+
n%
n%
n%
n%
n%
n%
n%
Mobility
Noproblems
50
100.0
95
91.3
132
90.4
137
84.0
87
73.1
71
71.7
22
36.7
Someproblems
00.0
98.7
14
9.6
26
16.0
31
26.1
28
28.3
37
61.7
Confined
tobed
00.0
00.0
00.0
00.0
10.8
00.0
11.7
Self-care
Noproblems
50
100.0
102
98.1
144
98.6
158
97.5
112
95.7
93
96.9
46
79.3
Someproblems
00.0
21.9
21.4
42.5
54.3
33.1
10
17.2
Unable
to0
0.0
00.0
00.0
00.0
00.0
00.0
23.4
Usual
activities
Noproblems
47
94.0
92
88.5
127
87.0
129
79.1
90
75.6
72
73.5
22
36.1
Someproblems
36.0
12
11.5
19
13.0
33
20.2
29
24.4
26
26.5
36
59.0
Unable
to0
0.0
00.0
00.0
10.6
00.0
00.0
34.9
Pain/discomfort
No
39
78.0
72
72.0
107
73.8
94
58.4
57
48.3
43
43.4
19
31.1
Some
10
20.0
27
27.0
37
25.5
65
40.4
58
49.2
56
56.6
37
60.7
Extrem
e1
2.0
11.0
10.7
21.2
32.5
00.0
58.2
Anxiety/depression
No
42
84.0
78
75.7
116
80.0
123
76.9
86
74.1
78
79.6
36
61.0
Some
816.0
25
24.3
28
19.3
35
21.9
28
24.1
20
20.4
22
37.3
Extrem
e0
0.0
00.0
10.7
21.3
21.7
00.0
11.7
Annex 1: EQ-5D Population Norms – National Surveys 119

EQ-5D index value (European VAS value set)
EQ-5D index value
(European VAS)
Age
Total18–24 25–34 35–44 45–54 55–64 65–74 75+
Total Mean 0.913 0.906 0.893 0.858 0.817 0.800 0.712 0.848
Standard error 0.014 0.011 0.010 0.010 0.013 0.014 0.022 0.005
25th percentile 0.78 0.78 0.78 0.78 0.69 0.69 0.60 0.73
50th percentile 1.00 1.00 1.00 1.00 0.78 0.78 0.70 1.00
75th percentile 1.00 1.00 1.00 1.00 1.00 1.00 0.85 1.00
Males Mean 0.912 0.932 0.891 0.872 0.817 0.770 0.750 0.852
Standard error 0.023 0.014 0.015 0.017 0.021 0.024 0.030 0.008
25th percentile 0.78 0.78 0.78 0.78 0.71 0.69 0.69 0.75
50th percentile 1.00 1.00 1.00 1.00 0.78 0.78 0.72 1.00
75th percentile 1.00 1.00 1.00 1.00 1.00 1.00 1.00 1.00
Females Mean 0.914 0.887 0.897 0.849 0.816 0.825 0.676 0.846
Standard error 0.018 0.015 0.012 0.013 0.017 0.016 0.032 0.007
25th percentile 0.78 0.78 0.78 0.75 0.69 0.69 0.60 0.71
50th percentile 1.00 1.00 1.00 0.78 0.78 0.78 0.69 0.85
75th percentile 1.00 1.00 1.00 1.00 1.00 1.00 0.78 1.00
EQ-5D index value (VAS value set)
EQ-5D index value
(VAS value set)
Age
Total18–24 25–34 35–44 45–54 55–64 65–74 75+
Total Mean 0.890 0.883 0.869 0.827 0.782 0.763 0.672 0.818
Standard error 0.018 0.013 0.011 0.012 0.015 0.015 0.023 0.006
25th percentile 0.72 0.71 0.70 0.70 0.63 0.63 0.55 0.65
50th percentile 1.00 1.00 1.00 1.00 0.72 0.72 0.63 1.00
75th percentile 1.00 1.00 1.00 1.00 1.00 1.00 0.78 1.00
Males Mean 0.889 0.915 0.867 0.845 0.784 0.734 0.710 0.823
Standard error 0.028 0.017 0.017 0.019 0.023 0.025 0.031 0.009
25th percentile 0.71 0.72 0.72 0.70 0.64 0.63 0.62 0.70
50th percentile 1.00 1.00 1.00 1.00 0.72 0.72 0.64 1.00
75th percentile 1.00 1.00 1.00 1.00 1.00 1.00 1.00 1.00
Females Mean 0.892 0.860 0.873 0.816 0.780 0.787 0.636 0.815
Standard error 0.023 0.018 0.015 0.015 0.019 0.018 0.032 0.008
25th percentile 0.72 0.70 0.70 0.70 0.63 0.63 0.54 0.64
50th percentile 1.00 1.00 1.00 0.72 0.72 0.72 0.63 0.78
75th percentile 1.00 1.00 1.00 1.00 1.00 1.00 0.71 1.00
120 Annex 1: EQ-5D Population Norms – National Surveys

Slovenia
Source: Prevolnik et al. (2001)
Number of respondents
Age 18–24 25–34 35–44 45–54 55–64 65–74 75+ Total
Total 116 143 148 118 98 77 42 742
Males 47 62 58 57 51 35 14 324
Females 69 81 90 61 47 42 28 418
EQ VAS (self-rated health)
EQ-VAS (self-rated)
Age
Total18–24 25–34 35–44 45–54 55–64 65–74 75+
Total Mean 85.4 82.6 80.8 75.5 67.9 65.3 55.4 76.4
Standard error 1.3 1.2 1.4 2.0 1.8 2.1 3.0 0.7
25th percentile 80 74.5 75 70 56.5 51 40 69.25
50th percentile 90 85 85 80 70 69 51.5 80
75th percentile 95 95 92 90 80 80 72 90
Males Mean 84.4 81.6 79.4 74.9 67.1 66.7 56.0 75.6
Standard error 2.0 1.8 2.0 2.9 2.4 2.8 6.1 1.0
25th percentile 75 78 75 62.5 59.5 60 37 70
50th percentile 90 81.5 80 80 70 70 53 80
75th percentile 95 90 90 90 80 80 74.5 90
Females Mean 86.1 83.3 81.7 76.0 68.8 64.2 55.1 77.0
Standard error 1.7 1.7 1.9 2.6 2.7 3.2 3.4 1.0
25th percentile 80 70 79 70 51 50 40 69
50th percentile 90 89 89 80 70 64.5 50 80
75th percentile 95 95 94.5 90 82.5 80 66 90
Annex 1: EQ-5D Population Norms – National Surveys 121

Problemsreported
bydim
ension
Age
Total
18–24
25–34
35–44
45–54
55–64
65–74
75+
n%
n%
n%
n%
n%
n%
n%
Mobility
Noproblems
112
96.6
129
90.8
119
80.4
74
62.7
49
50.0
26
34.7
922.0
Someproblems
43.4
13
9.2
28
18.9
44
37.3
48
49.0
48
64.0
32
78.0
Confined
tobed
00.0
00.0
10.7
00.0
11.0
11.3
00.0
Self-care
Noproblems
114
98.3
138
97.2
134
90.5
102
86.4
73
74.5
53
69.7
21
52.5
Someproblems
21.7
42.8
13
8.8
16
13.6
24
24.5
21
27.6
19
47.5
Unable
to0
0.0
00.0
10.7
00.0
11.0
22.6
00.0
Usual
activities
Noproblems
100
86.2
115
81.0
113
76.4
75
63.6
54
55.1
27
35.5
12
29.3
Someproblems
16
13.8
25
17.6
34
23.0
42
35.6
39
39.8
47
61.8
28
68.3
Unable
to0
0.0
21.4
10.7
10.8
55.1
22.6
12.4
Pain/discomfort
No
85
73.3
99
69.7
92
62.2
56
47.5
32
32.7
19
25.3
717.1
Some
30
25.9
40
28.2
54
36.5
56
47.5
63
64.3
56
74.7
32
78.0
Extrem
e1
0.9
32.1
21.4
65.1
33.1
00.0
24.9
Anxiety/depression
No
85
73.3
94
66.2
102
68.9
75
63.6
53
54.1
40
53.3
20
48.8
Some
29
25.0
48
33.8
44
29.7
40
33.9
42
42.9
34
45.3
21
51.2
Extrem
e2
1.7
00.0
21.4
32.5
33.1
11.3
00.0
122 Annex 1: EQ-5D Population Norms – National Surveys
Age
Males
18–24
25–34
35–44
45–54
55–64
65–74
75+
n%
n%
n%
n%
n%
n%
n%
Mobility
Noproblems
44
93.6
55
88.7
43
74.1
36
63.2
22
43.1
14
41.2
430.8
Someproblems
36.4
711.3
14
24.1
21
36.8
29
56.9
20
58.8
969.2
Confined
tobed
00.0
00.0
11.7
00.0
00.0
00.0
00.0
Self-care
Noproblems
46
97.9
60
96.8
53
91.4
49
86.0
36
70.6
26
76.5
753.8
Someproblems
12.1
23.2
46.9
814.0
15
29.4
720.6
646.2
Unable
to0
0.0
00.0
11.7
00.0
00.0
12.9
00.0
Usual
activities
Noproblems
38
80.9
48
77.4
42
72.4
38
66.7
27
52.9
17
50.0
538.5
Someproblems
919.1
13
21.0
16
27.6
19
33.3
21
41.2
17
50.0
861.5
Unable
to0
0.0
11.6
00.0
00.0
35.9
00.0
00.0
Pain/discomfort
No
31
66.0
42
67.7
38
65.5
31
54.4
17
33.3
10
29.4
323.1
Some
15
31.9
18
29.0
19
32.8
22
38.6
33
64.7
24
70.6
10
76.9
Extrem
e1
2.1
23.2
11.7
47.0
12.0
00.0
00.0
Anxiety/depression
No
34
72.3
38
61.3
46
79.3
37
64.9
29
56.9
20
58.8
753.8
Some
11
23.4
24
38.7
12
20.7
18
31.6
22
43.1
14
41.2
646.2
Extrem
e2
4.3
00.0
00.0
23.5
00.0
00.0
00.0
(continued)
Annex 1: EQ-5D Population Norms – National Surveys 123

Fem
ales
Age
18–24
25–34
35–44
45–54
55–64
65–74
75+
n%
n%
n%
n%
n%
n%
n%
Mobility
Noproblems
68
98.6
74
92.5
76
84.4
38
62.3
27
57.4
12
29.3
517.9
Someproblems
11.4
67.5
14
15.6
23
37.7
19
40.4
28
68.3
23
82.1
Confined
tobed
00.0
00.0
00.0
00.0
12.1
12.4
00.0
Self-care
Noproblems
68
98.6
78
97.5
81
90.0
53
86.9
37
78.7
27
64.3
14
51.9
Someproblems
11.4
22.5
910.0
813.1
919.1
14
33.3
13
48.1
Unable
to0
0.0
00.0
00.0
00.0
12.1
12.4
00.0
Usual
activities
Noproblems
62
89.9
67
83.8
71
78.9
37
60.7
27
57.4
10
23.8
725.0
Someproblems
710.1
12
15.0
18
20.0
23
37.7
18
38.3
30
71.4
20
71.4
Unable
to0
0.0
11.3
11.1
11.6
24.3
24.8
13.6
Pain/discomfort
No
54
78.3
57
71.3
54
60.0
25
41.0
15
31.9
922.0
414.3
Some
15
21.7
22
27.5
35
38.9
34
55.7
30
63.8
32
78.0
22
78.6
Extrem
e0
0.0
11.3
11.1
23.3
24.3
00.0
27.1
Anxiety/depression
No
51
73.9
56
70.0
56
62.2
38
62.3
24
51.1
20
48.8
13
46.4
Some
18
26.1
24
30.0
32
35.6
22
36.1
20
42.6
20
48.8
15
53.6
Extrem
e0
0.0
00.0
22.2
11.6
36.4
12.4
00.0
(continued)
124 Annex 1: EQ-5D Population Norms – National Surveys

EQ-5D index value (European VAS value set)
EQ-5D index value
(European VAS)
Age
Total18–24 25–34 35–44 45–54 55–64 65–74 75+
Total Mean 0.879 0.859 0.831 0.772 0.697 0.663 0.621 0.788
Standard error 0.014 0.015 0.015 0.021 0.022 0.022 0.027 0.008
25th percentile 0.78 0.75 0.69 0.65 0.57 0.57 0.57 0.66
50th percentile 1.00 1.00 0.78 0.78 0.69 0.67 0.60 0.78
75th percentile 1.00 1.00 1.00 1.00 0.81 0.78 0.71 1.00
Males Mean 0.849 0.840 0.845 0.785 0.699 0.701 0.663 0.788
Standard error 0.026 0.024 0.025 0.031 0.031 0.027 0.047 0.012
25th percentile 0.75 0.74 0.69 0.61 0.57 0.60 0.57 0.66
50th percentile 0.85 0.78 1.00 0.78 0.69 0.69 0.60 0.78
75th percentile 1.00 1.00 1.00 1.00 0.81 0.78 0.74 1.00
Females Mean 0.899 0.874 0.822 0.760 0.695 0.630 0.600 0.788
Standard error 0.015 0.019 0.020 0.027 0.032 0.034 0.033 0.010
25th percentile 0.78 0.76 0.69 0.66 0.60 0.48 0.48 0.68
50th percentile 1.00 1.00 0.78 0.78 0.69 0.60 0.60 0.78
75th percentile 1.00 1.00 1.00 1.00 0.78 0.71 0.71 1.00
EQ-5D index value (VAS value set)
EQ-5D index value
(VAS value set)
Age
Total18–24 25–34 35–44 45–54 55–64 65–74 75+
Total Mean 0.869 0.841 0.794 0.712 0.619 0.554 0.498 0.738
Standard error 0.015 0.017 0.019 0.025 0.026 0.027 0.032 0.009
25th percentile 0.76 0.71 0.67 0.49 0.41 0.41 0.41 0.52
50th percentile 1.00 1.00 0.78 0.76 0.61 0.50 0.41 0.76
75th percentile 1.00 1.00 1.00 1.00 0.77 0.68 0.64 1.00
Males Mean 0.839 0.817 0.797 0.729 0.613 0.601 0.545 0.735
Standard error 0.027 0.026 0.032 0.037 0.037 0.037 0.067 0.014
25th percentile 0.71 0.67 0.60 0.44 0.41 0.41 0.41 0.50
50th percentile 0.82 0.78 1.00 0.76 0.56 0.53 0.41 0.76
75th percentile 1.00 1.00 1.00 1.00 0.78 0.76 0.72 1.00
Females Mean 0.890 0.859 0.791 0.696 0.626 0.513 0.475 0.740
Standard error 0.017 0.022 0.024 0.033 0.038 0.039 0.036 0.013
25th percentile 0.78 0.73 0.67 0.50 0.41 0.32 0.32 0.56
50th percentile 1.00 1.00 0.78 0.71 0.61 0.41 0.41 0.76
75th percentile 1.00 1.00 1.00 1.00 0.76 0.65 0.56 1.00
Annex 1: EQ-5D Population Norms – National Surveys 125

Spain
Source: ESEMeD; Konig et al. (2009)
Number of respondents
Age 18–24 25–34 35–44 45–54 55–64 65–74 75+ Total
Total 568 999 1,050 719 686 867 584 5,473
Males 281 452 442 314 303 382 247 2,421
Females 287 547 608 405 383 485 337 3,052
EQ VAS (self-rated health)
EQ-VAS (self-rated)
Age
Total18–24 25–34 35–44 45–54 55–64 65–74 75+
Total Mean 82.0 80.0 76.7 73.6 72.0 69.0 62.2 75.0
Standard error 1.1 0.9 0.9 1.2 1.2 1.2 1.4 0.4
25th percentile 80 75 70 60 60 55 50 70
50th percentile 90 90 80 80 80 75 65 80
75th percentile 95 95 90 90 90 90 80 90
Males Mean 83.2 82.4 76.9 73.4 73.4 73.1 66.7 77.0
Standard error 1.3 1.2 1.4 1.8 1.8 1.6 2.1 0.6
25th percentile 80 80 70 60 65 60 55 70
50th percentile 90 90 80 80 80 80 70 80
75th percentile 95 95 90 90 90 90 80 90
Females Mean 80.8 77.7 76.5 73.8 70.5 65.8 59.4 73.2
Standard error 1.6 1.3 1.1 1.5 1.6 1.6 1.8 0.6
25th percentile 80 70 70 60 60 50 50 60
50th percentile 90 90 80 80 80 70 60 80
75th percentile 99 93 90 90 90 85 80 90
126 Annex 1: EQ-5D Population Norms – National Surveys

Problemsreported
bydim
ension(raw
numbers,weightedproportions)
Age
Total
18–24
25–34
35–44
45–54
55–64
65–74
75+
n%
n%
n%
n%
n%
n%
n%
Mobility
Noproblems
561
99.0
975
97.6
995
94.7
659
91.7
571
83.2
637
75.4
321
53.7
Someproblems
71.0
23
2.3
49
4.3
55
7.4
112
16.4
227
24.3
255
45.5
Confined
tobed
00.0
10.0
61.0
50.9
30.4
30.3
80.8
Self-care
Noproblems
567
99.8
990
99.2
1,034
98.1
703
98.0
646
94.9
808
94.5
487
81.6
Someproblems
10.2
70.6
11
1.3
10
1.3
39
4.9
57
5.4
82
15.6
Unable
to0
0.0
20.1
50.7
60.7
10.2
20.1
15
2.8
Usual
activities
Noproblems
554
97.7
968
97.6
993
94.1
653
89.9
578
85.2
711
83.8
377
62.8
Someproblems
14
2.3
28
2.3
44
4.1
51
7.3
97
13.3
144
15.0
164
30.0
Unable
to0
0.0
30.2
13
1.8
15
2.7
11
1.5
12
1.2
43
7.2
Pain/discomfort
No
516
90.1
880
89.4
894
85.2
554
77.2
467
71.4
573
69.0
335
56.1
Some
52
9.9
113
10.1
144
13.4
145
20.4
199
25.6
266
28.2
216
39.2
Extrem
e0
0.0
60.5
12
1.4
20
2.4
20
3.0
28
2.8
33
4.6
Anxiety/depression
No
543
95.8
953
96.1
987
93.1
658
91.6
616
90.8
776
91.2
512
87.4
Some
23
4.0
40
3.5
57
6.3
49
6.7
59
8.2
78
7.7
63
11.4
Extrem
e2
0.2
60.4
60.7
12
1.6
11
1.0
13
1.2
91.1
(continued)
Annex 1: EQ-5D Population Norms – National Surveys 127

Age
Males
18–24
25–34
35–44
45–54
55–64
65–74
75+
n%
n%
n%
n%
n%
n%
n%
Mobility
Noproblems
278
99.0
441
97.5
425
95.7
293
93.6
256
84.8
306
82.7
163
65.0
Someproblems
31.0
11
2.5
16
3.6
19
5.6
44
14.4
75
17.2
80
33.9
Confined
tobed
00.0
00.0
10.7
20.8
30.8
10.1
41.0
Self-care
Noproblems
280
99.7
449
99.5
439
98.5
306
97.4
292
96.6
367
97.6
225
90.2
Someproblems
10.3
30.5
20.8
51.4
10
3.0
14
2.2
18
8.6
Unable
to0
0.0
00.0
10.7
31.2
10.4
10.1
41.2
Usual
activities
Noproblems
274
97.4
441
98.4
426
95.2
283
87.9
268
88.6
336
90.2
192
81.5
Someproblems
72.6
11
1.6
13
3.2
20
7.5
27
9.3
43
9.5
42
13.3
Unable
to0
0.0
00.0
31.5
11
4.6
82.1
30.3
13
5.2
Pain/discomfort
No
260
92.8
401
90.2
386
86.1
259
81.6
223
75.4
290
80.0
180
73.8
Some
21
7.2
50
9.6
55
13.1
48
16.6
74
21.6
86
18.8
61
24.2
Extrem
e0
0.0
10.3
10.7
71.8
62.9
61.1
62.0
Anxiety/depression
No
267
94.3
439
97.8
426
94.9
298
95.7
280
92.9
363
95.8
229
91.8
Some
13
5.4
12
2.0
13
4.1
14
3.7
19
6.3
15
3.7
16
7.7
Extrem
e1
0.3
10.2
30.9
20.6
40.9
40.6
20.6
(continued)
128 Annex 1: EQ-5D Population Norms – National Surveys

Age
Fem
ales
18–24
25–34
35–44
45–54
55–64
65–74
75+
n%
n%
n%
n%
n%
n%
n%
Mobility
Noproblems
283
99.1
534
97.8
570
93.7
366
90.1
315
81.5
331
69.9
158
46.4
Someproblems
40.9
12
2.1
33
5.1
36
9.0
68
18.5
152
29.7
175
52.9
Confined
tobed
00.0
10.1
51.2
30.9
00.0
20.4
40.7
Self-care
Noproblems
287
100.0
541
99.0
595
97.7
397
98.5
354
93.2
441
92.1
262
76.0
Someproblems
00.0
40.8
91.7
51.2
29
6.8
43
7.8
64
20.2
Unable
to0
0.0
20.2
40.6
30.3
00.0
10.1
11
3.8
Usual
activities
Noproblems
280
98.0
527
96.8
567
92.9
370
91.7
310
81.7
375
79.0
185
50.7
Someproblems
72.0
17
2.9
31
5.0
31
7.2
70
17.5
101
19.2
122
40.7
Unable
to0
0.0
30.3
10
2.0
41.1
30.8
91.9
30
8.6
Pain/discomfort
No
256
87.4
479
88.7
508
84.3
295
73.4
244
67.1
283
60.7
155
44.7
Some
31
12.6
63
10.6
89
13.7
97
23.7
125
29.7
180
35.2
155
48.9
Extrem
e0
0.0
50.7
11
2.0
13
2.9
14
3.2
22
4.2
27
6.3
Anxiety/depression
No
276
97.4
514
94.4
561
91.3
360
88.1
336
88.7
413
87.7
283
84.7
Some
10
2.5
28
5.0
44
8.3
35
9.4
40
10.3
63
10.6
47
13.8
Extrem
e1
0.2
50.6
30.4
10
2.5
71.1
91.6
71.5
Annex 1: EQ-5D Population Norms – National Surveys 129

EQ-5D index value (European VAS value set)
EQ-5D index value
(European VAS)
Age
Total18–24 25–34 35–44 45–54 55–64 65–74 75+
Total Mean 0.968 0.963 0.939 0.911 0.884 0.870 0.773 0.915
Standard error 0.004 0.004 0.007 0.008 0.009 0.007 0.012 0.003
25th percentile 1.00 1.00 1.00 0.78 0.78 0.78 0.69 0.81
50th percentile 1.00 1.00 1.00 1.00 1.00 1.00 0.78 1.00
75th percentile 1.00 1.00 1.00 1.00 1.00 1.00 1.00 1.00
Males Mean 0.971 0.968 0.945 0.924 0.894 0.918 0.846 0.934
Standard error 0.006 0.005 0.010 0.012 0.013 0.008 0.016 0.004
25th percentile 1.00 1.00 1.00 1.00 0.78 0.81 0.78 1.00
50th percentile 1.00 1.00 1.00 1.00 1.00 1.00 1.00 1.00
75th percentile 1.00 1.00 1.00 1.00 1.00 1.00 1.00 1.00
Females Mean 0.965 0.957 0.932 0.900 0.874 0.834 0.725 0.897
Standard error 0.006 0.005 0.009 0.012 0.011 0.011 0.015 0.004
25th percentile 1.00 1.00 1.00 0.78 0.78 0.71 0.57 0.78
50th percentile 1.00 1.00 1.00 1.00 1.00 1.00 0.75 1.00
75th percentile 1.00 1.00 1.00 1.00 1.00 1.00 1.00 1.00
EQ-5D index value (TTO value set)
EQ-5D index value
(TTO value set)
Age
Total18–24 25–34 35–44 45–54 55–64 65–74 75+
Total Mean 0.982 0.975 0.949 0.923 0.901 0.891 0.781 0.929
Standard error 0.003 0.003 0.009 0.010 0.009 0.007 0.014 0.003
25th percentile 1.00 1.00 1.00 0.91 0.89 0.87 0.71 0.91
50th percentile 1.00 1.00 1.00 1.00 1.00 1.00 0.87 1.00
75th percentile 1.00 1.00 1.00 1.00 1.00 1.00 1.00 1.00
Males Mean 0.983 0.980 0.958 0.928 0.909 0.936 0.862 0.947
Standard error 0.004 0.003 0.013 0.014 0.014 0.007 0.017 0.004
25th percentile 1.00 1.00 1.00 1.00 0.89 0.89 0.84 1.00
50th percentile 1.00 1.00 1.00 1.00 1.00 1.00 1.00 1.00
75th percentile 1.00 1.00 1.00 1.00 1.00 1.00 1.00 1.00
Females Mean 0.981 0.970 0.942 0.919 0.894 0.857 0.729 0.912
Standard error 0.004 0.005 0.011 0.013 0.011 0.011 0.019 0.004
25th percentile 1.00 1.00 1.00 0.89 0.83 0.78 0.58 0.89
50th percentile 1.00 1.00 1.00 1.00 1.00 1.00 0.80 1.00
75th percentile 1.00 1.00 1.00 1.00 1.00 1.00 1.00 1.00
130 Annex 1: EQ-5D Population Norms – National Surveys

EQ-5D index value (VAS value set)
EQ-5D index value
(VAS value set)
Age
Total18–24 25–34 35–44 45–54 55–64 65–74 75+
Total Mean 0.969 0.963 0.940 0.912 0.883 0.866 0.761 0.914
Standard error 0.004 0.003 0.007 0.008 0.009 0.007 0.012 0.003
25th percentile 1.00 1.00 1.00 0.80 0.79 0.76 0.65 0.80
50th percentile 1.00 1.00 1.00 1.00 1.00 1.00 0.76 1.00
75th percentile 1.00 1.00 1.00 1.00 1.00 1.00 1.00 1.00
Males Mean 0.972 0.968 0.945 0.923 0.893 0.913 0.836 0.933
Standard error 0.006 0.005 0.010 0.012 0.013 0.009 0.016 0.004
25th percentile 1.00 1.00 1.00 1.00 0.79 0.79 0.75 1.00
50th percentile 1.00 1.00 1.00 1.00 1.00 1.00 1.00 1.00
75th percentile 1.00 1.00 1.00 1.00 1.00 1.00 1.00 1.00
Females Mean 0.966 0.959 0.934 0.903 0.873 0.830 0.712 0.897
Standard error 0.006 0.005 0.009 0.011 0.012 0.011 0.016 0.004
25th percentile 1.00 1.00 1.00 0.79 0.74 0.70 0.54 0.79
50th percentile 1.00 1.00 1.00 1.00 1.00 1.00 0.71 1.00
75th percentile 1.00 1.00 1.00 1.00 1.00 1.00 1.00 1.00
Annex 1: EQ-5D Population Norms – National Surveys 131

Sweden
Source: Bjork et al. (1999)
Number of respondents
Age 18–24 25–34 35–44 45–54 55–64 65–74 75+ Total
Total 66 100 93 106 70 80 19 534
Males 29 55 40 55 36 43 6 264
Females 37 45 53 51 34 37 13 270
EQ VAS (self-rated health)
EQ-VAS (self-rated)
Age
Total18–24 25–34 35–44 45–54 55–64 65–74 75+
Total Mean 84.3 86.2 86.2 83.7 79.0 81.5 71.8 83.3
Standard error 2.1 1.4 1.5 1.7 2.4 1.8 5.4 0.7
25th percentile 80 80 80 75 70 72.5 55 75
50th percentile 90 90 90 90 85 85 70 90
75th percentile 95 98 95 96 90.75 94.5 99 95
Males Mean 85.7 85.7 87.7 83.2 79.9 83.9 84.2 84.4
Standard error 2.8 1.6 1.9 2.2 3.1 2.3 6.4 0.9
25th percentile 80 80 80 72.5 73.75 77 70 79.25
50th percentile 90 90 90 90 80 90 83 90
75th percentile 99 95 95.25 95 91.25 95 99.25 95
Females Mean 83.2 86.7 85.0 84.1 78.1 78.4 66.2 82.2
Standard error 3.0 2.3 2.1 2.6 3.9 2.9 7.0 1.1
25th percentile 77.5 77.5 80 80 66.25 62.5 50 75
50th percentile 90 94 90 90 87.5 80 61 90
75th percentile 95 99.5 95 100 92.25 90 89.5 95
132 Annex 1: EQ-5D Population Norms – National Surveys

Problemsreported
bydim
ension
Age
Total
18–24
25–34
35–44
45–54
55–64
65–74
75+
n%
n%
n%
n%
n%
n%
n%
Mobility
Noproblems
64
98.5
95
97.9
88
95.7
92
88.5
62
92.5
67
85.9
947.4
Someproblems
11.5
22.1
44.3
12
11.5
57.5
11
14.1
10
52.6
Confined
tobed
00.0
00.0
00.0
00.0
00.0
00.0
00.0
Self-care
Noproblems
65
100.0
96
99.0
92
100.0
102
98.1
66
98.5
77
98.7
16
84.2
Someproblems
00.0
11.0
00.0
21.9
11.5
11.3
315.8
Unable
to0
0.0
00.0
00.0
00.0
00.0
00.0
00.0
Usual
activities
Noproblems
63
96.9
92
94.8
88
95.7
92
88.5
59
88.1
73
94.8
13
68.4
Someproblems
11.5
33.1
44.3
87.7
57.5
45.2
421.1
Unable
to1
1.5
22.1
00.0
43.8
34.5
00.0
210.5
Pain/discomfort
No
50
76.9
68
70.1
57
62.0
59
56.7
33
49.3
36
45.6
633.3
Some
15
23.1
29
29.9
34
37.0
40
38.5
31
46.3
43
54.4
10
55.6
Extrem
e0
0.0
00.0
11.1
54.8
34.5
00.0
211.1
Anxiety/depression
No
44
67.7
77
79.4
69
75.0
74
71.8
46
68.7
61
79.2
13
72.2
Some
19
29.2
18
18.6
22
23.9
27
26.2
20
29.9
15
19.5
422.2
Extrem
e2
3.1
22.1
11.1
21.9
11.5
11.3
15.6
(continued)
Annex 1: EQ-5D Population Norms – National Surveys 133

Age
Males
18–24
25–34
35–44
45–54
55–64
65–74
75+
n%
n%
n%
n%
n%
n%
n%
Mobility
Noproblems
27
96.4
55
100.0
38
97.4
47
87.0
32
91.4
39
90.7
350.0
Someproblems
13.6
00.0
12.6
713.0
38.6
49.3
350.0
Confined
tobed
00.0
00.0
00.0
00.0
00.0
00.0
00.0
Self-care
Noproblems
28
100.0
55
100.0
39
100.0
53
98.1
34
97.1
42
100.0
6100.0
Someproblems
00.0
00.0
00.0
11.9
12.9
00.0
00.0
Unable
to0
0.0
00.0
00.0
00.0
00.0
00.0
00.0
Usual
activities
Noproblems
27
96.4
52
94.5
38
97.4
47
87.0
30
85.7
39
95.1
583.3
Someproblems
13.6
23.6
12.6
47.4
38.6
24.9
116.7
Unable
to0
0.0
11.8
00.0
35.6
25.7
00.0
00.0
Pain/discomfort
No
21
75.0
39
70.9
22
56.4
31
57.4
19
54.3
23
53.5
120.0
Some
725.0
16
29.1
17
43.6
21
38.9
14
40.0
20
46.5
480.0
Extrem
e0
0.0
00.0
00.0
23.7
25.7
00.0
00.0
Anxiety/depression
No
22
78.6
45
81.8
30
76.9
40
75.5
25
71.4
36
87.8
5100.0
Some
517.9
916.4
923.1
12
22.6
925.7
512.2
00.0
Extrem
e1
3.6
11.8
00.0
11.9
12.9
00.0
00.0
(continued)
134 Annex 1: EQ-5D Population Norms – National Surveys

Age
Fem
ales
18–24
25–34
35–44
45–54
55–64
65–74
75+
n%
n%
n%
n%
n%
n%
n%
Mobility
Noproblems
37
100.0
40
95.2
50
94.3
45
90.0
30
93.8
28
80.0
646.2
Someproblems
00.0
24.8
35.7
510.0
26.3
720.0
753.8
Confined
tobed
00.0
00.0
00.0
00.0
00.0
00.0
00.0
Self-care
Noproblems
37
100.0
41
97.6
53
100.0
49
98.0
32
100.0
35
97.2
10
76.9
Someproblems
00.0
12.4
00.0
12.0
00.0
12.8
323.1
Unable
to0
0.0
00.0
00.0
00.0
00.0
00.0
00.0
Usual
activities
Noproblems
36
97.3
40
95.2
50
94.3
45
90.0
29
90.6
34
94.4
861.5
Someproblems
00.0
12.4
35.7
48.0
26.3
25.6
323.1
Unable
to1
2.7
12.4
00.0
12.0
13.1
00.0
215.4
Pain/discomfort
No
29
78.4
29
69.0
35
66.0
28
56.0
14
43.8
13
36.1
538.5
Some
821.6
13
31.0
17
32.1
19
38.0
17
53.1
23
63.9
646.2
Extrem
e0
0.0
00.0
11.9
36.0
13.1
00.0
215.4
Anxiety/depression
No
22
59.5
32
76.2
39
73.6
34
68.0
21
65.6
25
69.4
861.5
Some
14
37.8
921.4
13
24.5
15
30.0
11
34.4
10
27.8
430.8
Extrem
e1
2.7
12.4
11.9
12.0
00.0
12.8
17.7
Annex 1: EQ-5D Population Norms – National Surveys 135

EQ-5D index value (European VAS value set)
EQ-5D index value
(European VAS)
Age
Total18–24 25–34 35–44 45–54 55–64 65–74 75+
Total Mean 0.888 0.893 0.868 0.835 0.813 0.836 0.701 0.851
Standard error 0.020 0.016 0.015 0.020 0.023 0.016 0.068 0.008
25th percentile 0.78 0.78 0.78 0.69 0.69 0.78 0.60 0.78
50th percentile 1.00 1.00 0.89 1.00 0.78 0.78 0.75 0.81
75th percentile 1.00 1.00 1.00 1.00 1.00 1.00 1.00 1.00
Males Mean 0.899 0.901 0.864 0.841 0.814 0.872 0.778 0.864
Standard error 0.030 0.020 0.020 0.029 0.034 0.019 0.057 0.010
25th percentile 0.78 0.78 0.78 0.73 0.69 0.78 0.70 0.78
50th percentile 1.00 1.00 0.78 1.00 0.78 0.78 0.71 1.00
75th percentile 1.00 1.00 1.00 1.00 1.00 1.00 0.89 1.00
Females Mean 0.879 0.883 0.871 0.828 0.812 0.794 0.671 0.838
Standard error 0.026 0.025 0.022 0.028 0.031 0.025 0.091 0.011
25th percentile 0.78 0.78 0.78 0.69 0.69 0.69 0.39 0.71
50th percentile 1.00 1.00 1.00 0.79 0.78 0.78 0.78 0.78
75th percentile 1.00 1.00 1.00 1.00 1.00 1.00 1.00 1.00
136 Annex 1: EQ-5D Population Norms – National Surveys
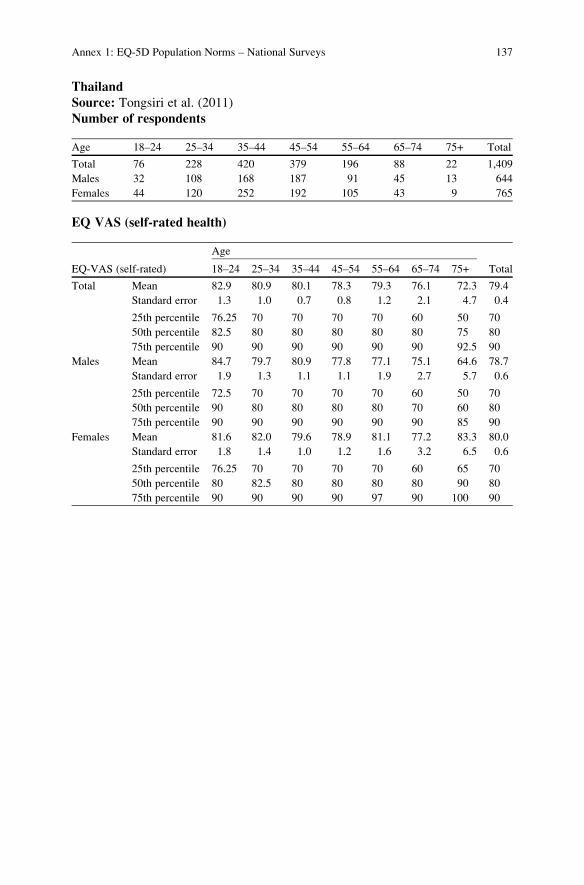
Thailand
Source: Tongsiri et al. (2011)
Number of respondents
Age 18–24 25–34 35–44 45–54 55–64 65–74 75+ Total
Total 76 228 420 379 196 88 22 1,409
Males 32 108 168 187 91 45 13 644
Females 44 120 252 192 105 43 9 765
EQ VAS (self-rated health)
EQ-VAS (self-rated)
Age
Total18–24 25–34 35–44 45–54 55–64 65–74 75+
Total Mean 82.9 80.9 80.1 78.3 79.3 76.1 72.3 79.4
Standard error 1.3 1.0 0.7 0.8 1.2 2.1 4.7 0.4
25th percentile 76.25 70 70 70 70 60 50 70
50th percentile 82.5 80 80 80 80 80 75 80
75th percentile 90 90 90 90 90 90 92.5 90
Males Mean 84.7 79.7 80.9 77.8 77.1 75.1 64.6 78.7
Standard error 1.9 1.3 1.1 1.1 1.9 2.7 5.7 0.6
25th percentile 72.5 70 70 70 70 60 50 70
50th percentile 90 80 80 80 80 70 60 80
75th percentile 90 90 90 90 90 90 85 90
Females Mean 81.6 82.0 79.6 78.9 81.1 77.2 83.3 80.0
Standard error 1.8 1.4 1.0 1.2 1.6 3.2 6.5 0.6
25th percentile 76.25 70 70 70 70 60 65 70
50th percentile 80 82.5 80 80 80 80 90 80
75th percentile 90 90 90 90 97 90 100 90
Annex 1: EQ-5D Population Norms – National Surveys 137

Problemsreported
bydim
ension
Age
Total
18–24
25–34
35–44
45–54
55–64
65–74
75+
n%
n%
n%
n%
n%
n%
n%
Mobility
Noproblems
68
89.5
194
85.1
341
81.2
257
67.8
126
64.3
43
48.9
940.9
Someproblems
810.5
32
14.0
77
18.3
122
32.2
68
34.7
45
51.1
12
54.5
Confined
tobed
00.0
20.9
20.5
00.0
21.0
00.0
14.5
Self-care
Noproblems
72
94.7
221
96.9
397
94.5
330
87.1
173
88.3
75
85.2
19
86.4
Someproblems
33.9
73.1
21
5.0
40
10.6
20
10.2
11
12.5
29.1
Unable
to1
1.3
00.0
20.5
92.4
31.5
22.3
14.5
Usual
activities
Noproblems
58
76.3
190
83.3
342
81.4
283
74.7
148
75.5
57
64.8
11
50.0
Someproblems
18
23.7
35
15.4
69
16.4
82
21.6
43
21.9
25
28.4
940.9
Unable
to0
0.0
31.3
92.1
14
3.7
52.6
66.8
29.1
Pain/discomfort
No
41
53.9
98
43.0
164
39.0
113
29.8
51
26.0
20
22.7
627.3
Some
35
46.1
126
55.3
249
59.3
260
68.6
133
67.9
67
76.1
15
68.2
Extrem
e0
0.0
41.8
71.7
61.6
12
6.1
11.1
14.5
Anxiety/depression
No
47
61.8
128
56.1
238
56.7
183
48.3
90
45.9
43
48.9
12
54.5
Some
28
36.8
97
42.5
177
42.1
188
49.6
95
48.5
40
45.5
836.4
Extrem
e1
1.3
31.3
51.2
82.1
11
5.6
55.7
29.1
138 Annex 1: EQ-5D Population Norms – National Surveys

Age
Males
18–24
25–34
35–44
45–54
55–64
65–74
75+
n%
n%
n%
n%
n%
n%
n%
Mobility
Noproblems
29
90.6
91
84.3
142
84.5
127
67.9
70
76.9
22
48.9
646.2
Someproblems
39.4
16
14.8
26
15.5
60
32.1
20
22.0
23
51.1
646.2
Confined
tobed
00.0
10.9
00.0
00.0
11.1
00.0
17.7
Self-care
Noproblems
31
96.9
103
95.4
157
93.5
162
86.6
81
89.0
40
88.9
11
84.6
Someproblems
13.1
54.6
10
6.0
19
10.2
77.7
48.9
17.7
Unable
to0
0.0
00.0
10.6
63.2
33.3
12.2
17.7
Usual
activities
Noproblems
26
81.3
89
82.4
139
82.7
132
70.6
73
80.2
29
64.4
646.2
Someproblems
618.8
17
15.7
27
16.1
50
26.7
16
17.6
14
31.1
538.5
Unable
to0
0.0
21.9
21.2
52.7
22.2
24.4
215.4
Pain/discomfort
No
20
62.5
55
50.9
76
45.2
56
29.9
30
33.0
715.6
323.1
Some
12
37.5
50
46.3
90
53.6
127
67.9
59
64.8
38
84.4
969.2
Extrem
e0
0.0
32.8
21.2
42.1
22.2
00.0
17.7
Anxiety/depression
No
25
78.1
59
54.6
116
69.0
92
49.2
51
56.0
20
44.4
646.2
Some
721.9
48
44.4
50
29.8
93
49.7
37
40.7
24
53.3
538.5
Extrem
e0
0.0
10.9
21.2
21.1
33.3
12.2
215.4
(continued)
Annex 1: EQ-5D Population Norms – National Surveys 139

Age
Fem
ales
18–24
25–34
35–44
45–54
55–64
65–74
75+
n%
n%
n%
n%
n%
n%
n%
Mobility
Noproblems
39
88.6
103
85.8
199
79.0
130
67.7
56
53.3
21
48.8
333.3
Someproblems
511.4
16
13.3
51
20.2
62
32.3
48
45.7
22
51.2
666.7
Confined
tobed
00.0
10.8
20.8
00.0
11.0
00.0
00.0
Self-care
Noproblems
41
93.2
118
98.3
240
95.2
168
87.5
92
87.6
35
81.4
888.9
Someproblems
24.5
21.7
11
4.4
21
10.9
13
12.4
716.3
111.1
Unable
to1
2.3
00.0
10.4
31.6
00.0
12.3
00.0
Usual
activities
Noproblems
32
72.7
101
84.2
203
80.6
151
78.6
75
71.4
28
65.1
555.6
Someproblems
12
27.3
18
15.0
42
16.7
32
16.7
27
25.7
11
25.6
444.4
Unable
to0
0.0
10.8
72.8
94.7
32.9
49.3
00.0
Pain/discomfort
No
21
47.7
43
35.8
88
34.9
57
29.7
21
20.0
13
30.2
333.3
Some
23
52.3
76
63.3
159
63.1
133
69.3
74
70.5
29
67.4
666.7
Extrem
e0
0.0
10.8
52.0
21.0
10
9.5
12.3
00.0
Anxiety/depression
No
22
50.0
69
57.5
122
48.4
91
47.4
39
37.1
23
53.5
666.7
Some
21
47.7
49
40.8
127
50.4
95
49.5
58
55.2
16
37.2
333.3
Extrem
e1
2.3
21.7
31.2
63.1
87.6
49.3
00.0
(continued)
140 Annex 1: EQ-5D Population Norms – National Surveys

EQ-5D index value (European VAS value set)
EQ-5D index value
(European VAS)
Age
Total18–24 25–34 35–44 45–54 55–64 65–74 75+
Total Mean 0.814 0.785 0.771 0.717 0.694 0.670 0.657 0.742
Standard error 0.019 0.011 0.008 0.009 0.014 0.021 0.046 0.005
25th percentile 0.69 0.69 0.69 0.62 0.60 0.60 0.60 0.66
50th percentile 0.78 0.78 0.78 0.69 0.69 0.69 0.69 0.71
75th percentile 1.00 1.00 1.00 0.78 0.78 0.78 0.78 0.81
Males Mean 0.855 0.786 0.803 0.717 0.733 0.669 0.609 0.754
Standard error 0.023 0.017 0.013 0.013 0.020 0.022 0.069 0.007
25th percentile 0.76 0.69 0.69 0.62 0.69 0.61 0.49 0.69
50th percentile 0.78 0.78 0.78 0.69 0.75 0.69 0.69 0.76
75th percentile 1.00 1.00 1.00 0.78 0.78 0.77 0.75 0.85
Females Mean 0.785 0.784 0.750 0.717 0.660 0.670 0.726 0.732
Standard error 0.028 0.015 0.011 0.014 0.020 0.037 0.049 0.007
25th percentile 0.69 0.69 0.69 0.62 0.60 0.60 0.64 0.66
50th percentile 0.78 0.78 0.71 0.69 0.66 0.71 0.71 0.71
75th percentile 1.00 1.00 0.81 0.78 0.78 0.78 0.81 0.78
EQ-5D index value (TTO value set)
EQ-5D index value
(TTO value set)
Age
Total18–24 25–34 35–44 45–54 55–64 65–74 75+
Total Mean 0.785 0.756 0.740 0.678 0.653 0.617 0.575 0.706
Standard error 0.021 0.013 0.009 0.010 0.016 0.022 0.055 0.005
25th percentile 0.69 0.69 0.64 0.57 0.55 0.51 0.51 0.61
50th percentile 0.73 0.73 0.70 0.69 0.69 0.62 0.60 0.69
75th percentile 1.00 1.00 1.00 0.73 0.73 0.73 0.70 0.77
Males Mean 0.820 0.757 0.769 0.674 0.695 0.613 0.528 0.716
Standard error 0.028 0.019 0.014 0.014 0.022 0.024 0.083 0.008
25th percentile 0.68 0.68 0.67 0.57 0.57 0.55 0.48 0.61
50th percentile 0.77 0.73 0.73 0.69 0.69 0.61 0.55 0.69
75th percentile 1.00 1.00 1.00 0.73 0.77 0.69 0.69 0.77
Females Mean 0.760 0.755 0.720 0.682 0.616 0.621 0.641 0.698
Standard error 0.030 0.017 0.012 0.014 0.023 0.038 0.057 0.007
25th percentile 0.69 0.69 0.64 0.57 0.51 0.50 0.55 0.61
50th percentile 0.73 0.73 0.69 0.69 0.61 0.64 0.61 0.69
75th percentile 1.00 1.00 0.77 0.73 0.73 0.73 0.73 0.77
Annex 1: EQ-5D Population Norms – National Surveys 141
United Kingdom
Source: Kind et al. (1998)
Number of respondents
Age 18–24 25–34 35–44 45–54 55–64 65–74 75+ Total
Total 304 753 561 488 484 488 317 3,395
Males 128 330 256 221 196 228 110 1,469
Females 176 423 305 267 288 260 207 1,926
EQ VAS (self-rated health)
EQ-VAS (self-rated)
Age
Total18–24 25–34 35–44 45–54 55–64 65–74 75+
Total Mean 86.5 86.8 86.6 82.0 81.6 77.3 73.8 82.8
Standard error 0.8 0.5 0.6 0.8 2.1 0.8 1.1 0.4
25th percentile 80 80 80 75 70 70 60 75
50th percentile 90 90 90 90 85 80 75 90
75th percentile 95 97 95 95 95 90 90 95
Males Mean 87.1 86.9 86.8 81.6 83.7 78.2 72.9 83.3
Standard error 1.2 0.8 0.8 1.3 4.9 1.2 1.8 0.8
25th percentile 80 80 82 75 70 70 60 75
50th percentile 90 90 90 90 85 80 75 90
75th percentile 98 96 95 95 93 90 85 95
Females Mean 86.0 86.8 86.4 82.4 80.3 76.6 74.2 82.4
Standard error 1.0 0.7 0.9 1.1 1.0 1.2 1.3 0.4
25th percentile 80 80 80 80 70 65 60 75
50th percentile 90 90 90 90 85 80 75.5 90
75th percentile 95 97 95 95 95 90 90 95
142 Annex 1: EQ-5D Population Norms – National Surveys
Problemsreported
bydim
ension
Age
Total
18–24
25–34
35–44
45–54
55–64
65–74
75+
n%
n%
n%
n%
n%
n%
n%
Mobility
Noproblems
292
96.4
705
93.8
517
92.3
413
84.6
360
74.7
318
65.2
160
50.8
Someproblems
11
3.6
46
6.1
43
7.7
73
15.0
122
25.3
170
34.8
155
49.2
Confined
tobed
00.0
10.1
00.0
20.4
00.0
00.0
00.0
Self-care
Noproblems
300
99.3
744
98.9
551
98.4
458
94.0
454
94.2
455
93.2
280
88.9
Someproblems
20.7
70.9
91.6
28
5.7
28
5.8
31
6.4
34
10.8
Unable
to0
0.0
10.1
00.0
10.2
00.0
20.4
10.3
Usual
activities
Noproblems
287
94.7
689
91.6
519
92.7
410
84.2
364
75.5
360
73.8
207
65.7
Someproblems
15
5.0
59
7.8
36
6.4
63
12.9
103
21.4
113
23.2
92
29.2
Unable
to1
0.3
40.5
50.9
14
2.9
15
3.1
15
3.1
16
5.1
Pain/discomfort
No
251
82.8
634
84.3
433
77.5
322
66.1
255
52.8
243
49.8
132
41.9
Some
51
16.8
109
14.5
119
21.3
145
29.8
196
40.6
213
43.6
155
49.2
Extrem
e1
0.3
91.2
71.3
20
4.1
32
6.6
32
6.6
28
8.9
Anxiety/depression
No
267
88.1
632
84.0
462
82.5
381
78.1
344
71.2
362
74.2
231
73.3
Some
33
10.9
113
15.0
93
16.6
93
19.1
127
26.3
111
22.7
78
24.8
Extrem
e3
1.0
70.9
50.9
14
2.9
12
2.5
15
3.1
61.9
(continued)
Annex 1: EQ-5D Population Norms – National Surveys 143
Age
Males
18–24
25–34
35–44
45–54
55–64
65–74
75+
n%
n%
n%
n%
n%
n%
n%
Mobility
Noproblems
120
93.8
311
94.2
233
91.4
186
84.2
133
68.2
154
67.5
63
57.8
Someproblems
86.3
18
5.5
22
8.6
33
14.9
62
31.8
74
32.5
46
42.2
Confined
tobed
00.0
10.3
00.0
20.9
00.0
00.0
00.0
Self-care
Noproblems
126
98.4
327
99.1
250
98.0
206
93.2
181
92.8
211
92.5
100
91.7
Someproblems
21.6
20.6
52.0
15
6.8
14
7.2
15
6.6
98.3
Unable
to0
0.0
10.3
00.0
00.0
00.0
20.9
00.0
Usual
activities
Noproblems
119
93.0
304
92.1
236
92.5
185
84.1
135
69.2
171
75.0
73
67.0
Someproblems
97.0
23
7.0
16
6.3
24
10.9
48
24.6
50
21.9
28
25.7
Unable
to0
0.0
30.9
31.2
11
5.0
12
6.2
73.1
87.3
Pain/discomfort
No
103
80.5
282
85.5
198
78.0
151
68.3
99
50.8
117
51.3
52
47.7
Some
25
19.5
44
13.3
52
20.5
60
27.1
83
42.6
94
41.2
50
45.9
Extrem
e0
0.0
41.2
41.6
10
4.5
13
6.7
17
7.5
76.4
Anxiety/depression
No
116
90.6
286
86.7
218
85.5
181
81.9
136
69.7
182
79.8
88
80.7
Some
11
8.6
40
12.1
35
13.7
32
14.5
54
27.7
37
16.2
17
15.6
Extrem
e1
0.8
41.2
20.8
83.6
52.6
93.9
43.7
(continued)
144 Annex 1: EQ-5D Population Norms – National Surveys

Age
Fem
ales
18–24
25–34
35–44
45–54
55–64
65–74
75+
n%
n%
n%
n%
n%
n%
n%
Mobility
Noproblems
172
98.3
394
93.4
284
93.1
227
85.0
227
79.1
164
63.1
97
47.1
Someproblems
31.7
28
6.6
21
6.9
40
15.0
60
20.9
96
36.9
109
52.9
Confined
tobed
00.0
00.0
00.0
00.0
00.0
00.0
00.0
Self-care
Noproblems
174
100.0
417
98.8
301
98.7
252
94.7
273
95.1
244
93.8
180
87.4
Someproblems
00.0
51.2
41.3
13
4.9
14
4.9
16
6.2
25
12.1
Unable
to0
0.0
00.0
00.0
10.4
00.0
00.0
10.5
Usual
activities
Noproblems
168
96.0
385
91.2
283
92.8
225
84.3
229
79.8
189
72.7
134
65.0
Someproblems
63.4
36
8.5
20
6.6
39
14.6
55
19.2
63
24.2
64
31.1
Unable
to1
0.6
10.2
20.7
31.1
31.0
83.1
83.9
Pain/discomfort
No
148
84.6
352
83.4
235
77.0
171
64.3
156
54.2
126
48.5
80
38.8
Some
26
14.9
65
15.4
67
22.0
85
32.0
113
39.2
119
45.8
105
51.0
Extrem
e1
0.6
51.2
31.0
10
3.8
19
6.6
15
5.8
21
10.2
Anxiety/depression
No
151
86.3
346
82.0
244
80.0
200
74.9
208
72.2
180
69.2
143
69.4
Some
22
12.6
73
17.3
58
19.0
61
22.8
73
25.3
74
28.5
61
29.6
Extrem
e2
1.1
30.7
31.0
62.2
72.4
62.3
21.0
Annex 1: EQ-5D Population Norms – National Surveys 145

EQ-5D index value (European VAS value set)
EQ-5D index value
(European VAS)
Age
Total18–24 25–34 35–44 45–54 55–64 65–74 75+
Total Mean 0.934 0.922 0.905 0.849 0.804 0.785 0.734 0.856
Standard error 0.007 0.005 0.006 0.010 0.010 0.010 0.013 0.003
25th percentile 0.96 0.78 0.78 0.78 0.69 0.69 0.62 0.76
50th percentile 1.00 1.00 1.00 1.00 0.78 0.78 0.75 1.00
75th percentile 1.00 1.00 1.00 1.00 1.00 1.00 1.00 1.00
Males Mean 0.929 0.927 0.909 0.851 0.783 0.791 0.761 0.860
Standard error 0.011 0.008 0.010 0.016 0.017 0.015 0.022 0.005
25th percentile 0.79 1.00 0.78 0.78 0.69 0.69 0.68 0.78
50th percentile 1.00 1.00 1.00 1.00 0.78 0.78 0.78 1.00
75th percentile 1.00 1.00 1.00 1.00 1.00 1.00 1.00 1.00
Females Mean 0.937 0.918 0.901 0.847 0.818 0.779 0.720 0.852
Standard error 0.009 0.007 0.009 0.012 0.012 0.013 0.015 0.004
25th percentile 1.00 0.78 0.78 0.78 0.69 0.69 0.60 0.75
50th percentile 1.00 1.00 1.00 1.00 0.78 0.78 0.71 1.00
75th percentile 1.00 1.00 1.00 1.00 1.00 1.00 0.85 1.00
EQ-5D index value (TTO value set)
EQ-5D index value
(TTO value set)
Age
Total18–24 25–34 35–44 45–54 55–64 65–74 75+
Total Mean 0.940 0.927 0.911 0.847 0.799 0.779 0.726 0.856
Standard error 0.007 0.006 0.007 0.011 0.012 0.012 0.015 0.004
25th percentile 0.97 0.85 0.85 0.80 0.73 0.69 0.66 0.80
50th percentile 1.00 1.00 1.00 1.00 0.85 0.80 0.76 1.00
75th percentile 1.00 1.00 1.00 1.00 1.00 1.00 1.00 1.00
Males Mean 0.935 0.930 0.914 0.845 0.777 0.781 0.753 0.858
Standard error 0.011 0.009 0.011 0.018 0.020 0.018 0.026 0.006
25th percentile 0.85 1.00 0.85 0.80 0.69 0.69 0.69 0.80
50th percentile 1.00 1.00 1.00 1.00 0.81 0.80 0.80 1.00
75th percentile 1.00 1.00 1.00 1.00 1.00 1.00 1.00 1.00
Females Mean 0.943 0.925 0.909 0.849 0.815 0.777 0.712 0.854
Standard error 0.009 0.007 0.009 0.014 0.015 0.016 0.019 0.005
25th percentile 1.00 0.85 0.85 0.80 0.73 0.69 0.63 0.76
50th percentile 1.00 1.00 1.00 1.00 0.85 0.80 0.73 1.00
75th percentile 1.00 1.00 1.00 1.00 1.00 1.00 0.89 1.00
146 Annex 1: EQ-5D Population Norms – National Surveys

EQ-5D index value (VAS value set)
EQ-5D index value
(VAS value set)
Age
Total18–24 25–34 35–44 45–54 55–64 65–74 75+
Total Mean 0.931 0.920 0.902 0.846 0.799 0.778 0.726 0.852
Standard error 0.007 0.005 0.007 0.010 0.010 0.010 0.012 0.003
25th percentile 0.95 0.78 0.78 0.76 0.69 0.66 0.63 0.74
50th percentile 1.00 1.00 1.00 1.00 0.78 0.76 0.73 1.00
75th percentile 1.00 1.00 1.00 1.00 1.00 1.00 1.00 1.00
Males Mean 0.925 0.925 0.907 0.848 0.779 0.784 0.752 0.856
Standard error 0.011 0.008 0.010 0.015 0.017 0.015 0.022 0.005
25th percentile 0.78 1.00 0.78 0.76 0.66 0.67 0.66 0.76
50th percentile 1.00 1.00 1.00 1.00 0.76 0.76 0.76 1.00
75th percentile 1.00 1.00 1.00 1.00 1.00 1.00 1.00 1.00
Females Mean 0.936 0.915 0.898 0.844 0.813 0.773 0.712 0.848
Standard error 0.009 0.007 0.009 0.012 0.012 0.013 0.015 0.004
25th percentile 1.00 0.78 0.78 0.76 0.70 0.66 0.60 0.73
50th percentile 1.00 1.00 1.00 1.00 0.78 0.76 0.70 1.00
75th percentile 1.00 1.00 1.00 1.00 1.00 1.00 0.84 1.00
Annex 1: EQ-5D Population Norms – National Surveys 147

United States
Source: Medical Expenditure Panel Survey; AHRQ (2000–2002)
Number of respondents
Age 18–24 25–34 35–44 45–54 55–64 65–74 75+ Total
Total 4,584 7,168 8,288 7,350 4,894 3,441 2,953 38,678
Males 2,125 3,359 3,799 3,427 2,303 1,508 1,177 17,698
Females 2,459 3,809 4,489 3,923 2,591 1,933 1,776 20,980
EQ VAS (self-rated health)
EQ-VAS (self-rated)
Age
Total18–24 25–34 35–44 45–54 55–64 65–74 75+
Total Mean 86.2 83.5 81.8 79.2 76.9 75.1 68.5 80.0
Standard error 0.3 0.2 0.2 0.2 0.3 0.4 0.5 0.1
25th percentile 80 80 75 72 70 65 53 73
50th percentile 90 88 85 84 80 80 72 85
75th percentile 95 94 92 90 90 90 84 91
Males Mean 88.0 84.5 82.9 79.6 77.8 75.3 69.2 81.0
Standard error 0.3 0.3 0.3 0.4 0.5 0.6 0.8 0.2
25th percentile 82 80 78 75 70 65 59 75
50th percentile 90 90 85 85 83 80 75 85
75th percentile 97 95 93 90 90 90 85 92
Females Mean 84.5 82.6 80.8 78.9 76.1 74.9 68.1 79.0
Standard error 0.4 0.3 0.3 0.3 0.5 0.5 0.6 0.2
25th percentile 80 80 75 71 70 65 51 70
50th percentile 90 85 85 82 80 80 70 84
75th percentile 95 92 91 90 90 90 82 90
148 Annex 1: EQ-5D Population Norms – National Surveys

Problemsreported
bydim
ension(raw
numbers,weightedproportions)
Age
Total
18–24
25–34
35–44
45–54
55–64
65–74
75+
n%
n%
n%
n%
n%
n%
n%
Mobility
Noproblems
4,357
95.4
6,673
93.6
7,384
89.8
5,862
80.7
3,468
73.6
2,116
62.6
1,235
42.1
Someproblems
207
4.4
466
6.0
877
10.0
1,455
19.0
1,400
26.0
1,302
36.8
1,668
56.6
Confined
tobed
20
0.3
29
0.3
27
0.2
33
0.3
26
0.4
23
0.6
50
1.3
Self-care
Noproblems
4,535
99.1
7,061
98.7
8,075
97.8
6,998
96.2
4,544
94.1
3,171
93.7
2,386
82.4
Someproblems
39
0.8
93
1.1
185
1.9
317
3.4
299
5.1
246
5.7
469
14.7
Unable
to10
0.2
14
0.2
28
0.3
35
0.3
51
0.8
24
0.5
98
2.9
Usual
activities
Noproblems
4,247
93.3
6,501
91.1
7,185
87.5
5,842
81.1
3,448
73.0
2,222
66.0
1,404
49.0
Someproblems
315
6.4
629
8.2
1,022
11.6
1,367
17.4
1,290
24.4
1,111
31.3
1,277
42.9
Unable
to22
0.4
38
0.6
81
0.9
141
1.5
156
2.6
108
2.8
272
8.1
Pain/discomfort
No
3,485
76.5
5,067
71.5
5,093
61.6
3,564
49.3
1,913
41.2
1,170
34.3
807
27.9
Some
1,049
22.6
1,971
26.7
2,921
35.5
3,395
46.0
2,621
52.5
2,068
60.3
1,899
64.9
Extrem
e50
0.9
130
1.8
274
2.9
391
4.7
360
6.3
203
5.5
247
7.3
Anxiety/depression
No
3,599
78.7
5,520
77.2
6,096
73.9
5,148
71.5
3,274
68.7
2,361
70.4
1,821
62.8
Some
887
19.3
1,495
20.9
1,973
23.9
1,967
25.8
1,454
28.3
993
27.3
1,037
34.2
Extrem
e98
2.0
153
1.9
219
2.2
235
2.8
166
3.0
87
2.3
95
3.0
(continued)
Annex 1: EQ-5D Population Norms – National Surveys 149
Age
Males
18–24
25–34
35–44
45–54
55–64
65–74
75+
n%
n%
n%
n%
n%
n%
n%
Mobility
Noproblems
2,031
95.7
3,156
94.1
3,453
91.6
2,823
83.0
1,696
75.5
963
65.4
544
44.2
Someproblems
85
4.0
190
5.5
335
8.2
584
16.6
597
24.3
531
33.8
615
54.6
Confined
tobed
90.3
13
0.4
11
0.2
20
0.4
10
0.2
14
0.9
18
1.2
Self-care
Noproblems
2,100
99.0
3,313
98.8
3,706
97.9
3,259
96.0
2,142
94.3
1,388
93.9
973
83.5
Someproblems
19
0.8
41
1.1
77
1.6
147
3.5
136
5.0
105
5.4
165
13.2
Unable
to6
0.2
50.2
16
0.4
21
0.4
25
0.7
15
0.7
39
3.2
Usual
activities
Noproblems
2,002
94.5
3,143
93.5
3,403
90.4
2,830
83.9
1,699
75.8
1,008
68.9
628
53.0
Someproblems
114
5.1
198
5.8
365
8.8
531
14.5
539
22.0
450
28.1
458
39.9
Unable
to9
0.4
18
0.7
31
0.9
66
1.6
65
2.2
50
3.0
91
7.2
Pain/discomfort
No
1,692
78.9
2,488
74.0
2,450
64.6
1,791
52.3
1,004
45.7
557
37.5
379
31.8
Some
409
20.3
815
24.2
1,244
33.0
1,483
43.7
1,147
48.7
873
57.9
730
62.6
Extrem
e24
0.8
56
1.8
105
2.4
153
4.1
152
5.6
78
4.6
68
5.6
Anxiety/depress
ion
No
1,769
83.4
2,758
80.8
3,009
78.6
2,560
74.8
1,646
73.2
1,087
74.0
777
67.2
Some
318
15.1
553
17.7
718
19.6
776
22.6
590
24.4
393
24.4
375
30.7
Extrem
e38
1.5
48
1.5
72
1.8
91
2.6
67
2.4
28
1.7
25
2.1
(continued)
150 Annex 1: EQ-5D Population Norms – National Surveys

Age
Fem
ales
18–24
25–34
35–44
45–54
55–64
65–74
75+
n%
n%
n%
n%
n%
n%
n%
Mobility
Noproblems
2,326
95.1
3,517
93.2
3,931
88.1
3,039
78.6
1,772
71.8
1,153
60.2
691
40.8
Someproblems
122
4.6
276
6.6
542
11.7
871
21.2
803
27.6
771
39.4
1,053
57.9
Confined
tobed
11
0.3
16
0.3
16
0.3
13
0.2
16
0.6
90.4
32
1.4
Self-care
Noproblems
2,435
99.1
3,748
98.7
4,369
97.8
3,739
96.4
2,402
94.0
1,783
93.6
1,413
81.7
Someproblems
20
0.7
52
1.1
108
2.1
170
3.4
163
5.1
141
6.0
304
15.7
Unable
to4
0.2
90.2
12
0.2
14
0.2
26
0.9
90.4
59
2.7
Usual
activities
Noproblems
2,245
92.1
3,358
88.9
3,782
84.8
3,012
78.5
1,749
70.3
1,214
63.5
776
46.3
Someproblems
201
7.6
431
10.6
657
14.3
836
20.0
751
26.7
661
33.8
819
44.9
Unable
to13
0.4
20
0.6
50
1.0
75
1.4
91
3.0
58
2.6
181
8.8
Pain/discomfort
No
1,793
74.1
2,579
69.2
2,643
58.8
1,773
46.5
909
37.0
613
31.6
428
25.2
Some
640
24.8
1,156
29.0
1,677
37.9
1,912
48.3
1,474
56.1
1,195
62.3
1,169
66.4
Extrem
e26
1.1
74
1.8
169
3.4
238
5.2
208
7.0
125
6.2
179
8.4
Anxiety/depression
No
1,830
74.2
2,762
73.8
3,087
69.4
2,588
68.4
1,628
64.5
1,274
67.4
1,044
59.8
Some
569
23.4
942
24.0
1,255
28.0
1,191
28.8
864
31.9
600
29.7
662
36.6
Extrem
e60
2.4
105
2.2
147
2.6
144
2.9
99
3.6
59
2.9
70
3.6
Annex 1: EQ-5D Population Norms – National Surveys 151

EQ-5D index value (European VAS value set)
EQ-5D index value
(European VAS)
Age
Total18–24 25–34 35–44 45–54 55–64 65–74 75+
Total Mean 0.899 0.883 0.851 0.809 0.773 0.752 0.676 0.823
Standard error 0.003 0.002 0.002 0.003 0.004 0.004 0.005 0.001
25th percentile 0.78 0.78 0.78 0.69 0.69 0.69 0.60 0.69
50th percentile 1.00 1.00 1.00 0.78 0.78 0.78 0.69 0.78
75th percentile 1.00 1.00 1.00 1.00 1.00 1.00 0.78 1.00
Males Mean 0.914 0.896 0.868 0.822 0.793 0.768 0.699 0.841
Standard error 0.004 0.004 0.003 0.004 0.005 0.006 0.008 0.002
25th percentile 0.78 0.78 0.78 0.71 0.69 0.69 0.60 0.75
50th percentile 1.00 1.00 1.00 0.78 0.78 0.78 0.71 1.00
75th percentile 1.00 1.00 1.00 1.00 1.00 1.00 0.78 1.00
Females Mean 0.885 0.872 0.836 0.797 0.754 0.739 0.660 0.806
Standard error 0.004 0.003 0.003 0.004 0.005 0.005 0.006 0.002
25th percentile 0.78 0.78 0.71 0.69 0.69 0.66 0.60 0.69
50th percentile 1.00 1.00 0.78 0.78 0.78 0.75 0.69 0.78
75th percentile 1.00 1.00 1.00 1.00 1.00 0.85 0.78 1.00
EQ-5D index value (TTO value set)
EQ-5D index value
(TTO value set)
Age
Total18–24 25–34 35–44 45–54 55–64 65–74 75+
Total Mean 0.925 0.912 0.888 0.855 0.827 0.813 0.754 0.866
Standard error 0.002 0.002 0.002 0.002 0.003 0.003 0.004 0.001
25th percentile 0.83 0.83 0.83 0.80 0.78 0.78 0.71 0.80
50th percentile 1.00 1.00 1.00 0.83 0.83 0.83 0.80 0.84
75th percentile 1.00 1.00 1.00 1.00 1.00 1.00 0.83 1.00
Males Mean 0.935 0.921 0.900 0.864 0.842 0.825 0.773 0.880
Standard error 0.003 0.003 0.003 0.003 0.004 0.005 0.007 0.001
25th percentile 0.84 0.83 0.83 0.81 0.80 0.78 0.71 0.82
50th percentile 1.00 1.00 1.00 0.84 0.83 0.83 0.81 1.00
75th percentile 1.00 1.00 1.00 1.00 1.00 1.00 0.84 1.00
Females Mean 0.914 0.904 0.877 0.846 0.812 0.803 0.741 0.854
Standard error 0.003 0.003 0.003 0.003 0.004 0.005 0.005 0.001
25th percentile 0.83 0.83 0.81 0.80 0.78 0.77 0.71 0.80
50th percentile 1.00 1.00 0.84 0.83 0.83 0.82 0.78 0.84
75th percentile 1.00 1.00 1.00 1.00 1.00 0.86 0.83 1.00
152 Annex 1: EQ-5D Population Norms – National Surveys
Annex 2: EQ-5D Population Norms – Regional
Surveys
Armenia (five regions)
Source: Gharagebakyan et al. (2003)
Number of respondents
Age 18–24 25–34 35–44 45–54 55–64 65–74 75+ Total
Total 297 339 473 414 227 287 180 2,217
Males 77 114 127 115 78 93 57 661
Females 220 225 346 299 149 194 123 1,556
EQ VAS (self-rated health)
EQ-VAS (self-rated)
Age
Total18–24 25–34 35–44 45–54 55–64 65–74 75+
Total Mean 87.8 78.4 68.0 62.3 55.3 50.1 43.8 65.7
Standard error 0.8 1.0 0.9 0.9 1.3 1.1 1.6 0.5
25th percentile 80 70 50 50 40 40 30 50
50th percentile 90 80 70 60 53 50 45 70
75th percentile 100 90 80 80 70 60 58 84
Males Mean 88.7 78.8 71.2 63.1 55.8 55.5 49.0 67.3
Standard error 1.6 2.1 1.8 2.0 2.3 2.1 2.7 0.9
25th percentile 80 65 60 50 40 40 40 50
50th percentile 95 85 78 65 60 60 50 70
75th percentile 100 100 90 80 70 70 60 90
Females Mean 87.5 78.1 66.9 62.1 55.0 47.5 41.5 65.0
Standard error 1.0 1.1 1.1 1.1 1.6 1.2 1.9 0.6
25th percentile 80 70 50 50 40 40 30 50
50th percentile 90 80 70 60 51 50 40 70
75th percentile 100 90 80 75 70 60 50 80
A. Szende et al. (eds.), Self-Reported Population Health: An International Perspectivebased on EQ-5D, DOI 10.1007/978-94-007-7596-1, © The Author(s) 2014
153
Problemsreported
bydim
ension
Age
Total
18–24
25–34
35–44
45–54
55–64
65–74
75+
n%
n%
n%
n%
n%
n%
n%
Mobility
Noproblems
283
95.3
296
87.3
397
83.9
321
77.5
128
56.4
127
44.3
58
32.2
Someproblems
13
4.4
42
12.4
74
15.6
92
22.2
95
41.9
149
51.9
111
61.7
Confined
tobed
10.3
10.3
20.4
10.2
41.8
11
3.8
11
6.1
Self-care
Noproblems
291
98.3
320
94.4
449
94.9
382
92.3
180
79.3
195
67.9
83
46.1
Someproblems
31.0
18
5.3
22
4.7
28
6.8
42
18.5
75
26.1
79
43.9
Unable
to2
0.7
10.3
20.4
41.0
52.2
17
5.9
18
10.0
Usual
activities
Noproblems
278
93.6
282
83.2
364
77.0
308
74.6
124
54.9
132
46.0
59
32.8
Someproblems
18
6.1
52
15.3
99
20.9
96
23.2
92
40.7
131
45.6
91
50.6
Unable
to1
0.3
51.5
10
2.1
92.2
10
4.4
24
8.4
30
16.7
Pain/discomfort
No
219
73.7
184
54.3
176
37.2
116
28.0
35
15.4
27
9.4
17
9.4
Some
71
23.9
138
40.7
259
54.8
246
59.4
143
63.0
181
63.1
109
60.6
Extrem
e7
2.4
17
5.0
38
8.0
52
12.6
49
21.6
79
27.5
54
30.0
Anxiety/depression
No
209
70.8
196
58.3
224
47.8
168
40.7
85
37.8
78
27.5
64
35.6
Some
81
27.5
123
36.6
205
43.7
202
48.9
100
44.4
143
50.4
72
40.0
Extrem
e5
1.7
17
5.1
40
8.5
43
10.4
40
17.8
63
22.2
44
24.4
154 Annex 2: EQ-5D Population Norms – Regional Surveys

Age
Males
18–24
25–34
35–44
45–54
55–64
65–74
75+
n%
n%
n%
n%
n%
n%
n%
Mobility
Noproblems
71
92.2
98
86.0
108
85.0
89
77.4
44
56.4
47
50.5
24
42.1
Someproblems
56.5
15
13.2
17
13.4
25
21.7
32
41.0
44
47.3
30
52.6
Confined
tobed
11.3
10.9
21.6
10.9
22.6
22.2
35.3
Self-care
Noproblems
73
94.8
104
91.2
120
94.5
101
87.8
58
74.4
63
67.7
31
54.4
Someproblems
22.6
97.9
75.5
12
10.4
18
23.1
26
28.0
21
36.8
Unable
to2
2.6
10.9
00.0
21.7
22.6
44.3
58.8
Usual
activities
Noproblems
67
87.0
91
79.8
103
81.1
81
70.4
42
53.8
43
46.2
25
43.9
Someproblems
911.7
21
18.4
19
15.0
28
24.3
32
41.0
39
41.9
27
47.4
Unable
to1
1.3
21.8
53.9
65.2
45.1
11
11.8
58.8
Pain/discomfort
No
64
83.1
72
63.2
59
46.5
41
35.7
18
23.1
15
16.1
814.0
Some
11
14.3
33
28.9
56
44.1
55
47.8
44
56.4
54
58.1
35
61.4
Extrem
e2
2.6
97.9
12
9.4
19
16.5
16
20.5
24
25.8
14
24.6
Anxiety/depression
No
55
72.4
73
64.0
67
53.2
54
47.0
36
46.2
30
33.0
26
45.6
Some
21
27.6
31
27.2
48
38.1
49
42.6
31
39.7
44
48.4
21
36.8
Extrem
e0
0.0
10
8.8
11
8.7
12
10.4
11
14.1
17
18.7
10
17.5
(continued)
Annex 2: EQ-5D Population Norms – Regional Surveys 155

Age
Fem
ales
18–24
25–34
35–44
45–54
55–64
65–74
75+
n%
n%
n%
n%
n%
n%
n%
Mobility
Noproblems
212
96.4
198
88.0
289
83.5
232
77.6
84
56.4
80
41.2
34
27.6
Someproblems
83.6
27
12.0
57
16.5
67
22.4
63
42.3
105
54.1
81
65.9
Confined
tobed
00.0
00.0
00.0
00.0
21.3
94.6
86.5
Self-care
Noproblems
218
99.5
216
96.0
329
95.1
281
94.0
122
81.9
132
68.0
52
42.3
Someproblems
10.5
94.0
15
4.3
16
5.4
24
16.1
49
25.3
58
47.2
Unable
to0
0.0
00.0
20.6
20.7
32.0
13
6.7
13
10.6
Usual
activities
Noproblems
211
95.9
191
84.9
261
75.4
227
76.2
82
55.4
89
45.9
34
27.6
Someproblems
94.1
31
13.8
80
23.1
68
22.8
60
40.5
92
47.4
64
52.0
Unable
to0
0.0
31.3
51.4
31.0
64.1
13
6.7
25
20.3
Pain/discomfort
No
155
70.5
112
49.8
117
33.8
75
25.1
17
11.4
12
6.2
97.3
Some
60
27.3
105
46.7
203
58.7
191
63.9
99
66.4
127
65.5
74
60.2
Extrem
e5
2.3
83.6
26
7.5
33
11.0
33
22.1
55
28.4
40
32.5
Anxiety/depression
No
154
70.3
123
55.4
157
45.8
114
38.3
49
33.3
48
24.9
38
30.9
Some
60
27.4
92
41.4
157
45.8
153
51.3
69
46.9
99
51.3
51
41.5
Extrem
e5
2.3
73.2
29
8.5
31
10.4
29
19.7
46
23.8
34
27.6
(continued)
156 Annex 2: EQ-5D Population Norms – Regional Surveys

EQ-5D index value (European VAS value set)
EQ-5D index value
(European VAS)
Age
Total18–24 25–34 35–44 45–54 55–64 65–74 75+
Total Mean 0.881 0.798 0.736 0.690 0.600 0.521 0.473 0.693
Standard error 0.010 0.012 0.010 0.011 0.017 0.016 0.021 0.006
25th percentile 0.78 0.69 0.66 0.61 0.48 0.28 0.18 0.60
50th percentile 1.00 0.78 0.75 0.69 0.68 0.60 0.49 0.69
75th percentile 1.00 1.00 1.00 0.78 0.78 0.69 0.69 1.00
Males Mean 0.887 0.804 0.752 0.699 0.620 0.546 0.537 0.704
Standard error 0.022 0.024 0.021 0.025 0.031 0.029 0.037 0.011
25th percentile 0.78 0.69 0.62 0.60 0.48 0.30 0.29 0.58
50th percentile 1.00 1.00 0.78 0.69 0.69 0.62 0.60 0.75
75th percentile 1.00 1.00 1.00 1.00 0.78 0.75 0.71 1.00
Females Mean 0.879 0.794 0.730 0.686 0.589 0.509 0.443 0.688
Standard error 0.011 0.013 0.011 0.012 0.020 0.019 0.026 0.006
25th percentile 0.78 0.69 0.66 0.62 0.45 0.26 0.15 0.60
50th percentile 1.00 0.78 0.69 0.69 0.66 0.60 0.48 0.69
75th percentile 1.00 1.00 0.85 0.78 0.75 0.69 0.66 0.78
Annex 2: EQ-5D Population Norms – Regional Surveys 157
Canada (Alberta)
Source: Johnson et al. (2000)
Number of respondents
Age 18–24 25–34 35–44 45–54 55–64 65–74 75+ Total
Total 459 861 1,073 991 850 478 298 5,010
Males 220 379 509 493 437 227 127 2,392
Females 239 482 564 498 413 251 171 2,618
EQ VAS (self-rated health)
EQ-VAS (self-rated)
Age
Total18–24 25–34 35–44 45–54 55–64 65–74 75+
Total Mean 81.6 80.5 78.7 75.7 77.1 77.1 75.3 78.3
Standard error 0.9 0.6 0.5 0.7 0.6 0.9 1.2 0.3
25th percentile 78 75 73 70 70 70 70 75
50th percentile 85 85 80 80 80 80 75 80
75th percentile 90 90 90 88 89 90 85 90
Males Mean 80.6 80.7 78.3 76.0 76.5 76.6 77.6 78.1
Standard error 1.4 0.8 0.7 0.9 0.8 1.4 1.5 0.4
25th percentile 75 75 70 70 70 70 70 73
50th percentile 85 85 80 80 80 80 80 80
75th percentile 90 90 90 85 85 90 85 90
Females Mean 82.6 80.3 79.2 75.4 77.7 77.6 73.6 78.5
Standard error 0.9 0.8 0.7 1.0 0.9 1.3 1.7 0.4
25th percentile 80 75 75 70 70 70 65 75
50th percentile 85 85 80 80 80 80 75 80
75th percentile 90 90 90 90 90 90 85 90
158 Annex 2: EQ-5D Population Norms – Regional Surveys

Problemsreported
bydim
ension
Age
Total
18–24
25–34
35–44
45–54
55–64
65–74
75+
n%
n%
n%
n%
n%
n%
n%
Mobility
Noproblems
424
91.7
785
91.4
940
89.0
781
79.2
660
79.5
325
69.3
156
51.9
Someproblems
33
7.7
73
8.2
125
10.5
207
20.7
182
20.0
147
30.4
141
48.1
Confined
tobed
20.5
20.4
50.5
20.1
40.5
30.2
00.0
Self-care
Noproblems
456
99.1
842
98.0
1,042
97.4
947
96.0
816
95.9
445
93.8
273
91.8
Someproblems
30.9
14
1.7
26
2.4
42
3.7
34
4.1
30
5.8
25
8.2
Unable
to0
0.0
30.3
20.2
20.2
00.0
20.4
00.0
Usual
activities
Noproblems
413
89.6
766
89.2
933
88.5
767
75.9
665
79.0
364
75.9
201
66.7
Someproblems
44
9.7
83
9.1
120
10.0
203
21.5
176
19.6
109
23.3
94
32.9
Unable
to2
0.7
12
1.6
14
1.5
20
2.6
91.4
40.8
30.4
Pain/discomfort
No
317
67.3
570
66.6
574
56.0
440
43.6
379
45.5
207
43.6
97
31.5
Some
138
31.7
267
30.9
465
41.8
498
51.2
435
50.3
248
51.5
185
63.3
Extrem
e4
1.1
22
2.6
28
2.2
52
5.2
36
4.2
22
4.9
16
5.2
Anxiety/depression
No
352
77.3
661
77.3
815
77.9
742
74.9
639
76.8
368
77.6
239
82.0
Some
97
20.7
178
20.9
227
20.0
218
22.8
186
21.7
100
20.6
53
17.4
Extrem
e9
2.0
18
1.8
23
2.1
22
2.3
17
1.5
61.8
10.6
(continued)
Annex 2: EQ-5D Population Norms – Regional Surveys 159
Age
Males
18–24
25–34
35–44
45–54
55–64
65–74
75+
n%
n%
n%
n%
n%
n%
n%
Mobility
Noproblems
204
91.8
338
89.7
450
91.3
393
82.6
340
79.3
160
72.8
74
55.4
Someproblems
16
8.2
39
9.9
56
8.6
99
17.4
94
20.7
66
27.2
53
44.6
Confined
tobed
00.0
10.5
10.1
00.0
00.0
00.0
00.0
Self-care
Noproblems
219
99.7
368
97.8
494
97.9
468
95.9
418
94.9
218
96.7
122
95.8
Someproblems
10.3
82.0
12
2.0
24
4.0
19
5.1
82.6
54.2
Unable
to0
0.0
10.1
10.1
10.1
00.0
10.7
00.0
Usual
activities
Noproblems
194
86.1
337
88.5
451
90.5
390
79.3
342
80.1
182
81.5
100
80.2
Someproblems
25
13.3
35
9.2
50
8.2
94
18.4
89
18.3
42
17.0
24
18.8
Unable
to1
0.6
72.3
51.2
92.4
61.6
21.5
31.0
Pain/discomfort
No
152
67.2
251
69.3
272
58.8
226
46.0
203
47.4
115
52.7
47
37.2
Some
65
31.4
119
29.1
224
40.1
249
50.8
213
47.5
104
43.8
75
60.6
Extrem
e3
1.3
81.6
10
1.1
17
3.2
21
5.0
83.5
52.2
Anxiety/depression
No
171
76.1
297
79.5
415
83.8
389
78.4
342
79.8
185
82.3
103
82.3
Some
44
22.4
67
17.8
83
14.6
93
20.0
83
18.8
38
16.2
23
17.7
Extrem
e5
1.5
13
2.7
71.6
71.6
71.4
31.6
00.0
(continued)
160 Annex 2: EQ-5D Population Norms – Regional Surveys

Age
Fem
ales
18–24
25–34
35–44
45–54
55–64
65–74
75+
n%
n%
n%
n%
n%
n%
n%
Mobility
Noproblems
220
91.7
447
93.0
490
86.5
388
76.0
320
79.8
165
66.2
82
49.4
Someproblems
17
7.3
34
6.6
69
12.5
108
23.9
88
19.1
81
33.4
88
50.6
Confined
tobed
21.1
10.4
41.0
20.1
41.0
30.5
00.0
Self-care
Noproblems
237
98.6
474
98.2
548
96.9
479
96.2
398
97.0
227
91.2
151
88.8
Someproblems
21.4
61.4
14
2.8
18
3.4
15
3.0
22
8.7
20
11.2
Unable
to0
0.0
20.4
10.3
10.4
00.0
10.1
00.0
Usual
activities
Noproblems
219
93.0
429
89.9
482
86.3
377
72.7
323
77.8
182
70.8
101
56.8
Someproblems
19
6.1
48
9.0
70
11.9
109
24.5
87
21.0
67
28.9
70
43.2
Unable
to1
0.8
51.0
91.8
11
2.8
31.1
20.2
00.0
Pain/discomfort
No
165
67.3
319
63.9
302
53.0
214
41.3
176
43.4
92
35.3
50
27.4
Some
73
31.9
148
32.6
241
43.6
249
51.6
222
53.3
144
58.6
110
65.3
Extrem
e1
0.8
14
3.5
18
3.4
35
7.1
15
3.3
14
6.1
11
7.3
Anxiety/depression
No
181
78.5
364
75.2
400
71.6
353
71.4
297
73.5
183
73.4
136
81.8
Some
53
19.0
111
23.9
144
25.8
125
25.6
103
24.8
62
24.6
30
17.1
Extrem
e4
2.5
50.9
16
2.6
15
2.9
10
1.6
32.0
11.0
Annex 2: EQ-5D Population Norms – Regional Surveys 161

EQ-5D index value (European VAS value set)
EQ-5D index value
(European VAS)
Age
Total18–24 25–34 35–44 45–54 55–64 65–74 75+
Total Mean 0.873 0.864 0.843 0.798 0.805 0.793 0.756 0.828
Standard error 0.009 0.007 0.007 0.008 0.008 0.010 0.012 0.003
25th percentile 0.779 0.779 0.779 0.690 0.690 0.690 0.687 0.713
50th percentile 1.000 1.000 0.783 0.779 0.779 0.779 0.753 0.783
75th percentile 1.00 1.00 1.00 1.00 1.00 1.00 0.81 1.00
Males Mean 0.871 0.871 0.866 0.814 0.811 0.826 0.784 0.842
Standard error 0.012 0.011 0.009 0.010 0.012 0.015 0.016 0.004
25th percentile 0.78 0.78 0.78 0.71 0.71 0.71 0.69 0.75
50th percentile 1.00 1.00 1.00 0.78 0.78 0.78 0.78 0.78
75th percentile 1.00 1.00 1.00 1.00 1.00 1.00 1.00 1.00
Females Mean 0.876 0.856 0.820 0.782 0.799 0.762 0.736 0.813
Standard error 0.013 0.010 0.010 0.012 0.011 0.014 0.017 0.005
25th percentile 0.78 0.78 0.71 0.69 0.69 0.69 0.69 0.71
50th percentile 1.00 0.81 0.78 0.78 0.78 0.78 0.71 0.78
75th percentile 1.00 1.00 1.00 1.00 1.00 1.00 0.78 1.00
162 Annex 2: EQ-5D Population Norms – Regional Surveys

Japan (three prefectures)
Source: Tsuchiya et al. (2002)
Number of respondents
Age 18–24 25–34 35–44 45–54 55–64 65–74 75+ Total
Total 41 99 109 136 128 80 27 620
Males 21 44 44 49 63 33 11 265
Females 20 55 65 87 65 47 16 355
EQ VAS (self-rated health)
EQ-VAS (self-rated)
Age
Total18–24 25–34 35–44 45–54 55–64 65–74 75+
Total Mean 78.9 77.9 79.3 79.8 76.8 76.6 67.7 77.8
Standard error 2.6 1.6 1.4 1.3 1.5 1.6 3.1 0.6
25th percentile 70 70 70 70 70 70 50 70
50th percentile 80 80 80 80 80 80 70 80
75th percentile 90 90 90 90 90 90 80 90
Males Mean 76.9 80.8 79.1 82.3 76.8 77.9 63.4 78.5
Standard error 3.9 2.1 1.8 2.2 2.4 2.2 4.8 1.0
25th percentile 65 75 70 72.5 70 70 50 70
50th percentile 80 80 80 90 80 80 60 80
75th percentile 87.5 90 90 90 90 81 80 90
Females Mean 81.0 75.7 79.4 78.4 76.7 75.7 70.8 77.3
Standard error 3.4 2.4 2.0 1.7 1.9 2.3 4.1 0.9
25th percentile 71.25 70 70 70 70 65 50 70
50th percentile 82.5 80 85 80 80 80 75 80
75th percentile 90 90 90 90 90 90 80 90
Annex 2: EQ-5D Population Norms – Regional Surveys 163

Problemsreported
bydim
ension
Age
Total
18–24
25–34
35–44
45–54
55–64
65–74
75+
n%
n%
n%
n%
n%
n%
n%
Mobility
Noproblems
40
97.6
97
98.0
109
100.0
134
98.5
115
89.8
62
77.5
18
66.7
Someproblems
12.4
22.0
00.0
21.5
13
10.2
18
22.5
933.3
Confined
tobed
00.0
00.0
00.0
00.0
00.0
00.0
00.0
Self-care
Noproblems
40
97.6
99
100.0
109
100.0
135
99.3
126
98.4
77
96.3
23
85.2
Someproblems
12.4
00.0
00.0
10.7
21.6
33.8
414.8
Unable
to0
0.0
00.0
00.0
00.0
00.0
00.0
00.0
Usual
activities
Noproblems
39
95.1
99
100.0
109
100.0
133
97.8
121
94.5
69
86.3
18
66.7
Someproblems
24.9
00.0
00.0
21.5
75.5
11
13.8
725.9
Unable
to0
0.0
00.0
00.0
10.7
00.0
00.0
27.4
Pain/discomfort
No
38
92.7
89
89.9
98
89.9
111
81.6
95
74.2
53
66.3
12
44.4
Some
24.9
88.1
11
10.1
23
16.9
29
22.7
27
33.8
14
51.9
Extrem
e1
2.4
22.0
00.0
21.5
43.1
00.0
13.7
Anxiety/depression
No
38
92.7
94
94.9
101
92.7
125
91.9
117
91.4
72
90.0
20
74.1
Some
37.3
55.1
87.3
85.9
97.0
810.0
725.9
Extrem
e0
0.0
00.0
00.0
32.2
21.6
00.0
00.0
164 Annex 2: EQ-5D Population Norms – Regional Surveys

Age
Males
18–24
25–34
35–44
45–54
55–64
65–74
75+
n%
n%
n%
n%
n%
n%
n%
Mobility
Noproblems
20
95.2
43
97.7
44
100.0
49
100.0
57
90.5
25
75.8
872.7
Someproblems
14.8
12.3
00.0
00.0
69.5
824.2
327.3
Confined
tobed
00.0
00.0
00.0
00.0
00.0
00.0
00.0
Self-care
Noproblems
20
95.2
44
100.0
44
100.0
49
100.0
62
98.4
33
100.0
10
90.9
Someproblems
14.8
00.0
00.0
00.0
11.6
00.0
19.1
Unable
to0
0.0
00.0
00.0
00.0
00.0
00.0
00.0
Usual
activities
Noproblems
20
95.2
44
100.0
44
100.0
48
98.0
61
96.8
28
84.8
872.7
Someproblems
14.8
00.0
00.0
12.0
23.2
515.2
327.3
Unable
to0
0.0
00.0
00.0
00.0
00.0
00.0
00.0
Pain/discomfort
No
20
95.2
39
88.6
43
97.7
45
91.8
51
81.0
26
78.8
654.5
Some
00.0
511.4
12.3
36.1
11
17.5
721.2
545.5
Extrem
e1
4.8
00.0
00.0
12.0
11.6
00.0
00.0
Anxiety/depression
No
21
100.0
42
95.5
42
95.5
44
89.8
59
93.7
31
93.9
872.7
Some
00.0
24.5
24.5
36.1
34.8
26.1
327.3
Extrem
e0
0.0
00.0
00.0
24.1
11.6
00.0
00.0
(continued)
Annex 2: EQ-5D Population Norms – Regional Surveys 165
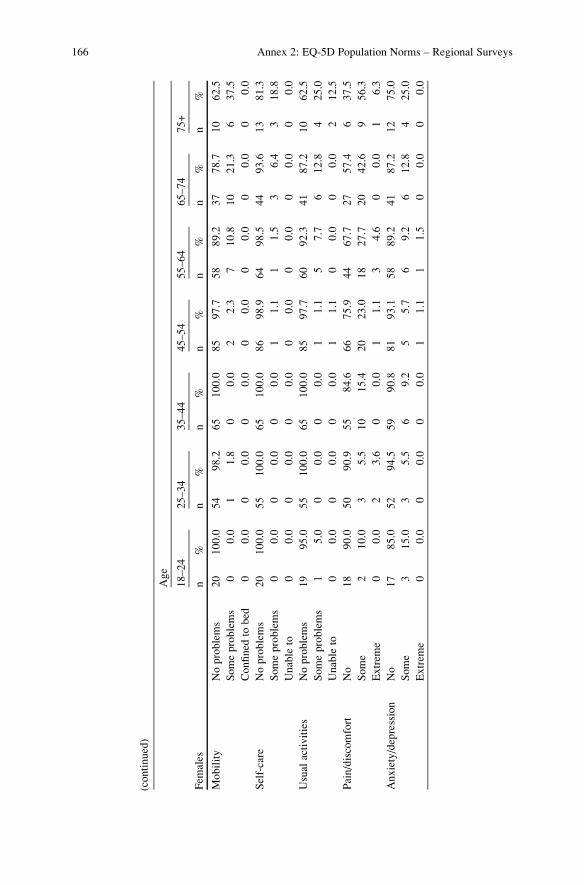
Age
Fem
ales
18–24
25–34
35–44
45–54
55–64
65–74
75+
n%
n%
n%
n%
n%
n%
n%
Mobility
Noproblems
20
100.0
54
98.2
65
100.0
85
97.7
58
89.2
37
78.7
10
62.5
Someproblems
00.0
11.8
00.0
22.3
710.8
10
21.3
637.5
Confined
tobed
00.0
00.0
00.0
00.0
00.0
00.0
00.0
Self-care
Noproblems
20
100.0
55
100.0
65
100.0
86
98.9
64
98.5
44
93.6
13
81.3
Someproblems
00.0
00.0
00.0
11.1
11.5
36.4
318.8
Unable
to0
0.0
00.0
00.0
00.0
00.0
00.0
00.0
Usual
activities
Noproblems
19
95.0
55
100.0
65
100.0
85
97.7
60
92.3
41
87.2
10
62.5
Someproblems
15.0
00.0
00.0
11.1
57.7
612.8
425.0
Unable
to0
0.0
00.0
00.0
11.1
00.0
00.0
212.5
Pain/discomfort
No
18
90.0
50
90.9
55
84.6
66
75.9
44
67.7
27
57.4
637.5
Some
210.0
35.5
10
15.4
20
23.0
18
27.7
20
42.6
956.3
Extrem
e0
0.0
23.6
00.0
11.1
34.6
00.0
16.3
Anxiety/depression
No
17
85.0
52
94.5
59
90.8
81
93.1
58
89.2
41
87.2
12
75.0
Some
315.0
35.5
69.2
55.7
69.2
612.8
425.0
Extrem
e0
0.0
00.0
00.0
11.1
11.5
00.0
00.0
(continued)
166 Annex 2: EQ-5D Population Norms – Regional Surveys
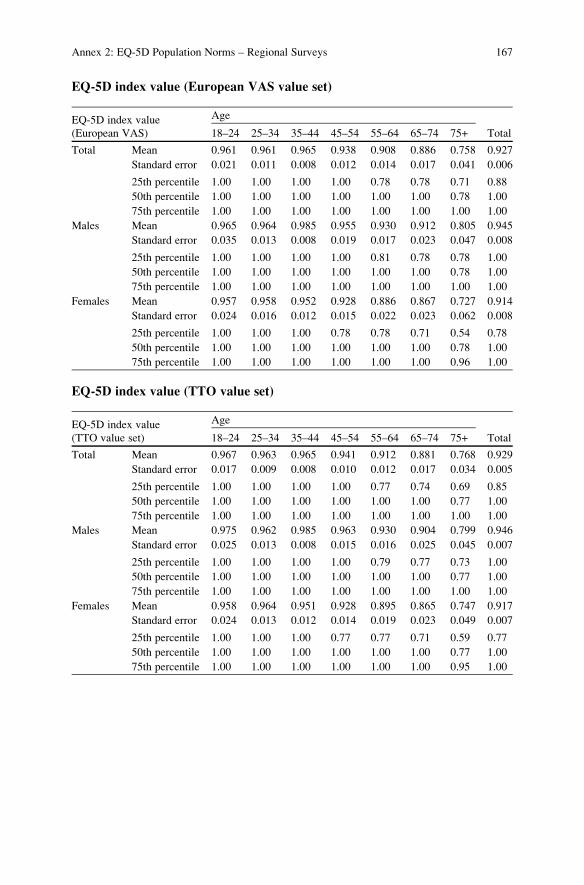
EQ-5D index value (European VAS value set)
EQ-5D index value
(European VAS)
Age
Total18–24 25–34 35–44 45–54 55–64 65–74 75+
Total Mean 0.961 0.961 0.965 0.938 0.908 0.886 0.758 0.927
Standard error 0.021 0.011 0.008 0.012 0.014 0.017 0.041 0.006
25th percentile 1.00 1.00 1.00 1.00 0.78 0.78 0.71 0.88
50th percentile 1.00 1.00 1.00 1.00 1.00 1.00 0.78 1.00
75th percentile 1.00 1.00 1.00 1.00 1.00 1.00 1.00 1.00
Males Mean 0.965 0.964 0.985 0.955 0.930 0.912 0.805 0.945
Standard error 0.035 0.013 0.008 0.019 0.017 0.023 0.047 0.008
25th percentile 1.00 1.00 1.00 1.00 0.81 0.78 0.78 1.00
50th percentile 1.00 1.00 1.00 1.00 1.00 1.00 0.78 1.00
75th percentile 1.00 1.00 1.00 1.00 1.00 1.00 1.00 1.00
Females Mean 0.957 0.958 0.952 0.928 0.886 0.867 0.727 0.914
Standard error 0.024 0.016 0.012 0.015 0.022 0.023 0.062 0.008
25th percentile 1.00 1.00 1.00 0.78 0.78 0.71 0.54 0.78
50th percentile 1.00 1.00 1.00 1.00 1.00 1.00 0.78 1.00
75th percentile 1.00 1.00 1.00 1.00 1.00 1.00 0.96 1.00
EQ-5D index value (TTO value set)
EQ-5D index value
(TTO value set)
Age
Total18–24 25–34 35–44 45–54 55–64 65–74 75+
Total Mean 0.967 0.963 0.965 0.941 0.912 0.881 0.768 0.929
Standard error 0.017 0.009 0.008 0.010 0.012 0.017 0.034 0.005
25th percentile 1.00 1.00 1.00 1.00 0.77 0.74 0.69 0.85
50th percentile 1.00 1.00 1.00 1.00 1.00 1.00 0.77 1.00
75th percentile 1.00 1.00 1.00 1.00 1.00 1.00 1.00 1.00
Males Mean 0.975 0.962 0.985 0.963 0.930 0.904 0.799 0.946
Standard error 0.025 0.013 0.008 0.015 0.016 0.025 0.045 0.007
25th percentile 1.00 1.00 1.00 1.00 0.79 0.77 0.73 1.00
50th percentile 1.00 1.00 1.00 1.00 1.00 1.00 0.77 1.00
75th percentile 1.00 1.00 1.00 1.00 1.00 1.00 1.00 1.00
Females Mean 0.958 0.964 0.951 0.928 0.895 0.865 0.747 0.917
Standard error 0.024 0.013 0.012 0.014 0.019 0.023 0.049 0.007
25th percentile 1.00 1.00 1.00 0.77 0.77 0.71 0.59 0.77
50th percentile 1.00 1.00 1.00 1.00 1.00 1.00 0.77 1.00
75th percentile 1.00 1.00 1.00 1.00 1.00 1.00 0.95 1.00
Annex 2: EQ-5D Population Norms – Regional Surveys 167

Spain (Canary Islands)
Source: Canary Islands Health Survey (2009)
Number of respondents
Age 18–24 25–34 35–44 45–54 55–64 65–74 75+ Total
Total 290 705 1,021 798 624 568 462 4,468
Males 129 327 431 339 237 240 150 1,853
Females 161 378 590 459 387 328 312 2,615
EQ VAS (self-rated health)
EQ-VAS (self-rated)
Age
Total18–24 25–34 35–44 45–54 55–64 65–74 75+
Total Mean 83.3 79.7 77.4 71.6 66.1 64.4 56.4 71.7
Standard error 1.0 0.6 0.6 0.7 0.9 0.9 1.0 0.3
25th percentile 77.5 70 70 60 50 50 40 60
50th percentile 90 80 80 75 70 65 50 75
75th percentile 99.5 90 90 90 80 80 70 90
Males Mean 85.3 81.9 80.0 73.9 69.4 68.7 58.2 75.0
Standard error 1.3 0.9 0.8 1.0 1.4 1.3 1.8 0.5
25th percentile 80 70 70 60 50 50 50 60
50th percentile 90 80 80 80 70 70 60 80
75th percentile 100 95 90 90 80 80 70 90
Females Mean 81.7 77.8 75.4 69.8 64.0 61.2 55.5 69.3
Standard error 1.4 0.9 0.8 1.0 1.1 1.2 1.2 0.4
25th percentile 72.5 70 60 50 50 50 40 50
50th percentile 80 80 80 70 60 60 50 70
75th percentile 95 90 90 85 80 80 70 90
168 Annex 2: EQ-5D Population Norms – Regional Surveys

Problemsreported
bydim
ension
Age
Total
18–24
25–34
35–44
45–54
55–64
65–74
75+
n%
n%
n%
n%
n%
n%
n%
Mobility
Noproblems
285
98.3
683
97.0
969
95.3
706
88.5
492
78.8
368
64.8
197
42.6
Someproblems
51.7
19
2.7
46
4.5
85
10.7
129
20.7
193
34.0
239
51.7
Confined
tobed
00.0
20.3
20.2
70.9
30.5
71.2
26
5.6
Self-care
Noproblems
287
99.0
690
98.0
1,007
98.6
770
96.5
581
93.1
519
91.4
331
71.6
Someproblems
20.7
11
1.6
12
1.2
23
2.9
39
6.3
37
6.5
92
19.9
Unable
to1
0.3
30.4
20.2
50.6
40.6
12
2.1
39
8.4
Usual
activities
Noproblems
283
97.6
682
96.7
966
94.6
718
90.0
515
82.5
417
73.4
229
49.6
Someproblems
41.4
17
2.4
52
5.1
69
8.6
94
15.1
129
22.7
172
37.2
Unable
to3
1.0
60.9
30.3
11
1.4
15
2.4
22
3.9
61
13.2
Pain/discomfort
No
244
84.4
560
79.4
720
70.5
496
62.2
298
47.8
240
42.3
145
31.4
Some
42
14.5
131
18.6
254
24.9
244
30.6
238
38.1
250
44.0
232
50.2
Extrem
e3
1.0
14
2.0
47
4.6
58
7.3
88
14.1
78
13.7
85
18.4
Anxiety/depression
No
251
86.6
597
84.9
815
80.1
569
71.3
395
63.3
403
71.0
284
61.7
Some
34
11.7
89
12.7
175
17.2
177
22.2
172
27.6
130
22.9
141
30.7
Extrem
e5
1.7
17
2.4
27
2.7
52
6.5
57
9.1
35
6.2
35
7.6
(continued)
Annex 2: EQ-5D Population Norms – Regional Surveys 169
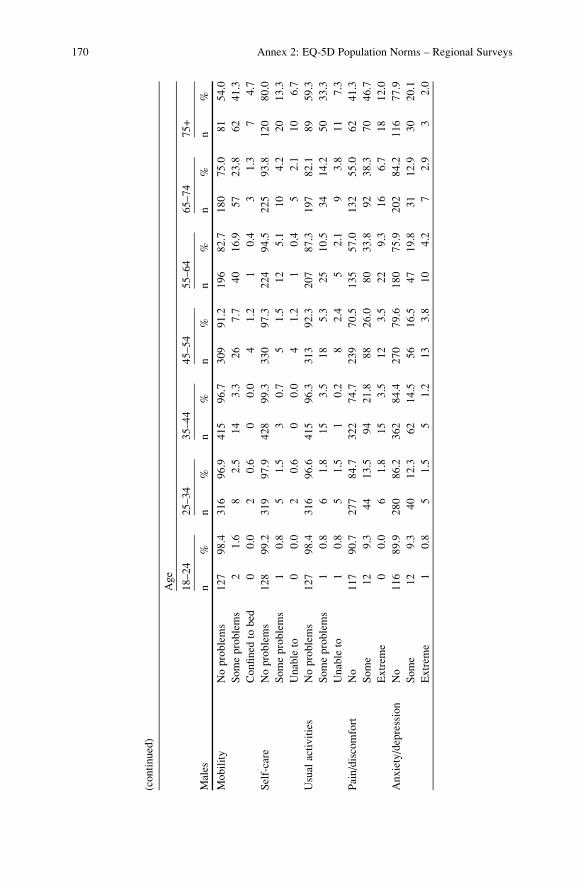
Age
Males
18–24
25–34
35–44
45–54
55–64
65–74
75+
n%
n%
n%
n%
n%
n%
n%
Mobility
Noproblems
127
98.4
316
96.9
415
96.7
309
91.2
196
82.7
180
75.0
81
54.0
Someproblems
21.6
82.5
14
3.3
26
7.7
40
16.9
57
23.8
62
41.3
Confined
tobed
00.0
20.6
00.0
41.2
10.4
31.3
74.7
Self-care
Noproblems
128
99.2
319
97.9
428
99.3
330
97.3
224
94.5
225
93.8
120
80.0
Someproblems
10.8
51.5
30.7
51.5
12
5.1
10
4.2
20
13.3
Unable
to0
0.0
20.6
00.0
41.2
10.4
52.1
10
6.7
Usual
activities
Noproblems
127
98.4
316
96.6
415
96.3
313
92.3
207
87.3
197
82.1
89
59.3
Someproblems
10.8
61.8
15
3.5
18
5.3
25
10.5
34
14.2
50
33.3
Unable
to1
0.8
51.5
10.2
82.4
52.1
93.8
11
7.3
Pain/discomfort
No
117
90.7
277
84.7
322
74.7
239
70.5
135
57.0
132
55.0
62
41.3
Some
12
9.3
44
13.5
94
21.8
88
26.0
80
33.8
92
38.3
70
46.7
Extrem
e0
0.0
61.8
15
3.5
12
3.5
22
9.3
16
6.7
18
12.0
Anxiety/depression
No
116
89.9
280
86.2
362
84.4
270
79.6
180
75.9
202
84.2
116
77.9
Some
12
9.3
40
12.3
62
14.5
56
16.5
47
19.8
31
12.9
30
20.1
Extrem
e1
0.8
51.5
51.2
13
3.8
10
4.2
72.9
32.0
(continued)
170 Annex 2: EQ-5D Population Norms – Regional Surveys

Age
Fem
ales
18–24
25–34
35–44
45–54
55–64
65–74
75+
n%
n%
n%
n%
n%
n%
n%
Mobility
Noproblems
158
98.1
367
97.1
554
94.2
397
86.5
296
76.5
188
57.3
116
37.2
Someproblems
31.9
11
2.9
32
5.4
59
12.9
89
23.0
136
41.5
177
56.7
Confined
tobed
00.0
00.0
20.3
30.7
20.5
41.2
19
6.1
Self-care
Noproblems
159
98.8
371
98.1
579
98.1
440
95.9
357
92.2
294
89.6
211
67.6
Someproblems
10.6
61.6
91.5
18
3.9
27
7.0
27
8.2
72
23.1
Unable
to1
0.6
10.3
20.3
10.2
30.8
72.1
29
9.3
Usual
activities
Noproblems
156
96.9
366
96.8
551
93.4
405
88.2
308
79.6
220
67.1
140
44.9
Someproblems
31.9
11
2.9
37
6.3
51
11.1
69
17.8
95
29.0
122
39.1
Unable
to2
1.2
10.3
20.3
30.7
10
2.6
13
4.0
50
16.0
Pain/discomfort
No
127
79.4
283
74.9
398
67.5
257
56.0
163
42.1
108
32.9
83
26.6
Some
30
18.8
87
23.0
160
27.1
156
34.0
158
40.8
158
48.2
162
51.9
Extrem
e3
1.9
82.1
32
5.4
46
10.0
66
17.1
62
18.9
67
21.5
Anxiety/depression
No
135
83.9
317
83.9
453
77.0
299
65.1
215
55.6
201
61.3
168
54.0
Some
22
13.7
49
13.0
113
19.2
121
26.4
125
32.3
99
30.2
111
35.7
Extrem
e4
2.5
12
3.2
22
3.7
39
8.5
47
12.1
28
8.5
32
10.3
Annex 2: EQ-5D Population Norms – Regional Surveys 171
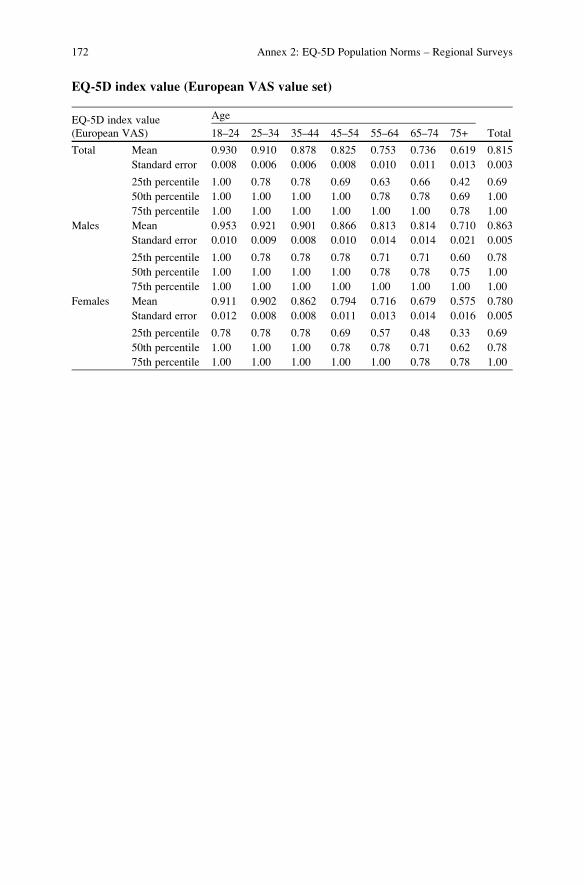
EQ-5D index value (European VAS value set)
EQ-5D index value
(European VAS)
Age
Total18–24 25–34 35–44 45–54 55–64 65–74 75+
Total Mean 0.930 0.910 0.878 0.825 0.753 0.736 0.619 0.815
Standard error 0.008 0.006 0.006 0.008 0.010 0.011 0.013 0.003
25th percentile 1.00 0.78 0.78 0.69 0.63 0.66 0.42 0.69
50th percentile 1.00 1.00 1.00 1.00 0.78 0.78 0.69 1.00
75th percentile 1.00 1.00 1.00 1.00 1.00 1.00 0.78 1.00
Males Mean 0.953 0.921 0.901 0.866 0.813 0.814 0.710 0.863
Standard error 0.010 0.009 0.008 0.010 0.014 0.014 0.021 0.005
25th percentile 1.00 0.78 0.78 0.78 0.71 0.71 0.60 0.78
50th percentile 1.00 1.00 1.00 1.00 0.78 0.78 0.75 1.00
75th percentile 1.00 1.00 1.00 1.00 1.00 1.00 1.00 1.00
Females Mean 0.911 0.902 0.862 0.794 0.716 0.679 0.575 0.780
Standard error 0.012 0.008 0.008 0.011 0.013 0.014 0.016 0.005
25th percentile 0.78 0.78 0.78 0.69 0.57 0.48 0.33 0.69
50th percentile 1.00 1.00 1.00 0.78 0.78 0.71 0.62 0.78
75th percentile 1.00 1.00 1.00 1.00 1.00 0.78 0.78 1.00
172 Annex 2: EQ-5D Population Norms – Regional Surveys
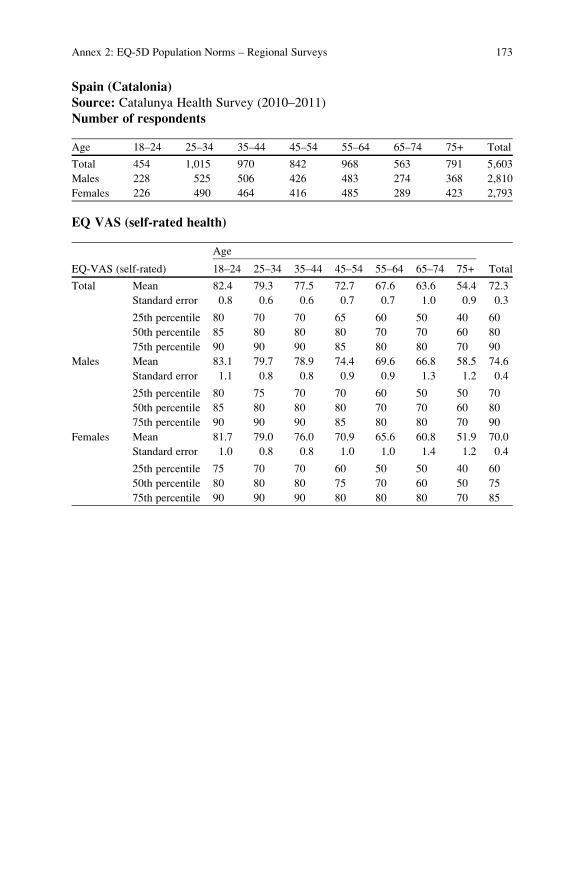
Spain (Catalonia)
Source: Catalunya Health Survey (2010–2011)
Number of respondents
Age 18–24 25–34 35–44 45–54 55–64 65–74 75+ Total
Total 454 1,015 970 842 968 563 791 5,603
Males 228 525 506 426 483 274 368 2,810
Females 226 490 464 416 485 289 423 2,793
EQ VAS (self-rated health)
EQ-VAS (self-rated)
Age
Total18–24 25–34 35–44 45–54 55–64 65–74 75+
Total Mean 82.4 79.3 77.5 72.7 67.6 63.6 54.4 72.3
Standard error 0.8 0.6 0.6 0.7 0.7 1.0 0.9 0.3
25th percentile 80 70 70 65 60 50 40 60
50th percentile 85 80 80 80 70 70 60 80
75th percentile 90 90 90 85 80 80 70 90
Males Mean 83.1 79.7 78.9 74.4 69.6 66.8 58.5 74.6
Standard error 1.1 0.8 0.8 0.9 0.9 1.3 1.2 0.4
25th percentile 80 75 70 70 60 50 50 70
50th percentile 85 80 80 80 70 70 60 80
75th percentile 90 90 90 85 80 80 70 90
Females Mean 81.7 79.0 76.0 70.9 65.6 60.8 51.9 70.0
Standard error 1.0 0.8 0.8 1.0 1.0 1.4 1.2 0.4
25th percentile 75 70 70 60 50 50 40 60
50th percentile 80 80 80 75 70 60 50 75
75th percentile 90 90 90 80 80 80 70 85
Annex 2: EQ-5D Population Norms – Regional Surveys 173

Problemsreported
bydim
ension(raw
numbers,weightedproportions)
Age
Total
18–24
25–34
35–44
45–54
55–64
65–74
75+
n%
n%
n%
n%
n%
n%
n%
Mobility
Noproblems
443
97.7
986
96.5
927
95.7
771
91.4
804
82.5
410
72.1
315
43.1
Someproblems
10
2.2
28
3.4
41
4.0
69
8.3
159
17.0
148
27.1
439
53.0
Confined
tobed
10.1
10.1
20.3
20.3
50.5
50.8
37
3.9
Self-care
Noproblems
450
99.1
1,003
98.7
958
99.0
821
97.3
932
96.3
519
91.8
527
70.7
Someproblems
30.8
91.0
10
0.7
17
2.2
32
3.4
37
7.2
153
17.9
Unable
to1
0.1
30.4
20.2
40.6
40.4
71.0
111
11.3
Usual
activities
Noproblems
450
98.9
984
96.5
938
96.8
787
93.2
860
87.5
472
83.1
420
56.5
Someproblems
41.1
23
2.5
29
2.9
44
5.4
95
10.9
70
13.3
206
24.9
Unable
to0
0.0
81.0
30.3
11
1.4
13
1.6
21
3.7
165
18.6
Pain/discomfort
No
403
88.6
869
85.2
774
78.4
593
70.2
545
54.4
283
49.1
295
37.1
Some
51
11.4
130
12.9
177
19.8
214
25.5
348
37.2
211
37.6
366
45.3
Extrem
e0
0.0
16
1.9
19
1.8
35
4.2
75
8.4
69
13.3
130
17.6
Anxiety/depression
No
426
93.2
898
87.7
842
85.3
673
79.4
734
75.0
399
70.9
537
66.0
Some
26
6.3
98
10.2
115
13.6
142
17.1
191
20.1
131
22.5
209
27.3
Extrem
e2
0.6
19
2.2
13
1.1
27
3.6
43
4.9
33
6.6
45
6.7
174 Annex 2: EQ-5D Population Norms – Regional Surveys

Age
Males
18–24
25–34
35–44
45–54
55–64
65–74
75+
n%
n%
n%
n%
n%
n%
n%
Mobility
Noproblems
222
97.9
508
96.3
490
97.1
394
92.7
411
85.4
221
81.0
157
49.2
Someproblems
51.9
16
3.5
15
2.7
31
6.9
69
14.0
51
18.2
199
48.3
Confined
tobed
10.2
10.3
10.3
10.3
30.6
20.8
12
2.6
Self-care
Noproblems
225
98.9
516
98.0
501
99.1
419
98.5
469
97.0
257
93.2
264
79.2
Someproblems
20.9
61.2
40.7
51.1
13
2.7
14
6.1
58
13.7
Unable
to1
0.2
30.7
10.3
20.4
10.3
30.7
46
7.1
Usual
activities
Noproblems
225
98.5
506
95.7
493
97.4
398
93.4
446
91.4
244
88.8
224
68.9
Someproblems
31.5
13
2.8
11
2.3
22
5.3
30
6.9
22
8.3
81
19.4
Unable
to0
0.0
61.5
20.4
61.3
71.7
82.9
63
11.7
Pain/discomfort
No
206
89.9
466
89.1
427
84.4
335
79.2
327
67.2
171
61.7
170
49.8
Some
22
10.1
52
9.3
74
14.9
84
19.5
138
29.0
85
31.8
165
42.4
Extrem
e0
0.0
71.5
50.7
71.3
18
3.8
18
6.5
33
7.8
Anxiety/depression
No
216
95.1
484
92.3
452
87.6
363
85.1
392
81.1
210
76.8
279
76.6
Some
11
4.4
33
6.0
48
11.3
54
12.6
80
16.4
56
20.1
77
20.6
Extrem
e1
0.6
81.7
61.1
92.3
11
2.5
83.0
12
2.7
(continued)
Annex 2: EQ-5D Population Norms – Regional Surveys 175

Age
Fem
ales
18–24
25–34
35–44
45–54
55–64
65–74
75+
n%
n%
n%
n%
n%
n%
n%
Mobility
Noproblems
221
97.4
478
96.8
437
94.1
377
90.0
393
79.8
189
64.3
158
39.4
Someproblems
52.6
12
3.2
26
5.5
38
9.6
90
19.9
97
34.9
240
55.9
Confined
tobed
00.0
00.0
10.3
10.3
20.3
30.8
25
4.7
Self-care
Noproblems
225
99.4
487
99.3
457
99.0
402
96.0
463
95.6
262
90.6
263
65.5
Someproblems
10.6
30.7
60.8
12
3.3
19
4.0
23
8.1
95
20.6
Unable
to0
0.0
00.0
10.1
20.7
30.4
41.2
65
13.9
Usual
activities
Noproblems
225
99.4
478
97.3
445
96.2
389
93.0
414
83.9
228
78.0
196
48.7
Someproblems
10.6
10
2.1
18
3.7
22
5.4
65
14.7
48
17.6
125
28.4
Unable
to0
0.0
20.5
10.1
51.6
61.4
13
4.3
102
22.9
Pain/discomfort
No
197
87.3
403
81.0
347
71.9
258
61.3
218
42.3
112
37.9
125
29.2
Some
29
12.7
78
16.7
103
25.2
130
31.5
210
45.0
126
42.7
201
47.1
Extrem
e0
0.0
92.3
14
2.9
28
7.2
57
12.7
51
19.4
97
23.7
Anxiety/depression
No
210
91.2
414
82.7
390
82.8
310
73.6
342
69.2
189
65.7
258
59.4
Some
15
8.3
65
14.6
67
16.1
88
21.6
111
23.5
75
24.6
132
31.4
Extrem
e1
0.6
11
2.7
71.1
18
4.8
32
7.3
25
9.7
33
9.2
(continued)
176 Annex 2: EQ-5D Population Norms – Regional Surveys

EQ-5D index value (European VAS value set)
EQ-5D index value
(European VAS)
Age
Total18–24 25–34 35–44 45–54 55–64 65–74 75+
Total Mean 0.958 0.929 0.914 0.871 0.807 0.762 0.623 0.853
Standard error 0.005 0.005 0.005 0.007 0.008 0.012 0.012 0.003
25th percentile 1.00 1.00 0.78 0.78 0.71 0.69 0.39 0.78
50th percentile 1.00 1.00 1.00 1.00 0.78 0.78 0.69 1.00
75th percentile 1.00 1.00 1.00 1.00 1.00 1.00 0.81 1.00
Males Mean 0.962 0.944 0.932 0.908 0.859 0.829 0.715 0.895
Standard error 0.007 0.007 0.007 0.008 0.009 0.014 0.016 0.004
25th percentile 1.00 1.00 0.85 0.78 0.78 0.71 0.60 0.78
50th percentile 1.00 1.00 1.00 1.00 1.00 1.00 0.78 1.00
75th percentile 1.00 1.00 1.00 1.00 1.00 1.00 1.00 1.00
Females Mean 0.954 0.913 0.895 0.835 0.758 0.703 0.566 0.812
Standard error 0.008 0.008 0.008 0.012 0.012 0.017 0.017 0.005
25th percentile 1.00 0.78 0.78 0.75 0.69 0.48 0.30 0.69
50th percentile 1.00 1.00 1.00 1.00 0.78 0.78 0.62 1.00
75th percentile 1.00 1.00 1.00 1.00 1.00 1.00 0.78 1.00
Annex 2: EQ-5D Population Norms – Regional Surveys 177

Sweden (Stockholm County)
Source: Sun et al. (2012)
Number of respondents
Age 18–24 25–34 35–44 45–54 55–64 65–74 75+ Total
Total 2,686 5,299 6,523 5,625 6,203 3,925 2,336 32,597
Males 1,155 2,169 2,901 2,565 2,973 1,855 1,018 14,636
Females 1,531 3,130 3,622 3,060 3,230 2,070 1,318 17,961
EQ VAS (self-rated health)
EQ-VAS (self-rated)
Age
Total18–24 25–34 35–44 45–54 55–64 65–74 75+
Total Mean 81.7 81.5 80.7 79.2 78.1 75.9 68.5 78.7
Standard error 0.3 0.2 0.2 0.2 0.3 0.3 0.5 0.1
25th percentile 85 85 85 82 80 80 75 73
50th percentile 75 75 75 70 70 70 50 84
75th percentile 90 90 90 90 90 90 85 90
Males Mean 84.1 82.3 81.7 79.4 79.1 76.8 70.1 79.6
Standard error 0.4 0.3 0.3 0.3 0.3 0.4 0.7 0.1
25th percentile 88 85 85 80 85 80 75 75
50th percentile 80 75 75 70 70 70 50 84
75th percentile 95 90 90 90 90 90 85 90
Females Mean 79.9 81.0 80.0 79.0 77.2 75.0 67.2 78.0
Standard error 0.4 0.3 0.3 0.3 0.4 0.5 0.6 0.1
25th percentile 84 85 85 84 80 80 70 73
50th percentile 70 75 75 70 70 65 50 82
75th percentile 90 90 90 90 90 90 85 89
178 Annex 2: EQ-5D Population Norms – Regional Surveys

Problemsreported
bydim
ension
Age
Total
18–24
25–34
35–44
45–54
55–64
65–74
75+
n%
n%
n%
n%
n%
n%
n%
Mobility
Noproblems
2,611
97.2
5,145
97.1
6,178
94.7
5,055
89.9
5,220
84.2
3,121
79.5
1,488
63.7
Someproblems
73
2.7
148
2.8
341
5.2
562
10.0
972
15.7
795
20.3
830
35.5
Confined
tobed
20.1
60.1
40.1
80.1
11
0.2
90.2
18
0.8
Self-care
Noproblems
2,664
99.2
5,276
99.6
6,446
98.8
5,494
97.7
6,037
97.3
3,822
97.4
2,161
92.5
Someproblems
16
0.6
16
0.3
64
1.0
110
2.0
131
2.1
87
2.2
123
5.3
Unable
to6
0.2
70.1
13
0.2
21
0.4
35
0.6
16
0.4
52
2.2
Usual
activities
Noproblems
2,517
93.7
5,004
94.4
6,033
92.5
4,967
88.3
5,312
85.6
3,518
89.6
1,852
79.3
Someproblems
156
5.8
260
4.9
426
6.5
579
10.3
788
12.7
348
8.9
366
15.7
Unable
to13
0.5
35
0.7
64
1.0
79
1.4
103
1.7
59
1.5
118
5.1
Pain/discomfort
No
2,012
74.9
3,665
69.2
4,017
61.6
2,904
51.6
2,785
44.9
1,641
41.8
826
35.4
Some
652
24.3
1,558
29.4
2,326
35.7
2,477
44.0
3,081
49.7
2,112
53.8
1,347
57.7
Extrem
e22
0.8
76
1.4
180
2.8
244
4.3
337
5.4
172
4.4
163
7.0
Anxiety/depression
No
1,603
59.7
3,309
62.4
4,395
67.4
3,755
66.8
4,338
69.9
2,928
74.6
1,598
68.4
Some
993
37.0
1,863
35.2
1,971
30.2
1,667
29.6
1,700
27.4
934
23.8
688
29.5
Extrem
e90
3.4
127
2.4
157
2.4
203
3.6
165
2.7
63
1.6
50
2.1
(continued)
Annex 2: EQ-5D Population Norms – Regional Surveys 179

Age
Males
18–24
25–34
35–44
45–54
55–64
65–74
75+
n%
n%
n%
n%
n%
n%
n%
Mobility
Noproblems
1,130
97.8
2,111
97.3
2,767
95.4
2,328
90.8
2,562
86.2
1,519
81.9
691
67.9
Someproblems
23
2.0
53
2.4
131
4.5
233
9.1
404
13.6
331
17.8
320
31.4
Confined
tobed
20.2
50.2
30.1
40.2
70.2
50.3
70.7
Self-care
Noproblems
1,141
98.8
2,163
99.7
2,864
98.7
2,505
97.7
2,903
97.6
1,814
97.8
950
93.3
Someproblems
12
1.0
20.1
29
1.0
50
2.0
54
1.8
38
2.1
49
4.8
Unable
to2
0.2
40.2
80.3
10
0.4
16
0.5
30.2
19
1.9
Usual
activities
Noproblems
1,082
93.7
2,068
95.3
2,748
94.7
2,315
90.3
2,630
88.5
1,689
91.1
842
82.7
Someproblems
70
6.1
92
4.2
131
4.5
217
8.5
297
10.0
144
7.8
137
13.5
Unable
to3
0.3
90.4
22
0.8
33
1.3
46
1.6
22
1.2
39
3.8
Pain/discomfort
No
916
79.3
1,590
73.3
1,896
65.4
1,416
55.2
1,494
50.3
895
48.3
425
41.8
Some
233
20.2
556
25.6
942
32.5
1,072
41.8
1,343
45.2
899
48.5
539
53.0
Extrem
e6
0.5
23
1.1
63
2.2
77
3.0
136
4.6
61
3.3
54
5.3
Anxiety/depression
No
818
70.8
1,482
68.3
2,103
72.5
1,819
70.9
2,245
75.5
1,478
79.7
770
75.6
Some
309
26.8
640
29.5
739
25.5
673
26.2
651
21.9
354
19.1
235
23.1
Extrem
e28
2.4
47
2.2
59
2.0
73
2.8
77
2.6
23
1.2
13
1.3
(continued)
180 Annex 2: EQ-5D Population Norms – Regional Surveys

Age
Fem
ales
18–24
25–34
35–44
45–54
55–64
65–74
75+
n%
n%
n%
n%
n%
n%
n%
Mobility
Noproblems
1,481
96.7
3,034
96.9
3,411
94.2
2,727
89.1
2,658
82.3
1,602
77.4
797
60.5
Someproblems
50
3.3
95
3.0
210
5.8
329
10.8
568
17.6
464
22.4
510
38.7
Confined
tobed
00.0
10.0
10.0
40.1
40.1
40.2
11
0.8
Self-care
Noproblems
1,523
99.5
3,113
99.5
3,582
98.9
2,989
97.7
3,134
97.0
2,008
97.0
1,211
91.9
Someproblems
40.3
14
0.4
35
1.0
60
2.0
77
2.4
49
2.4
74
5.6
Unable
to4
0.3
30.1
50.1
11
0.4
19
0.6
13
0.6
33
2.5
Usual
activities
Noproblems
1,435
93.7
2,936
93.8
3,285
90.7
2,652
86.7
2,682
83.0
1,829
88.4
1,010
76.6
Someproblems
86
5.6
168
5.4
295
8.1
362
11.8
491
15.2
204
9.9
229
17.4
Unable
to10
0.7
26
0.8
42
1.2
46
1.5
57
1.8
37
1.8
79
6.0
Pain/discomfort
No
1,096
71.6
2,075
66.3
2,121
58.6
1,488
48.6
1,291
40.0
746
36.0
401
30.4
Some
419
27.4
1,002
32.0
1,384
38.2
1,405
45.9
1,738
53.8
1,213
58.6
808
61.3
Extrem
e16
1.0
53
1.7
117
3.2
167
5.5
201
6.2
111
5.4
109
8.3
Anxiety/depression
No
785
51.3
1,827
58.4
2,292
63.3
1,936
63.3
2,093
64.8
1,450
70.1
828
62.8
Some
684
44.7
1,223
39.1
1,232
34.0
994
32.5
1,049
32.5
580
28.0
453
34.4
Extrem
e62
4.1
80
2.6
98
2.7
130
4.3
88
2.7
40
1.9
37
2.8
Annex 2: EQ-5D Population Norms – Regional Surveys 181

EQ-5D index value (European VAS value set)
EQ-5D index value
(European VAS)
Age
Total18–24 25–34 35–44 45–54 55–64 65–74 75+
Total Mean 0.860 0.860 0.850 0.820 0.800 0.800 0.740 0.824
Standard error 0.003 0.002 0.002 0.003 0.003 0.003 0.005 0.001
25th percentile 0.85 0.78 0.78 0.78 0.78 0.78 0.78 0.79
50th percentile 0.78 0.78 0.78 0.69 0.69 0.71 0.69 0.73
75th percentile 1.00 1.00 1.00 1.00 1.00 1.00 1.00 1.00
Males Mean 0.890 0.880 0.870 0.830 0.820 0.830 0.780 0.845
Standard error 0.004 0.003 0.003 0.004 0.003 0.004 0.007 0.001
25th percentile 1.00 1.00 1.00 0.78 0.78 0.78 0.78 0.87
50th percentile 0.78 0.78 0.78 0.75 0.71 0.71 0.69 0.75
75th percentile 1.00 1.00 1.00 1.00 1.00 1.00 1.00 1.00
Females Mean 0.840 0.840 0.830 0.800 0.780 0.780 0.720 0.805
Standard error 0.004 0.003 0.003 0.004 0.004 0.004 0.007 0.001
25th percentile 0.78 0.78 0.78 0.78 0.78 0.78 0.76 0.78
50th percentile 0.78 0.78 0.71 0.69 0.69 0.69 0.62 0.71
75th percentile 1.00 1.00 1.00 1.00 1.00 1.00 0.78 0.98
182 Annex 2: EQ-5D Population Norms – Regional Surveys

Zimbabwe (Harare)
Source: Jelsma (2003)
Number of respondents
Age 18–24 25–34 35–44 45–54 55–64 65–74 75+ Total
Total 1,087 772 264 162 49 16 0 2,350
Males 408 308 95 62 20 8 0 901
Females 679 464 169 100 29 8 0 1,449
EQ VAS (self-rated health)
EQ-VAS (self-rated)
Age
Total18–24 25–34 35–44 45–54 55–64 65–74 75+
Total Mean 81.8 79.8 76.6 75.1 70.5 61.5 – 79.8
Standard error 0.5 0.6 1.2 1.6 2.6 4.5 – 0.4
25th percentile 70 70 61 60 50 50 – 70
50th percentile 90 80 80 80 78 65 – 84
75th percentile 96 91.25 90 90 82 72 – 94
Males Mean 83.0 81.7 77.9 79.0 79.9 65.2 – 81.5
Standard error 0.8 0.9 2.1 2.3 2.9 7.2 – 0.6
25th percentile 71.5 70 70 67 79.5 50 – 70
50th percentile 90 84 84 84 80 60 – 87
75th percentile 96 92 92 91 86 80.75 – 94
Females Mean 81.2 78.6 75.8 72.8 64.1 58.3 – 78.7
Standard error 0.7 0.8 1.5 2.1 3.4 5.9 – 0.5
25th percentile 70 70 60 50 50 40 – 66
50th percentile 88 80 80 76 58 66 – 80
75th percentile 96 90 90 90 80 72 – 92
Annex 2: EQ-5D Population Norms – Regional Surveys 183
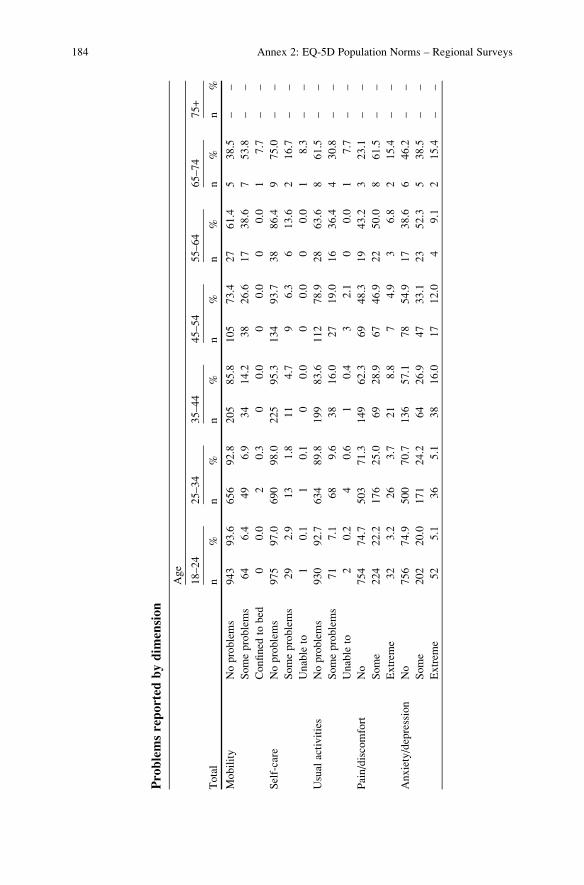
Problemsreported
bydim
ension
Age
Total
18–24
25–34
35–44
45–54
55–64
65–74
75+
n%
n%
n%
n%
n%
n%
n%
Mobility
Noproblems
943
93.6
656
92.8
205
85.8
105
73.4
27
61.4
538.5
––
Someproblems
64
6.4
49
6.9
34
14.2
38
26.6
17
38.6
753.8
––
Confined
tobed
00.0
20.3
00.0
00.0
00.0
17.7
––
Self-care
Noproblems
975
97.0
690
98.0
225
95.3
134
93.7
38
86.4
975.0
––
Someproblems
29
2.9
13
1.8
11
4.7
96.3
613.6
216.7
––
Unable
to1
0.1
10.1
00.0
00.0
00.0
18.3
––
Usual
activities
Noproblems
930
92.7
634
89.8
199
83.6
112
78.9
28
63.6
861.5
––
Someproblems
71
7.1
68
9.6
38
16.0
27
19.0
16
36.4
430.8
––
Unable
to2
0.2
40.6
10.4
32.1
00.0
17.7
––
Pain/discomfort
No
754
74.7
503
71.3
149
62.3
69
48.3
19
43.2
323.1
––
Some
224
22.2
176
25.0
69
28.9
67
46.9
22
50.0
861.5
––
Extrem
e32
3.2
26
3.7
21
8.8
74.9
36.8
215.4
––
Anxiety/depression
No
756
74.9
500
70.7
136
57.1
78
54.9
17
38.6
646.2
––
Some
202
20.0
171
24.2
64
26.9
47
33.1
23
52.3
538.5
––
Extrem
e52
5.1
36
5.1
38
16.0
17
12.0
49.1
215.4
––
184 Annex 2: EQ-5D Population Norms – Regional Surveys

Age
Males
18–24
25–34
35–44
45–54
55–64
65–74
75+
n%
n%
n%
n%
n%
n%
n%
Mobility
Noproblems
358
96.0
261
94.2
76
89.4
47
85.5
16
88.9
350.0
––
Someproblems
15
4.0
15
5.4
910.6
814.5
211.1
350.0
––
Confined
tobed
00.0
10.4
00.0
00.0
00.0
00.0
––
Self-care
Noproblems
357
96.2
269
98.2
76
90.5
51
92.7
17
94.4
5100.0
––
Someproblems
14
3.8
41.5
89.5
47.3
15.6
00.0
––
Unable
to0
0.0
10.4
00.0
00.0
00.0
00.0
––
Usual
activities
Noproblems
348
93.5
250
90.6
69
81.2
48
87.3
17
94.4
583.3
––
Someproblems
24
6.5
24
8.7
15
17.6
610.9
15.6
116.7
––
Unable
to0
0.0
20.7
11.2
11.8
00.0
00.0
––
Pain/discomfort
No
298
79.9
205
74.3
54
63.5
34
61.8
11
61.1
233.3
––
Some
64
17.2
66
23.9
25
29.4
21
38.2
738.9
350.0
––
Extrem
e11
2.9
51.8
67.1
00.0
00.0
116.7
––
Anxiety/depression
No
288
77.2
200
72.5
54
63.5
33
60.0
844.4
116.7
––
Some
73
19.6
64
23.2
22
25.9
18
32.7
844.4
466.7
––
Extrem
e12
3.2
12
4.3
910.6
47.3
211.1
116.7
––
(continued)
Annex 2: EQ-5D Population Norms – Regional Surveys 185
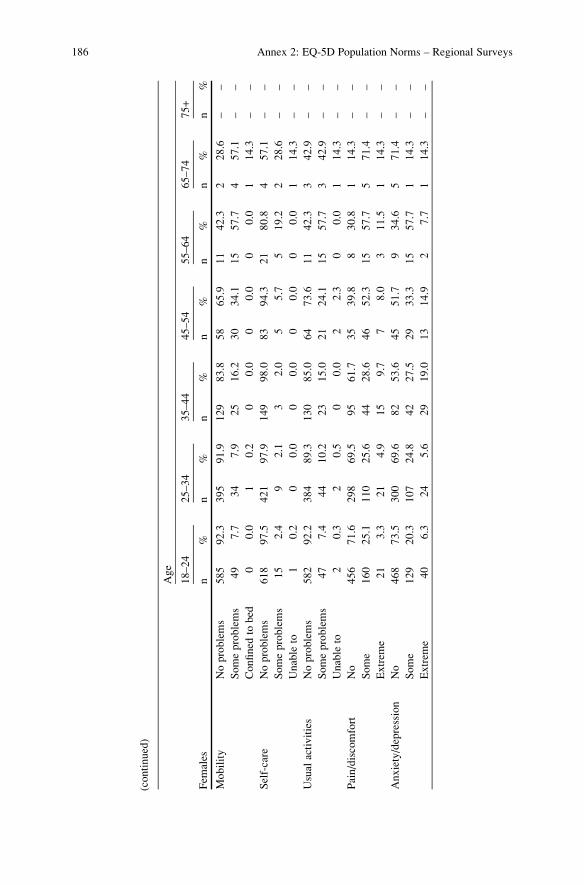
Age
Fem
ales
18–24
25–34
35–44
45–54
55–64
65–74
75+
n%
n%
n%
n%
n%
n%
n%
Mobility
Noproblems
585
92.3
395
91.9
129
83.8
58
65.9
11
42.3
228.6
––
Someproblems
49
7.7
34
7.9
25
16.2
30
34.1
15
57.7
457.1
––
Confined
tobed
00.0
10.2
00.0
00.0
00.0
114.3
––
Self-care
Noproblems
618
97.5
421
97.9
149
98.0
83
94.3
21
80.8
457.1
––
Someproblems
15
2.4
92.1
32.0
55.7
519.2
228.6
––
Unable
to1
0.2
00.0
00.0
00.0
00.0
114.3
––
Usual
activities
Noproblems
582
92.2
384
89.3
130
85.0
64
73.6
11
42.3
342.9
––
Someproblems
47
7.4
44
10.2
23
15.0
21
24.1
15
57.7
342.9
––
Unable
to2
0.3
20.5
00.0
22.3
00.0
114.3
––
Pain/discomfort
No
456
71.6
298
69.5
95
61.7
35
39.8
830.8
114.3
––
Some
160
25.1
110
25.6
44
28.6
46
52.3
15
57.7
571.4
––
Extrem
e21
3.3
21
4.9
15
9.7
78.0
311.5
114.3
––
Anxiety/depression
No
468
73.5
300
69.6
82
53.6
45
51.7
934.6
571.4
––
Some
129
20.3
107
24.8
42
27.5
29
33.3
15
57.7
114.3
––
Extrem
e40
6.3
24
5.6
29
19.0
13
14.9
27.7
114.3
––
(continued)
186 Annex 2: EQ-5D Population Norms – Regional Surveys

EQ-5D index value (European VAS value set)
EQ-5D index value
(European VAS)
Age
Total18–24 25–34 35–44 45–54 55–64 65–74 75+
Total Mean 0.867 0.859 0.774 0.750 0.697 0.607 – 0.842
Standard error 0.006 0.007 0.015 0.019 0.030 0.086 – 0.004
25th percentile 0.78 0.78 0.63 0.62 0.60 0.46 – 0.72
50th percentile 1.00 1.00 0.78 0.75 0.69 0.61 – 1.00
75th percentile 1.00 1.00 1.00 1.00 0.78 0.78 – 1.00
Males Mean 0.889 0.880 0.803 0.815 0.770 0.625 – 0.868
Standard error 0.009 0.011 0.025 0.026 0.036 0.125 – 0.006
25th percentile 0.78 0.78 0.65 0.69 0.68 0.36 – 0.78
50th percentile 1.00 1.00 0.89 0.78 0.78 0.62 – 1.00
75th percentile 1.00 1.00 1.00 1.00 0.85 0.89 – 1.00
Females Mean 0.854 0.846 0.757 0.709 0.647 0.594 – 0.826
Standard error 0.007 0.009 0.019 0.026 0.042 0.125 – 0.006
25th percentile 0.78 0.76 0.62 0.58 0.59 0.57 – 0.69
50th percentile 1.00 1.00 0.78 0.71 0.62 0.60 – 0.81
75th percentile 1.00 1.00 1.00 1.00 0.78 0.78 – 1.00
EQ-5D index value (TTO value set)
EQ-5D index value
(TTO value set)
Age
Total18–24 25–34 35–44 45–54 55–64 65–74 75+
Total Mean 0.906 0.898 0.834 0.820 0.775 0.678 – 0.886
Standard error 0.004 0.005 0.012 0.014 0.024 0.087 – 0.003
25th percentile 0.83 0.83 0.73 0.73 0.69 0.64 – 0.79
50th percentile 1.00 1.00 0.85 0.80 0.79 0.71 – 1.00
75th percentile 1.00 1.00 1.00 1.00 0.85 0.85 – 1.00
Males Mean 0.920 0.914 0.854 0.868 0.843 0.740 – 0.905
Standard error 0.006 0.008 0.020 0.018 0.023 0.092 – 0.005
25th percentile 0.83 0.83 0.73 0.79 0.78 0.56 – 0.83
50th percentile 1.00 1.00 0.93 0.85 0.83 0.73 – 1.00
75th percentile 1.00 1.00 1.00 1.00 0.89 0.93 – 1.00
Females Mean 0.897 0.887 0.824 0.789 0.727 0.634 – 0.874
Standard error 0.005 0.007 0.015 0.019 0.034 0.138 – 0.004
25th percentile 0.83 0.81 0.73 0.69 0.68 0.64 – 0.79
50th percentile 1.00 1.00 0.84 0.79 0.73 0.69 – 0.85
75th percentile 1.00 1.00 1.00 1.00 0.84 0.83 – 1.00
Annex 2: EQ-5D Population Norms – Regional Surveys 187

References
Augustovski FA, Irazola VE, Velazquez AP, Gibbons L, Craig BM (2009) Argentine valuation of
the EQ-5D health states. Value Health 12(4):587–596
Badia X et al (1998) The Spanish VAS tariff based on valuation of EQ-5D health states from the
general population. In: Rabin RE et al (eds) EuroQol plenary meeting, Rotterdam, 2–3 Oct
1997. Discussion papers. Centre for Health Policy & Law, Erasmus University, Rotterdam,
pp 93–114
Badia X et al (2001a) A comparison of GB and Spanish general population time trade-off values
for EQ-5D health states. Med Decis Making 21:7–16
Badia X, Roset M, Herdman M, Kind P (2001b) A comparison of United Kingdom and Spanish
general population time trade-off values for EQ-5D health states. Med Decis Making 21
(1):7–16
Bjork S, Norinder A (1999) The weighting exercise for the Swedish version of the EuroQol. Health
Econ 8(2):117–126
Blakely T, Woodward A, Pearce N, Salmond C, Kiro C, Davis P (2002) Socio-economic factors
and mortality among 25–64 year olds followed from 1991 to 1994: the New Zealand Census-
Mortality Study. N Z Med J 115:93–97
Borrell C, Regidor E, Arias LC, Navarro P, Puigpinos R, Domınguez V, Plasencia A (1999)
Inequalities in mortality according to educational level in two large Southern European cities.
Int J Epidemiol 28:58–63
Canary Health Survey (2009) Canary Islands health service and ISTAC
Catalunya Health Survey (2011) Health plan service. Department of Health, Government of
Catalonia
Chevalier J, de Pouvourville G (2013) Valuing EQ-5D using time trade-off in France. Eur J Health
Econ 14:57–66
Claes C et al (1999a) An interview-based comparison of the TTO and VAS values given to
EuroQol states of health by the general German population. In: Greiner W, Schulenburg J-M.
Graf v.d. et al (eds) EQ plenary meeting, Hannover, 1–2 Oct 1998. Discussion papers, pp
13–39
Claes C, Greiner W, Uber A, Schulenburg J-M Gvd (1999b) An interview-based comparison of the
TTO and VAS values given to EuroQol states of health by the general German population.
In: Greiner W, Schulenburg J-M Gvd, Piercy J (eds). (EuroQol) Plenary meeting. Discussion
papers. Uni-Verlag Witte, Hannover, pp 13–39
Clarke P, van Ourti T (2010) Calculating the concentration index when income is grouped.
J Health Econ 29(1):151–157
Cleemput I (2003) Economic evaluation in renal transplantation: outcome assessment and cost-
utility of non-compliance. Acco, Leuven
A. Szende et al. (eds.), Self-Reported Population Health: An International Perspectivebased on EQ-5D, DOI 10.1007/978-94-007-7596-1, © The Author(s) 2014
189

Cleemput I et al (2004a) Re-scaling social preference data: implications for modelling. In: Kind P,
Macran S (eds) Proceedings of the 19th plenary meeting of the EuroQol Group 2002. York
Centre for Health Economics, pp 113–122
Cleemput I, Kind P, Kesteloot K (2004b) Re-scaling social preference data: implications for
modelling. In: Kind P, Macran S (eds) 19th plenary meeting of the EuroQol Group. Discussion
papers. Centre for Health Economics, University of York, pp 13–123
Dalstra JAA, Kunst AE, Geurts JJM, Frenken FJM, Mackenbach JP (2002) Trends in socioeco-
nomic health inequalities in the Netherlands, 1981–1999. J Epidemiol Community Health
56:927–934
Devlin NJ, Hansen P, Kind P, Williams A (2000) The health state preferences and logical
inconsistencies of New Zealanders: a tale of two tariffs. York Centre for Health Economics/
University of Otago, New Zealand. Discussion paper no 180
Devlin NJ, Hansen P, Kind P, Williams A (2003) Logical inconsistencies in survey respondents’
health state valuations – a methodological challenge for estimating social tariffs. Health Econ
12(7):529–544
Dolan P (1997) Modeling valuations for EuroQol health states. Med Care 35(11):1095–1108
Eachus J, Chan P, Pearson N, Propper C, Smith GD (1999) An additional dimension to health
inequalities: disease severity and socio-economic position. J Epidemiol Community Health
53:603–611
EuroQol Group (1990) EuroQol – a new facility for the measurement of health-related quality of
life. Health Policy 16:199–208
Gaminde I, Cabases J (1996) Measuring valuations for health states among the general population
in Navarra (Spain). In: Badia X, Herdman M, Segura A (eds) EuroQol plenary meeting.
Discussion papers. Institut Universitari de Salut Publica de Catalunya, Barcelona, pp 113–123
Gharagebakyan G, Ghukasyan H,Williams A, Szende A (2003) Social inequalities in self-reported
health: is Armenia different from Slovenia? In: Rupel VP (ed) 20th plenary meeting of the
EuroQol Group. Discussion papers. Republic of Slovenia, Ministry of Health, pp 79–87
Goldman DP, Smith JP (2002) Can patient self-management help explain the SES health gradient?
Proc Natl Acad Sci U S A 99:10929–10934
Greiner W, The Rotterdam Analysis Team (2003) A European EQ-5D VAS valuation set. Chapter
8. In: Brooks R, Rabin R, Charro F (eds) The measurement and valuation of health status using
EQ-5D: a European perspective. Kluwer, Dordrecht
Greiner W et al (2003) A European EQ-5D VAS valuation set. In: Brooks R et al (eds) The
measurement and valuation of health status using EQ-5D: a European perspective. Kluwer,
Dordrecht
Greiner W, Claes C, Busschbach JJ, von der Schulenburg JM (2005) Validating the EQ-5D with
time trade off for the German population. Eur J Health Econ 6(2):124–130
Health Quality Council Alberta (HQCA) (2010) Satisfaction and experience with health care
services: a survey with Albertans in 2010
Household Health Survey (2010) National Natural Science Foundation of China 70873064,
Nanjing Medical University
Jelsma J, Hansen K, de Weerdt W, Cock P, Kind P (2003) How do Zimbabweans value health
states? Popul Health Metrics 1:11
Johnson JA, Pickard AS (2000) Comparison of the EQ-5D and SF-12 health surveys in a general
population survey in Alberta, Canada. Med Care 38(1):115–121
Kakwani NC, Wagstaff A, Doorsaler EV (1997) Socioeconomic inequalities in health: measure-
ment, computation and statistical inference. J Economet 77:87–103
Karter AJ, Ferrara A, Darbinian JA, Ackerson LM, Selby JV (2000) Self-monitoring of blood
glucose: language and financial barriers in a managed care population with diabetes. Diabetes
Care 23:477–483
Katz PP (1998) Education and self-care activities among persons with rheumatoid arthritis. Soc
Sci Med 46:1057–1066
190 References

Kind P, Dolan P, Gudex C, Williams A (1998) Variations in population health status: results from
a United Kingdom national questionnaire survey. BMJ 316(7133):736–741
Konig HH, Bernert S, Angermeyer MC, Matschinger H, Martinez M, Vilagut G, Haro JM,
de Girolamo G, de Graaf R, Kovess V, Alonso J, ESEMeD/MHEDEA 2000 Investigators
(2000) Comparison of population health status in six European countries: results of a represen-
tative survey using the EQ-5D questionnaire. Med Care 47(2):255–261
Koolman X, van Doorslaer E (2004) On the interpretation of a concentration index of inequality.
Health Econ 13:649–656
Kunst AE, Geurts JJM, van de Berg J (1995) International variation in socio-economic inequalities
in self reported health. J Epidemiol Community Health 49:117–123
Lamers LM, McDonnell J, Stalmeier PFM, Krabbe PFM, Busschbach JJV (2006) The Dutch tariff:
results and arguments for a cost-effective design for national EQ-5D valuation studies. Health
Econ 15(10):1121–1132
Lee YK, Nam HS, Chuang LH, Kim KY, Yang HK, Kwon IS, Kind P, Kweon SS, Kim YT (2009)
South Korean time trade-off values for EQ-5D health states: modeling with observed values for
101 health states. Value Health 12(8):1187–1193
Mackenbach JP, Kunst AE, Cavelaars AEJM, Groenhof F, Geurts JJM (1997) EU working group
on socioeconomic inequalities in health. Socioeconomic inequalities in morbidity and mortal-
ity in western Europe. Lancet 349:1655–1659
Ministerio de Salud de Argentina (2005) ¿Que es la Encuesta National de Factores de Riesgo?
Buenos Aires
MVH Group (1995) The measurement and valuation of health. Final report on the modelling of
valuation tariffs. MVH Group, Centre for Health Economics, York
National Centre for Social Research and University College London. Department of Epidemiology
and Public Health (2011) Health survey for England, 2008 [computer file], 3rd edn. UK Data
Archive [distributor], Colchester, July 2011. SN: 6397, http://dx.doi.org/test
Nishi N, Makino K, Fukuda H, Tatara K (2004) Effects of socio-economic indicators on coronary
risk factors, self-rated health and psychological well-being among urban Japanese civil
servants. Soc Sci Med 58:1159–1170
Ohinmaa A et al (1996) Modelling EuroQol values of Finnish adult population. In: Badia X et al
(eds) EuroQol plenary meeting 1995 discussion papers. Institut Universitari de Salut Publica de
Catalunya, Barcelona, pp 67–76. ISBN: 84-477-0574-9
Ohinmaa A et al (1999) Inconsistencies and modelling of the Finnish EuroQol (EQ-5D) preference
values. In: Greiner W, Schulenburg J-M Gvd et al (eds) EQ plenary meeting, Hannover, 1–2
Oct 1998. Discussion papers. ISBN3-932152-32-8, pp 57–74
Prevolnik Rupel V, Rebolj M (2001) The Slovenian VAS tariff based on valuations of EQ-5D
health states from the general population. In: Cabases J, Gaminde I (eds) 17th plenary meeting
of the EuroQol Group. Discussion papers. Universidad Publica de Navarra, pp 11–23
Regidor E, Barrio G, de la Fuente L, Domingo A, Rodriguez C, Alonso J (1999) Association
between educational level and health related quality of life in Spanish adults. J Epidemiol
Community Health 53:75–82
Regidor E, Calle ME, Navarro P, Domınguez V (2003) The size of educational differences in
mortality from specific causes of death in men and women. Eur J Epidemiol 18:395–400
Saarni SI, Harkanen T, Sintonen H, Suvisaari J, Koskinen S, Aromaa A, Lonnqvist J (2006) The
impact of 29 chronic conditions on health-related quality of life: a general population survey in
Finland using 15D and EQ-5D. Qual Life Res 15:1403–1414
Scalone L, Cortesi PA, Ciampichini R, Belisari A, D’Angiolella LS, Cesana G, Mantovani LG
(2013) Italian population-based values of EQ-5D health states. Value Health (in press)
Shaw JW, Johnson JA, Coons SJ (2005) US valuation of the EQ-5D health states: development and
testing of the D1 valuation model. Med Care 43(3):203–220
Simon JG (2002) How is your health in general? Qualitative and quantitative studies on
self-assessed health and socioeconomic differences herein [thesis]. Erasmus University
Rotterdam, Rotterdam
References 191

Singh-Manoux A, Clarke P, Marmot M (2002) Multiple measures of socio-economic position and
psychosocial health: proximal and distal measures. Int J Epidemiol 31:1192–1199
Sintonen H, Weijnen T, Nieuwenhuizen M, Oppe S, Badia X, Busschbach J, Greiner W, Krabbe P,
Ohinmaa A, Roset M, de Charro F (2003) Comparison of EQ-5D VAS valuations: analysis of
background variables. In: Brooks R, Rabin R, de Charro F (eds) The measurement and
valuation of health status using EQ-5D: a European perspective. Kluwer Academic, pp 81–103
Sørensen J, Davidsen M, Gudex C, Pedersen KM, Brønnum-Hansen H (2009) Danish EQ-5D
population norms. Scand J Public Health 37(5):467–474
Sullivan PW, Lawrence WF, Ghushchyan V (2005) A national catalog of preference-based scores
for chronic conditions in the United States. Med Care 43(7):736–749
Sun S, Chen J, Johannesson M, Kind P, Xu L, Zhang Y, Burstrom K (2011) Population health
status in China: EQ-5D results, by age, sex and socio-economic status, from the National
Health Services Survey 2008. Qual Life Res 20(3):309–320
Sun S, Irestig R, Burstrom B, Beijer U, Burstrom K (2012) Health-related quality of life (EQ-5D)
among homeless persons compared to a general population sample in Stockholm County,
2006. Scand J Public Health 40:115–125
Szende A, Nemeth R (2003) Health-related quality of life of the Hungarian population. Orv Hetil
144(34):1667–1674
Szende A, Williams A (eds) (2004) Measuring self-reported population health: an international
perspective based on EQ-5D. EuroQol Group
Szende A, Oppe M, Devlin N (eds) (2007) EQ-5D value sets: inventory, comparative review and
user guide. (EuroQol Group monographs). Springer
Tongsiri S, Cairns J (2011) Estimating population-based values for EQ-5D health states in
Thailand. Value Health 14(8):1142–1145
Torrance GW (1986) Measurement of health state utilities for economic appraisal. J Health Econ
5:1–30
Tsuchiya A, Ikeda S, Ikegami N, Nishimura S, Sakai I, Fukuda T, Hamashima C, Hisashige A,
Tamura M (2002) Estimating an EQ-5D population value set: the case of Japan. Health Econ
11(4):341–353
von dem Knesebeck O, Luschen G, Cockerham WC, Siegrist J (2003) Socioeconomic status and
health among the aged in the United States and Germany: a comparative cross-sectional study.
Soc Sci Med 57:1643–1652
Wagstaff A, van Doorslaer E (2004) Overall versus socioeconomic health inequality: a measure-
ment framework and two empirical illustrations. Health Econ 13:297–301
Wagstaff A, Paci P, Doorslaer E (1991) On the measurement of inequalities in health. Soc Sci Med
33:545–557
Weijnen T, Nieuwenhuizen M, Ohinmaa A, de Charro F (2003) Construction of the EQ-net VAS
and TTO databases. In: Brooks R, Rabin R, de Charro F (eds) The measurement and valuation
of health status using EQ-5D: a European perspective. Kluwer Academic Publishers, pp 55–81
Wittrup-Jensen KU et al (2002) Estimating Danish EQ-5D tariffs using TTO and VAS. In:
Norinder A et al (eds) Proceedings of the 18th plenary meeting of the EuroQol Group,
Copenhagen, 2001. IHE, The Swedish Institute for Health Economics, pp 257–292
Yfantopoulos Y (1999) Quality of life measurment and health production in Greece. In: Greiner
W, Schulenburg J-M. Graf v.d., Piercy J (eds) (EuroQol) Plenary meeting. Discussion papers.
Uni-Verlag Witte, Hannover, pp 100–114
192 References

Index
A
Augustovski, F.A, 13, 14
B
Badia, X., 13, 14
Bjork, S., 9, 132
C
Claes, C., 14
Cleemput, I., 14
Cross-country analysis
economic and health care indicators, 32–36
economic and health system macro
indicators, 15, 16
EQ-5D data, 31–32
European population age structure, 15
D
Decomposition analysis, 17, 42
Devlin, N.J., 9, 14, 116
E
EQ-5D
cross-country analysis (see Cross-countryanalysis)
description, 2
dimensions, 2, 22–27
EQ-5D index, 5
EQ-5D 3 level, 2–4
national surveys (see National surveys)population norms (see EQ-5D population
norms)
QALYs, 5
regional surveys (see Regional surveys)sociodemographic analysis, 16–17
socio-demographic indicator (seeSocio-demographic indicator)
youth version, 5
EQ-5D database archive
Argentinean dataset, 11
datasets, population surveys, 7–10
description, 7
standardized variables, 11
EQ-5D dimensions and reported problems
with anxiety/depression, 22, 28
five dimensions, 25
with mobility, 26
with pain/discomfort, 25, 27
profile by country, 25
regional surveys, 22, 26
with self-care, 26
sum of proportion, level 2 and 3 problems,
22, 24
usual activities, 26, 27
EQ-5D index norms
concentration index method, 16–17
country-specific TTO and VAS value sets,
27, 30
European VAS value set, 27, 29
value calculations, 12–14
EQ-5D-3L (EQ-5D 3 level), 2–5
EQ-5D-5L (EQ-5D 5 level), 2, 5, 6
EQ-5D population norms
age standardization, 31
catalogue, 19–20
description, 11
dimensions, 22–27
England and the Stockholm county
survey, 19
EQ VAS, 20–22
A. Szende et al. (eds.), Self-Reported Population Health: An International Perspectivebased on EQ-5D, DOI 10.1007/978-94-007-7596-1, © The Author(s) 2014
193

EQ-5D population norms (cont.)index, 27–30
index value calculations, 12
national and regional surveys, 19
TTO value sets, 12, 13
VAS value set, 12, 14
EQ-5D profile, 22, 24, 25
EQ-5D value sets
TTO value set, 12, 13
VAS value set, 12, 14
EQ-5D-Y (EQ-5D Youth version), 2, 5
EQ VAS. See EQ visual analogue scale
(EQ VAS)
EQ visual analogue scale (EQ VAS)
health care expenditure, 35
norms
age standardization, reported
problems, 15
health concentration index, 17
‘lower values’, self-rated scores, 20, 23
mean population ratings, 20, 21
ratings, age group, 20, 21
regional surveys, 22, 24
self-rated scores, 20, 21
self-reported ratings, 11, 17
‘upper values’, self-rated scores, 20, 23
self-reported, 35
Spearman rank correlation coefficients, 35
EuroQol Group
EQ-5D (see EQ-5D)EQ-5D-5L self-complete version, 5
Self-Reported Health Task Force, 1
G
GDP. See Gross domestic product (GDP)
Gharagebakyan, G., 10, 153
Greiner, W., 13, 14
Gross domestic product (GDP)
and EQ VAS, 35
health expenditure, 33–34
H
Health care indicators
linear regression analyses, 35–36
living standards, 32, 35
self-reported EQ VAS, GDP per
capita, 35
Spearman rank correlation coefficients,
33–35
Health concentration index
education, 41
inequality profile
quality of life dimensions, 38, 43
socio-demographic and quality of life
dimensions, 38, 44–45
socio-demographic factors, 38, 42
smallest and higher proportions, 41
Health-related quality of life
EQ-5D ratings, 11
health care indicators, cross-country
analysis, 32–36
inequality profile, 38, 41–45
population norms, EQ-5D (see EQ-5Dpopulation norms)
population surveys (see EQ-5D population
norms)
questionnaire (see EQ-5D)Health utilities
EQ-5D index values, 5
population norm data, 1
I
Inequalities
lowest level, 38
pain/discomfort, self-assessed health, 41
quality of life dimensions, 38, 43
socio-demographic and quality of life
dimensions, 44–45
socio-demographic factors, 38, 42
J
Jelsma, J., 10, 183
Johnson, J.A., 158
K
Kakwani, N.C., 17
Kind, P., 9, 142
L
Lamers, L.M, 13
Lee, Y.K., 9, 13, 106
N
National surveys
Argentina
EQ-5D index values, 51–52
EQ VAS (self-rated health), 47
number of respondents, 47
problems reported by dimension, 48–50
Belgium
EQ-5D index values, 57
EQ VAS (self-rated health), 53
number of respondents, 53
194 Index

problems reported by dimension, 54–56
China
EQ-5D index values, 62
EQ VAS (self-rated health), 58
number of respondents, 58
problems reported by dimension, 59–61
Denmark
EQ-5D index values, 67–68
EQ VAS (self-rated health), 63
number of respondents, 63
problems reported by dimension, 64–66
England
EQ-5D index values, 73–74
EQ VAS (self-rated health), 69
number of respondents, 69
problems reported by dimension, 70–72
Finland
EQ-5D index values, 79
EQ VAS (self-rated health), 75
number of respondents, 75
problems reported by dimension, 76–78
France
EQ-5D index values, 84
EQ VAS (self-rated health), 80
number of respondents, 80
problems reported by dimension, 81–83
Germany
EQ-5D index values, 89–90
EQ VAS (self-rated health), 85
number of respondents, 85
problems reported by dimension, 86–88
Greece
EQ-5D index values, 95
EQ VAS (self-rated health), 91
number of respondents, 91
problems reported by dimension, 92–94
Hungary
EQ-5D index values, 100
EQ VAS (self-rated health), 96
number of respondents, 96
problems reported by dimension, 97–99
Italy
EQ-5D index values, 105
EQ VAS (self-rated health), 101
number of respondents, 101
problems reported by dimension,
102–104
Korea
EQ-5D index values, 110
EQ VAS (self-rated health), 106
number of respondents, 106
problems reported by dimension,
107–109
Netherlands
EQ-5D index values, 115
EQ VAS (self-rated health), 111
number of respondents, 111
problems reported by dimension,
112–114
New Zealand
EQ-5D index values, 120
EQ VAS (self-rated health), 116
number of respondents, 116
problems reported by dimension, 117–119
Slovenia
EQ-5D index values, 125
EQ VAS (self-rated health), 121
number of respondents, 121
problems reported by dimension,
122–124
Spain
EQ-5D index values, 130–131
EQ VAS (self-rated health), 126
number of respondents, 126
problems reported by dimension,
127–129
Sweden
EQ-5D index values, 136
EQ VAS (self-rated health), 132
number of respondents, 132
problems reported by dimension,
133–135
Thailand
EQ-5D index values, 141
EQ VAS (self-rated health), 137
number of respondents, 137
problems reported by dimension, 138–140
United Kingdom
EQ-5D index values, 146–147
EQ VAS (self-rated health), 142
number of respondents, 142
problems reported by dimension,
143–145
United States
EQ-5D index values, 152
EQ VAS (self-rated health), 148
number of respondents, 148
problems reported by dimension,
149–151
Nemeth, R., 9, 96
O
Odds ratio
EQ-5D-3L dimensions, 39–41
gender related, 38
Index 195
P
Population norm data. See EQ-5D population
norms
Prevolnik Rupel, V., 9, 14, 121
Q
QALYs. SeeQuality adjusted life years (QALYs)Quality adjusted life years (QALYs), 5
Quality of life norms, 11
R
Rebolj, M., 9, 14, 121
Regional surveys
Armenia
EQ-5D index values, 157
EQ VAS (self-rated health), 153
number of respondents, 153
problems reported by dimension,
154–156
Canada (Alberta)
EQ-5D index values, 162
EQ VAS (self-rated health), 158
number of respondents, 158
problems reported by dimension,
159–161
Japan
EQ-5D index values, 167
EQ VAS (self-rated health), 163
number of respondents, 163
problems reported by dimension,
164–166
Spain (Canary Islands)
EQ-5D index values, 172
EQ VAS (self-rated health), 168
number of respondents, 168
problems reported by dimension,
169–171
Spain (Catalonia)
EQ-5D index values, 177
EQ VAS (self-rated health), 173
number of respondents, 173
problems reported by dimension,
174–176
Sweden (Stockholm County)
EQ-5D index values, 182
EQ VAS (self-rated health), 178
number of respondents, 178
problems reported by dimension,
179–181
Zimbabwe (Harare)
EQ-5D index values, 187
EQ VAS (self-rated health), 183
number of respondents, 183
problems reported by dimension,
184–186
S
Saarni, S.I., 8
Scalone, L., 13
Self-Reported Health Task Force, 1
Shaw, J.W, 13
Socio-demographic indicator
concentration indices, 38, 41–45
Odds ratios, 38–43
Sorensen, J., 8, 63
Sullivan, P.W., 9
Sun, S., 8, 10, 58, 178
Szende, A., 9, 96
T
Time trade-off (TTO) value set, 12, 13,
20, 28, 30
Tongsiri, S., 9, 13, 137
Tsuchiya, A., 10, 13, 163
TTO value set. See Time trade-off (TTO)
value set
V
Visual analogue scale (VAS)
country-specific, 12, 14, 20
EQ VAS (see EQ visual Analogue scale
(EQ VAS))
European VAS value set, 12
W
Wittrup-Jensen, K.U., 13, 14
Y
Yfantopoulous, Y., 8, 91
196 Index