semi annual report 2 0 0 7 - iex.nl · gemene rekening). it is not a legal entity but a contractual...
TRANSCRIPT

Semi annual Report 2 0 0 7 Global Opportunities Fund

J. Vermeerstraat 14 1071 DR Amsterdam The Netherlands Tel : +31 20 570 30 56 Fax: +31 20 570 30 47 www.go-capital.nl
Content
Five years Global Opportunities Fund 3
Profile 4
Fund Manager Report 5
Financial statementsBalance sheet 12Profit and Loss account 13Cash flow statement 14Notes 15Notes to balance sheet 17Notes to the Profit and Loss account 24Supplementary notes 26Portfolio breakdown 28Shares long 29Shares short 30Warrants 30
1

Global Opportunities FundSemi open-end contractual investment fund, established in 2000Johannes Vermeerstraat 14 1071 DR AmsterdamTel : +31 20 570 30 56Fax: +31 20 570 30 47www.go-capital.nl
Advisory BoardH. BoomA. Plomp
Fund ManagerGlobal Opportunities (GO) Capital Asset Management B.V.Johannes Vermeerstraat 14 1071 DR Amsterdam The [email protected]
Administrator DepositaryFastnet Netherlands N.V. Stichting Bewaarbedrijf Guestos De Ruyterkade 6 De Ruyterkade 6 1013 AA Amsterdam 1013 AA Amsterdam The Netherlands The [email protected]
Custodian Prime BrokerFortis Bank (Nederland) N.V. Fortis Prime Banking Nederland Rokin 55 Rokin 55 1012 KK Amsterdam 1012 KK Amsterdam The Netherlands The Netherlands
Auditor Legal and Tax AdvisorErnst & Young Accountants Clifford Chance LLP Drentestraat 20 Droogbak 1a 1083 HK Amsterdam 1013 GE Amsterdam The Netherlands The Netherlands
Tax Advisor Legal advisorErnst & Young Belastingadviseurs Holland van Gijzen Advocaten en Notarissen Drentestraat 20 Drentestraat 20 1083 HK Amsterdam 1083 HK Amsterdam The Netherlands The Netherlands
2

Five Years Global Opportunities Fund
30-06-2007 31-12-2006
Net Asset Value EUR x 1.000Net asset value of the Fund 675,381 587,819 131,601 73,753
Total units outstanding 1,083,870 1,105,903 871,508
Net Asset Value per unit 623.12 531.53 434.31 257.35Dividend per unit - - - - -
01-01-2007 01-01-200630-06-2007 30-06-2006
Profit and loss summary EUR x 1.000
Income from investments 3,732 2,261 5,328 1,376 658Capital gains/-losses 129,584 105,217 69,766 17,208 6,503Expenses -32,666 -34,384 -16,852 -4,359 -1,572
Total investment result 100,650 73,094 58,242 14,225 5,589
01-01-2007 01-01-200630-06-2007 30-06-2006
Result per unit EUR*
Total units outstanding 1,083,870 1,129,023 785,600 469,465 194,513
Income from investments 3.44 2.00 6.78 2.93 3.38Capital gains/-losses 119.56 93.19 88.81 36.65 33.43Expenses -30.14 -30.45 -21.45 -9.29 -8.08
Total result per unit 92.86 64.74 74.14 30.29 28.73
* The calculation of the result per unit is based on the number of the outstanding units as of 30 June 2007.
31-12-2005
378,508
01-01-2005
375,992
196.15
01-01-2005
01-01-2003 30-06-2003 30-06-2005
30-06-2005 01-01-2003 30-06-2003
511,359
31-12-2003
01-01-2004 30-06-2004
01-01-2004 30-06-2004
31-12-2004
3
ProfileThe Global Opportunities Fund (The Fund) is a contractual investment fund (beleggingsfonds of fonds voor gemene rekening). It is not a legal entity but a contractual arrangement sui generis between the Fund Manager, the Depositary and the Unit holders.
The Fund was established on 25 September 2000 and shall continue to exist for an indefinite period of time. The Fund holds a license from the Dutch Authority for the Financial Markets (AFM) and operates under the Act Financial Supervision (Wet op het Financieel Toezicht).
The Fund has a semi open-ended structure, which means that the Fund will on request issue and redeem Units subject to certain restrictions. Unit holders have no proprietary rights with respect to the assets of the Fund, but an economic interest in the assets of the Fund. The Depositary is the legal owner of all assets of the Fund. The Depositary will acquire and hold the assets for the purpose of management (ten titel van beheer) on behalf and for the account of the Unit holders. Such interest of the Unit holders is represented by the Units held by each of them.
The Fund is a long short equity hedge fund that has an opportunistic approach and aims to benefit from opportunities wherever they arise. The Fund has no specific long or short bias, nor sector or small/mid cap versus large cap preference. The portfolio will be determined purely by bottom-up ideas, rather than a top down allocation of stocks. The net long position of the Fund can vary sharply.
The basis premise of the Fund is to run a concentrated portfolio of stocks in a specific geography (predominantly Western Europe), build conviction on various investment ideas and monitor the investments closely after the investment decision has been made.
The Fund aims to achieve a positive return regardless of the stock market direction. An average yearly return of 15% after deduction of fees, costs and expenses is the target of the Fund.An investment in the Fund carries a high degree of risk and is suitable only for persons who can assume the risk of losing their entire investment. There is no guarantee that the Fund will achieve its investment objective. The value of the investment may fluctuate. Returns on past investments are no guarantee as to the returns on future investments.
There is a financial insert for the Global Opportunities Fund including information about the costs and the risks involved. Investors should read this carefully before buying participations in the Fund.
4

Fund Manager ReportWe are pleased to present the 2007 semi-annual report of the Global Opportunities Fund.
The Global Opportunities Fund produced a return of 17.2% in the first half of 2007, while the MSCI Europe index rose by 7.8% and the average long/short equity hedge fund gained 9%.Total assets under management rose in line with the performance of the Fund from EUR 588 million to EUR 675 million. During the first six months of the year, the Fund was closed awaiting the finalization of a major financing round of its (private equity) investment in Rock Well Petroleum, the oil mining company in which the Fund took a position in 2006.
Financial and economic backgroundThe world economy continued to expand at a healthy pace. However, housing market activity in the United States declined further, putting pressure on growth. House prices in the United States are set to decline in 2007 for the first time since the Second World War. This may affect consumer spending as consumers were used to spend the increased wealth created by higher house prices. It also resulted in more problems for so called sub prime mortgages, loans provided to clients that typically have a poor credit history and a weak financial situation. Losses on these loans went up sharply and started to unsettle markets.
Short term interest rates remained stable at 5.25% in the United States, but in Europe the European Central Bank hiked rates further, from 3.5% to 4.0%.
Ten year bond yields rose from 3.9% to 4.6% in Europe and from 4.7% to 5.0% in the United States.Commodity prices continued to rise, with the oil price ending the half year at USD 70 per barrel, up another USD 10 compared with December 2006. Some economists believe that, after 5 years of unprecedented growth worldwide and signs of price inflation in China, inflation rates will start to move up in the coming period.
Equity markets made significant progress once again, despite higher short and long term interest rates. Better than expected earnings reports were a main growth driver, as well as the ever stronger appetite of large private equity groups to take out publicly listed companies. They were helped by ample liquidity provided by banks.
There was a temporary hick up in equity markets in February as the Chinese government introduced a package aimed at damping speculation on local equity markets. Chinese equities were up over 100% in 2006 and another 80% in the first half of 2007. Equity markets recovered quickly to end the first half between 5% and 10% higher in Europe and the United States.
5

PerformanceOn 30 June 2007, the net asset value per unit of the Global Opportunities Fund amounted to 623.12, a gain of 17.2% compared with the end of 2006.
Tabel Monthly performance Global Opportunities Fund
In the first half of 2007 the Fund again has beaten its three benchmarks, including long/short equity funds, the MSCI Europe index as well as cash. Volatility amounted to 13.1% compared with 12.9% for the MSCI Europe.
In all months of the reporting period, the Fund produced a positive return. Portfolio turnover amounted to 202% on an annual basis compared with 146% in 2006 and 427% in 2005.The Fund did well during the correction in the month of February, achieving a minor positive result, while markets where down 2% or more. This in contrast to the performance in May 2006, when the Fund was hard hit by the global sell off of small caps stocks. This time round, the strong performance of a number of individual stocks, most notable Theolia, the French wind mill developer and operator, helped to boost returns.
Given the fact that the Fund invests in a number of less liquid stocks, there is always a risk that, during a correction in equity markets, the net asset value of the Fund will be hit significantly, in particular when forced sellers have to exit a stock no matter the price.
Table: Performance Global Opportunities Fund compared with benchmarks
Investment PolicyThe Fund was fully invested during the first half of the year, with the net long position fluctuating between 100% and 118%. While the performance in the first half of 2007 was good, the Fund did not really benefit from thebuoyant conditions in the economy.
Among other things, the strategy of the Fund is to select very specific companies that have a business plan that will allow them to (sharply) increase results, without much influence of the economy. Examples are our investments in the biotechnology sector, but also companies such as Thielert and Rock Well Petroleum. This strategy allows the Fund to take higher net long positions, as we regard these companies to be an absolute return investment in their own right. But on the other side when the economy accelerates, the Global Opportunities Fund may not greatly benefit from this. The Fund believes this was the case in the first half of 2007.
Year Jan Feb Mar Apr May Jun Jul Aug Sep Oct Nov Dec Year Cum2000 0.5 -1.9 -1.4 -1.42001 4.6 -6.7 3.6 0.6 -1.2 5.5 -5.4 2.5 -15.7 0.5 10.7 12.1 8.1 6.62002 6.4 5.1 11.6 1.5 0.4 -4.4 -5.3 3.5 -10.7 12.8 7.1 -6.1 20.8 28.82003 16.0 -5.7 -2.1 2.8 2.2 11.1 2.3 7.0 -1.7 8.8 3.5 0.5 52.3 96.22004 8.7 4.5 -1.0 3.1 0.0 1.9 1.1 0.3 3.3 -0.4 3.6 3.0 31.2 157.42005 11.2 5.7 2.5 -1.8 7.2 6.6 1.0 2.7 10.0 -3.5 7.9 5.1 68.8 334.32006 7.4 7.9 6.8 4.2 -8.2 -1.7 -1.5 0.1 3.5 0.5 0.1 2.5 22.4 431.52007 6.5 0.4 4.3 2.4 1.1 1.7 17.2 523.1
2007 2007 2007 2006 2006 2006 2006 2006 SinceE quity indices (in E uro) Ytd Q2 Q1 Year Q4 Q3 Q2 Q1 N ov 00
MSCI E urope 7.8 5.4 2.3 16.5 6.7 6.1 -4.2 7.4 2.7Global Opportunities Fund 17.2 5.2 11.4 22.4 3.1 2.0 -6.0 23.7 523.1H FRI E quity hedge (Jun 2007) 8.3 5.3 2.8 11.7 3.9 0.6 -1.1 6.6 64.0TASS Long/ Short E q (Jun 2007) 9.7 5.7 3.8 14.4 4.8 1.6 -1.6 6.9 69.9
6

A discussion of the performance of the largest stocks in the portfolio can be found below.
Table: Performance of largest positions of Global Opportunities Fund
* acquisition price in 2007** selling price in 2007
As always and in line with the investment philosophy, the performance of the Global Opportunities Fund has been determined by only a limited number of companies. In the first half of 2007 CBP Carbon, Draka, Theolia and Thielert have significantly contributed to the overall return. Rock Well Petroleum, Genmab and Crucellhave not (yet) boosted the performance.
Since one year, the Fund holds a position in CBP Carbon Industries. This company has developed a uniqueenvironmentally friendly two step procedure to reprocess used tires firstly into oil, steel and char and subsequently upgrade the char into valuable carbon. Carbon is used in many rubber products.Momentum for the group has been boosted by a press release from the European Union in April 2007 whichconcluded, after several years of investigation, that CBP Carbon s method is the only viable solution to solve the scrap tire problem. As such, this is a breakthrough recognition for the company s technology.Governments increasingly urge for environmental solutions for this problem. For example, disposal of usedtires by placing them in dumps or landfills is forbidden in Europe since 2006. Also in the United States many states have adopted this measure.The group s first plant, in Hungary, became operational in June with a yearly capacity of 3 million tires. The end products met all requirements and the production process went smoothly. The next step in the development of the company is to copy paste the concept across other facilities in Europe, America and other places, such as Australia. Given the several hundreds of million scrap tires per year the growth potential for the group is large.
Shares of Draka Holding, one of the leading cable producers around, benefited from much better than expected results. These were driven by benefits from restructuring measures and accelerated market demand. Management provided an optimistic outlook, encouraging investment analysts to significantly increase estimates. The Fund has been a shareholder in Draka Holding for a long time, but following another major rally in the shares in the first half, the shares were sold as more attractive risk reward opportunities were seen elsewhere.
The Fund retained a major exposure to the biotechnology sector. Currently many large pharmaceutical companies experience declining sales and margins on products that loose patent protection, while quite often existing pipelines do not offer sufficient compensation. At the same time, a number of biotech companies are on the brink of introducing promising new products to the market. Clearly the appetite of the cash rich pharmaceutical majors for promising biotech companies is large. Moreover, biotech companies that produce sales and earnings are likely to attract a much broader group of potential investors. Finally, from an investment point of view, the sector is largely isolated from adverse economic circumstances, which reduces the risk profile of the portfolio. That said, the performance of the sector and the stocks held by the Fund has been disappointing. Although most companies have performed in line or better than their business plans, they have not been rewarded by the
Company Share price Share price Gain/ LossE nd 2006 E nd June 07
CBP Carbon Industries 2.0 3.2 57%Crucell 19.4 16.6 -14%D raka 25.8 37.5 45%D evgen 18.1 18.8 4%Genm ab 345.0 353.5 2%Theolia 12.3 27.0 120%Stern 37.0 39.2 6%Thielert 17.8 22.7 27%Rock Well Petroleum Can $ 2.6* 2.6 0%
7
equity market. Perhaps the recovery of the economy has encouraged investors to pick other stocks that also grow fast, but do not have a comparable risk profile. Moreover, there have been numerous Initial PublicOffering's (IPO), particularly in the Benelux, diluting demand for already listed companies.
Shares of Crucell fell another 14% in the first half of 2007. The company which has gone through a major transformation in 2006 published results in line with expectations, but investors decided otherwise. Although fundamentals remain intact, the Fund decided to reduce its position.
Devgen and Monsanto announced a truly unique and long-term research and development agreement. Both parties will exchange proprietary knowledge to find and develop new potential product candidates. In addition, the technology exchange agreement with Monsanto will give Devgen access to Monsanto's technology for rice trait development. Together with its own proprietary biotech and breeding technology, this offers Devgen an attractive opportunity to create value in a large and still fragmented world crop. Devgen raised EUR 31 mln at a share price of EUR 20.75 in February, among other things to expand in rice farming. Although the share issue was 7 times oversubscribed and some positive news was published afterwards, the shares drifted lower.
At the beginning of the year a position was taken in Genmab, a Danish biotechnology company. The group has a broad pipeline of best in class fully human antibodies that could address a wide range of unmet needs. The group focuses on therapeutics for varies cancers and rheumatoid arthritis. Illustrating the huge potential of these markets, Genmab concluded the largest biotech deal ever, worth USD 2.1 billion, with GlaxoSmithKline (GSK). Clearly, GSK is one of the largest pharmaceutical groups in the world.Genmab is expected to publish good progress in various clinical trails this year while the first product should hit the market in 2008. Given the transaction with GSK, the Fund believes the valuation of Genmab shares is well supported.
Theolia s share price had a phenomenal run in the first four months of the year. The French developer of wind mill parks announced a major strategic partnership with General Electric Company (GE). GE has swapped its German wind mill portfolio into a 22% equity stake in Theolia. By securing project finance and access to wind turbines, this transaction propels Theolia to a major wind mill operator. Equally, wind energy is an important strategic growth driver for GE and investors started to speculate that the company will eventually take over Theolia. The Fund took advantage of this situation and sold the shares at EUR 27, for a 200% return in 12 months time.
Stern, the Dutch car retailer, made good progress in the first half, benefiting from a recovery in car sales in the Netherlands and continued cost reductions. The company issued new shares in June to support the aggressive growth plans of the group. The company is looking to at least double 2006 sales of EUR 756 mln in the next couple of years.
Thielert ended the half year up 27%, but the shares had another rollercoaster ride, as short sellers continued to look for reasons to drive the share price down. Now accounting problems have been solved, issues were raised about liquidity, competition from other engine manufacturers and many other things. Fundamentally, the company made excellent progress. In June, Cessna, the largest producer of rotorcraft airplanes, announced that it will start using Thielert engines. To put the Cessna announcement into perspective,the company has an installed base of 40,000 airplanes in this particular segment (Cessna 172). Every year between 5% and 10% of the engines need to be replaced. Moreover, the company sells 500 new planes every year. In 2006 Thielert sold 1,050 diesel engines. Next to Cessna, Thielert is expected to announce a transaction with Cirrus Design Corporation, another major producer of smaller airplanes.In July Thielert raised EUR 28 mln at a share price of EUR 21.75 to strengthen the financial position of the group.
8

Rock Well Petroleum (RWP), the Fund s private equity investment, made good operational progress. Business at its first oil field and pilot plant in Greybull, Wyoming went well. RWP has made enormous advances in all aspects of its business including tunneling and drilling technology. It also started development on its second oil field in Osage, Wyoming. On the financial side, developments have been slow. At the end of 2006 the company initiated a new equity financing round. Equity was needed to support major senior debt and project finance to undertake new Rock Well Technique (RWT) projects. A series of financial groups were interested to provide either equity or debt financing to the company. RWP has gone through numerous due diligence processes in all aspects of its business, including the most important part: engineering, in other words the concept of the company. RWP plans to revolutionize the oil business by extracting oil reserves via constructing a mine underneath a shallow oil field and then drilling wells straight up. It was extremely positive that all engineering feedback proved to be supportive for the RWT. RWP now has oil reserves reports from a major engineering firm in the United States, allowing the company to start booking reserves. This is of key importance, as the valuation of RWP will be driven by the ability of the group to book reserves of proprietary fields.
At the end of June, RWP was still engaged in raising equity. At the end of August the equity tranche was successfully concluded, be it at a lower price than initially indicated.The shares in Rock Well Petroleum are (still) valued at the average cost price of CAD 2.8.
The Fund has not taken a lot of short positions in the first half of 2007, as not many opportunities arose. On the short side, the Fund among other things focuses on highly rated companies that have already produced a number of years of strong growth, as well as companies that are expected to encounter negative earnings momentum. The Fund normally does not take short positions to reduce the net long position, but has the ambition to make a positive return on all of them.
Table: Result of Global Opportunities Fund from long and short positions (x 1,000 EURO)
OutlookSentiment in financial markets is currently dominated by the uncertainty created by the crisis in the sub prime segment of the mortgage market in the United States. Clearly the first question that arises is which banks or investment groups are directly affected and to what extent. The longer term question is what will happen to economic growth. In 2007, the economy in the United States has entered its seventh year of economic expansion, of which the last couple of years clearly above trend. Numbers have been boosted by additional government spending, extra consumer spending on the back of rising house prices and higher capital expenditure because of very strong corporate profits. With this in mind, economists expect moderate growth rates in the United States going forward.Economic momentum is still strong in Europe and Asia, so global economic growth rates for 2007 and 2008 still look healthy.
In conclusion the economic background still paints a positive picture for equity markets, although it is fair to argue that the risks have increased.
H1 2007 2006 2005 2004 2003
Long positions 132,283 142,680 167,081 34,051 18,121Short positions -2,695 -9,603 -4,214 -231 -218
Total 129,588 133,077 162,867 33,820 17,903
9
To the knowledge of the Fund, it has no stocks in the portfolio that have a major direct exposure to the sub prime segment of the mortgage market in the United States.
The focus of the Fund remains toward specific stocks that offer an attractive return at an acceptable level of risk.
We trust to be able to produce a good return in the coming period.
Amsterdam, 24 August 2007
The Fund ManagerGlobal Opportunities (GO) Capital Asset Management B.V.
10

Financial ReportGlobal Opportunities Fund
11
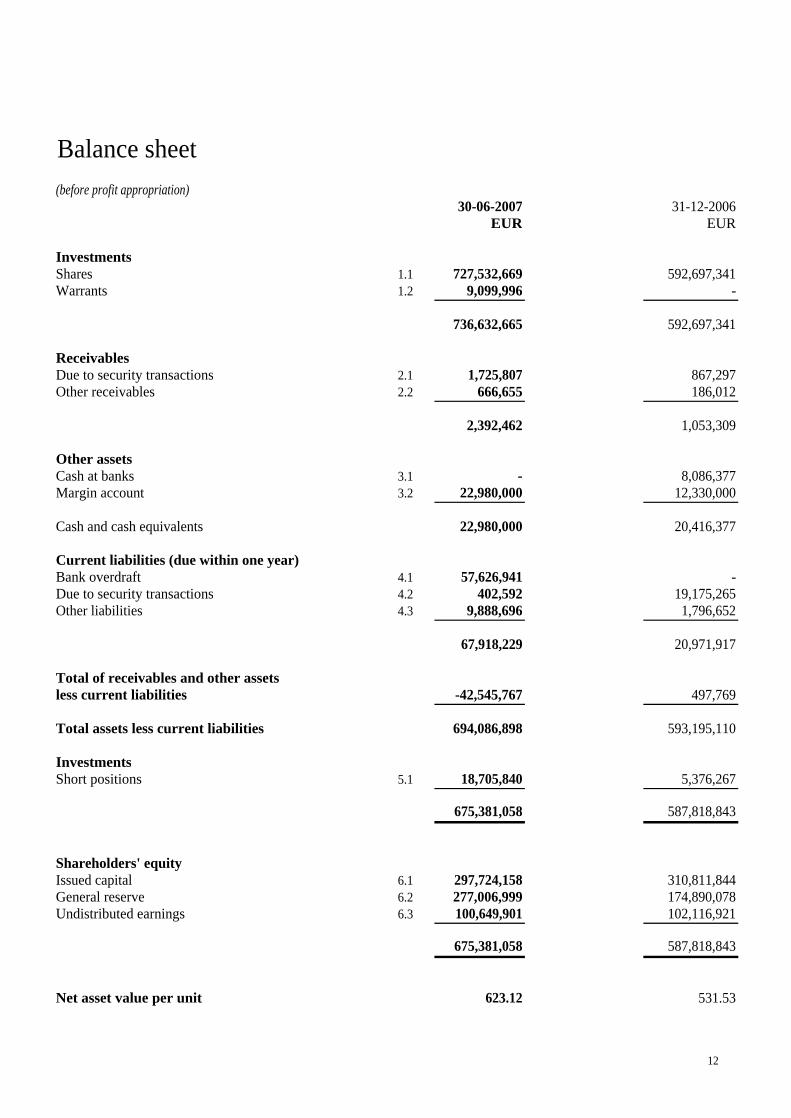
Balance sheet(before profit appropriation)
30-06-2007 31-12-2006EUR EUR
InvestmentsShares 1.1 727,532,669 592,697,341Warrants 1.2 9,099,996 -
736,632,665 592,697,341
ReceivablesDue to security transactions 2.1 1,725,807 867,297Other receivables 2.2 666,655 186,012
2,392,462 1,053,309
Other assetsCash at banks 3.1 - 8,086,377Margin account 3.2 22,980,000 12,330,000
Cash and cash equivalents 22,980,000 20,416,377
Current liabilities (due within one year)Bank overdraft 4.1 57,626,941 -Due to security transactions 4.2 402,592 19,175,265Other liabilities 4.3 9,888,696 1,796,652
67,918,229 20,971,917
Total of receivables and other assetsless current liabilities -42,545,767 497,769
Total assets less current liabilities 694,086,898 593,195,110
InvestmentsShort positions 5.1 18,705,840 5,376,267
675,381,058 587,818,843
Shareholders' equityIssued capital 6.1 297,724,158 310,811,844General reserve 6.2 277,006,999 174,890,078Undistributed earnings 6.3 100,649,901 102,116,921
675,381,058 587,818,843
Net asset value per unit 623.12 531.53
12

Profit and loss account01-01-2007 01-01-200630-06-2007 30-06-2006
EUR EUR
Income from investmentsDividends 7.1 3,384,972 1,297,259Interest income 7.2 167,651 284,304Other income 7.3 179,155 679,358
3,731,778 2,260,921Results on investmentsRealized gains/-losses 8.1 112,586,474 106,857,397Unrealized gains/-losses 8.2 17,001,474 -1,640,696Other exchange differences 8.3 -4,059 -
129,583,889 105,216,701
Total income 133,315,667 107,477,622
ExpensesInvestment management fees 9.1 30,683,898 33,620,997Depositary fee 9.2 40,258 36,518Dividends on short positions 9.3 356,665 -Interest expenses 9.4 1,412,696 524,648Other expenses 9.5 172,249 201,750
Total expenses 32,665,766 34,383,913
Result of operation 100,649,901 73,093,709
Result per unit 92.86 64.74
13

Cash flow statement 01-01-2007 01-01-200630-06-2007 30-06-2006
EUR EUR
Cash flow from investment activitiesIncome from investments 7 3,731,778 2,260,921Expenses 9 -32,665,766 -34,383,913
Investment result -28,933,988 -32,122,992
Purchases 1 -334,560,631 -364,302,600Sales 5 333,542,828 351,515,161
-1,017,803 -12,787,439
Change in receivables -1,339,153 -798,807Change in current liabilities -10,680,630 -721,799Other exchange differences -4,059 -
-12,023,842 -1,520,606
Cash flow from investment activities -41,975,633 -46,431,037
Cash flow from financing activitiesReceived on shares issued 6.1 2,922,976 129,928,148Paid on shares redeemed 6.1 -16,010,662 -11,220,405
Cash flow from financing activities -13,087,686 118,707,743
Change in cash -55,063,319 72,276,706
Cash at 1 JanuaryCash in bank 20,416,377 17,500,000Bank overdraft - -59,096,961
Cash at 30 June -34,646,942 -41,596,961
Cash in bank 3.2 22,980,000 30,679,745Bank overdraft 4.1 -57,626,941 -
Cash at 30 June -34,646,941 30,679,745
14

NotesGeneralGlobal Opportunities Fund is a contractual investment fund (beleggingsfonds of fonds voor gemene rekening ) with a semi open-end structure. The Fund is governed by the Terms and Conditions in accordance with the laws of The Netherlands.
The format of these financial statements is in accordance with legal financial reporting requirements in the Netherlands and the Guiding Principles for Investment Institutions of the Council for Reporting (Richtlijn Be-leggingsinstellingen van de Raad voor de Jaarverslaggeving). The cash flow statement has been prepared according to the reconciliation method (indirecte methode). The financial year is equal to the calendar year.
A unitholder is admitted to the Fund either by the issuance of one or more Units or, when one or more Units are transfered either legally or economically, by registration in the Register of the new Unitholder. Each Unitholder shall be entitled to redeem all or some of its Units in accordance with the provision stated in Article 13 - Redemption of Units - of the new applicable Terms and Conditions of Management and Custody which became effective on the third of October 2006.
Valutation foreign currencyAssets and liabilities in foreign currencies are translated into Euros at the exchange rate at balance sheet date. Income and expenses in foreign currencies are translated at the exchange rate as per transaction date. All exchange differences are recorded in the profit and loss account.
Basis of valuationAssets and liabilities are valued at fair value, unless explicitly indicated.
InvestmentsThe valuation of investments are valued based on the following most important principles:
- listed securities with a regular marketability are valued at most recent stock market prices. - any security which is neither listed nor quoted on any securities exchange or similar electronic system or
if, being so listed or quoted, is not regularly traded thereon or in respect of which no regular prices are available, will be valued at its probable realisation value as determind by the Fund Manager in good faith having regard to its cost price, the price at which any recent transaction in the security may have been effected, the size of the holding having regard to the total amount of such security in issue. Such other factors as the Fund Manager in its sole discretion deems relevant in considering a positive or negative adjustment to the valution.
- cash and deposits are valued at nominal value plus accrued interest. - any value other than Euros is converted to Euros at the end of year exchange rate.
Trading costs are included in the cost of investments and are part of the unrealized gains/losses.
The Fund Manager and Depositary may, at their discretion, permit any other method of valuation to be used if they consider that such method of valuation better reflects value and is in accordance with good accounting practice.
Financial instrumentsFinancial instruments are valued at fair value which is based on market values. An explanation of the risksrelated to financial instruments, is set out in the 'Notes to the balance sheet'.
15
Other assets and liablitiesOther assets and liabilities are stated at nominal value. If required, provisions have been taken for doubtfull receivables.
Investments (short positions)Short positions are valued according to principles mentioned under "investments". Short positions are lent securities which are directly sold with the purpose to buy these securities at lower prices due to expected decrease in the market value of the specific investment. The risk for the Fund is that the market value of these investments increases instead of a decrease. As a consequence the Fund needs to buy the investments at highermarket prices in order to close the short position. Each business day the short postion is revalued to market prices. The revaluation result is part of the unrealized gains/losses. As long as the short position is open the Fund makes expenses, such as interest and if applicable dividend, which the Fund needs to accrue in order to pay to the legal owner of the 'short' security. These expenses will be reported to the corresponding accounts in the profit and loss account.
Subscription and redemption feesThe Fund issues capital against Net Asset Value per unit, with a maximum markup of 1.5 %.This markup is split up in 0.5 % coverage for the benefit of the Fund to cover costs such as transactionexpenses (this amount is expressed in other income), and a distribution fee of 1 % for the Fund Manager. The Fund repurchases units from redemptions against Net Asset Value per unit, with amaximum markdown of 1% for coverage of expenses and is completely for the benefit of the Fund.
Accounting principles for determining resultsThe result is determined by deducting expenses from the proceeds of dividend, interest, income, from securities lending and other income in the period under review. The realized and unrealized revaluations of investments are determined by deducting the purchase price or the balance sheet value at the start of the period under review from the sale proceeds or the balance sheet at the end of the period under review.
TaxThe Fund opted for the tax status of fiscal investment institution according to Article 28 of the Dutch Corporate Tax Act 1969. As a fiscal investment institution, the Fund is subject to a 0% corporate tax rate, if the Fund complies to certain conditions. Therefore, no tax assets or liabilities are recorded in the interimfinancial figures.
With respect to witholding tax paid on dividends declared by Dutch companies to the Fund, the Fund is, on request, entitled to a refund by the Dutch tax authorities. With respect to withholding tax paid on dividends from foreign investments, the Fund is entitled to a refund from the Dutch tax authorities, the amount of which depends on the ratio between taxable Dutch residents and other foreign unitholders. For the remaining part on paid tax on foreign dividends, the Fund reclaims this paid tax with the foreign tax authorities. A tax reclaim for paid tax on foreign dividends depends on the tax rules between the Dutch tax authorities and the applicable foreign tax authority.
16

Notes to the balance sheet30-06-2007 31-12-2006
EUR EUR1. Investments1.1 Statement of changes in equitiesPosition at 1 January 592,697,341 445,934,714Purchases 329,350,330 501,113,947Sales -317,698,451 -497,031,064Realized gains/-losses on investments 112,798,694 104,028,653Unrealized gains/-losses on investments 19,484,751 38,651,091
Position at 30 June 736,632,665 592,697,341
Historical cost 595,927,373 471,476,799
The fund acquired warrants CPB Carbon and warrants CPB Carbon Green Industries and are a part of the total investments.
The investments as at 30 June 2007, are specified on page 29 of this report. All shares are listed, except forRock Well Petroleum and CBP Carbon Green Industries, both securities are valued at average cost price.The CBP Carbon Industries warrants are valued at fair value and the CBP Carbon Green Industries warrant is valued at zero. At balance sheet date the warrants are not listed either.
2. Receivables
2.1 Receivables due to security transactionsThis includes receivables from security transactions not yet settled as per balance sheet date.
2.2 Other receivablesReclaimable witholding tax 666,655 148,294Receivable interest on bank accounts - 2,718Receivable interest related with securities lending - 35,000
666,655 186,0123. Other assets
3.1 Cash at banksCash at banks entirely relates to credit cash balances on the current bank account.
3.2 Margin accountThe margin account of EUR 22,980,000 (at 31 December 2006 : EUR 12,330,000) is held as collateral of securities lent, due to short positions in shares. This amount is not at free disposal for the Fund.
4. Current liabilities (due within one year)
4.1 Bank overdraftBank overdraft relates to debet cash balances on the current bank account.
4.2 Liabilities due to security transactionsThese liabilities are payables from unsettled security transactions as per balance sheet date.
17

30-06-2007 31-12-2006EUR EUR
4.3 Other liabilitiesAccrued performance fee 8,370,735 -Accrued expenses 1,374,094 1,181,652Payable interest bank overdraft 143,867 -Subscriptions received in advance - 615,000
9,888,696 1,796,6525. Investments (short positions)5.1 Statement of changes in short positionsPosition at 1 January 5,376,267 17,067,895Sales 15,844,377 16,768,166Purchases -5,210,300 -31,285,966Realized gain/-loss 212,220 6,214,510Unrealized gain/-loss 2,483,276 -3,388,338
Position at 30 June 18,705,840 5,376,267
Historical cost 15,844,377 4,998,080
The short position of the Fund is specified on page 30 of this report.
30-06-2007 31-12-20066. Fund Capital Units EUR EUR6.1 Issued capitalPosition at 1 January 1,105,903 310,811,844 203,617,535Issued 5,102 2,922,976 170,988,677Repurchased -27,135 -16,010,662 -63,794,368
Position at 30 June 1,083,870 297,724,158 310,811,844
6.2 General reservePosition at 1 January 174,890,078 44,958,310Transfered from Undistributed result 102,116,921 129,931,768
Position at 30 June 277,006,999 174,890,078
6.3 Undistributed resultPosition at 1 January 102,116,921 129,931,768Transfered to General reserve -102,116,921 -129,931,768Result of the year 100,649,901 102,116,921
Position at 30 June 100,649,901 102,116,921
18

Financial instruments
GeneralThe Global Opportunities Fund may use derivates if the Fund Manager believes this is appropriate. The Fundtypically invests in equities and has no intention to use derivatives in a meaningful way. It is however to the discretion of the Fund Manager to use derivatives in a way that helps to accomplish the investment objective.
This annual report aims to give an adequate overview of all positions in portfolio at balance sheet date. In addition a clear insight regarding financial instruments requires additional information regarding positions and its potential risk due to changes in underlying assets, market prices, interest rates, exchange rates and liquidities.
At balance sheet date the Fund did not have any liabilities concerning transactions in financial derivatives.
Risk factors
Conform the Act on Financial Supervision 2007 the annual report should set out the risks involved investing in the Fund. There can be no assurance that the Fund's investment policy will be successful or that the Fund will achieve its investment objectives. An investment in Units carries a high degree of risk and is suitable only for persons who can assume the risk of losing their entire investment. Potential investors should consider, among others, the risks mentioned below, review the Prospectus and its ancillary documents such as the Subscription Agreement carefully and consult with their professional advisors. Returns on past investments are no guarantee as to the returns on future investments. The Prospectus does not purport to identify, and does not necessarily identify, all of the risk factors associated with investing in the Units and certain risks not identified herein may be substantially greater than those that are. Accordingly, each prospective investor, prior to making any invest-ment decision, must conduct and rely upon its own investigation of risk factors associated with the proposedinvestment. The value of the investments may fall as well as rise. Investment in the Fund should therefore beregarded as long-term and should form only part of an otherwise diversified investment portfolio. An invest-ment in the Fund requires the financial ability and willingness to accept for an indefinite period of time the risk and lack of liquidity inherent in the Fund.
Investment risks
Short selling
The Fund may make extensive use of short selling and synthetic short selling constructions within the limits set out in the Investment Restrictions. As there is no limited down side to such transactions, the Fund may incur heavy losses before short positions can be closed out. The Fund's vulnerability to potential losses incurred in short selling may be enlarged due to the illiquidity of the involved securities. Losses on short selling may exceedthe Net Asset Value of the involved securities. Losses on short selling may exceed the Net Asset Value of the Fund causing Unitholders to loose out on their entire investment in the Fund.
Leverage
The Fund may use borrowing for investment purposes or for financing its obligations, including the payment of redemptions, up to a maximum of 20% of the book value of the net assets of the Fund. While leverage presents opportunities for increasing total return, it has the effect of potentially increasing losses as well. If income and appreciation on investments made with borrowed funds are higher than the cost of the leverage, the Net Asset Value of the Fund and the Net Asset Value per Unit will increase. If income and appreciation on investments made with borrowed funds are less than the cost of leverage, the value of the Net Asset Value of the Fund and the Net Asset Value per Unit will decrease. Accordingly, any event which adversely affects thevalue of an investment by the Fund will be magnified to the extent leverage is employed. Repayment obligations to funding parties (including but not necessarily limited to the Prime Broker) will be secured uponthe Fund's assets. This means that funding parties will be preferred creditors of the Fund.
19

Lack of Liquidity
A substantial part of the investments of the Fund may be in financial instruments which are illiquid or may become illiquid under certain market conditions. Accordingly, it may not always be possible to purchase or sellthose financial instruments for the prices quoted on the various exchanges or for their expected value. The Fund's ability to respond to market movements may be impaired and the Fund may experience severe adverseprice movements upon liquidation of its investments. If trading on an exchange is suspended, the Fund may not be able to execute trades or sell positions at preferred prices. OTC transactions may involve additional risk, as there is no exchange or market on which to close out an open position. It may be impossible to liquidate an existing position, to assess the value of a position or to assess the exposure to risk.
Concentration of Investments
The Fund may hold relatively few, large investments in relation to the size of the Fund. The Fund could be subject to significant losses if it holds a large position in a particular investment that declines in value or is otherwise adversely affected. Lack of liquidity may aggravate such losses significantly. In addition, the Fund may own a significant percentage of the shares issued by a company. It may not always be possible to dispose of such shares without incurring significant losses. Potential profits may not always be immediately realisable and may therefore be lost prior to realisation.
Valuation of Investments in Non-Listed Financial Instruments
Valuations of investments in non-listed financial instruments will be made with all appropriate care and diligence in accordance with market standards. However, no guarantee can be given that the value attributed to such interest is entirely accurate. Therefore, the Net Asset Value of the Fund may not accurately describe theamount which may be realised upon sale of the investments of the Fund.
Redemption Risk
The Fund is a semi open-ended fund and Units may be redeemed in accordance with section 14 of the Prospectus and the Terms and Conditions. Redemptions may cause the Fund to dispose of assets in order to meet its redemption obligations earlier than anticipated or under less favourable market conditions than the Fund would otherwise have disposed of such assets. This may result in a lower Net Asset Value of the Fund generating lower or negative returns for the non-redeeming Unitholders. Significant redemptions may lead to significant losses to Unitholders which remain invested in the Fund.
Limited Due Diligence
The Fund Manager will not always carry out a business analysis and will usually not engage in extensive due diligence procedures prior to investing in certain companies.
General risks
Business Risk
The investment results of the Fund are reliant upon the success of the Fund Manager. Even though the Fund Manager has an excellent track record, returns on past investments are no guarantee as to the returns on future investments. The investment performance of the Fund is substantially dependent on the services of key individuals who are responsible for managing the investments of the Fund. These key individuals are connected with the Fund Manager. In the event of death, disability, departure, insolvency or withdrawal of any of these key individuals, the performance of the Fund may be adversely affected. No assurance can be given that the Units of the Fund will increase in value. An investment in Units therefore carries a high degree of risk and is suitable only for persons who can assume the risk of losing their entire investment.
20

Net Asset Value Considerations
The Net Asset Value per Unit is expected to fluctuate heavily over time with the performance of the Fund's investments. A Unitholder may not fully recover its initial investment when he chooses to redeem his Units orupon compulsory redemption if the Net Asset Value per Unit at the time of such redemption is less than the Subscription Amount paid by such Unitholder or if any unamortized costs and expenses of establishing the Fund remain.
Illiquidity of Units
The Units are not listed on any stock exchange. Unitholders will, however, be able to redeem their Units subject to the restrictions set out herein and in accordance with the Terms and Conditions and they have the option to transfer their Units to third parties after receiving the consent of the Fund Manager and the Depositary. As redemption is subject to the restrictions set out herein and in the Terms and Conditions, a Unitholder may not always be in the position to redeem at the expected Net Asset Value per Unit.
Inflation & Deflation
Due to inflation, the relative value of Units may decline. The Fund will not specifically hedge inflation risk or take other measures to mitigate this specific risk.
Securities Borrowing
Securities borrowing transactions may involve that borrowed securities will need to be returned to the lender on a date earlier than expected in which case such securities may need to be purchased in the market against prices which are higher than anticipated. Any re-call of securities by the lender may involve that the Fund will not be able to purchase securities in the market for redelivery in which case the Fund may incur fines or penalties, or, alternatively, it may have to pay significantly higher prices to buy back the securities.
Market risk
Settlement Risk
Some of the markets in which the Fund may effect its transactions are OTC or "interdealer" markets. The participants in such markets are typically not subject to credit evaluation and regulatory oversight as are members of "exchangebased" markets. To the extent the Fund invests in OTC transactions, on these markets, the Fund may take a credit risk with regard to parties with whom it trades and may also bear the risk of settlement default. These risks may differ materially from those entailed in exchange-traded transactions, whichgenerally are backed by clearing organisation guarantees, daily marking-to-market and settlement, and segregation and minimum capital requirements applicable to intermediaries. Transactions entered into directly between two counterparties generally do not benefit from such protections. This will expose the Fund to the risk that a counterparty will not settle a transaction in accordance with its terms and conditions because of a dispute over the terms of the contract (whether or not bonafide) or because of a credit or liquidity problem, thus causing the Fund to suffer a loss. The Fund will not be restricted from dealing with any particular counterparty or from concentrating any or all of its transactions with one counterparty. The ability of the Fund to transact business with any one or number of counterparties, the lack of any independent evaluation of suchcounterparties' financial capabilities and the absence of a regulated market to facilitate settlement may increase the potential for losses by the Fund. In addition, with respect to synthetic positions, the Fund will not usually have a contractual relationship with the underlying issuer of the underlying obligation. Therefore, the Fund willgenerally have no direct right to enforce compliance by the actual issuer with the terms of the underlyingobligation nor have any voting rights with respect to the underlying obligation. In the event of the insolvency of the counterparty to such synthetic position, the Fund will be treated as a general creditor of such counterparty and will not have any claim with respect to the underlying obligation.
21

Pre-IPO risk
"Pre-IPO" investing involves buying a stake in a company before the company makes its initial public offeringof securities. Many companies and promoters entice investors by promising an opportunity to make high returns by investing in a start-up enterprise. Investing at the pre-IPO stage can involve significant risks as fraudulent and illegal practices may take place. The possibility that the relevant company never goes public, thatthe offering is illegal or that the securities that are subscribed for are restricted may cause the Fund to loose outon its entire subscription.
Currency Exposure
The Units are denominated in Euro and will be issued and redeemed in this currency. A large part of the assetsmay, however, be invested in securities and other investments which are denominated in other currencies than the Euro. Accordingly, the value of such assets may be affected favourably or unfavourably by fluctuations incurrency rates. In addition, potential investors whose assets and liabilities are predominantly in other currencies should take into account the potential risk of loss arising from fluctuations in value between the Euro and suchother currencies. Currency exposures of the Fund will in principle not be hedged.
Risks Inherent to the use of OTC Derivatives
Margin and Leverage
The OTC derivatives used may be highly volatile and may expose the Fund to a high risk of loss. The initial margin deposits required to establish a position in such instruments permit a high degree of leverage. As a result, depending on the type of instrument, a relatively small movement in the price of a contract may result ina profit or a loss which is high in proportion to the amount of funds actually placed as initial margin and mayresult in losses exceeding the margin deposited.
Liquidity Risk
Transactions in OTC derivatives may also involve additional liquidity risk, as there is no exchange or market onwhich to close out an open position. It may be impossible to liquidate an existing position, to assess the value of a position or to assess the exposure to risk. In adverse market conditions, there may be virtually no liquiditywith very significant price movements as a result, which could lower the Net Asset Value of the Fund significantly within a short period of time.
Hedges
Appropriate hedges may not at all times be available to the Fund to cover the risks ran on derivative transactions. Therefore, the Fund may not be able to limit losses incurred in those transactions or may only beable to close out a position at significant costs to the Fund.
Other risks
Political risk
The investments of the Fund may be adversely affected by developments in the countries that the Fund may invest in. This may result in a partial or complete loss of the investments made by the Fund. Such developments include,
(i) war;(ii) civil unrest, ranging from protests to civil war;(iii) changes in the political situation and/or government of a country; and(iv) acts of terrorism.
22

Conflicts of Interest
It is possible that the Fund Manager, the Depositary or the Administrator may, in the course of business, have conflicts of interest with the Fund. Each will, at all times, have regard in such event to its obligations to the Fund and will endeavour to ensure that such conflicts are resolved fairly. In addition, subject to applicable law, any of the foregoing may deal, as principal or agent, with the Fund, provided that such dealings are carried out as if effected on normal commercial terms negotiated on an arm's length basis. The Fund Manager or any person connected with the Fund Manager may invest in, directly or indirectly, or manage or advise other investment funds or accounts which invest in assets which may also be purchased or sold by the Fund. Neither the Fund Manager nor any person connected with it is under any obligation to offer investment opportunities of which any of them becomes aware to the Fund or to account to the Fund in respect of (or share with the Fund or inform the Fund of) any such transactions or any benefit received by any of them from any such transaction, but will allocate such opportunities on an equitable basis between the Fund and other clients.
Profit Sharing
In addition to receiving a Management Fee, the Fund Manager receives a Performance Fee and accordingly thePerformance Fee will increase with regard to unrealised appreciation, as well as realised gains. The Performance Fee may create an incentive for the Fund Manager to take more risks than it would take in the absence of a fee based on the performance of the Fund.
Regulatory Risk
The regulatory environment for investment funds is evolving and changes therein may adversely affect theFund's ability to pursue its investment strategies. In addition, the regulatory and/or tax environment for derivative and related instruments is evolving and may be subject to modification by government or judicial action which may adversely affect the value of the investments held by the Fund. The effect of any future regulatory or tax change on the Fund is impossible to predict. Furthermore, unclear rules and regulations and conflicting advice may result in a breach of rules and regulations applicable to the Fund. Resulting fines and other sanctions and possible damage to the reputation of the Fund, the Fund Manager and other connected persons may result in a negative impact on the Net Asset Value of the Fund and Units.
23

Notes to the Profit and Loss account7. Income from investments7.1 DividendsThis refers to net cash dividends including reclaimable and refundable withholding tax.
7.2 Interest income /expensesThis includes the interest income and expenses as a result of the investment policy.
7.3 Other incomeThis includes the proceeds for the Fund due to subscription- and redemption fees.
8. Results on investments8.1 Realized gains/-lossesThe realized gains/- losses in the reporting period is the net change in realized result on transactions including transactions costs.
8.2 Unrealized gains/-lossesThe unrealized gains/- losses relates to the change in the unrealized result of the investments portfolio in the reporting period.
8.3 Other exchange differencesOther exchange differences are the realized results on currency exchanges due to security transactions.
01-01-2007 01-01-200630-06-2007 30-06-2006
9. Expenses EUR EUR9.1 Investment management feesPerformance fee 23,413,586 27,278,054Management fee 7,076,633 6,153,569Other fees 193,679 189,374
30,683,898 33,620,997
Performance feeThe Fund Manager is entitled to a performance fee at a rate of 20 % of any increase in the Net Asset Value ofthe Fund (including net realised gains), adjusted for subscriptions and redemptions of units and distributions. The performance fee is payable per quarter. On a daily basis an accrual for the performance fee, if applicable,will be made as a part of the Net Asset Value calculation. No performance fee shall be payable by the Fund ifthe Net Asset Value, adjusted for subscriptions and redemptions of units and distributions, at the end of a quarter is lower than the same amount at the end of any previous quarter calculated over a period of two years.
Management feeThe Fund Manager is entitled to a management fee equal to 0.18 % per month of the Net Asset Value of theFund. The management fee shall be payable out of the assets of the Fund and shall be payable at the start of the next month.
Other feesOther fees are expenses directly related to the management of investments, like custody fees, transaction costs,expenses for lending securities, and the Advisory Board fee.
24
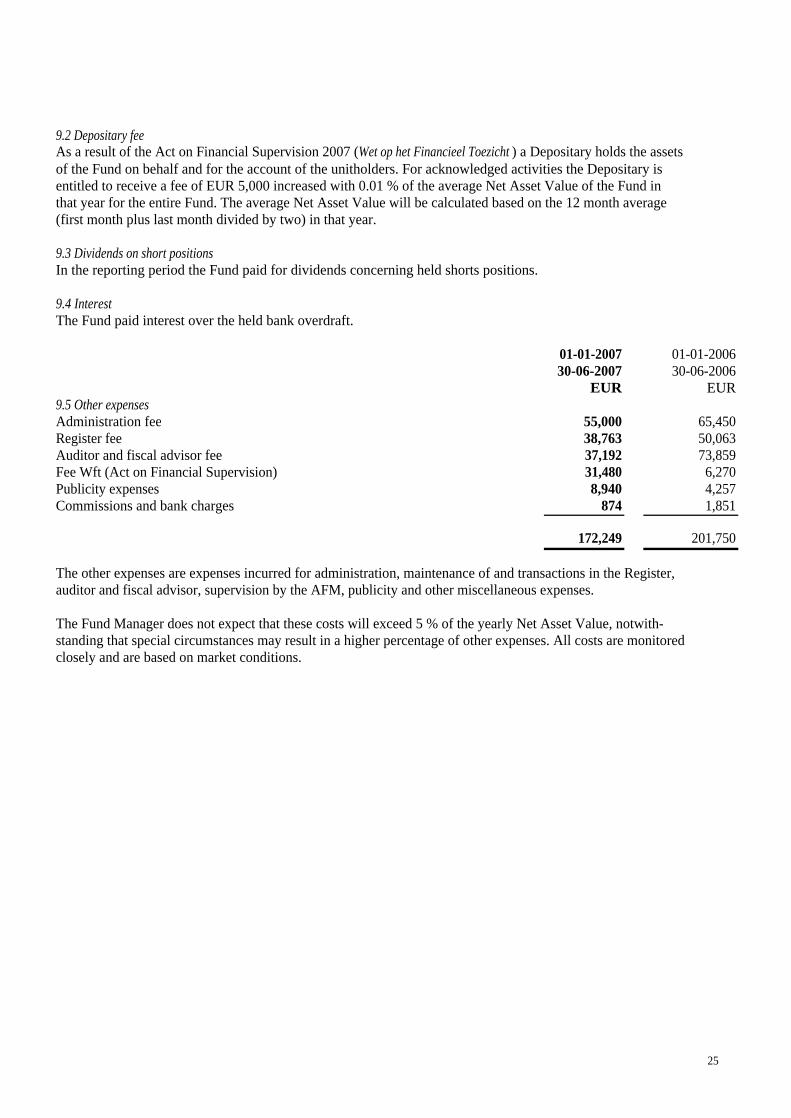
9.2 Depositary feeAs a result of the Act on Financial Supervision 2007 (Wet op het Financieel Toezicht ) a Depositary holds the assetsof the Fund on behalf and for the account of the unitholders. For acknowledged activities the Depositary is entitled to receive a fee of EUR 5,000 increased with 0.01 % of the average Net Asset Value of the Fund inthat year for the entire Fund. The average Net Asset Value will be calculated based on the 12 month average(first month plus last month divided by two) in that year.
9.3 Dividends on short positions In the reporting period the Fund paid for dividends concerning held shorts positions.
9.4 InterestThe Fund paid interest over the held bank overdraft.
01-01-2007 01-01-200630-06-2007 30-06-2006
EUR EUR9.5 Other expensesAdministration fee 55,000 65,450Register fee 38,763 50,063Auditor and fiscal advisor fee 37,192 73,859Fee Wft (Act on Financial Supervision) 31,480 6,270Publicity expenses 8,940 4,257Commissions and bank charges 874 1,851
172,249 201,750
The other expenses are expenses incurred for administration, maintenance of and transactions in the Register, auditor and fiscal advisor, supervision by the AFM, publicity and other miscellaneous expenses.
The Fund Manager does not expect that these costs will exceed 5 % of the yearly Net Asset Value, notwith-standing that special circumstances may result in a higher percentage of other expenses. All costs are monitoredclosely and are based on market conditions.
25

Supplementary notesExpense ratioThe expense ratio is calculated as follows : total expenses divided by the average Net Asset Value of the Fund.Total expenses are the costs which are reported in the profit and loss account. The expenses related to subscriptions and redemptions covered by a mark-up or down, will not be taken into account.The average Net Asset Value of the Fund is calculated as the sum of the Net Asset Values divided by the number of Net Asset Values. The average Net Asset Value of the Fund is based on the values at the followingdates : 31 December 2006, 31 March 2007 and 30 June 2007 weighted 0.5 : 1 : 0.5.
The expense ratio of the Fund for half year 2007 amounts to: 9.6 % (year 2006 : 7.4 %).
Turnover ratioThe turnover ratio represents the transaction volume in percentages as part of the Fund. The sum of sales proceeds and purchases together corrected for subscriptions and redemptions represents the transactionvolume. This volume divided by the average Net Asset Value results in the turnover ratio.
The turnover ratio of the Fund for half year 2007 amounts to: 101% (year 2006 : 146%).
Transaction costsDuring H1 2007 the transaction costs amounts to EUR 1,772,199 and can be divided into purchase transactioncosts of EUR 777,293 and sales transaction costs of EUR 994,907. All costs are part of the realized gains andlosses.
Personal interestIn the reported period, the Fund Manager did not invest personally in equities in which the Fund had a position.
Actual costs compared to prospectusThe table hereunder presents a cost comparison between costs as described in the prospectus with the actual costs. A specific calculation of these costs is not available in advance as these costs are mostly future and variable costs and contingent upon circumstances arising.
Table: Cost comparison actuals cost versus prospectus (x 1,000 EURO)
Expenses Actual cost Prospectus Difference in %
Management Fee 7,077 7,077 0%Performance Fee 23,414 23,414 0%Administration Fee 55 55 0%Depositary Fee 40 40 0%Other Fees and Expenses 2,080 2,080 0%
32,666 32,666 0%
Outsourced activitiesThe fund has outsourced the following duties:
AdministrationThe Fund has engaged Fastnet Netherlands N.V. to provide certain financial, accounting, administrative and other services to the Fund. The Administrator provides, subject to the overall direction of the Fund Manager,administrative services, for instance daily Net Asset Value calculation and general administration of the Fund.
26

Furthermore the administrator provides information for the composition of the semi-annual and annual accounts. The Administrator receives a fee with a maximum of EUR 110,000 (VAT excluded), per year. The fee is based on the following applicable percentages related to the Net Asset Value :
Net Asset Value in the range up to :
and as fromEUR 75,000,000 ; onwards any extra administration fee will not be calculated.
Investment ManagementThe Fund Manager, Global Opportunities (GO) Capital Asset Managent B.V., is charged with the management of the Fund and therefore responsible for the investment objectives, in accordance with the Funds' investment policy, and decides on the Funds investment activities. The investment policy is documentedin the prospectus dated 25 September 2000, and furthermore in the leaflet with this prospectus dated 21 June2005. The new prospectus from 3 July 2006 and the updated investment policy herein, is effective from 3 October 2006 onwards. The Fund Manager reports on a monthly basis and provides (semi-) annual reports in which the results and the market conditions are discussed. The Fund Manager receives a fee of 0.18% of eachmonth-end Net Asset Value. The Fund Manager is entitled to a performance fee at a rate of 20% of anyincrease in the Net Asset Value of the Fund (including net realised gains), adjusted for subscriptions and redemptions of units and distributions. The performance fee is payable per quarter.
Depositary activitiesThe Depositary of the Funds assets is assigned to 'Stichting Bewaarbedrijf Guestos'. This foundation holds theassets of the Fund in its name and assumes liabilities for the Fund in its name. The Depositary solely acts forand on behalf of the unitholders. The Fund is governed by the Terms and Conditions and therefore the Fund Manager and Depositary jointly dispose of the Fund capital. The Depositary is entitled to ensure that each newissue of capital to a unitholder is processed with consent of the Fund Manager. This consent of each new issueis a responsibility for the Fund Manager. The Depositary is entitled to charge a annual fee of EUR 5,000 and avariable fee of 0.01% of the average Net Asset Value. In addition the Depositary charges the Fund for maintaining the register, related to the number of transactions and number of unitholders.
Market conditionsInvestment transactions, custody, Depositary, security lending, process of transacties and outsourced activities are in line with market conditions. The Fund Manager made arrangements with Optimix and Kempen & Co concerning distribution fees and soft-dollar arrangements. The Fund partly executes the purchases and sales transactions in listed securities with Optimix. The conditions for both activities are according the Fund Manager in line with market practise.
AuditOn the interim financial statements over the first half year of 2007 no audit has been performed.
Amsterdam, 24 August 2007The Fund Manager
Global Opportunities (GO) Capital Asset Management B.V.
EUR 20,000,000: 0.20%EUR 50,000,000: 0.15%EUR 75,000,000: 0.10%
27

Portfolio Breakdown30 June 2007 Percentage total
Net Asset ValueBreakdown shares, based on MSCI - sectors Consumer Discretionary 13.2Energy
5.1Financials
7.7Healthcare 41.2Industrials
38.7Information Technology 1.8
107.7
Breakdown short positions, based on MSCI - sectors Materials -2.7
-2.7
Breakdown warrants Materials 1.3
1.3
Total investments 106.3
Total of receivables and other assets less current liabilities -6.3
Total Net Asset Value 100.0
The Net Asset Value of Global Opportunities Fund will fluctuate as a consequence of changes in currency exchange rates and changes in market prices of securities. In the presented breakdown, all investments are categorized based on the MSCI-sector categorization. This categorization indicates the potential effect in the Net Asset Value due to fluctations in investments when changes in sector valuations occur during a period. Thepresented figures are at balance sheet date and percentages will fluctuate constantly as a consequence of pricechanges.
28
Shares longat 30 June 2007, based on MSCI-sectors Percentage
market value
total Net
EUR Asset Value
Consumer Discretionary14,450,000 2WayTraffic 28,442,769
440,611 Alfacom Group 7,380,2341,366,287 Stern Groep 53,544,788
89,367,791 13.2
Energy17,664,500 Rock Well Petroleum 34,575,279
34,575,279 5.1
Financials
190,000 Altira 9,642,5001,523,969 Landesbank Berlin 9,296,211
144,000 MPC Capital 10,922,4001,333,983 SNS Reaal 22,344,215
52,205,326 7.7
Healthcare8,069,729 Aqua Bounty 3,896,1033,434,819 Crucell 56,983,6471,741,525 Curanum 13,270,4213,902,897 Devgen 73,374,4642,216,625 Genmab 105,294,0061,335,000 Metabolic Explorer 13,083,0001,200,000 Thrombogenics 12,684,000
278,585,641 41.2
Industrials
177,968 Acciona 36,002,92635,200,000 CBp Carbon Industries 62,161,34133,333,333 CBp Carbon Green Industries 14,808,781
881,680 Draka Holding 33,063,000500,000 GEA Group 12,905,000393,969 ITN Nanovation 8,312,746
4,112,572 Thielert 93,190,882
260,444,676 38.7
29

Shares longat 30 June 2007, based on MSCI-sectors Percentage
market value
total Net
EUR Asset Value
Information Technology1,428,203 Suess Microtec 12,353,956
12,353,956 1.8
Total shares 727,532,669 107.7
Total long positions 727,532,669 107.7
Shares shortMaterials
-164,000 Kali und Salz -18,705,840
Total short positions -18,705,840 -2.7
Warrants5,000,000 Warrants CBP Carbon Industries 4,201,9929,000,000 Warrants CBP Carbon Industries 4,898,004
16,666,666 Warrants CPB Carbon Green Industries -
Total warrants 9,099,996 1.3
TOTAL INVESTMENTS 717,926,825 106.3
Total of receivables and other assets less current liabilities -42,545,767 -6.3
TOTAL NET ASSET VALUE 675,381,058 100.0
30