semi-annual report ishares southeast asia trust
TRANSCRIPT

Semi-annual Report iShares Southeast Asia Trust• iShares MSCI India Index ETF
• iShares J.P. Morgan USD Asia Credit Bond Index ETF
• iShares Barclays USD Asia High Yield Bond Index ETF
(Sub-funds of iShares Southeast Asia Trust)
(Constituted under a Trust Deed in the Republic of Singapore)
For the period ended 30 June 2018
Semi-annual Report 1
Contents
Page
Manager’s Investment Report 2
Financial Statements
– Statements of Total Return 11
– Statements of Financial Position 12
– Statements of Movements of Unitholders’ Funds 13
– Statements of Portfolio 14
– Supplementary Notes 25
Management and Administration 30

2 iShares Southeast Asia Trust
Manager’s Investment ReportiShares MSCI India Index ETF
(a Sub-Fund of iShares Southeast Asia Trust)
IntroductioniShares MSCI India Index ETF (“MSCI India ETF”), a sub-fund of the iShares Southeast Asia Trust (the “Trust”), was launched and commenced trading on 15 June 2006 on the Singapore Exchange Securities Trading Limited (“SGX-ST”) under the trading name of “IS MS INDIA 100US$” and Exchange ticker of “I98”. Effective on 15 June 2012, other than the US dollar, the MSCI India ETF is also traded in Singapore dollars on SGX-ST. The Singapore dollar trading line of MSCI India ETF is under the trading name of “IS MS INDIA 100S$D” and Exchange ticker of “QK9”.
The MSCI India ETF was established as an authorised scheme under the Securities and Futures Act, Chapter 289 of Singapore and obtained designation of an exchange traded fund (“ETF”) from the SGX-ST. MSCI India ETF is benchmarked against the MSCI India Index. The Manager of MSCI India ETF is BlackRock (Singapore) Limited (the “Manager”). The Manager has appointed the Hong Kong domiciled BlackRock Asset Management North Asia Limited (the “Sub-Manager”) as the sub-manager of the MSCI India ETF under a sub-management agreement entered into between the Manager and the Sub-Manager (the “Sub-Management Agreement”). Under the Sub-Management Agreement, the Manager has discretion to delegate its investment management functions of MSCI India ETF to the Sub-Manager.
The MSCI India ETF invests in the Indian market via the Mauritius Subsidiary. The Mauritius Subsidiary is registered as a sub-account of the Manager, which is registered as a Foreign Portfolio Investor (“FPI”) with the Securities Exchange Board of India, allowing the Mauritius Subsidiary to invest directly in Indian securities.
India Tax Law ChangesOn 10 May 2016, the Indian Tax Board announced a phased removal of the capital gains tax (“CGT”) exemption under the India-Mauritius Tax Treaty. The change, effective from 1 April 2017, resulted in India retaining taxation rights on capital gains arising from sales of shares of Indian resident companies acquired by a Mauritius entity on or after 1 April 2017. Shares acquired prior to 1 April 2017 are still protected from taxing rights in India. There is a transition period from 1 April 2017 to 31 March 2019 where the tax rate is limited to 50% of India’s domestic tax rate subject to a limitation of benefits clause. Taxation in India at the full domestic tax rate will apply from financial year 2019 – 2020 onwards.
Effective 1 April 2018, capital gains (exceeding INR 100,000) realised from the sale of direct investments in India-listed securities which were held for a period of more than 12 months are subject to long-term CGT under new provisions included in the Income Tax Act. For India-listed securities held on or before 31 January 2018, any notional long term capital gains up to that date are grandfathered and sheltered from tax via a cost base step up to fair market value as at 31 January 2018 (where applicable).
The returns of the MSCI India ETF via its holdings in Indian investments may as a result be adversely impacted by these India Tax Law Changes.
For the period ended 30 June 2018, gains arising on disposal of shares by the Mauritius Subsidiary acquired prior to 1 April 2017 were not subject to tax in accordance with the above. Gains on disposal of shares acquired after 1 April 2017 will be subject to tax according to the relevant local laws. The Manager is continuing to monitor the impact of the India Tax Law Changes on the MSCI India ETF and the Mauritius Subsidiary.
A. Fund Performance1
MSCI India ETF seeks to provide investment results that closely correspond to the performance of the MSCI India Index before fees and expenses. MSCI India ETF invests into the Indian market through its wholly owned Mauritius Subsidiary which invests in Indian securities.
At the close of 30 June 2018, the NAV per unit (based on the last traded prices of the investments) of the MSCI India ETF was US$8.46 and 29,000,000 units were outstanding. The total size of the MSCI India ETF was approximately US$245.4 million.
A summary of the performance of MSCI India ETF is given below:
Total Return2 in US$ as of30 June 2018 1-Month 3-Month 6-Month 1-Year
Net DIV MSCI India Total Return Index in US$4
-0.97% -0.60% -7.51% 6.47%
Fund NAV Return in US$5 -1.10% -0.91% -8.02% 5.36%Fund Price Return (MKT) in US$6 1.41% 1.17% -6.70% 7.61%
Total Return2 in US$ as of30 June 2018
3-Year(Annualised)
5-Year(Annualised)
SinceInception3
(Annualised)
Net DIV MSCI India Total Return Index in US$4
5.34% 8.99% 8.21%
Fund NAV Return in US$5 4.25% 8.01% 6.85%Fund Price Return (MKT) in US$6 4.79% 8.38% 7.05%
Source: BlackRock and MSCI
1 Past performance figures shown are not indicative of the future performance of the Fund.2 Total returns represent the rate that an investor would have earned (or lost) on an
investment, assuming reinvestment of all dividends and distributions.3 This is annualised return since fund inception and fund inception date is 15 June 2006.4 An investor cannot invest directly in an index and the index performance returns do not
reflect management fees, transaction costs or other expenses, which would reduce performance returns.
5 Units in the Fund are issued and redeemed at their NAV in exchange for a basket of securities representing the MSCI India Index. Therefore, the Fund does not publish a bid price and the Fund’s returns have been calculated from NAVs; and assuming reinvestment of all dividends.
6 Market returns are calculated using historical market closing prices (when NAV is normally determined for the Fund), and do not represent the returns you would receive if you traded shares at other times.
Semi-annual Report 3
Manager’s Investment Report (continued)
iShares MSCI India Index ETF
(a Sub-Fund of iShares Southeast Asia Trust)
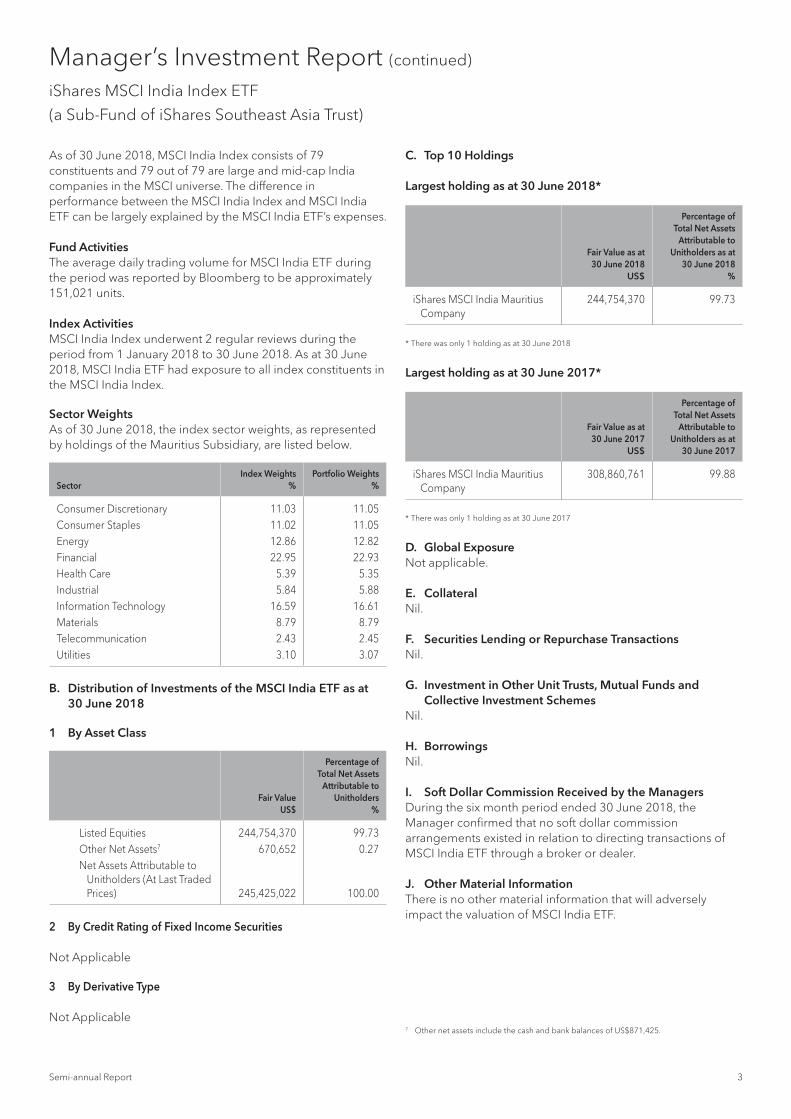
As of 30 June 2018, MSCI India Index consists of 79 constituents and 79 out of 79 are large and mid-cap India companies in the MSCI universe. The difference in performance between the MSCI India Index and MSCI India ETF can be largely explained by the MSCI India ETF’s expenses.
Fund ActivitiesThe average daily trading volume for MSCI India ETF during the period was reported by Bloomberg to be approximately 151,021 units.
Index ActivitiesMSCI India Index underwent 2 regular reviews during the period from 1 January 2018 to 30 June 2018. As at 30 June 2018, MSCI India ETF had exposure to all index constituents in the MSCI India Index.
Sector WeightsAs of 30 June 2018, the index sector weights, as represented by holdings of the Mauritius Subsidiary, are listed below.
SectorIndex Weights
%Portfolio Weights
%
Consumer Discretionary 11.03 11.05Consumer Staples 11.02 11.05Energy 12.86 12.82Financial 22.95 22.93Health Care 5.39 5.35Industrial 5.84 5.88Information Technology 16.59 16.61Materials 8.79 8.79Telecommunication 2.43 2.45Utilities 3.10 3.07
B. Distribution of Investments of the MSCI India ETF as at 30 June 2018
1 By Asset Class
Fair ValueUS$
Percentage ofTotal Net Assets
Attributable toUnitholders
%
Listed Equities 244,754,370 99.73Other Net Assets7 670,652 0.27Net Assets Attributable to
Unitholders (At Last Traded Prices) 245,425,022 100.00
2 By Credit Rating of Fixed Income Securities
Not Applicable
3 By Derivative Type
Not Applicable
C. Top 10 Holdings
Largest holding as at 30 June 2018*
Fair Value as at30 June 2018
US$
Percentage ofTotal Net Assets
Attributable toUnitholders as at
30 June 2018%
iShares MSCI India Mauritius Company
244,754,370 99.73
* There was only 1 holding as at 30 June 2018
Largest holding as at 30 June 2017*
Fair Value as at30 June 2017
US$
Percentage ofTotal Net Assets
Attributable toUnitholders as at
30 June 2017
iShares MSCI India Mauritius Company
308,860,761 99.88
* There was only 1 holding as at 30 June 2017
D. Global ExposureNot applicable.
E. CollateralNil.
F. Securities Lending or Repurchase TransactionsNil.
G. Investment in Other Unit Trusts, Mutual Funds and Collective Investment Schemes
Nil.
H. BorrowingsNil.
I. Soft Dollar Commission Received by the ManagersDuring the six month period ended 30 June 2018, the Manager confirmed that no soft dollar commission arrangements existed in relation to directing transactions of MSCI India ETF through a broker or dealer.
J. Other Material InformationThere is no other material information that will adversely impact the valuation of MSCI India ETF.
7 Other net assets include the cash and bank balances of US$871,425.

4 iShares Southeast Asia Trust
Manager’s Investment Report (continued)
iShares MSCI India Index ETF
(a Sub-Fund of iShares Southeast Asia Trust)
K. Supplemental Information on Underlying Sub-Fund
ISHARES MSCI INDIA MAURITIUS COMPANY
(i) 10 largest holdings
As at 30 June 2018
Fair Value as at30 June 2018
US$
Percentage ofTotal Net Assets
Attributable toUnitholders as at
30 June 2018%
Housing Development Finance 23,799,798 9.72Reliance Industries Limited 21,801,260 8.91Infosys Ltd 18,023,181 7.36Tata Consultancy Services Ltd 13,397,219 5.47Hindustan Unilever Limited 8,408,969 3.44Maruti Suzuki India Limited 7,362,803 3.01Axis Bank Limited 7,236,996 2.96I.T.C Limited 7,173,879 2.93Mahindra & Mahindra Limited 5,283,767 2.16ICICI Bank Limited 5,166,334 2.11
As at 30 June 2017
Fair Value as at30 June 2017
US$
Percentage of Total Net Assets Attributable to
Unitholders as at 30 June 2017
%
Housing Development Finance 28,124,603 9.11Reliance Industries Limited 20,697,662 6.70Infosys Ltd 19,871,335 6.43Tata Consultancy Services Ltd 12,899,756 4.18I.T.C Limited 12,706,583 4.11Axis Bank Limited 10,013,743 3.24Maruti Suzuki India Limited 8,820,574 2.86Hindustan Unilever Limited 8,102,441 2.62ICICI Bank Limited 7,947,208 2.57Tata Motors Limited 7,904,722 2.56
(ii) Expense Ratio
As at 30 June 2018 0.17%As at 30 June 2017 0.16%
The expense ratio has been computed based on the guidelines laid down by the Investment Management Association of Singapore (“IMAS”). The calculation of the expense ratio at 30 June 2018 and 30 June 2017 was based on total operating expenses divided by the average net asset value for the year. The total operating expenses do not include (where applicable) brokerage and other transactions costs, performance fee, interest expense, distribution paid out to unitholders, foreign exchange gains/losses, front or back end loads arising from the purchase or sale of other funds and tax deducted at source or arising out of income received. The Fund does not pay any performance fee. The average net asset value is based on the daily balances.
(iii) Turnover Ratio (unaudited)
As at 30 June 2018 3.58%As at 30 June 2017 5.47%
The portfolio turnover ratio is calculated in accordance with the formula stated in the Code on Collective Investment Schemes. The calculation of the portfolio turnover ratio was based on the lower of the total value of purchases or sales of the underlying investment divided by the average daily net asset value.

Semi-annual Report 5
IntroductioniShares J.P. Morgan USD Asia Credit Bond Index ETF (the “USD Asia Credit Bond ETF”), a sub-fund of the iShares Southeast Asia Trust (the “Trust”), was launched and commenced trading on 2 June 2011 on the Singapore Exchange Securities Trading Limited (“SGX-ST”) under the trading name of “IS ASIA BND 100US$” and Exchange ticker of “N6M”. Effective on 15 June 2012, other than the US dollar, the USD Asia Credit Bond ETF is also traded in Singapore dollars on SGX-ST. The Singapore dollar trading line of the USD Asia Credit Bond ETF is under the trading name of “IS ASIA BND 100S$D” and Exchange ticker of “QL2”.
The USD Asia Credit Bond ETF was established as an authorised scheme under the Securities and Futures Act, Chapter 289 of Singapore and obtained designation of an exchange traded fund (“ETF”) from the SGX-ST. The USD Asia Credit Bond ETF is benchmarked against the J.P. Morgan Asia Credit Index – Core (the “JACI Core”). The JACI Core consists of liquid US dollar denominated debt instruments issued out of Asia ex Japan by Asia-domiciled sovereigns, quasi-sovereigns and corporates. The Manager of the USD Asia Credit Bond ETF is BlackRock (Singapore) Limited.
A. Fund Performance1
The USD Asia Credit Bond ETF seeks to provide investment results that, before fees and expenses, closely correspond to the performance of the JACI Core in US dollar terms.
At the close of 30 June 2018, the NAV per unit (based on the bid prices of the investments) of the USD Asia Credit Bond ETF was US$10.16 and 3,747,754 units were outstanding. The total size of the USD Asia Credit Bond ETF was approximately US$38.09 million.
A summary of the performance of the USD Asia Credit Bond ETF is given below:
Total Return2 in US$ as of30 June 2018 1-Month 3-Month 6-Month 1-Year
JACI Core Total Return Index in US$4
-0.66% -1.48% -3.35% -1.30%
Fund NAV Return in US$5 -0.63% -1.47% -3.38% -1.41%Fund Price Return (MKT) in US$6 0.10% -1.15% -3.36% -1.29%
Total Return2 in US$ as of30 June 2018
3-Year(Annualised)
5-Year(Annualised)
SinceInception3
(Annualised)
JACI Core Total Return Index in US$4
3.14% 4.56% 4.74%
Fund NAV Return in US$5 3.18% 4.55% 4.60%Fund Price Return (MKT) in US$6 3.10% 4.77% 4.56%
Source: BlackRock and J.P.Morgan
Manager’s Investment Report (continued)
iShares J.P. Morgan USD Asia Credit Bond Index ETF
(a Sub-Fund of iShares Southeast Asia Trust)
As of 30 June 2018, the JACI Core consists of 903 bonds denominated in US dollars which are issued by Asia-domiciled sovereigns, quasi-sovereigns and corporates. The difference in performance between the USD Asia Credit Bond ETF and the JACI Core can be largely explained by the fees and expenses of the USD Asia Credit Bond ETF and security misweights due to the use of representative sampling.
Fund ActivitiesThe average daily trading volume for the USD Asia Credit Bond ETF during the period was reported by Bloomberg to be approximately 5,144 units.
Index ActivitiesThe JACI Core is rebalanced monthly. As at 30 June 2018, the USD Asia Credit Bond ETF held 178 bonds versus the 903 constituents in the JACI Core.
Sector WeightsAs of 30 June 2018, the index sector weights are listed below.
SectorIndex Weights
%Portfolio Weights
%
Consumer 2.96 3.06Financial 17.60 16.15Industrial 15.67 14.76Media & Telecom 5.91 6.67Oil & Gas 6.00 5.94Government Related 46.32 46.01Utilities 5.24 5.41Other 0.28 0.48
1 Past performance figures shown are not indicative of the future performance of the Fund.2 Total returns represent the rate that an investor would have earned (or lost) on an
investment, assuming reinvestment of all dividends and distributions.3 This is annualised return since fund inception and fund inception date is 27 May 2011.4 An investor cannot invest directly in an index and the index performance returns do not
reflect management fees, transaction costs or other expenses, which would reduce performance returns.
5 Units in the Fund are issued and redeemed at their NAV. Therefore, the Fund does not publish a bid price and the Fund’s returns have been calculated from NAVs.
6 Market returns are calculated using historical market closing prices (when NAV is normally determined for the Fund), and do not represent the returns you would receive if you traded shares at other times. In the event there is no trading in the market on the last day of the period the return is calculated to the last traded price in the period.

6 iShares Southeast Asia Trust
Manager’s Investment Report (continued)
iShares J.P. Morgan USD Asia Credit Bond Index ETF
(a Sub-Fund of iShares Southeast Asia Trust)
B. Distribution of Investments of the USD Asia Credit Bond ETF as at 30 June 2018
1 By Asset Class
Fair ValueUS$
Percentage ofTotal Net Assets
Attributable toUnitholders
%
Debt Securities 37,982,327 99.72Other Net Assets7 106,739 0.28Net Assets Attributable to
Unitholders (At Bid Market Prices) 38,089,066 100.00
2 By S&P, Moody’s or Fitch Credit Rating of Debt Securities
Fair ValueUS$
Percentage ofTotal Net Assets
Attributable toUnitholders as at
30 June 2018%
AAA 239,819 0.63AA+ 376,443 0.99AA 3,040,008 7.98AA- 250,105 0.66A1 194,502 0.51A+ 2,812,977 7.40A2 363,244 0.95A 1,645,181 4.32A3 195,804 0.51A- 3,872,062 10.15BBB+ 3,555,908 9.33Baa1 379,400 0.99BBB 4,255,432 11.15Baa2 594,640 1.56BBB- 7,038,541 18.50Baa3 364,318 0.96BB+ 197,600 0.52Ba2 365,967 0.96Ba3 182,657 0.48BB 190,000 0.50BB- 574,680 1.51B+ 2,662,972 6.99B 931,426 2.45B- 937,148 2.46Unrated 2,288,779 6.02Accrued interest receivable
on debt securities 472,714 1.24
3 By Derivative Type
Not applicable
C. Top 10 Holdings
10 largest holdings as at 30 June 2018
Fair value at30 June 2018
US$
Percentage ofTotal Net Assets
Attributable toUnitholders as at
30 June 2018%
Republic of Philippines 3.7% due 01/03/2041 713,969 1.87
Republic of Philippines 6.375% due 23/10/2034 549,000 1.44
Republic of Philippines 7.75% due 14/01/2031 427,700 1.12
Singtel Group Treasury P Series EMTN 3.25% due 30/06/2025 388,429 1.02
Mongolia 5.125% due 05/12/2022 373,928 0.981MDB Global Investments Series
4.4% due 09/03/2023 347,226 0.91Vedanta Resources Public Limited
Company 6.375% due 30/07/2022 330,813 0.87
Republic of Indonesia Series 5.95% due 08/01/2046 329,472 0.87
Republic of Indonesia 5.875% due 15/01/2024 321,066 0.84
Export-Import Bank of Korea 5% due 11/04/2022 313,963 0.82
7 Other net assets include the cash and bank balances of US$139,591

Semi-annual Report 7
Manager’s Investment Report (continued)
iShares J.P. Morgan USD Asia Credit Bond Index ETF
(a Sub-Fund of iShares Southeast Asia Trust)
10 largest holdings as at 30 June 2017
Fair value at30 June 2017
US$
Percentage ofTotal Net Assets
Attributable toUnitholders as at
30 June 2017%
Republic of Philippines 3.7% due 01/03/2041 783,719 2.02
Republic of Philippines 6.375% due 23/10/2034 603,477 1.55
Singtel Group Treasury P Series Emtn 3.25% due 30/06/2025 406,717 1.05
1MDB Global Investments Series 4.4% due 09/03/2023 369,500 0.95
Republic of Korea 2.75% due 19/01/2027 344,451 0.89
Pertamina 6.5% due 27/05/2041 341,961 0.88Export-Import Bank of Korea 5%
due 11/04/2022 330,633 0.85Republic of Philippines 4.2% due
21/01/2024 328,212 0.84Republic of Philippines 7.75% due
14/01/2031 324,257 0.83Republic of Indonesia 6.75% due
15/01/2044 321,975 0.83
D. Global ExposureNot applicable.
E. CollateralNil.
F. Securities Lending or Repurchase TransactionsNil.
G. Investment in Other Unit Trusts, Mutual Funds and Collective Investment Schemes
Nil.
H. BorrowingsNil.
I. Soft Dollar Commission Received by the ManagersDuring the six month period ended 30 June 2018, the Manager confirmed that no soft dollar commission arrangements existed in relation to directing transactions of the USD Asia Credit Bond ETF through a broker or dealer.
J. Other Material InformationThere is no other material information that will adversely impact the valuation of the USD Asia Credit Bond ETF.
K. Supplemental Information on Underlying Sub-FundsNot applicable.

8 iShares Southeast Asia Trust
Manager’s Investment Report (continued)
iShares Barclays USD Asia High Yield Bond Index ETF
(a Sub-Fund of iShares Southeast Asia Trust)
IntroductioniShares Barclays USD Asia High Yield Bond Index ETF (the “USD Asia High Yield Bond ETF”), a sub-fund of the iShares Southeast Asia Trust (the “Trust”), was launched and commenced trading on 8 December 2011 on the Singapore Exchange Securities Trading Limited (“SGX-ST”) under the trading name of “IS ASIA HYG100US$” and Exchange ticker of “O9P”. Effective on 15 June 2012, other than the US dollar, the USD Asia High Yield Bond ETF is also traded in Singapore dollars on SGX-ST. The Singapore dollar trading line of the USD Asia High Yield Bond ETF is under the trading name of “IS ASIA HYG100S$D” and Exchange ticker of “QL3”.
The USD Asia High Yield Bond ETF was established as an authorised scheme under the Securities and Futures Act, Chapter 289 of Singapore and obtained designation of an exchange traded fund (“ETF”) from the SGX-ST. The USD Asia High Yield Bond ETF is benchmarked against the Bloomberg Barclays Asia USD High Yield Diversified Credit Index (the “BAHY Index”). The BAHY Index consists of fixed-rate US dollar-denominated government-related and corporate high yield debt of the Asia ex-Japan region. Issuer exposures are capped at 4% of the overall index market value for diversification. The Manager of the USD Asia High Yield Bond ETF is BlackRock (Singapore) Limited.
A. Fund Performance1
The USD Asia High Yield Bond ETF seeks to provide investment results that, before fees and expenses, closely correspond to the performance of the BAHY Index in US dollar terms.
At the close of 30 June 2018, the NAV per unit (based on the bid prices of the investments) of the USD Asia High Yield Bond ETF was US$9.98 and 6,531,559 units were outstanding. The total size of the USD Asia High Yield Bond ETF was approximately US$65.2 million.
A summary of the performance of the USD Asia High Yield Bond ETF is given below:
Total Return2 in US$ as of 30 June 2018 1-Month 3-Month 6-Month 1-Year
BAHY Total Return Index in US$4 -1.54% -3.43% -4.49% -1.60%Fund NAV Return in US$5 -1.58% -3.52% -4.64% -2.02%Fund Price Return (MKT) in US$6 -1.38% -3.17% -5.06% -1.94%
Total Return2 in US$ as of 30 June 20183-Year
(Annualised)5-Year
(Annualised)
SinceInception3
(Annualised)
BAHY Total Return Index in US$4 4.23% 5.78% 7.14%Fund NAV Return in US$5 4.01% 5.52% 6.80%Fund Price Return (MKT) in US$6 3.99% 5.58% 6.73%
Source: BlackRock and Barclays
As of 30 June 2018, the BAHY Index consists of 248 bonds denominated in US dollar which are issued by Asia-domiciled sovereigns, quasi-sovereigns and corporates. The difference in performance between the USD Asia High Yield Bond ETF and the BAHY Index can be largely explained by the fees and expenses of the USD Asia High Yield Bond ETF and security misweights due to the use of representative sampling.
Fund ActivitiesThe average daily trading volume for the USD Asia High Yield Bond ETF during the period was reported by Bloomberg to be approximately 17,998 units.
Index ActivitiesThe BAHY Index is rebalanced monthly. As at 30 June 2018, the USD Asia High Yield Bond ETF held 217 bonds versus the 248 constituents in the BAHY Index.
Sector WeightsAs of 30 June 2018, the index sector weights are listed below.
SectorIndex Weights
%Portfolio Weights
%
Financial 12.92 13.13Industrial 65.63 62.80Government Related 18.74 18.93Utilities 2.71 3.12
B. Distribution of Investments of the USD Asia High Yield Bond ETF as at 30 June 2018
1 By Asset Class
Fair ValueUS$
Percentage of Total Net Assets
Attributable to Unitholders
%
Debt Securities 64,783,936 99.42Other Net Assets7 375,773 0.58Net Assets Attributable to
Unitholders (At Bid Market Prices) 65,159,709 100.00
1 Past performance figures shown are not indicative of the future performance of the Fund.2 Total returns represent the rate that an investor would have earned (or lost) on an
investment, assuming reinvestment of all dividends and distributions.3 This is annualised return since fund inception and fund inception date is 5 December 2011.4 An investor cannot invest directly in an index and the index performance returns do not
reflect management fees, transaction costs or other expenses, which would reduce performance returns.
5 Units in the Fund are issued and redeemed at their NAV. Therefore, the Fund does not publish a bid price and the Fund’s returns have been calculated from NAVs.
6 Market returns are calculated using historical market closing prices (when NAV is normally determined for the Fund), and do not represent the returns you would receive if you traded shares at other times. In the event there is no trading in the market on the last day of the period the return is calculated to the last traded price in the period.
7 Other net assets include the cash and bank balances of US$399,891.

Semi-annual Report 9
Manager’s Investment Report (continued)
iShares Barclays USD Asia High Yield Bond Index ETF
(a Sub-Fund of iShares Southeast Asia Trust)
2 By S&P, Moody’s or Fitch Credit Rating of Debt Securities
Fair ValueUS$
Percentage ofTotal Net Assets
Attributable toUnitholders as at
30 June 2018$
BBB- 492,446 0.76BB+ 2,242,927 3.44BB 5,809,513 8.91BB- 6,671,479 10.23Ba1 252,120 0.39Ba2 3,480,260 5.35Ba3 1,978,564 3.03B+ 8,420,265 12.92B 5,486,092 8.43B- 4,609,194 7.08B1 548,942 0.84B2 816,118 1.26B3 2,340,835 3.59CCC– 408,212 0.62Unrated 20,287,817 31.13Accrued interest
receivable on debt securities 939,152 1.44
3 By Derivative Type
Not applicable
C. Top 10 Holdings
10 largest holdings as at 30 June 2018
Fair Value at30 June 2018
US$
Percentage ofTotal Net Assets
Attributable toUnitholders as at
30 June 2018%
China Evergrande Group 8.75% due 28/06/2025 1,464,915 2.25
Kaisa Group Holdings Limited 9.375% due 30/06/2024 1,183,379 1.82
Proven Honour Capital 4.125% due 06/05/2026 940,560 1.44
China Reinsurance Finance Corporation 3.375% due 09/03/2022 765,040 1.17
Shimao Property Holdings Limited 8.375% due 10/02/2022 738,675 1.13
Fortune Star BVI Limited 5.25% due 23/03/2022 654,724 1.00
Third Pakistan International Sukuk Series 5.5% due 13/10/2021 604,708 0.93
Republic of Sri Lanka 6.85% due 03/11/2025 581,490 0.89
Republic of Islamic Pakistan 6.875% due 05/12/2027 565,715 0.87
NWD Mtn Limited Series Emtn 4.375% due 30/11/2022 553,713 0.85
10 largest holdings as at 30 June 2017
Fair Value at30 June 2017
US$
Percentage ofTotal Net Assets
Attributable toUnitholders as at
30 June 2017%
China Evergrande Group 8.75% due 28/06/2025 1,631,197 2.31
Lenovo Group Limited 4.7% due 08/05/2019 1,131,295 1.60
Proven Honour Capital 4.125% due 06/05/2026 1,121,131 1.59
Shimao Property Holding Limited 8.375% due 10/02/2022 992,529 1.40
Fortune Star BVI Limited 5.25% due 23/03/2022 882,297 1.25
Vedanta Resources Public Limited Company 8.25% due 07/06/2021 762,846 1.08
CITIC Pacific Limited Var Perp 752,465 1.06ABJA Investment Company 5.95%
due 31/07/2024 739,459 1.05Republic of Islamic Pakistan Series
7.25% due 15/04/2019 737,961 1.04Republic of Islamic Pakistan 8.25%
due 15/04/2024 737,588 1.04

10 iShares Southeast Asia Trust
Manager’s Investment Report (continued)
iShares Barclays USD Asia High Yield Bond Index ETF
(a Sub-Fund of iShares Southeast Asia Trust)
D. Global ExposureNot applicable.
E. CollateralNil.
F. Securities Lending or Repurchase TransactionsNil.
G. Investment in Other Unit Trusts, Mutual Funds and Collective Investment SchemesNil.
H. BorrowingsNil.
I. Soft Dollar Commission Received by the ManagersDuring the six month period ended 30 June 2018, the Manager confirmed that no soft dollar commission arrangements existed in relation to directing transactions of the USD Asia High Yield Bond ETF through a broker or dealer.
J. Other Material InformationThere is no other material information that will adversely impact the valuation of the USD Asia High Yield Bond ETF.
K. Supplemental Information on Underlying Sub-FundsNot applicable.

Semi-annual Report 11
The accompanying notes form an integral part of these financial statements.
iShares Southeast Asia Trust(Constituted under a Trust Deed in the Republic of Singapore)
Statements of Total Return (Unaudited)
For the half year ended 30 June 2018
iShares MSCI IndiaIndex ETF
iShares J.P. Morgan USDAsia Credit Bond Index ETF
iShares Barclays USDAsia High Yield Bond Index ETF
30 June2018
US$
30 June2017US$
30 June2018
US$
30 June2017US$
30 June2018
US$
30 June2017US$
IncomeInterest Income 2,090 551 795 119 1,698 313Other Income – – – – 750 10,375
2,090 551 795 119 2,448 10,688Less: ExpensesManagement Fees (1,575,397) (1,625,266) (59,672) (62,581) (177,802) (159,756)Management Fees Rebate 269,480 242,758 – – – –Other Expenses* (25,764) 676,412 (2,313) 19,970 (6,123) 39,718
(1,331,681) (706,096) (61,985) (42,611) (183,925) (120,038)
Net Losses (1,329,591) (705,545) (61,190) (42,492) (181,477) (109,350)Net Gains or Losses on InvestmentsNet (Losses)/Gains on Investments (25,224,786) 64,730,819 (1,325,859) 1,878,346 (3,134,993) 2,070,290Net Foreign Exchange Gains – 802 – – – –
Total (Deficits)/Returns for the Financial Period Before Taxation (26,554,377) 64,026,076 (1,387,049) 1,835,854 (3,316,470) 1,960,940
Taxation – – – – – –
Total (Deficits)/Returns for the Financial Period After Taxation (26,554,377) 64,026,076 (1,387,049) 1,835,854 (3,316,470) 1,960,940
* Other expenses includes GST Refund.

The accompanying notes form an integral part of these financial statements.
12 iShares Southeast Asia Trust
iShares Southeast Asia Trust(Constituted under a Trust Deed in the Republic of Singapore)
Statements of Financial Position (Unaudited)
As at 30 June 2018
iShares MSCI IndiaIndex ETF
iShares J.P. Morgan USDAsia Credit Bond Index ETF
iShares Barclays USDAsia High Yield Bond Index ETF
30 June2018
US$
31 December2017US$
30 June2018
US$
31 December2017US$
30 June2018
US$
31 December2017US$
AssetsPortfolio of Investments 244,754,370 362,989,415 37,982,327 41,273,682 64,783,936 71,928,542Due from Brokers – – 172,000 1,419,268 200,020 730,109Cash and Bank Balances 871,425 715,773 139,591 91,170 399,891 314,829Receivables 40,817 45,459 81 52 434 107
Total Assets 245,666,612 363,750,647 38,293,999 42,784,172 65,384,281 72,973,587
LiabilitiesPayables 241,590 296,698 9,933 10,732 29,572 30,336Due to Brokers – – 195,000 1,165,888 195,000 494,484
Total Liabilities 241,590 296,698 204,933 1,176,620 224,572 524,820
EquityNet Assets Attributable to Unitholders 245,425,022 363,453,949 38,089,066 41,607,552 65,159,709 72,448,767

Semi-annual Report 13
The accompanying notes form an integral part of these financial statements.
iShares Southeast Asia Trust(Constituted under a Trust Deed in the Republic of Singapore)
Statements of Movements of Unitholders’ Funds (Unaudited)
For the half year ended 30 June 2018
iShares MSCI IndiaIndex ETF
iShares J.P. Morgan USDAsia Credit Bond Index ETF
iShares Barclays USDAsia High Yield Bond Index ETF
Notes
30 June2018
US$
31 December2017US$
30 June2018
US$
31 December2017US$
30 June2018
US$
31 December2017US$
Net Assets Attributable to Unitholders at the Beginning of Financial Period/Year 363,453,949 364,769,423 41,607,552 45,893,051 72,448,767 55,847,577
OperationsChange in Net Assets Attributable to
Unitholders Resulting from Operations (26,554,377) 109,722,676 (1,387,049) 2,636,762 (3,316,470) 3,965,661Unitholders’ Contributions/(Withdrawals)Creation of Units – 21,755,250 – 6,463,411 5,889,523 22,319,525Cancellation of Units (91,474,550) (132,793,400) (1,368,486) (11,769,016) (8,011,375) (5,841,691)
Change in Net Assets Attributable to Unitholders Resulting from Net Creation and Cancellation of Units (91,474,550) (111,038,150) (1,368,486) (5,305,605) (2,121,852) 16,477,834
Distributions 3 – – (762,951) (1,616,656) (1,850,736) (3,842,305)Total (Decrease)/Increase in Net Assets
Attributable to Unitholders (118,028,927) (1,315,474) (3,518,486) (4,285,499) (7,289,058) 16,601,190
Net Assets Attributable to Unitholders at the End of Financial Period/Year 245,425,022 363,453,949 38,089,066 41,607,552 65,159,709 72,448,767

The accompanying notes form an integral part of these financial statements.
14 iShares Southeast Asia Trust
iShares Southeast Asia Trust(Constituted under a Trust Deed in the Republic of Singapore)
Statements of Portfolio (Unaudited)
As at 30 June 2018
iShares MSCI India Index ETF
Primary – By Geography
Holdings at 30 June 2018
Fair Value at 30 June 2018
Percentage ofTotal Net Assets
Attributable toUnitholders at30 June 2018
Units US$ %
Equities
IndiaiShares MSCI India Mauritius
Company 27,172,884 244,754,370 99.73
Portfolio of Investments 244,754,370 99.73Other Net Assets 670,652 0.27
Net Assets Attributable to
Unitholders 245,425,022 100.00
Primary – By Geography (Summary)
Percentage ofTotal Net Assets
Attributable toUnitholders at30 June 2018
Percentage ofTotal Net Assets
Attributable toUnitholders at31 December
2017% %
India 99.73 99.87
Portfolio of Investments 99.73 99.87Other Net Assets 0.27 0.13
Net Assets Attributable to Unitholders 100.00 100.00
Secondary – By Industry
Fair Value at30 June 2018
Percentage ofTotal Net Assets
Attributable toUnitholders at30 June 2018
Percentage ofTotal Net Assets
Attributable toUnitholders at31 December
2017US$ % %
Equities
Miscellaneous 244,754,370 99.73 99.87
Portfolio of Investments 244,754,370 99.73 99.87Other Net Assets 670,652 0.27 0.13
Net Assets Attributable to
Unitholders 245,425,022 100.00 100.00
Schedule of Securities for the iShares MSCI India Mauritius Company
Holdings at 30 June 2018
Fair Value at 30 June 2018
Percentage ofTotal Net Assets
Attributable toUnitholders at30 June 2018
Units US$ %
Quoted Equities Held by the Subsidiary
Consumer DiscretionaryBajaj Auto Limited 45,371 1,860,996 0.76Bharat Forge Limited 112,654 1,007,416 0.41Bosch Limited 3,997 1,021,488 0.42Hero Motorcorp Limited 26,698 1,353,507 0.55Mahindra & Mahindra Limited 403,272 5,283,767 2.15Maruti Suzuki India Limited 57,159 7,362,803 3.00Motherson Sumi Systems Limited 346,049 1,437,935 0.59Tata Motors Limited 856,399 3,366,099 1.37Titan Company Limited 167,827 2,151,879 0.88Zee Entertainment Enterprises
Limited 259,635 2,061,278 0.84
26,907,168 10.97
Consumer StaplesAvenue Supermarts Limited 68,463 1,484,273 0.60Britannia Industries Limited 15,232 1,381,418 0.56Dabur India Limited 280,900 1,604,879 0.65Godrej Consumer Products
Limited 128,922 2,306,352 0.94Hindustan Unilever Limited 351,059 8,408,969 3.43I.T.C Limited 1,846,425 7,173,879 2.92Marico Limited 241,890 1,170,880 0.48Nestle India Limited 12,401 1,775,597 0.72United Spirits Limited 166,715 1,617,998 0.66
26,924,245 10.96
EnergyBharat Petroleum Corporation
Limited 403,467 2,198,267 0.90Coal India Limited 359,679 1,387,742 0.57Hindustan Petroleum
Corporation 327,041 1,237,233 0.50Indian Oil Corporation Limited 785,752 1,789,058 0.73Oil & Natural Gas Corporation
Limited 763,194 1,764,430 0.72Petronet LNG Limited 331,428 1,060,337 0.43Reliance Industries Limited 1,536,031 21,801,260 8.88
31,238,327 12.73
FinancialAxis Bank Limited 970,718 7,236,996 2.95Bajaj Finance Limited 93,235 3,124,866 1.27Bajaj Finserv Limited 20,481 1,740,085 0.71Housing Development Finance
Corporation Limited 854,590 23,799,798 9.70ICICI Bank Limited 1,285,299 5,166,334 2.11Indiabulls Housing Finance
Limited 149,896 2,499,543 1.02LIC Housing Finance 157,600 1,078,001 0.44Mahindra & Mahindra Financial
Services Limited 161,717 1,108,522 0.45Rural Electrification Corporation
Limited 346,473 529,204 0.21Shriram Transport Finance 78,751 1,493,585 0.61State Bank Of India Limited 933,365 3,533,069 1.44Yes Bank Limited 919,860 4,560,030 1.86
55,870,033 22.77

Semi-annual Report 15
iShares Southeast Asia Trust(Constituted under a Trust Deed in the Republic of Singapore)
Statements of Portfolio (Unaudited) (continued)
The accompanying notes form an integral part of these financial statements.
As at 30 June 2018
Holdings at 30 June 2018
Fair Value at 30 June 2018
Percentage ofTotal Net Assets
Attributable toUnitholders at30 June 2018
Units US$ %
Health CareAurobindo Pharmaceuticals
Limited 137,161 1,215,361 0.50Cadila Healthcare Limited 111,699 615,270 0.25Cipla Limited 185,340 1,668,101 0.68Dr Reddy’s Laboratory Limited 61,433 2,004,026 0.82Glenmark Pharmaceuticals
Limited 70,083 596,393 0.24Lupin Limited 120,443 1,588,796 0.65Piramal Enterprises Limited 43,720 1,618,434 0.66Sun Pharmaceutical Industry
Limited 453,995 3,737,184 1.52
13,043,565 5.32
IndustrialAdani Port & Special Economic
Zone Limited 279,911 1,524,466 0.62Ashok Leyland Limited 643,978 1,182,404 0.48Bharat Heavy Electricals Limited 493,203 516,490 0.21Container Corporation Of India
Limited 89,610 853,070 0.35Eicher Motors Limited 7,147 2,982,353 1.22Havells India Limited 136,956 1,086,113 0.44Interglobe Aviation Limited 50,606 803,979 0.33Larsen & Toubro Limited 257,601 4,794,089 1.95Siemens India Limited 39,990 572,199 0.23
14,315,163 5.83
Information TechnologyHCL Technologies Limited 300,016 4,055,898 1.65Infosys Ltd 944,659 18,023,181 7.34Tata Consultancy Services Ltd 496,772 13,397,219 5.46Tech Mahindra Limited 252,825 2,418,655 0.99Vakrangee Limited 253,408 247,250 0.10Wipro Limited 607,197 2,317,478 0.94
40,459,681 16.48
MaterialsAmbuja Cements Limited 324,366 982,117 0.40Asian Paints Limited 155,578 2,871,205 1.17Grasim Industries Limited 175,044 2,572,328 1.05Hindalco Industries 636,007 2,139,672 0.87JSW Steel Limited 457,399 2,181,683 0.89Pidilite Industries Limited 66,844 1,037,562 0.42Shree Cements Limited 4,524 1,027,034 0.42Tata Steel Limited 185,230 1,534,910 0.62Ultratech Cement Limited 51,963 2,896,094 1.18UPL Limited 192,394 1,737,625 0.71Vedanta Limited 703,387 2,424,871 0.99
21,405,101 8.72
TelecommunicationBharti Airtel Limited 756,407 4,216,736 1.72Bharti Infratel Limited 183,897 806,688 0.33Idea Cellular Limited 1,083,296 938,388 0.38
5,961,812 2.43
UtilitiesGail India Limited 426,716 2,119,100 0.86NTPC Limited 1,069,883 2,492,984 1.02Power Grid Corporation of India
Limited 835,134 2,277,527 0.93Tata Power Company Limited 559,447 598,110 0.24
7,487,721 3.05
Holdings at 30 June 2018
Fair Value at 30 June 2018
Percentage ofTotal Net Assets
Attributable toUnitholders at30 June 2018
Units US$ %
Total Value of Equities Held by the Subsidiary 243,612,816 99.26
Other Net Assets of the Subsidiary 1,141,554 0.47
Net Assets Attributable to
Unitholders of the Subsidiary 244,754,370 99.73

16 iShares Southeast Asia Trust
iShares Southeast Asia Trust(Constituted under a Trust Deed in the Republic of Singapore)
Statements of Portfolio (Unaudited) (continued)
The accompanying notes form an integral part of these financial statements.
As at 30 June 2018
iShares J.P. Morgan USD Asia Credit Bond Index ETF
Primary – By Industry
Holdings at 30 June 2018
Fair Value at 30 June 2018
Percentage ofTotal Net Assets
Attributable toUnitholders at30 June 2018
Units US$ %
Bonds – Quoted
ConsumerGOHL Capital Limited 4.25% due
24/01/2027 200,000 188,406 0.49IOI Investment Series Emtn
4.375% due 27/06/2022 200,000 200,354 0.53Melco Resorts Finance 4.875%
due 06/06/2025 200,000 190,000 0.50Parkway Pantai Limited Series
Emtn Var Perp 200,000 186,557 0.49Studio City Company Limited
Series 7.25% due 30/11/2021 200,000 207,408 0.55Wynn Macau Limited Series
4.875% due 01/10/2024 200,000 190,500 0.50
1,163,225 3.06
FinancialAIA Group Limited 3.2% due
11/03/2025 200,000 191,674 0.50AIA Group Limited 4.5% due
16/03/2046 200,000 209,676 0.55Axis Bank/Dubai 2.875% due
01/06/2021 200,000 192,910 0.51Bangkok Bank Public Company
Limited 3.875% due 27/09/2022 200,000 200,992 0.53
Bangkok Bank Public Company Limited 4.8% due 18/10/2020 100,000 102,856 0.27
Bangkok Bank Public Company Limited 5% due 03/10/2023 200,000 210,477 0.55
Bank of China/Macau Series Emtn 2.875% due 20/04/2022 200,000 194,502 0.51
Bank of East Asia Limited Series Var due 20/11/2024 200,000 199,938 0.52
China Cinda Finance 2017 3.65% due 09/03/2022 225,000 221,516 0.58
CIMB Bank Berhad Series Emtn 3.263% due 15/03/2022 200,000 195,804 0.51
CITIC Limited 6.625% due 15/04/2021 100,000 106,868 0.28
DBS Group Holdings Limited Series GMTN Var Perp 200,000 190,994 0.50
Huarong Finance II Co Limited Series Emtn 5.5% due 16/01/2025 200,000 204,577 0.54
Hyundai Capital Services Incorporation 2.625% due 29/09/2020 200,000 195,667 0.51
ICBC Asia Limited Series Emtn 5.125% due 30/11/2020 100,000 102,856 0.27
ICBCIL Finance Company Limited 3.2% due 10/11/2020 200,000 196,963 0.52
ICICI Bank Limited / Dubai Series Gmtn 3.25% due 09/09/2022 200,000 191,246 0.50
ICICI Bank Limited 5.75% due 16/11/2020 200,000 207,826 0.55
Holdings at 30 June 2018
Fair Value at 30 June 2018
Percentage ofTotal Net Assets
Attributable toUnitholders at30 June 2018
Units US$ %
Industrial & Commercial Bank of China Limited Series 4.875% due 21/09/2025 200,000 202,306 0.53
Kasikornbank Public Company Limited HK Series Emtn 3.256% due 12/07/2023 200,000 194,386 0.51
Krung Thai Bank Public Company Limited Series Emtn Var due 26/12/2024 200,000 202,926 0.53
Nanyang Commercial Bank Var Perpetual 200,000 185,467 0.49
Oversea-Chinese Banking Corporation Series 4.25% due 19/06/2024 200,000 200,039 0.53
Rural Electrification Corporation Limited Series Emtn 3.875% due 07/07/2027 200,000 181,344 0.48
Shinhan Bank 2.875% due 28/03/2022 200,000 194,040 0.51
Siam Commercial Bank Series Gmtn 3.2% due 26/07/2022 200,000 195,105 0.51
Skysea International Cap Series Emtn 4.875% due 07/12/2021 100,000 103,747 0.27
State Bank of India Series Emtn 3.25% due 24/01/2022 200,000 194,640 0.51
State Elite Global Limited Series Emtn 2.75% due 13/06/2022 200,000 193,277 0.51
United Overseas Bank Limited Emtn Var due 19/09/2024 200,000 199,827 0.52
United Overseas Bank Limited Series Emtn Var due 16/09/2026 200,000 196,305 0.52
Woori Bank 5% Perpetual 200,000 197,600 0.52Woori Bank Series 2.625% due
20/07/2021 200,000 194,079 0.51
6,152,430 16.15
IndustrialABJA Investment Company
5.45% due 24/01/2028 200,000 168,500 0.44Capitaland Treasury Limited
Emtn 4.076% due 20/09/2022 200,000 200,991 0.53China Evergrande Group 7.5%
due 28/06/2023 200,000 178,725 0.47China Overseas Finance Cayman
II 5.5% due 10/11/2020 100,000 103,900 0.27CK Hutchison International 17
Limited 2.875% due 05/04/2022 200,000 195,107 0.51
CK Hutchison International 17 Limited 3.5% due 05/04/2027 200,000 192,040 0.50
Formosa Group Cayman Limited 3.375% due 22/04/2025 200,000 191,762 0.50
Franshion Development Limited 6.75% due 15/04/2021 100,000 106,165 0.28
Global Logistic Properties Ltd 3.875% due 04/06/2025 200,000 185,928 0.49
HLP Finance Limited Series Emtn 4.45% due 16/04/2021 200,000 202,761 0.53
Hong Kong Land Finance 4.5% due 07/10/2025 150,000 156,178 0.41
Hutchison Whampoa International 11 Limited 4.625% due 13/01/2022 200,000 206,692 0.54

Semi-annual Report 17
iShares Southeast Asia Trust(Constituted under a Trust Deed in the Republic of Singapore)
Statements of Portfolio (Unaudited) (continued)
The accompanying notes form an integral part of these financial statements.
As at 30 June 2018
Holdings at 30 June 2018
Fair Value at 30 June 2018
Percentage ofTotal Net Assets
Attributable toUnitholders at30 June 2018
Units US$ %
Hutchison Whampoa International Limited 7.45% due 24/11/2033 200,000 270,353 0.71
Hyundai Capital America 3% due 30/10/2020 200,000 197,254 0.52
ICTSI Treasury 4.625% due 16/01/2023 200,000 196,774 0.52
JGSH Philippines Limited 4.375% due 23/01/2023 200,000 197,804 0.52
Link Finance Cayman 2009 Series Emtn 3.6% due 03/09/2024 200,000 197,530 0.52
New World Development Company 5.25% due 26/02/2021 200,000 205,097 0.54
NWD Finance (BVI) Limited 5.75% Perp 200,000 181,793 0.48
Olam International Limited Series Emtn Var Perp 200,000 190,111 0.50
POSCO 4.25% due 28/10/2020 200,000 202,903 0.53POSCO 5.25% due 14/04/2021 50,000 52,040 0.14Radiant Access Limited 4.6% due
18/11/2065 200,000 168,000 0.44Sun Hung Kai Properties Limited
3.375% due 25/02/2024 200,000 199,811 0.53Sunac China Holdings Limited
6.875% due 08/08/2020 200,000 195,000 0.51Swire Pacific Mtn Financial Series
Emtn 3.875% due 21/09/2025 200,000 199,384 0.52Swire Propert Mtn Financial
Series Emtn 3.625% due 13/01/2026 200,000 195,244 0.51
Theta Capital Pte Limited 7% due 11/04/2022 200,000 161,659 0.42
Vedanta Resources Public Limited Company 6.375% due 30/07/2022 350,000 330,813 0.87
Yuzhou Properties Company Limited 6.375% due 06/03/2021 200,000 193,750 0.51
5,624,069 14.76
Media & TelecomAlibaba Group Holding 3.125%
due 28/11/2021 300,000 296,697 0.78Axiata Spv2 Series 4.357% due
24/03/2026 200,000 198,865 0.52Bharti Airtel International 5.35%
due 20/05/2024 200,000 198,437 0.52Bharti Airtel Limited Series
4.375% due 10/06/2025 200,000 184,728 0.49Flextronics International Limited
4.75% due 15/06/2025 200,000 203,000 0.53Foxconn Far East Limited Series
Emtn 2.25% due 23/09/2021 200,000 191,555 0.50KT Corporation 2.5% due
18/07/2026 200,000 179,646 0.47PCCW HKT Capital No.2 Limited
3.625% due 02/04/2025 200,000 194,283 0.51Proven Glory Capital Limited
Series Emtn 4% due 21/02/2027 200,000 185,525 0.49
Singtel Group Treasury P Series Emtn 3.25% due 30/06/2025 400,000 388,429 1.02
Holdings at 30 June 2018
Fair Value at 30 June 2018
Percentage ofTotal Net Assets
Attributable toUnitholders at30 June 2018
Units US$ %
SK Telecom Company Limited 6.625% due 20/07/2027 100,000 118,826 0.31
StatsChippac Limited Series 8.5% due 24/11/2020 200,000 201,030 0.53
2,541,021 6.67
Oil & GasBharat Petroleum Corporation
Limited 4.625% due 25/10/2022 200,000 202,317 0.53
CNOOC Finance 2013 Limited 3% due 09/05/2023 200,000 192,744 0.51
CNOOC Finance 2013 Limited 4.25% due 09/05/2043 200,000 191,125 0.50
CNPC General Capital 3.95% due 19/04/2022 200,000 202,057 0.53
Indian Oil Corporation Limited 5.625% due 02/08/2021 200,000 208,323 0.55
Nexen Energy ULC 7.875% due 15/03/2032 50,000 67,336 0.18
ONGC Videsh Limited Series 4.625% due 15/07/2024 200,000 199,986 0.53
PTT Global Chemical PCL 4.25% due 19/09/2022 200,000 202,871 0.53
PTTEP Canada International Finance 6.35% due 12/06/2042 200,000 246,867 0.65
Reliance Holdings USA Incorporation 4.5% due 19/10/2020 250,000 253,138 0.66
Reliance Holdings USA Incorporation 6.25% due 19/10/2040 250,000 292,695 0.77
2,259,459 5.94
Government Related1MDB Global Investments Series
4.4% due 09/03/2023 400,000 347,226 0.91China Development Bank Series
EMTN 2.5% due 09/10/2020 200,000 196,227 0.52Export-Import Bank of China
2.625% due 14/03/2022 200,000 193,799 0.51Export-Import Bank Of India
3.375% due 05/08/2026 200,000 184,319 0.48Export-Import Bank Of India
Series Emtn 3.125% due 20/07/2021 200,000 194,799 0.51
Export-Import Bank of Korea 2.375% due 21/04/2027 200,000 176,994 0.47
Export-Import Bank of Korea 3% due 01/11/2022 300,000 291,827 0.77
Export-Import Bank of Korea 3.25% due 10/11/2025 200,000 191,459 0.50
Export-Import Bank of Korea 4% due 29/01/2021 200,000 202,336 0.53
Export-Import Bank of Korea 5% due 11/04/2022 300,000 313,963 0.82
Hong Kong Sukuk 2017 Limited 3.132% due 28/02/2027 200,000 192,457 0.51
Korea Development Bank 2.5% due 13/01/2021 200,000 195,247 0.51
Korea Development Bank 3% due 14/09/2022 200,000 195,312 0.51
Korea Finance Corporation 4.625% due 16/11/2021 200,000 206,441 0.54

18 iShares Southeast Asia Trust
iShares Southeast Asia Trust(Constituted under a Trust Deed in the Republic of Singapore)
Statements of Portfolio (Unaudited) (continued)
The accompanying notes form an integral part of these financial statements.
As at 30 June 2018
Holdings at 30 June 2018
Fair Value at 30 June 2018
Percentage ofTotal Net Assets
Attributable toUnitholders at30 June 2018
Units US$ %
Korea National Oil Corporation Series 2% due 24/10/2021 200,000 189,618 0.50
Korea National Oil Corporation Series 3.25% due 01/10/2025 200,000 190,109 0.50
Malaysia Sovereign Sukuk 4.236% due 22/04/2045 200,000 197,976 0.52
Malaysia Sukuk Global 3.179% due 27/04/2026 250,000 237,400 0.62
Mongolia 5.125% due 05/12/2022 400,000 373,928 0.98
Mongolia International Bond Series 10.875% due 06/04/2021 200,000 222,836 0.59
Pertamina 5.25% due 23/05/2021 200,000 206,500 0.54
Pertamina 6.5% due 27/05/2041 200,000 210,600 0.55Pertamina Persero 6.45% due
30/05/2044 200,000 209,400 0.55Perusahaan Listrik Negar 4.125%
due 15/05/2027 200,000 184,000 0.48Perusahaan Penerbit Sbsn 4.15%
due 29/03/2027 200,000 192,566 0.51Perusahaan Penerbit Sbsn 4.35%
due 10/09/2024 200,000 198,806 0.52Perusahaan Penerbit Sbsn 4.55%
due 29/03/2026 200,000 198,136 0.52Petronas Capital Limited 3.125%
due 18/03/2022 200,000 196,887 0.52Petronas Capital Limited 3.5%
due 18/03/2025 200,000 193,544 0.51Petronas Capital Limited 4.5%
due 18/03/2045 200,000 199,075 0.52Petronas Capital Limited 7.875%
due 22/05/2022 150,000 172,021 0.45Power Sector Asset & Liabilities
7.39% due 02/12/2024 200,000 236,300 0.62PSA International Private Limited
Gmtn 3.875% due 11/02/2021 200,000 202,993 0.53PT Pelabuhan Indo II 4.25% due
05/05/2025 200,000 190,784 0.50Republic of Indonesia 3.7% due
08/01/2022 200,000 198,068 0.52Republic of Indonesia 3.75% due
25/04/2022 300,000 296,952 0.78Republic of Indonesia 4.125%
due 15/01/2025 200,000 196,014 0.52Republic of Indonesia 4.75% due
08/01/2026 200,000 202,812 0.53Republic of Indonesia 5.125%
due 15/01/2045 200,000 197,652 0.52Republic of Indonesia 5.875%
due 15/01/2024 300,000 321,066 0.84Republic of Indonesia 6.75% due
15/01/2044 250,000 297,788 0.78Republic of Indonesia 7.75% due
17/01/2038 200,000 257,200 0.68Republic of Indonesia 8.5% due
12/10/2035 150,000 202,179 0.53Republic of Indonesia Series
4.35% due 08/01/2027 200,000 197,060 0.52Republic of Indonesia Series
5.95% due 08/01/2046 300,000 329,472 0.87Republic of Islamic Pakistan
6.875% due 05/12/2027 250,000 216,176 0.57
Holdings at 30 June 2018
Fair Value at 30 June 2018
Percentage ofTotal Net Assets
Attributable toUnitholders at30 June 2018
Units US$ %
Republic of Islamic Pakistan 8.25% due 15/04/2024 300,000 287,625 0.76
Republic of Korea 2.75% due 19/01/2027 200,000 188,808 0.50
Republic of Korea 4.125% due 10/06/2044 100,000 106,067 0.28
Republic of Philippines 10.625% due 16/03/2025 200,000 278,674 0.73
Republic of Philippines 3.7% due 01/03/2041 775,000 713,969 1.87
Republic of Philippines 3.7% due 02/02/2042 200,000 184,100 0.48
Republic of Philippines 4% due 15/01/2021 250,000 253,010 0.66
Republic of Philippines 4.2% due 21/01/2024 300,000 305,865 0.80
Republic of Philippines 6.375% due 15/01/2032 200,000 239,400 0.63
Republic of Philippines 6.375% due 23/10/2034 450,000 549,000 1.44
Republic of Philippines 7.75% due 14/01/2031 325,000 427,700 1.12
Republic of Philippines 9.5% due 02/02/2030 200,000 291,500 0.77
Republic of Sri Lanka 5.75% due 18/01/2022 200,000 196,400 0.52
Republic of Sri Lanka 5.75% due 18/04/2023 200,000 191,600 0.50
Republic of Sri Lanka 5.875% due 25/07/2022 200,000 196,544 0.52
Republic of Sri Lanka 6.2% due 11/05/2027 300,000 274,290 0.72
Republic of Sri Lanka 6.25% due 04/10/2020 200,000 202,660 0.53
Republic of Sri Lanka 6.825% due 18/07/2026 200,000 191,600 0.50
Republic of Sri Lanka 6.85% due 03/11/2025 300,000 290,859 0.76
Republic of Vietnam 4.8% due 19/11/2024 200,000 198,772 0.52
Sinopec Group Oversea 2012 3.9% due 17/05/2022 300,000 302,395 0.79
Sinopec Group Oversea 2014 4.375% due 10/04/2024 200,000 204,378 0.54
SP Powerassets Limited 3.25% due 24/11/2025 200,000 194,300 0.51
SSG Resources Limited 4.25% due 04/10/2022 200,000 200,406 0.53
State Grid Overseas Investment 3.125% due 22/05/2023 200,000 195,020 0.51
State Grid Overseas Investment Series 3.5% due 04/05/2027 200,000 190,976 0.50
Temasek Financial I Ltd 2.375% due 23/01/2023 250,000 239,819 0.63
Third Pakistan International Sukuk Series 5.5% due 13/10/2021 250,000 232,625 0.61
17,526,686 46.01
UtilitiesAzure Power Energy Limited
Series due 03/11/2022 200,000 182,657 0.48Greenko Dutch BV Series 5.25%
due 24/07/2024 200,000 180,500 0.47HK Electric Finance Series Emtn
4.25% due 14/12/2020 200,000 203,857 0.54

Semi-annual Report 19
iShares Southeast Asia Trust(Constituted under a Trust Deed in the Republic of Singapore)
Statements of Portfolio (Unaudited) (continued)
The accompanying notes form an integral part of these financial statements.
As at 30 June 2018
Holdings at 30 June 2018
Fair Value at 30 June 2018
Percentage ofTotal Net Assets
Attributable toUnitholders at30 June 2018
Units US$ %
Korea Gas Corporation 3.875% due 12/02/2024 250,000 250,105 0.66
Korea Hydro & Nuclear Power 3% due 19/09/2022 200,000 194,534 0.51
Minejesa Capital BV Series 4.625% due 10/08/2030 200,000 182,974 0.48
NTPC Limited Series Emtn 4.25% due 26/02/2026 200,000 192,971 0.51
OVPH Limited 5.875% Perp 200,000 194,608 0.51Power Grid Corp of India 3.875%
due 17/01/2023 100,000 98,239 0.26San Miguel Corporation 4.875%
due 26/04/2023 200,000 194,140 0.51TNB Global Ventures Cap
3.244% due 19/10/2026 200,000 184,152 0.48
2,058,737 5.41
OthersMTR Corporation Limited 2.5%
due 02/11/2026 200,000 183,986 0.48
183,986 0.48
Accrued Interest Receivable on Debt Securities 472,714 1.24
Portfolio of Investments 37,982,327 99.72Other Net Assets 106,739 0.28
Net Assets Attributable to
Unitholders 38,089,066 100.00
Primary – By Industry (Summary)
Percentage ofTotal Net Assets
Attributable toUnitholders at
30 June2018
Percentage ofTotal Net Assets
Attributable toUnitholders at31 December
2017% %
Consumer 3.06 2.82Financial 16.15 16.57Industrial 14.76 15.34Media & Telecom 6.67 5.74Oil & Gas 5.94 7.44Government Related 46.01 44.72Utilities 5.41 5.36Others 0.48 –
Accrued Interest Receivable on Debt Securities 1.24 1.21
Portfolio of Investments 99.72 99.20Other Net Assets 0.28 0.80
Net Assets Attributable to Unitholders 100.00 100.00
Secondary – By Geography
Fair Value at30 June
2018
Percentage ofTotal Net Assets
Attributable toUnitholders at
30 June2018
Percentage ofTotal Net Assets
Attributable toUnitholders at31 December
2017US$ % %
BY COUNTRY
Bermuda – – 0.63British Virgin Islands – – 1.50Canada – – 0.80Cayman Islands – – 0.96China 4,722,431 12.41 9.53Great Britain – – 0.48Hong Kong 4,325,936 11.35 11.80India 4,040,388 10.62 10.26Indonesia 4,448,714 11.68 11.87Macau 587,908 1.55 0.48Malaysia 2,898,673 7.60 7.24Mongolia 596,764 1.57 1.51Netherlands 182,974 0.48 0.89Pakistan 736,426 1.94 1.41Philippines 4,068,236 10.67 10.67Singapore 2,793,766 7.34 6.95South Korea 4,424,875 11.62 11.25Sri Lanka 1,543,953 4.05 3.60Taiwan 383,317 1.00 0.48Thailand 1,556,480 4.08 3.25USA – – 1.92Vietnam 198,772 0.52 0.51
Accrued Interest Receivable on Debt Securities 472,714 1.24 1.21
Portfolio of Investments 37,982,327 99.72 99.20Other Net Assets 106,739 0.28 0.80
Net Assets Attributable to
Unitholders 38,089,066 100.00 100.00

20 iShares Southeast Asia Trust
iShares Southeast Asia Trust(Constituted under a Trust Deed in the Republic of Singapore)
Statements of Portfolio (Unaudited) (continued)
The accompanying notes form an integral part of these financial statements.
As at 30 June 2018
iShares Barclays USD Asia High Yield Bond Index ETF
Primary – By Industry
Holdings at 30 June 2018
Fair Value at 30 June 2018
Percentage ofTotal Net Assets
Attributable toUnitholders at30 June 2018
Units US$ %
Bonds – Quoted
FinancialBank of East Asia Limited Series
Var 20/11/2024 200,000 199,928 0.31Bank of East Asia Limited Var due
03/11/2026 300,000 292,518 0.45Boom Up Investments Limited
Series Emtn 3.8% due 02/08/2019 300,000 285,243 0.44
Champion Mtn Limited Series Emtn 3.75% due 17/01/2023 250,000 246,077 0.38
China Reinsurance Finance Corporation 3.375% due 09/03/2022 800,000 765,040 1.17
Easy Tactic Limited 5.75% due 13/01/2022 300,000 273,033 0.42
Easy Tactic Limited 5.875% due 13/02/2023 300,000 265,098 0.41
Easy Tactic Limited 7% due 25/04/2021 300,000 291,072 0.45
FWD Group Limited Series Emtn Var Perp 300,000 207,519 0.32
Jingrui Holdings Limited 7.75% due 12/04/2020 300,000 288,348 0.44
Jiuding Group Finance Company 6.5% due 25/07/2020 200,000 161,080 0.25
Joyous Glory Group Gmtn 5.7% due 07/03/2020 300,000 304,470 0.47
King Talent Management Limited Var Perp 250,000 233,942 0.36
Lai Fung Bonds 2018 Limited 5.65% due 18/01/2023 200,000 190,028 0.29
New World China Land Limited 4.75% due 23/01/2027 250,000 246,963 0.38
New World China Land Limited Series Emtn 5.375% due 06/11/2019 300,000 303,999 0.47
Oceanwide Holdings International 15 9.625% due 11/08/2020 200,000 192,122 0.29
Oceanwide Holdings International 17 7.75% due 27/07/2020 250,000 216,090 0.33
Oxley Mtn Pte Limited Series Emtn 6.375% due 21/04/2021 250,000 240,002 0.37
PCPD Capital Limited 4.75% due 09/03/2022 350,000 341,390 0.52
RKI Overseas Finance 2016 A 5% due 09/08/2019 200,000 198,362 0.30
RKI Overseas Finance 2016 B 4.7% due 06/09/2021 200,000 185,194 0.28
Ronshine China Holdings Limited 6.95% due 08/12/2019 250,000 242,695 0.37
Sun Hung Kai & Co Bvi 4.65% due 08/09/2022 250,000 236,690 0.36
Sun Hung Kai & Company Bvi Series Emtn 4.75% due 31/05/2021 250,000 243,947 0.37
Holdings at 30 June 2018
Fair Value at 30 June 2018
Percentage ofTotal Net Assets
Attributable toUnitholders at30 June 2018
Units US$ %
Times China Holdings Limited 6.25% due 17/01/2021 200,000 189,904 0.29
Times Property Holdings Limited 6.25% due 23/01/2020 200,000 197,378 0.30
Unigroup International 6% due 10/12/2020 400,000 398,196 0.61
Vll International Incorporation Series Emtn 7.375% due 18/06/2022 300,000 314,499 0.48
Wanda Properties International 7.25% due 29/01/2024 200,000 195,246 0.30
Woori Bank 5% Perp 300,000 297,225 0.46Xinhu Zhongbao 6% due
01/03/2020 350,000 316,432 0.49
8,559,730 13.13
Industrial361 Degrees International 7.25%
due 03/06/2021 200,000 189,134 0.29ABJA Investment Company
5.45% due 24/01/2028 550,000 467,220 0.72ABJA Investment Company
5.95% due 31/07/2024 300,000 289,686 0.44Agile Group Holdings Limited
Var Perp 200,000 182,680 0.28Baoxin Auto Finance I Limited Var
Perp 300,000 295,476 0.45Biostime International Holdings
Limited 7.25% due 21/06/2021 400,000 400,392 0.61Blue Skyview Company Limited
Var Perp 300,000 270,291 0.42Capitaland Treasury Limited
Emtn 4.076% due 20/09/2022 200,000 201,060 0.31Car Incorporation Series 6.125%
due 04/02/2020 350,000 341,212 0.52CCTI 2017 Limited 3.625% due
08/08/2022 300,000 287,316 0.44Central Plaza Development
Limited Var Perp 300,000 304,212 0.47CFLD (Cayman) Investment
Limited 6.5% due 21/12/2020 300,000 270,666 0.42China Evergrande Group 7% due
23/03/2020 400,000 395,624 0.61China Evergrande Group 7.5%
due 28/06/2023 450,000 402,773 0.62China Evergrande Group 8.25%
due 23/03/2022 300,000 286,800 0.44China Evergrande Group 8.75%
due 28/06/2025 1,669,000 1,464,915 2.25China SCE Property Holding 10%
due 02/07/2020 250,000 261,320 0.40China SCE Property Holdings
5.875% due 10/03/2022 200,000 180,684 0.28China SCE Property Holdings
7.45% due 17/04/2021 300,000 293,982 0.45China Shandong International
Economic & Technical Finance 4% due 21/12/2020 200,000 194,524 0.30
China South City Holding 6.75% due 13/09/2021 200,000 146,542 0.23
CIFI Holdings Group due 7.75% 05/06/2020 300,000 304,041 0.47
Country Garden Holdings 4.75% due 25/07/2022 300,000 285,096 0.44
Country Garden Holdings 4.75% due 28/09/2023 600,000 551,028 0.85
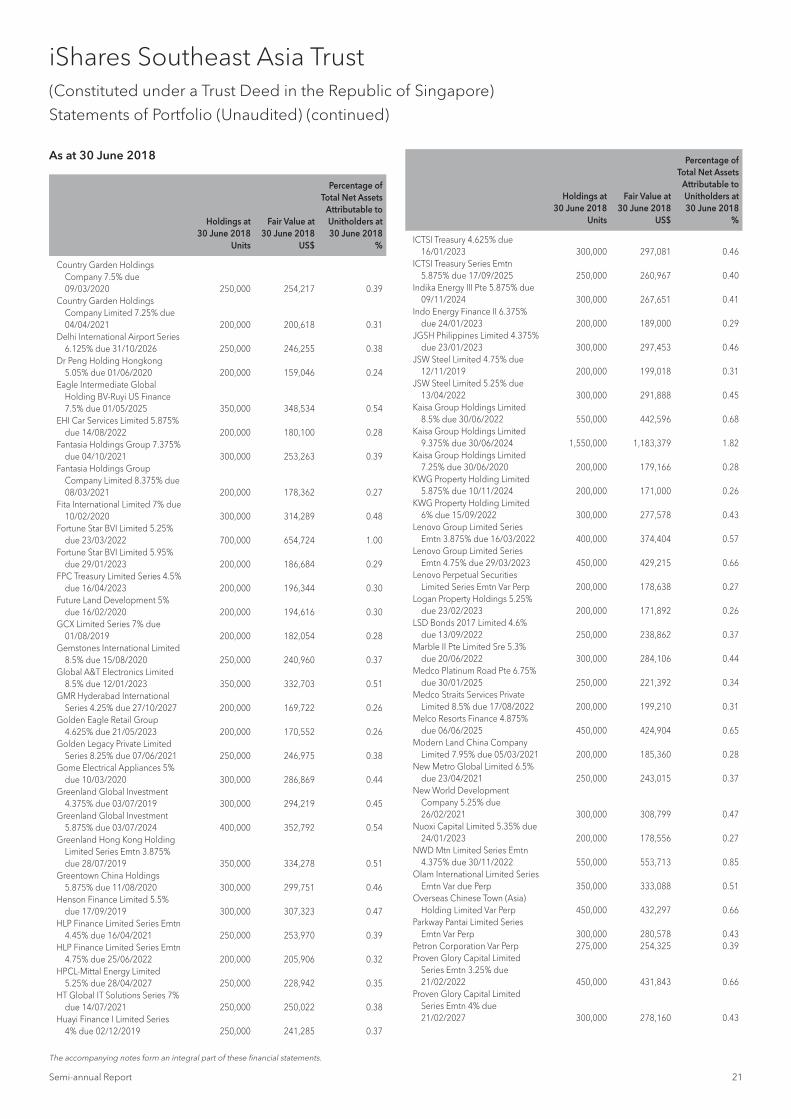
Semi-annual Report 21
iShares Southeast Asia Trust(Constituted under a Trust Deed in the Republic of Singapore)
Statements of Portfolio (Unaudited) (continued)
The accompanying notes form an integral part of these financial statements.
As at 30 June 2018
Holdings at 30 June 2018
Fair Value at 30 June 2018
Percentage ofTotal Net Assets
Attributable toUnitholders at30 June 2018
Units US$ %
Country Garden Holdings Company 7.5% due 09/03/2020 250,000 254,217 0.39
Country Garden Holdings Company Limited 7.25% due 04/04/2021 200,000 200,618 0.31
Delhi International Airport Series 6.125% due 31/10/2026 250,000 246,255 0.38
Dr Peng Holding Hongkong 5.05% due 01/06/2020 200,000 159,046 0.24
Eagle Intermediate Global Holding BV-Ruyi US Finance 7.5% due 01/05/2025 350,000 348,534 0.54
EHI Car Services Limited 5.875% due 14/08/2022 200,000 180,100 0.28
Fantasia Holdings Group 7.375% due 04/10/2021 300,000 253,263 0.39
Fantasia Holdings Group Company Limited 8.375% due 08/03/2021 200,000 178,362 0.27
Fita International Limited 7% due 10/02/2020 300,000 314,289 0.48
Fortune Star BVI Limited 5.25% due 23/03/2022 700,000 654,724 1.00
Fortune Star BVI Limited 5.95% due 29/01/2023 200,000 186,684 0.29
FPC Treasury Limited Series 4.5% due 16/04/2023 200,000 196,344 0.30
Future Land Development 5% due 16/02/2020 200,000 194,616 0.30
GCX Limited Series 7% due 01/08/2019 200,000 182,054 0.28
Gemstones International Limited 8.5% due 15/08/2020 250,000 240,960 0.37
Global A&T Electronics Limited 8.5% due 12/01/2023 350,000 332,703 0.51
GMR Hyderabad International Series 4.25% due 27/10/2027 200,000 169,722 0.26
Golden Eagle Retail Group 4.625% due 21/05/2023 200,000 170,552 0.26
Golden Legacy Private Limited Series 8.25% due 07/06/2021 250,000 246,975 0.38
Gome Electrical Appliances 5% due 10/03/2020 300,000 286,869 0.44
Greenland Global Investment 4.375% due 03/07/2019 300,000 294,219 0.45
Greenland Global Investment 5.875% due 03/07/2024 400,000 352,792 0.54
Greenland Hong Kong Holding Limited Series Emtn 3.875% due 28/07/2019 350,000 334,278 0.51
Greentown China Holdings 5.875% due 11/08/2020 300,000 299,751 0.46
Henson Finance Limited 5.5% due 17/09/2019 300,000 307,323 0.47
HLP Finance Limited Series Emtn 4.45% due 16/04/2021 250,000 253,970 0.39
HLP Finance Limited Series Emtn 4.75% due 25/06/2022 200,000 205,906 0.32
HPCL-Mittal Energy Limited 5.25% due 28/04/2027 250,000 228,942 0.35
HT Global IT Solutions Series 7% due 14/07/2021 250,000 250,022 0.38
Huayi Finance I Limited Series 4% due 02/12/2019 250,000 241,285 0.37
Holdings at 30 June 2018
Fair Value at 30 June 2018
Percentage ofTotal Net Assets
Attributable toUnitholders at30 June 2018
Units US$ %
ICTSI Treasury 4.625% due 16/01/2023 300,000 297,081 0.46
ICTSI Treasury Series Emtn 5.875% due 17/09/2025 250,000 260,967 0.40
Indika Energy III Pte 5.875% due 09/11/2024 300,000 267,651 0.41
Indo Energy Finance II 6.375% due 24/01/2023 200,000 189,000 0.29
JGSH Philippines Limited 4.375% due 23/01/2023 300,000 297,453 0.46
JSW Steel Limited 4.75% due 12/11/2019 200,000 199,018 0.31
JSW Steel Limited 5.25% due 13/04/2022 300,000 291,888 0.45
Kaisa Group Holdings Limited 8.5% due 30/06/2022 550,000 442,596 0.68
Kaisa Group Holdings Limited 9.375% due 30/06/2024 1,550,000 1,183,379 1.82
Kaisa Group Holdings Limited 7.25% due 30/06/2020 200,000 179,166 0.28
KWG Property Holding Limited 5.875% due 10/11/2024 200,000 171,000 0.26
KWG Property Holding Limited 6% due 15/09/2022 300,000 277,578 0.43
Lenovo Group Limited Series Emtn 3.875% due 16/03/2022 400,000 374,404 0.57
Lenovo Group Limited Series Emtn 4.75% due 29/03/2023 450,000 429,215 0.66
Lenovo Perpetual Securities Limited Series Emtn Var Perp 200,000 178,638 0.27
Logan Property Holdings 5.25% due 23/02/2023 200,000 171,892 0.26
LSD Bonds 2017 Limited 4.6% due 13/09/2022 250,000 238,862 0.37
Marble II Pte Limited Sre 5.3% due 20/06/2022 300,000 284,106 0.44
Medco Platinum Road Pte 6.75% due 30/01/2025 250,000 221,392 0.34
Medco Straits Services Private Limited 8.5% due 17/08/2022 200,000 199,210 0.31
Melco Resorts Finance 4.875% due 06/06/2025 450,000 424,904 0.65
Modern Land China Company Limited 7.95% due 05/03/2021 200,000 185,360 0.28
New Metro Global Limited 6.5% due 23/04/2021 250,000 243,015 0.37
New World Development Company 5.25% due 26/02/2021 300,000 308,799 0.47
Nuoxi Capital Limited 5.35% due 24/01/2023 200,000 178,556 0.27
NWD Mtn Limited Series Emtn 4.375% due 30/11/2022 550,000 553,713 0.85
Olam International Limited Series Emtn Var due Perp 350,000 333,088 0.51
Overseas Chinese Town (Asia) Holding Limited Var Perp 450,000 432,297 0.66
Parkway Pantai Limited Series Emtn Var Perp 300,000 280,578 0.43
Petron Corporation Var Perp 275,000 254,325 0.39Proven Glory Capital Limited
Series Emtn 3.25% due 21/02/2022 450,000 431,843 0.66
Proven Glory Capital Limited Series Emtn 4% due 21/02/2027 300,000 278,160 0.43

22 iShares Southeast Asia Trust
iShares Southeast Asia Trust(Constituted under a Trust Deed in the Republic of Singapore)
Statements of Portfolio (Unaudited) (continued)
The accompanying notes form an integral part of these financial statements.
As at 30 June 2018
Holdings at 30 June 2018
Fair Value at 30 June 2018
Percentage ofTotal Net Assets
Attributable toUnitholders at30 June 2018
Units US$ %
Proven Honour Capital 4.125% due 06/05/2026 1,000,000 940,560 1.44
Proven Honour Capital 4.125% due 19/05/2025 350,000 332,759 0.51
PT ABM Investama Tbk 7.125% due 01/08/2022 200,000 177,752 0.27
PTTEP Treasury Center Co Var Perp 200,000 188,844 0.29
Puma International Finance 5% due 24/01/2026 400,000 364,140 0.56
Puma International Finance 5.125% due 06/10/2024 200,000 185,540 0.28
RH International Finance Limited 3.875% due 20/07/2021 200,000 191,050 0.29
San Miguel Corporation 4.875% due 26/04/2023 300,000 293,949 0.45
Shanxi Road & Bridge Construction 4.85% due 04/11/2019 250,000 228,120 0.35
Shimao Property Holdings Limited 4.75% due 03/07/2022 400,000 381,812 0.59
Shimao Property Holdings Limited 5.2% due 30/01/2025 200,000 183,548 0.28
Shimao Property Holdings Limited 8.375% due 10/02/2022 700,000 738,675 1.13
Shui On Development Holdings Limited 5.7% due 06/02/2021 300,000 300,504 0.46
Shui On Development Holdings Limited Var Perp 200,000 188,986 0.29
SM Investments Corporation 4.25% due 17/10/2019 200,000 201,496 0.31
SM Investments Corporation 4.875% due 10/06/2024 250,000 251,380 0.39
Star Energy Geothermal 6.75% due 24/04/2033 300,000 265,443 0.41
Stats Chippac Limited Series 8.5% due 24/11/2020 300,000 303,486 0.47
Studio City Company Limited Series 5.875% due 30/11/2019 200,000 202,110 0.31
Studio City Company Limited Series 7.25% due 30/11/2021 300,000 310,950 0.48
Studio City Finance Limited 8.5% due 01/12/2020 325,000 327,174 0.50
Sunac China Holdings Limited 6.875% due 08/08/2020 250,000 243,297 0.37
Sunac China Holdings Limited 7.35% due 19/07/2021 200,000 188,758 0.29
Sunac China Holdings Limited 7.95% due 08/08/2022 300,000 281,967 0.43
Sunac China Holdings Limited 8.35% due 19/04/2023 200,000 187,666 0.29
Sunac China Holdings Limited 8.75% due 05/12/2019 300,000 305,538 0.47
Sunshine 100 China Holdings Limited 8.5% due 27/09/2020 200,000 184,814 0.28
Tahoe Group Global Company Limited 7.875% due 17/01/2021 200,000 175,656 0.27
TBG Global Pte Limited due 5.25% 10/02/2022 200,000 194,434 0.30
Theta Capital Pte Limited 6.75% due 31/10/2026 200,000 141,852 0.22
Theta Capital Pte Limited 7% due 11/04/2022 250,000 201,897 0.31
Holdings at 30 June 2018
Fair Value at 30 June 2018
Percentage ofTotal Net Assets
Attributable toUnitholders at30 June 2018
Units US$ %
Trafigura Group Pte Limited Var Perp 400,000 384,348 0.59
Tunghsu Venus Holdings 7% due 12/06/2020 200,000 151,184 0.23
TVB Finance Limited 3.625% due 11/10/2021 300,000 294,048 0.45
Vedanta Resources Public Limited Company 6.125% due 09/08/2024 500,000 442,370 0.68
Vedanta Resources Public Limited Company 6.375% due 30/07/2022 500,000 472,995 0.73
Vedanta Resources Public Limited Company 7.125% due 31/05/2023 200,000 190,620 0.29
Vedanta Resources Public Limited Company 8.25% due 07/06/2021 400,000 413,040 0.63
Well Hope Development Var Perp 550,000 510,208 0.78
West China Cement Limited 6.5% due 11/09/2019 250,000 250,852 0.39
Wisdom Glory Group Limited 5.25% Var Perp 200,000 190,522 0.29
WTT Investment Limited Series 5.5% due 21/11/2022 200,000 190,430 0.29
Wynn Macau Limited Series 4.875% due 01/10/2024 350,000 335,052 0.51
Wynn Macau Limited Series 5.5% due 01/10/2027 350,000 334,642 0.51
Yancoal International Resources Development Company Limited STP Perp 300,000 295,662 0.45
Yankuang Group Cayman 4.75% due 30/11/2020 350,000 336,175 0.52
Yanlord Land HK Co Limited 5.875% due 23/01/2022 350,000 346,584 0.53
Yingde Gases Investment Limited 6.25% due 19/01/2023 250,000 235,160 0.36
Yuzhou Properties Company Limited 6% due 25/02/2022 200,000 186,620 0.29
Yuzhou Properties Company Limited 6.375% due 06/03/2021 200,000 193,750 0.30
Zhongrong International Resources Company Limited 7.25% due 26/10/2020 250,000 176,682 0.27
Zoomlion HK Spv Company Limited 6.125% due 20/12/2022 250,000 235,052 0.36
40,921,336 62.80
Government RelatedChalieco Hong Kong
Corporation FRN Perp 200,000 198,608 0.31Chinalco Capital Holdings
Limited 4% due 25/08/2021 350,000 332,710 0.51Chinalco Capital Holdings
Limited 4.25% due 21/04/2022 300,000 284,382 0.44Danga Capital 3.035% due
01/03/2021 400,000 391,784 0.60Franshion Brilliant Limited Var
Perp 300,000 275,796 0.42Greenko Dutch BV Series 4.875%
due 24/07/2022 250,000 232,577 0.36Greenko Dutch BV Series 5.25%
due 24/07/2024 200,000 181,108 0.28

Semi-annual Report 23
iShares Southeast Asia Trust(Constituted under a Trust Deed in the Republic of Singapore)
Statements of Portfolio (Unaudited) (continued)
The accompanying notes form an integral part of these financial statements.
As at 30 June 2018
Holdings at 30 June 2018
Fair Value at 30 June 2018
Percentage ofTotal Net Assets
Attributable toUnitholders at30 June 2018
Units US$ %
Greenko Investment Company Series 4.875% due 16/08/2023 300,000 271,065 0.42
Guangxi Financial Investment Group 5.75% due 23/01/2021 300,000 252,120 0.39
Hesteel Hong Kong Company Limited 4.25% due 07/04/2020 300,000 286,467 0.44
IDBI Bank Limited Series Emtn 4.125% due 23/04/2020 200,000 199,122 0.31
IDBI Bank Limited/Difc Dubai 4.25% due 30/11/2020 250,000 248,558 0.38
Krung Thai Bank Public Company Limited Series Emtn Var 26/12/2024 400,000 405,792 0.62
Mongolia 5.125% due 05/12/2022 550,000 514,245 0.79
Mongolia 8.75% due 09/03/2024 200,000 214,492 0.33Mongolia International Bond
Series 10.875% due 06/04/2021 200,000 223,002 0.34
Mongolia International Bond Series 5.625% due 01/05/2023 450,000 424,683 0.65
PT Saka Energi Indonesia 4.45% due 05/05/2024 300,000 282,675 0.43
Republic of Islamic Pakistan 6.875% due 05/12/2027 650,000 565,715 0.87
Republic of Islamic Pakistan 8.25% due 15/04/2024 550,000 525,404 0.81
Republic of Islamic Pakistan Series 8.25% due 30/09/2025 300,000 287,325 0.44
Republic of Sri Lanka 5.75% due 18/01/2022 200,000 196,776 0.30
Republic of Sri Lanka 5.875% due 25/07/2022 300,000 295,083 0.45
Republic of Sri Lanka 6.125% due 03/06/2025 300,000 280,800 0.43
Republic of Sri Lanka 6.2% due 11/05/2027 450,000 411,142 0.63
Republic of Sri Lanka 6.25% due 27/07/2021 450,000 453,357 0.70
Republic of Sri Lanka 6.825% due 18/07/2026 250,000 239,685 0.37
Republic of Sri Lanka 6.85% due 03/11/2025 600,000 581,490 0.89
Republic of Vietnam 4.8% due 19/11/2024 550,000 546,106 0.84
Republic of Vietnam 6.75% due 29/01/2020 300,000 310,968 0.48
Sino Ocean Ld Treasure III Limited Var Perp 200,000 158,006 0.24
Syndicate Bank/London Series Emtn 3.875% due 04/12/2019 250,000 249,403 0.38
Third Pakistan International Sukuk Series 5.5% due 13/10/2021 650,000 604,708 0.93
Third Pakistan International Sukuk Series 5.625% due 05/12/2022 200,000 180,380 0.28
Trade & Development Mongolia due 9.375% 19/05/2020 300,000 315,666 0.48
Tsinghua Unic Limited 4.75% due 31/01/2021 350,000 332,619 0.51
Tsinghua Unic Limited 5.375% due 31/01/2023 400,000 373,288 0.57
Union Bank Of India Series Emtn 4.5% due 28/10/2019 200,000 201,108 0.31
12,328,215 18.93
Holdings at 30 June 2018
Fair Value at 30 June 2018
Percentage ofTotal Net Assets
Attributable toUnitholders at30 June 2018
Units US$ %
UtilitiesAzure Power Energy Limited
Series due 03/11/2022 200,000 183,690 0.28China Oil and Gas Group 4.625%
due 20/04/2022 200,000 182,254 0.28Fujian Zhanglong Group 4.5%
due 16/12/2019 350,000 341,999 0.52GCL New Energy Holdings
Limited 7.1% due 30/01/2021 300,000 259,599 0.40Huachen Energy 6.625% due
18/05/2020 200,000 133,694 0.21Huaneng HK Capital Limited Var
Perp 300,000 273,900 0.42Listrindo Capital 4.95% due
14/09/2026 250,000 224,728 0.34Neerg Energy Limited 6% due
13/02/2022 300,000 274,851 0.42United Photovoltaics Group
8.25% due 25/01/2020 200,000 160,788 0.25
2,035,503 3.12
Accrued Interest Receivable on Debt Securities 939,152 1.44
Portfolio of Investments 64,783,936 99.42Other Net Assets 375,773 0.58
Net Assets Attributable to
Unitholders 65,159,709 100.00

24 iShares Southeast Asia Trust
iShares Southeast Asia Trust(Constituted under a Trust Deed in the Republic of Singapore)
Statements of Portfolio (Unaudited) (continued)
The accompanying notes form an integral part of these financial statements.
As at 30 June 2018
Primary – By Industry (Summary)
Percentage ofTotal Net Assets
Attributable toUnitholders at
30 June2018
Percentage ofTotal Net Assets
Attributable toUnitholders at31 December
2017% %
Financial 13.13 14.16Industrial 62.80 65.90Government Related 18.93 14.62Utilities 3.12 3.04
Accrued Interest Receivable on Debt Securities 1.44 1.56
Portfolio of Investments 99.42 99.28Other Net Assets 0.58 0.72
Net Assets Attributable to Unitholders 100.00 100.00
Secondary – By Geography
Fair Value at30 June
2018
Percentage ofTotal Net Assets
Attributable toUnitholders at
30 June2018
Percentage ofTotal Net Assets
Attributable toUnitholders at31 December
2017US$ % %
BY COUNTRY
Bermuda – – 0.24British Virgin Islands – – 3.24Cayman Islands – – 3.11China 34,329,492 52.66 40.37Great Britain – – 0.61Hong Kong 6,812,402 10.46 13.82India 6,169,420 9.48 9.49Indonesia 2,613,009 4.01 3.56Macau 669,694 1.02 1.12Malaysia 672,362 1.03 0.97Mauritius – – 0.41Mongolia 1,692,088 2.59 2.79Netherlands – – 0.49Pakistan 2,163,532 3.33 3.07Philippines 2,171,150 3.34 3.48Singapore 2,344,367 3.60 3.17South Korea 297,225 0.46 1.07Sri Lanka 2,458,333 3.77 3.82Thailand 594,636 0.91 1.48Vietnam 857,074 1.32 1.41
Accrued Interest Receivable on Debt Securities 939,152 1.44 1.56
Portfolio of Investments 64,783,936 99.42 99.28Other Net Assets 375,773 0.58 0.72
Net Assets Attributable to
Unitholders 65,159,709 100.00 100.00

Semi-annual Report 25
iShares Southeast Asia Trust(a Sub-Fund of iShares Southeast Asia Trust)
Supplementary Notes
For the half year ended 30 June 2018
1. The TrustiShares Southeast Asia Trust (the “Trust”) is a Singapore-constituted umbrella unit trust created by a trust deed dated 31 May 2006 made under Singapore law between BlackRock (Singapore) Limited as Manager and HSBC Institutional Trust Services (Singapore) Limited as Trustee (the “Principal Deed”). The Principal Deed has been amended by a supplemental deed dated 15 June 2006, an amending and restating deed dated 24 June 2010, a second amending and restating deed dated 6 May 2011, a third amending and restating deed dated 11 November 2011, a fourth amending and restating deed dated 30 March 2012, a second supplemental deed dated 15 November 2012, a fifth amending and restating deed dated 1 July 2013 and a third supplemental deed dated 27 April 2015, each made between the Manager and the Trustee (as amended, the “Trust Deed”). The Trust is authorised under Section 286 of the Securities and Futures Act, Chapter 289 of Singapore.
As at 30 June 2018, there are three sub-funds (the “Sub-Funds”) established under the Trust:
Name of Sub-Fund
Listing Date on the Singapore Exchange Securities Trading Limited (“SGX-ST”)
iShares MSCI India Index ETF 15 June 2006
iShares J.P. Morgan USD Asia Credit Bond Index ETF
2 June 2011
iShares Barclays USD Asia High Yield Bond Index ETF
8 December 2011
These financial statements relate to the three Sub-Funds.
iShares MSCI India Index ETF (“MSCI India ETF”)MSCI India ETF is the first Sub-Fund of the Trust and seeks to provide an investment return that corresponds generally to the performance of a diversified portfolio of Indian stocks as measured by the MSCI India Index.
All investments of MSCI India ETF are held through its investment in wholly-owned subsidiary, iShares MSCI India Mauritius Company (the ‘’Subsidiary’’).
iShares J.P. Morgan USD Asia Credit Bond Index ETF (“USD Asia Credit Bond ETF”)The investment objective of USD Asia Credit Bond ETF is to provide investment results that, before fees and expenses, closely correspond to the performance of the J.P. Morgan Asia Credit Index – Core in US dollar terms.
iShares Barclays USD Asia High Yield Bond Index ETF (“USD Asia High Yield Bond ETF”)The investment objective of USD Asia High Yield Bond ETF is to provide investment results that, before fees and expenses, closely correspond to the performance of the Bloomberg Barclays Asia USD High Yield Diversified Credit Index in US dollar terms.
2. Significant Accounting Policies
(a) Basis of accounting
The financial statements have been prepared under the historical cost convention, modified by the revaluation of financial assets at fair value through profit or loss and in accordance with the recommendations of Statement of Recommended Accounting Practice 7 “Reporting Framework for Unit Trusts” issued by the Institute of Singapore Chartered Accountants. These interim financial statements comprise the Statements of Total Return, Statements of Financial Position, Statements of Movements in Unitholders’ Funds and Statements of Portfolio. Supplementary information on Distributions, Units in issue, Related Party Transactions and Financial Ratios are also presented.
The accounting policies and methods of computation adopted in the preparation of the half year financial report are consistent with those of the annual financial statements for the year ended 31 December 2017.
The financial statements are presented in US dollars, which is the functional currency of the Sub-Funds.
(b) Fair value estimation
The Sub-Funds classify fair value measurements using a fair value hierarchy that reflects the significance of the inputs used in making the measurements. The fair value hierarchy has the following levels:
• Quoted prices (unadjusted) in active markets for identical assets or liabilities (Level 1).
• Inputs other than quoted prices included within level 1 that are observable for the asset or liability, either directly (that is, as prices) or indirectly (that is, derived from prices) (Level 2).
• Inputs for the asset or liability that are not based on observable market data (that is, unobservable inputs) (Level 3).

26 iShares Southeast Asia Trust
iShares Southeast Asia Trust(a Sub-Fund of iShares Southeast Asia Trust)
The following table analyses within the fair value hierarchy the Sub-Funds’ financial assets and liabilities (by class) measured at fair value at 30 June 2018 and 31 December 2017:
MSCI India ETF
As at 30 June 2018
Level 1 Level 2 Level 3 Total
US$ US$ US$ US$
AssetsPortfolio of InvestmentsFinancial Assets Designated
at Fair Value Through Profit or Loss– Equity Securities – 244,754,370 – 244,754,370
As at 31 December 2017
Level 1 Level 2 Level 3 Total
US$ US$ US$ US$
AssetsPortfolio of InvestmentsFinancial Assets Designated
at Fair Value Through Profit or Loss– Equity Securities – 362,989,415 – 362,989,415
The Subsidiary’s investment in equity securities amounting to US$243,612,816 (2017: US$361,192,055) is classified as Level 1. Their values are based on quoted market prices in active markets.
USD Asia Credit Bond ETF
As at 30 June 2018
Level 1 Level 2 Level 3 Total
US$ US$ US$ US$
AssetsPortfolio of InvestmentsFinancial Assets Designated
at Fair Value Through Profit or Loss– Quoted Debt Securities – 37,982,327 – 37,982,327
As at 31 December 2017
Level 1 Level 2 Level 3 Total
US$ US$ US$ US$
AssetsPortfolio of InvestmentsFinancial Assets Designated
at Fair Value Through Profit or Loss– Quoted Debt Securities – 41,273,682 – 41,273,682
USD Asia High Yield Bond ETF
As at 30 June 2018
Level 1 Level 2 Level 3 Total
US$ US$ US$ US$
AssetsPortfolio of InvestmentsFinancial Assets Designated
at Fair Value Through Profit or Loss– Quoted Debt Securities – 64,783,936 – 64,783,936
As at 31 December 2017
Level 1 Level 2 Level 3 Total
US$ US$ US$ US$
AssetsPortfolio of InvestmentsFinancial Assets Designated
at Fair Value Through Profit or Loss– Quoted Debt Securities – 71,928,542 – 71,928,542
3. Distributions
USD Asia Credit Bond ETF
30 June2018
US$
31 December2017US$
Quarter 1 ($0.10 per unit based on 3,839,754 units, recorded as at 5 March 2018) 383,975 –
Quarter 2 ($0.10 per unit based on 3,839,754 units, recorded as at 6 June 2018) 378,976 –
Quarter 1 ($0.10 per unit based on 4,174,844 units, recorded as at 3 March 2017) – 417,485
Quarter 2 ($0.11 per unit based on 3,624,754 units, recorded as at 5 June 2017) – 398,723
Quarter 3 ($0.11 per unit based on 3,699,754 units, recorded as at 6 September 2017) – 406,973
Quarter 4 ($0.10 per unit based on 3,934,754 units, recorded as at 5 December 2017) – 393,475
762,951 1,616,656

Semi-annual Report 27
iShares Southeast Asia Trust(a Sub-Fund of iShares Southeast Asia Trust)
USD Asia High Yield Bond ETF
30 June2018
US$
31 December2017US$
Quarter 1 ($0.13 per unit based on 7,057,059 units, recorded as at 5 March 2018) 917,418 –
Quarter 2 ($0.14 per unit based on 6,666,559 units, recorded as at 6 June 2018) 933,318 –
Quarter 1 ($0.17 per unit based on 5,868,059 units, recorded as at 3 March 2017) – 997,570
Quarter 2 ($0.14 per unit based on 6,262,059 units, recorded as at 5 June 2017) – 876,688
Quarter 3 ($0.14 per unit based on 6,882,059 units, recorded as at 6 September 2017) – 963,488
Quarter 4 ($0.15 per unit based on 6,697,059 units, recorded as at 5 December 2017) – 1,004,559
1,850,736 3,842,305
No distribution was made to the unitholders of MSCI India ETF for the half year ended 30 June 2018 (31 December 2017: Nil).
4. Units in issue
MSCI India ETF
30 June2018
UNITS
31 December 2017
UNITS
Beginning of Financial Period/Year 39,500,000 54,500,000Created during Financial Period/
Year – 2,500,000Cancelled during Financial Period/
Year (10,500,000) (17,500,000)
End of Financial Period/Year 29,000,000 39,500,000
USD Asia Credit Bond ETF
30 June2018
UNITS
31 December 2017
UNITS
Beginning of Financial Period/Year 3,879,754 4,384,844Created during Financial Period/
Year – 600,000Cancelled during Financial Period/
Year (132,000) (1,105,090)
End of Financial Period/Year 3,747,754 3,879,754
USD Asia High Yield Bond ETF
30 June2018
UNITS
31 December 2017
UNITS
Beginning of Financial Period/Year 6,747,059 5,227,810Created during Financial Period/
Year 550,000 2,054,249Cancelled during Financial Period/
Year (765,500) (535,000)
End of Financial Period/Year 6,531,559 6,747,059
5. Related Party Transactions
The Manager and the Trustee of the Sub-Funds are BlackRock (Singapore) Limited and HSBC Institutional Trust Services (Singapore) Limited respectively.
HSBC Institutional Trust Services (Singapore) Limited is a subsidiary of HSBC Holdings PLC.
Management fees are paid to the Manager. Trustee fees, registrar fees and custody fees are paid to the Trustee or its related company (as applicable) from the management fees based on terms set out in the Trust Deed.

28 iShares Southeast Asia Trust
iShares Southeast Asia Trust(a Sub-Fund of iShares Southeast Asia Trust)
6. Financial Ratios
MSCI India ETF
30 June 2018 30 June 2017
Expense Ratio 0.91% 0.87%
Turnover Ratio – –
USD Asia Credit Bond ETF
30 June 2018 30 June 2017
Expense Ratio 0.31% 0.27%
Turnover Ratio 14.07% 32.14%
USD Asia High Yield Bond ETF
30 June 2018 30 June 2017
Expense Ratio 0.51% 0.44%
Turnover Ratio 26.38% 50.02%
The expense ratios have been computed based on the guidelines laid down by the Investment Management Association of Singapore (“IMAS”). MSCI India ETF’s expense ratio is the sum of the Sub-Fund’s expense ratio and the weighted average of the underlying fund’s expense ratio.
The calculation of the Sub-Funds’ expense ratios at 30 June 2018 was based on total operating expenses divided by the average net asset value for the year. The total operating expenses do not include (where applicable) brokerage and other transaction costs, performance fee, interest expense, distribution paid out to unitholders, foreign exchange gains/losses, front or back end loads arising from the purchase or sale of the other funds and tax deducted at source or arising out of income received. The Sub-Funds do not pay any performance fee. The average net asset value is based on the daily balances.
The following table presents the total operating expenses and average net asset values of the Sub-Funds for the period ended 30 June 2018:
MSCI India ETF
30 June 2018 30 June 2017US$ US$
Total Operating Expenses 2,447,350 2,867,432Average Net Asset Value 330,765,701 406,276,930Weighted Average Expense Ratio of
the Underlying Fund 0.17% 0.16%
USD Asia Credit Bond ETF
30 June 2018 30 June 2017US$ US$
Total Operating Expenses 124,606 139,241Average Net Asset Value 40,527,876 51,800,493
USD Asia High Yield Bond ETF
30 June 2018 30 June 2017US$ US$
Total Operating Expenses 372,507 276,048Average Net Asset Value 72,580,956 62,291,652
The portfolio turnover ratios are calculated in accordance with the formula stated in the Code on Collective Investment Schemes. The calculation of the portfolio turnover ratio was based on the lower of the total value of purchases or sales of the underlying investments divided by the average daily net asset value as below:
MSCI India ETF
30 June 2018 30 June 2017US$ US$
Total Value of Purchases or Sales – –Average Daily Net Asset Value 319,636,584 340,714,841
USD Asia Credit Bond ETF
30 June 2018 30 June 2017US$ US$
Total Value of Purchases or Sales 5,610,316 13,359,102Average Daily Net Asset Value 39,886,065 41,559,812

Semi-annual Report 29
iShares Southeast Asia Trust(a Sub-Fund of iShares Southeast Asia Trust)
USD Asia High Yield Bond ETF
30 June 2018 30 June 2017US$ US$
Total Value of Purchases or Sales 18,818,615 31,932,020Average Daily Net Asset Value 71,340,849 63,840,415
7. ComparativesWhere applicable, the 2017 comparative figures have been reclassified to conform with the changes in the current year’s presentation.

30 iShares Southeast Asia Trust
iShares Southeast Asia TrustManagement and Administration
Directors of the ManagerHo Nyuk Choo Deborah Joanne (appointed on 23 March 2018)Sanjeev MalikLynda HallToby Cameron Robert RitchAlastair John Inlay Gillespie (appointed on 23 March 2018)Leung Patrick Kar Peck (appointed on 23 March 2018)Neeraj Seth (appointed on 23 March 2018)
ManagerBlackRock (Singapore) Limited#18-01, Twenty Anson20 Anson RoadSingapore 079912Company Registration No. 200010143N
Sub-Manager(for iShares MSCI India Index ETF only)BlackRock Asset Management North Asia Limited16/F Champion Tower3 Garden Road CentralHong Kong
AuditorsPricewaterhouseCoopers LLP7 Straits ViewMarina One East TowerLevel 12Singapore 018936
Trustee and RegistrarHSBC Institutional Trust Services(Singapore) Limited21 Collyer Quay#13-02 HSBC BuildingSingapore 049320Company Registration No. 194900022R
CustodianThe Hongkong and ShanghaiBanking Corporation Limited1 Queen’s Road CentralHong Kong
Any opinions expressed herein reflect the Manager’s view at this date and are subject to change. Investors should not rely on the information contained in this report for their final investment decisions. For more information about the Fund including the related risks and other important information, please refer to the prospectus of the Fund which is available by contacting the Manager or visiting the website www.iShares.com.sg.
MSCI and the MSCI Index names are service mark(s) of MSCI Inc. (“MSCI”) or its affiliates and have been licensed for certain purposes by BlackRock. The Fund is not sponsored, endorsed, sold or promoted by MSCI. Nor does MSCI make any representation or warranty, express or implied, regarding the index(es) or the advisability of investing in any fund. The iShares MSCI India Index ETF is not sponsored, endorsed, issued, sold or promoted by MSCI. Nor does this company make any representation regarding the advisability of investing in the iShares MSCI India Index ETF.
J.P. Morgan and the J.P. Morgan Index name are the service marks of JPMorgan Chase & Co. and its affiliates (“J.P. Morgan”) and have been licensed for certain uses by BlackRock Institutional Trust Company, N.A. This is not an offer by J.P. Morgan to sell or a solicitation of an offer to buy shares of the iShares Funds. The iShares Funds are not sponsored, endorsed, sold or promoted by J.P. Morgan. J.P. Morgan bears no liability and makes no representation regarding the iShares Funds or the advisability of investing in the iShares Funds. This is not intended to be and should not be regarded as tax, legal, accounting or other professional advice. The J.P. Morgan Index is the exclusive property of J.P. Morgan. J.P. Morgan does not warrant the completeness or accuracy of the J.P. Morgan Index. J.P. Morgan is not affiliated with BlackRock Institutional Trust Company, N.A. or any of its affiliates.
©2018 JPMorgan Chase & Co. All rights reserved.
The iShares Funds are not sponsored, endorsed or issued by Bloomberg Finance L.P. or Barclays, nor do these companies make any representation regarding the advisability of investing in the Funds. BlackRock is not affiliated with the companies listed above.
iShares® and BlackRock® are registered trademarks of BlackRock, Inc., or its subsidiaries in the United States and elsewhere. All other trademarks, servicemarks or registered trademarks are the property of their respective owners.
© 2018 BlackRock Inc. All rights reserved.