semi-annual report to shareholders perkins discovery fund · fundamental and technical chart...
TRANSCRIPT

Semi-Annual Report to Shareholders
PERKINS DISCOVERY FUND
For the Six Months ended September 30, 2016
(unaudited)

1
September 30, 2016
Dear Shareholders:
The six-month period ended September 30, 2016 was very good for the PerkinsDiscovery Fund and micro-cap stocks in general. The Fund finished the period with areturn of 27.06% versus 14.04% for the Wilshire Micro-Cap, 12.35% for the Russell 2000,9.08% for the NASDAQ Composite and 5.27% for the S&P 500. Micro-cap stocks,overall, performed better than the market as a whole.
At the Perkins Discovery Fund, we follow a bottom-up approach, using bothfundamental and technical chart analysis to find new investment opportunities one byone and to monitor our current holdings. During the six-month period, we acquired 7new holdings and disposed of 4. As a result, the portfolio went from 21 holdings to 24.We started the period with 94.78% invested in securities and ended with 96.34%invested.
Our three best gaining stocks for the six-month period were Cardiovascular Systems,Inc., Depomed, Inc. and Inventure Foods, Inc. Cardiovascular Systems develops andmarkets orbital atherectomy medical devices for the treatment of peripheral andcoronary artery disease. A long-term holding, which we originally purchased overseven years ago, the company has renewed its growth this year after reorganizing andrevamping its sales force. Depomed, Inc. is a specialty pharmaceutical companyfocused on products to treat pain and other central nervous system conditions. Knownfor successfully building brands, Depomed has been a big winner for the fund sincepurchased in 2013. Their acquisition of the U.S. rights for NUCYNTA from Johnsonand Johnson’s Janssen Pharmaceuticals provides them with another opportunity tobuild a major brand. Inventure Foods manufactures and markets specialty food brandsin the better-for-you and indulgent categories. A long-term holding, Inventure Foodshas rebounded this year as they recover from a recall in an existing product line.
The Fund’s three worst declining stocks for the period were LeMaitre Vascular, Inc.,Rockwell Medical, Inc. and Synergy Resources Corp. LeMaitre develops, manufacturesand markets disposable and implantable devices for the treatment of peripheralvascular disease. We sold our position during the period as we believed it had becomeovervalued after a long advance. Rockwell Medical is a biopharmaceutical companytargeting end-stage renal disease and chronic kidney disease. We originally purchasedshares in May of 2013 in a public offering by the company. Although still held at aprofit, the stock has been down over the past year as they worked on obtaining afavorable reimbursement code for one FDA approved product, Triferic, and launchinganother, Calcitriol. Synergy Resources is a domestic oil and natural gas explorationand production company. Also still held at a profit for the Fund, Synergy is down withthe price of oil. We continue to hold the stock for the company’s future horizontaldrilling prospects in its highly productive Wattenburg holdings and its continuedexpansion in other parts of the D-J Basin.

2
The table below shows the Fund’s performance for various periods endedSeptember 30, 2016.
Perkins Wilshire US NASDAQ S&PAnnualized Discovery Micro-Cap Russell 2000 Composite 500Total Return Fund Index Index Index IndexSince 4-9-98 Inception 9.80% 7.30% 5.32% 5.96% 3.68%Fifteen Year 7.26% 9.64% 7.81% 8.80% 5.01%Ten Year 4.54% 4.79% 5.60% 8.93% 4.96%Five Year 9.43% 14.70% 14.21% 17.07% 13.89%Three Year 0.99% 4.30% 5.24% 12.09% 8.84%One Year 16.10% 10.71% 13.71% 14.97% 12.93%
Please note that performance data quoted represents past performance; past performance doesnot guarantee future results. The investment return and principal value of an investment willfluctuate so that an investor’s shares, when redeemed, may be worth more or less than theiroriginal cost. Current performance of the fund may be lower or higher than the performancequoted. Performance data current to the most recent month end may be obtained by calling800-366-8361. The fund imposes a 1.00% redemption fee on shares held less than 45 days.Performance data does not reflect the redemption fee. If it had, the return would be reduced.
After a decline into the first quarter the market in general was up during the six-monthperiod, although it has pulled back more recently as we come into the election, anuncertain time while results are awaited. Small- and micro-cap indexes outperformedthe larger indexes during the period, after lagging for several years. Once theuncertainty of the coming election is behind us, we expect a continued good market,with small company stocks continuing to lead.
We cannot control the action of the market; however, we will continue to choose stocksthat we believe can do well over the long term using our same bottom-up selectionprocess of looking for small companies that are benefiting from positive change. And,of course, we continue to monitor our holdings. Some of these will reach levels wherethey will be sold, even though they may continue to be good companies. Others willnot work out in the way we anticipated and will be candidates to be sold. Both will bereplaced with new ideas, as part of an ongoing process. We believe the Discovery Fundis well positioned in micro-cap growth stocks that hold significant promise for thefuture.
Thank you for your continued support.
Sincerely,
Richard W. Perkins, C.F.A. Daniel S. Perkins, C.F.A.President Executive Vice President

3
Opinions expressed above are those of Richard W. Perkins or Daniel S. Perkins andare subject to change, are not guaranteed and should not be consideredrecommendations to buy or sell any security.
Small company investing involves additional risks such as limited liquidity andgreater volatility. The fund invests in micro-cap and early stage companies whichtend to be more volatile and somewhat more speculative than investments in moreestablished companies. As a result, investors considering an investment in the Fundshould consider their ability to withstand the volatility of the Fund’s net asset valueassociated with the risks of the portfolio.
The S&P 500 Index is a broad-based unmanaged index of 500 stocks, which is widelyrecognized as representative of the equity market in general; the Russell 2000 Indexconsists of the smallest 2,000 companies in a group of 3,000 U.S. companies in theRussell 3000 Index, as ranked by market capitalization; and the NASDAQ CompositeIndex is a market capitalization-weighted index that is designed to represent theperformance of the National Market System, which includes over 5,000 stocks tradedonly over-the-counter and not on an exchange. The Dow Jones Wilshire Micro-CapIndex is formed by taking the 2,500 smallest companies, as measured by MarketCapitalization of the Dow Jones Wilshire 5000 Index. One cannot invest directly in anindex. Please refer to the schedule of investments for more information regarding fundholdings. Fund holdings are subject to change and are not recommendations to buy orsell any security.
Investment performance reflects fee waivers in effect. In the absence of such waivers,total return would be reduced.
Must be preceded or accompanied by a prospectus. Please read it carefully beforeinvesting.
The Fund is distributed by First Dominion Capital Corp. (11/16)

4
PERKINS DISCOVERY FUNDHOLDINGS BY INDUSTRY SECTOR AS PERCENTAGE OF NET ASSETS
AS OF SEPTEMBER 30, 2016 (unaudited)
Ambu
lator
y Hea
lth C
are S
ervi
ces
Compu
ter P
rogr
amm
ing
Food
and B
ever
age M
anuf
actu
ring
Hea
lth C
are D
rugs
/Ser
vice
s
Hea
lth C
are M
anuf
actu
ring
Hea
lth C
are S
uppo
rt
Hea
lth C
are S
uppl
ies
IT S
ervi
ces
Pollut
ion C
ontro
l Equ
ipm
ent
Oil
& G
as
Shor
t ter
m In
vestm
ent
Softw
are S
ervi
ces
Per
cen
tage
of
Net
Ass
ets
Industry Sector
20%
0%
4%
8%
12%
16%
5
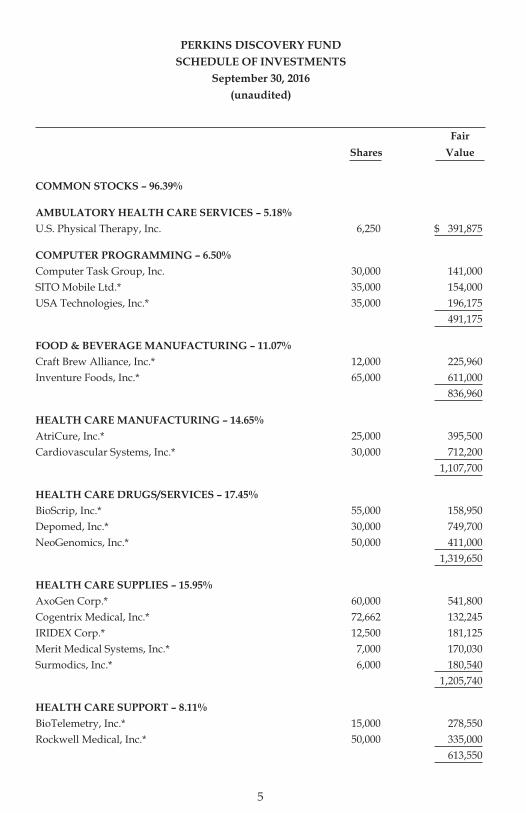
PERKINS DISCOVERY FUNDSCHEDULE OF INVESTMENTS
September 30, 2016(unaudited)
Fair
Shares Value
COMMON STOCKS – 96.39%
AMBULATORY HEALTH CARE SERVICES – 5.18%
U.S. Physical Therapy, Inc. 6,250 $ 391,875
COMPUTER PROGRAMMING – 6.50%
Computer Task Group, Inc. 30,000 141,000SITO Mobile Ltd.* 35,000 154,000USA Technologies, Inc.* 35,000 196,175
491,175
FOOD & BEVERAGE MANUFACTURING – 11.07%
Craft Brew Alliance, Inc.* 12,000 225,960Inventure Foods, Inc.* 65,000 611,000
836,960
HEALTH CARE MANUFACTURING – 14.65%
AtriCure, Inc.* 25,000 395,500Cardiovascular Systems, Inc.* 30,000 712,200
1,107,700
HEALTH CARE DRUGS/SERVICES – 17.45%
BioScrip, Inc.* 55,000 158,950Depomed, Inc.* 30,000 749,700NeoGenomics, Inc.* 50,000 411,000
1,319,650
HEALTH CARE SUPPLIES – 15.95%
AxoGen Corp.* 60,000 541,800Cogentrix Medical, Inc.* 72,662 132,245IRIDEX Corp.* 12,500 181,125Merit Medical Systems, Inc.* 7,000 170,030Surmodics, Inc.* 6,000 180,540
1,205,740
HEALTH CARE SUPPORT – 8.11%
BioTelemetry, Inc.* 15,000 278,550Rockwell Medical, Inc.* 50,000 335,000
613,550

6
COMMON STOCKS – continued
IT SERVICES – 2.66%
Perficient, Inc.* 10,000 $ 201,500
OIL & GAS – 3.67%
Synergy Resources Corp.* 40,000 277,200
POLLUTION CONTROL EQUIPMENT – 1.10%
LiqTech International, Inc.* 100,000 83,000
SOFTWARE SERVICES - 10.05%
Digital Turbine, Inc.* 50,000 52,500ePlus, Inc.* 5,000 472,050InnerWorkings, Inc.* 25,000 235,500
760,050
TOTAL COMMON STOCKS – 96.39%
(Cost: $3,837,497) 7,288,400
SHORT TERM INVESTMENT – 3.66%
Fidelity Prime Fund #690 Money Market Fund 0.32%**(Cost: $276,588) 276,588 276,588
TOTAL INVESTMENTS – 100.05%
(Cost: $4,114,085) 7,564,988Liabilities, in excess of other assets – (0.05%) (4,088)NET ASSETS – 100.00% $7,560,900
* Non-Income producing
** Effective 7 day yield as of September 30, 2016
See Notes to Financial Statements
PERKINS DISCOVERY FUNDSCHEDULE OF INVESTMENTS – continued
September 30, 2016(unaudited)
Fair
Shares Value

7
PERKINS DISCOVERY FUNDSTATEMENT OF ASSETS AND LIABILITIESSeptember 30, 2016 (unaudited)
ASSETS
Investments at fair value (identified cost of $4,114,085) (Note 1) $ 7,564,988Receivable for capital stock sold 5,041Dividends and interest receivable 1,837Receivable from investment manager 17,445Prepaid expenses 16,968
TOTAL ASSETS 7,606,279
LIABILITIES
Accrued 12b-1 fees 286Accrued administration, transfer agent and accounting fees 4,886Accrued professional fees 35,221Other accrued expenses 4,986
TOTAL LIABILITIES 45,379
NET ASSETS $ 7,560,900
Net Assets Consist of:
Paid-in-capital $ 5,255,650Accumulated undistributed net investment income (loss) (103,645)Accumulated net realized gain (loss) on investments (1,042,008)Net unrealized appreciation (depreciation) of investments 3,450,903
Net Assets $ 7,560,900
NET ASSET VALUE PER SHARE
Investor Class Shares:
Net Assets $ 7,560,900Shares Outstanding (unlimited number of shares of
beneficial interest authorized without par value) 216,134Net Asset Value and Offering Price Per Share $ 34.98
See Notes to Financial Statements

8
PERKINS DISCOVERY FUNDSTATEMENT OF OPERATIONSSix months ended September 30, 2016 (unaudited)
INVESTMENT INCOME
Dividend $ 6,850Interest 510
Total investment income 7,360
EXPENSES
Investment management fees (Note 2) 34,26612b-1 fees (Note 2) 8,566Recordkeeping and administrative services (Note 2) 9,544Accounting fees (Note 2) 11,481Custody fees 1,652Transfer agent fees (Note 2) 6,786Professional fees 19,481Filing and registration fees 5,618Trustee fees 2,286Compliance fees 3,561Shareholder servicing and reports 5,298Insurance 2,375Other 8,718
Total expenses 119,632Management fee waivers (Note 2) (39,487)
Net Expenses 80,145
Net investment income (loss) (72,785)
REALIZED AND UNREALIZED GAIN (LOSS) ON INVESTMENTS
Net realized gain (loss) on investments 516,334Net increase (decrease) in unrealized appreciation
(depreciation) of investments 1,179,936Net realized and unrealized gain (loss) on investments 1,696,270
INCREASE (DECREASE) IN NET ASSETS FROM OPERATIONS $1,623,485
See Notes to Financial Statements

9
PERKINS DISCOVERY FUND STATEMENTS OF CHANGES IN NET ASSETS
Six months endedSeptember 30, 2016 Year ended
(unaudited) March 31, 2016
Increase (decrease) in Net Assets
OPERATIONS
Net investment income (loss) $ (72,785) $ (160,672)Net realized gain (loss) on investments 516,334 233,220Net increase (decrease) in unrealized
appreciation (depreciation) of investments 1,179,936 (2,487,853)Increase (decrease) in net assets from operations 1,623,485 (2,415,305)
CAPITAL STOCK TRANSACTIONS (NOTE 5)
Shares sold 366,332 855,987Shares redeemed (606,626)* (1,881,705)*
Increase (decrease) in net assets from capital stock transactions (240,294) (1,025,718)
NET ASSETS
Increase (decrease) during year 1,383,191 (3,441,023)Beginning of year 6,177,709 9,618,732
End of year (including accumulated net investment income (loss) $7,560,900 $ 6,177,709
Includes undistributed net investment income (loss) of: $ (103,645) $ (30,860)
* Includes redemption fees of $– and $512, respectively.
See Notes to Financial Statements

10
PERKINS DISCOVERY FUNDFINANCIAL HIGHLIGHTSSELECTED PER SHARE DATA THROUGHOUT EACH PERIOD
Six months ended
September 30, 2016 Year Ended March 31,(unaudited) 2016 2015 2014 2013 2012
Net asset value, beginning of period $ 27.52 $ 37.54 $ 38.98 $ 30.23 $ 25.99 $ 30.45
Investment activitiesNet investment
income (loss)(1) (0.33) (0.67) (0.71) (0.62) (0.34) 0.39Net realized and
unrealized gain (loss) on investments 7.79 (9.35) (0.73) 9.37 4.98 (4.78)
Total from investment activities 7.46 (10.02) (1.44) 8.75 4.64 (4.39)
DistributionsNet investment
income – – – – (0.40) (0.08)
Total distributions – – – – (0.40) (0.08)
Paid-in capital from redemption fees – –(2) – – – 0.01
Net asset value, end of period $ 34.98 $ 27.52 $ 37.54 $ 38.98 $ 30.23 $ 25.99
Total Return 27.11%** (26.69%) (3.69%) 28.94% 18.10% (14.37%)
Ratios/Supplemental DataRatio to average net assets
Expenses, gross 3.49%* 3.27% 2.84% 2.83% 3.18% 2.48%Expenses, net of
waiver (Note 2) 2.34%* 2.25% 2.16% 2.00% 2.00% 2.00%Net investment
income (loss) (2.12%)* (2.01%) (1.96%) (1.81%) (1.30%) 1.22%Portfolio turnover rate 15.65%** 2.20% 21.13% 23.98% 12.97% 14.00%Net assets, end of
period (000’s) $ 7,561 $ 6,178 $ 9,619 $ 12,602 $ 10,491 $ 12,272
(1) Per share amounts calculated using the average share method.(2) Less than $0.01 per share.* Annualized** Not annualized
See Notes to Financial Statements

11
PERKINS DISCOVERY FUNDNOTES TO FINANCIAL STATEMENTSSeptember 30, 2016 (unaudited)
NOTE 1 - ORGANIZATION AND SIGNIFICANT ACCOUNTING POLICIES
The Perkins Discovery Fund (the “Fund”) is a diversified series of the World FundsTrust (“WFT”), which is registered under The Investment Company Act of 1940, asamended, as a open-end management company. WFT was organized as a Delawarestatutory trust on April 9, 2007. The Fund was established on April 9, 1998 as a seriesof Professionally Managed Portfolios. On October 26, 2012, the Fund reorganized as aseparate series of WFT.
The Fund’s objective is to seek long-term capital appreciation.
The following is a summary of significant accounting policies consistently followedby the Fund. The policies are in conformity with accounting principles generallyaccepted in the United States of America (“GAAP”). The Fund follows the investmentcompany accounting and reporting guidance of the Financial Accounting StandardsBoard (“FASB”) Accounting Standard Codification Topic 946 “Financial Services –Investment Companies”.
Security Valuation
The Fund’s securities are valued at current market prices. Investments in securitiestraded on the national securities exchanges or included in the NASDAQ NationalMarket System are valued at the last reported sale price. Other securities traded in theover-the-counter market and listed securities for which no sales are reported on a givendate are valued at the last reported bid price. Short-term debt securities (less than60 days to maturity) are valued at their fair value using amortized cost. Other assetsfor which market prices are not readily available are valued at their fair value asdetermined in good faith under procedures set by the Board. Generally, trading incorporate bonds, U.S. government securities and money market instruments issubstantially completed each day at various times before the scheduled close of theNYSE. The value of these securities used in computing the NAV is determined as ofsuch times.
The Fund has a policy that contemplates the use of fair value pricing to determine thenet asset value (“NAV”) per share of the Fund when market prices are unavailable aswell as under special circumstances, such as: (i) if the primary market for a portfoliosecurity suspends or limits trading or price movements of the security; and (ii) whenan event occurs after the close of the exchange on which a portfolio security isprincipally traded that is likely to have changed the value of the security. Since mostof the Fund’s investments are traded on U.S. securities exchanges, it is anticipated thatthe use of fair value pricing will be limited.
When the Fund uses fair value pricing to determine the NAV per share of the Fund,securities will not be priced on the basis of quotations from the primary market inwhich they are traded, but rather may be priced by another method that the Board

12
PERKINS DISCOVERY FUNDNOTES TO FINANCIAL STATEMENTS – continuedSeptember 30, 2016 (unaudited)
believes accurately reflects fair value. Any method used will be approved by the Boardand results will be monitored to evaluate accuracy. The Fund’s policy is intended toresult in a calculation of the Fund’s NAV that fairly reflects security values as of thetime of pricing. However, fair values determined pursuant to the Fund’s proceduresmay not accurately reflect the price that the Fund could obtain for a security if it wereto dispose of that security as of the time of pricing.
The Fund has adopted fair valuation accounting standards that establish anauthoritative definition of fair value and set out a hierarchy for measuring fair value.These standards require additional disclosures about the various inputs used todevelop the measurements of fair value. These inputs are summarized in the threebroad levels listed below.
Various inputs are used in determining the value of a Fund’s investments. GAAPestablished a three-tier hierarchy of inputs to establish a classification of fair valuemeasurements for disclosure purposes. Level 1 includes quoted prices in active marketsfor identical securities. Level 2 includes other significant observable market-basedinputs (including quoted prices for similar securities, interest rates, prepayment speeds,credit risk, etc.). Level 3 includes significant unobservable inputs (including the Fund’sown assumptions in determining fair value of investments).
The inputs or methodology used for valuing securities are not necessarily an indicationof the risk associated with investing in those securities.
The following is a summary of the inputs used to value the Fund’s investments as ofSeptember 30, 2016:
Level 2 Other Level 3
Level 1 Significant Significant Quoted Observable Unobservable Prices Inputs Inputs Total
Common Stocks $7,288,400 $– $– $7,288,400Short term Investments 276,588 – – 276,588
$7,564,988 $– $– $7,564,988
Refer to the Fund’s Schedule of Investments for a listing of the securities by type andindustry.
There were no transfers into or out of any levels during the six months endedSeptember 30, 2016. The Fund recognizes transfers between fair value hierarchy levelsat the end of the reporting period. The Fund held no Level 3 securities at any timeduring the six months ended September 30, 2016.

13
PERKINS DISCOVERY FUNDNOTES TO FINANCIAL STATEMENTS – continuedSeptember 30, 2016 (unaudited)
Security Transactions and Income
Security transactions are accounted for on the trade date. The cost of securities sold isdetermined generally on specific identification basis. Realized gains and losses fromsecurity transactions are determined on the basis of identified cost for book and taxpurposes. Dividends are recorded on the ex-dividend date. Interest income is recordedon an accrual basis.
Cash and Cash Equivalents
Cash and cash equivalents consist of overnight deposits with the custodian bank whichearn interest at the current market rate.
Accounting Estimates
In preparing financial statements in conformity with GAAP, management makesestimates and assumptions that affect the reported amounts of assets and liabilities atthe date of the financial statements, as well as the reported amounts of revenues andexpenses during the reporting period. Actual results could differ from those estimates.
Federal Income Taxes
The Fund intends to comply with the requirements of the Internal Revenue Codeapplicable to regulated investment companies and to distribute all of its taxable incometo its shareholders. The Fund also intends to distribute sufficient net investment incomeand net capital gains, if any, so that it will not be subject to excise tax on undistributedincome and gains. Therefore, no federal income tax or excise provision is required.
Management has reviewed the Fund’s tax positions for each of the open tax years(2014–2016) or expected to be taken in the Fund’s 2017 tax returns and has concludedthat no liability for unrecognized tax benefits should be recorded related to uncertaintax positions taken in the Fund’s tax returns. The Fund has no examinations in progressand management is not aware of any tax positions for which it is reasonably possiblethat the total amounts of unrecognized tax benefits will significantly change.
Reclassification of Capital Accounts
GAAP requires that certain components of net assets relating to permanent differencesbe reclassified between financial and tax reporting. For the six months endedSeptember 30, 2016, there were no such classifications.

14
PERKINS DISCOVERY FUNDNOTES TO FINANCIAL STATEMENTS – continuedSeptember 30, 2016 (unaudited)
NOTE 2 - INVESTMENT ADVISORY AND DISTRIBUTION AGREEMENTSAND OTHER TRANSACTIONS WITH AFFILIATES
Pursuant to an Investment Advisory Agreement, the Advisor, Perkins CapitalManagement, Inc. (“Perkins”) provides investment services for an annual fee of 1.00%of average daily net assets of the Fund.
Perkins received and waived investment management fees and reimbursed expensesfor the six months ended September 30, 2016 as follows:
Fee Earned Fee Waived Expenses Reimbursed
$34,266 $34,266 $5,221
Perkins has contractually agreed to reduce its fees and/or pay Fund expenses(excluding interest, distribution fees pursuant to Rule 12b-1 Plans, taxes, acquired fundfees and expenses, brokerage commissions, dividend expenses on short sales and otherexpenditures which are capitalized in accordance with generally accepted accountingprinciples, other extraordinary expenses not incurred in the ordinary course of suchFund’s business, and expenses incurred under a shareholder servicing oradministrative servicing plan, if applicable) in order to limit Total Annual FundOperating Expenses After Fee Waiver and/or Expense Reimbursement for shares ofthe Fund to 2.50% of the Fund’s average net asset (the “Expense Cap”). The ExpenseCap will remain in effect until at least July 31, 2017. The Agreement may be terminatedat any time by the Board upon 60 days’ notice to Perkins, or by Perkins with the consentof the Board. Each waiver or reimbursement of an expense by Perkins is subject torepayment by the Fund within the three fiscal years following the fiscal year in whichthe expense was incurred, provided that the Fund is able to make the repaymentwithout exceeding the expense limitation in place at the time of the waiver orreimbursement and at the time the waiver or reimbursement is recouped.
The total amount of recoverable reimbursements for the Funds as of September 30,2016, and expiration dates was as follows:
Recoverable Reimbursements and Expiration Dates2017 2018 2019 2020 Total
$98,106 $ 72,133 $ 81,786 $ 39,487 $291,512
The Fund has adopted a Distribution Plan (the “Plan”) in accordance with Rule 12b-1under the 1940 Act, providing for the payment of distribution and service fees to theAdvisor as Distribution Coordinator of the Fund. The Plan provides that the Fund maypay a fee to the Advisor at an annual rate of up to 0.25% of average daily net assets ofthe Fund in consideration for distribution related services.
15
PERKINS DISCOVERY FUNDNOTES TO FINANCIAL STATEMENTS – continuedSeptember 30, 2016 (unaudited)
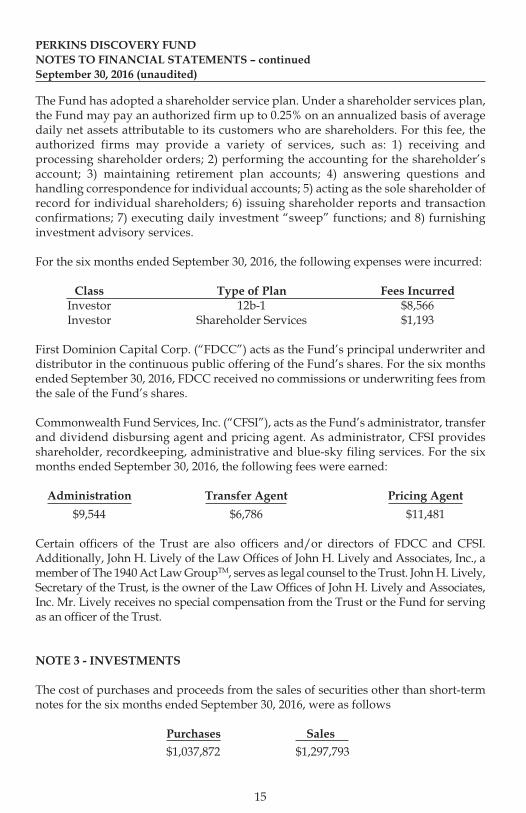
The Fund has adopted a shareholder service plan. Under a shareholder services plan,the Fund may pay an authorized firm up to 0.25% on an annualized basis of averagedaily net assets attributable to its customers who are shareholders. For this fee, theauthorized firms may provide a variety of services, such as: 1) receiving andprocessing shareholder orders; 2) performing the accounting for the shareholder’saccount; 3) maintaining retirement plan accounts; 4) answering questions andhandling correspondence for individual accounts; 5) acting as the sole shareholder ofrecord for individual shareholders; 6) issuing shareholder reports and transactionconfirmations; 7) executing daily investment “sweep” functions; and 8) furnishinginvestment advisory services.
For the six months ended September 30, 2016, the following expenses were incurred:
Class Type of Plan Fees IncurredInvestor 12b-1 $8,566Investor Shareholder Services $1,193
First Dominion Capital Corp. (“FDCC”) acts as the Fund’s principal underwriter anddistributor in the continuous public offering of the Fund’s shares. For the six monthsended September 30, 2016, FDCC received no commissions or underwriting fees fromthe sale of the Fund’s shares.
Commonwealth Fund Services, Inc. (“CFSI”), acts as the Fund’s administrator, transferand dividend disbursing agent and pricing agent. As administrator, CFSI providesshareholder, recordkeeping, administrative and blue-sky filing services. For the sixmonths ended September 30, 2016, the following fees were earned:
Administration Transfer Agent Pricing Agent
$9,544 $6,786 $11,481
Certain officers of the Trust are also officers and/or directors of FDCC and CFSI.Additionally, John H. Lively of the Law Offices of John H. Lively and Associates, Inc., amember of The 1940 Act Law GroupTM, serves as legal counsel to the Trust. John H. Lively,Secretary of the Trust, is the owner of the Law Offices of John H. Lively and Associates,Inc. Mr. Lively receives no special compensation from the Trust or the Fund for servingas an officer of the Trust.
NOTE 3 - INVESTMENTS
The cost of purchases and proceeds from the sales of securities other than short-termnotes for the six months ended September 30, 2016, were as follows
Purchases Sales
$1,037,872 $1,297,793

16
PERKINS DISCOVERY FUNDNOTES TO FINANCIAL STATEMENTS – continuedSeptember 30, 2016 (unaudited)
NOTE 4 – DISTRIBUTIONS TO SHAREHOLDERS AND TAX COMPONENTSOF CAPITAL
Distributions are determined on a tax basis and may differ from net investment incomeand realized capital gains for financial reporting purposes. Differences may bepermanent or temporary. Permanent differences are reclassified among capitalaccounts in the financial statements to reflect their tax character. Temporary differencesarise when certain items of income, expense, gain or loss are recognized in differentperiods for financial statement and tax purposes; these differences will reverse at sometime in the future. Differences in classification may also result from the treatment ofshort-term gains as ordinary income for tax purposes.
During the six months ended September 30, 2016 and the year ended March 31, 2016,no distributions were paid.
As of September 30, 2016, the components of distributable earnings (accumulated loss)on a tax basis were as follows:
Accumulated net investment income (loss) $ (103,645)Accumulated net realized gain (loss) (1,042,008)Net unrealized appreciation (depreciation) on investments 3,450,903
$ 2,305,250
Under the Regulated Investment Company Modernization Act of 2010 (“2010 Act”),net capital losses recognized after December 31, 2010, may be carried forwardindefinitely, and their character is retained as short-term and/or long-term losses.Under the laws in effect prior to the 2010 Act, pre-enactment net capital losses werecarried forward for eight years and treated as short-term losses. As a transition rule,the 2010 Act requires that post-enactment net capital losses be used before pre-enactment net capital losses. As of March 31, 2016, the Fund has a capital losscarryforward of $1,558,342 available to offset future capital gains. $860,612 of the losscarryforward expires in 2018, $261,554 of short-term and $436,176 of long-term can becarried forward indefinitely.
Cost of securities for Federal Income tax purpose and the related tax-based netunrealized appreciation (depreciation) consists of:
Gross Gross Total UnrealizedUnrealized Unrealized Appreciation
Cost Appreciation Depreciation (Depreciation)
$4,114,085 $3,710,423 $(259,520) $3,450,903

17
PERKINS DISCOVERY FUNDNOTES TO FINANCIAL STATEMENTS – continuedSeptember 30, 2016 (unaudited)
NOTE 5 –TRANSACTIONS IN SHARES OF BENEFICIAL INTEREST
Shares of beneficial interest transactions for the Funds were:
Six months ended September 30, 2016 Year ended
(unaudited) March 31, 2016
Shares Amount Shares Amount
Shares sold 11,090 $ 366,332 23,495 $ 855,987Shares redeemed (19,445) (606,626) (55,214) (1,881,705)Net increase (decrease) (8,355) $(240,294) (31,719) $(1,025,718)
NOTE 6 – SUBSEQUENT EVENTS
Management has evaluated all transactions and events subsequent to the date of thestatement of assets and liabilities through the date on which these financial statementswere issued. Except as already included in the notes to these financial statements, noadditional items require disclosure.

18
SUPPLEMENTAL INFORMATIONWORLD FUNDS TRUST (The “Trust”) (unaudited)
VOTING PROXIES ON FUND PORTFOLIO SECURITIES
A description of the policies and procedures that the Fund uses to determine how tovote proxies relating to securities held in the Fund’s portfolio is available, withoutcharge and upon request, by calling 1-800-637-0550 or on the SEC’s website atwww.sec.gov. Information regarding how the Fund voted proxies relating toportfolio securities during the most recent twelve months ended June 30 is availableon or through the SEC’s website at www.sec.gov.
QUARTERLY PORTFOLIO HOLDINGS
The Fund files with the SEC a complete schedule of its portfolio holdings, as of theclose of the first and third quarters of its fiscal year, on “Form N-Q”. These filingsare available, without charge and upon request, by calling 1-800-637-0550 or on theSEC’s website at www.sec.gov. The Fund’s Forms N-Q may be reviewed and copiedat the SEC’s Public Reference Room in Washington, D.C. Information on theoperation of the Public Reference Room may be obtained by calling 1-800-SEC-0330.

19
PERKINS DISCOVERY FUNDFUND EXPENSES
Fund Expenses Example
As a shareholder of the Fund, you incur two types of costs: (1) transaction costs,including redemption fees and (2) ongoing costs, including management fees,distribution (12b-1) fees, and other Fund expenses. This example is intended to helpyou understand your ongoing costs (in dollars) of investing in the Fund and tocompare these costs with the ongoing costs of investing in other mutual funds. Theexample is based on an investment of $1,000 invested at the beginning of the period,April 1, 2016 and held for the six months ended September 30, 2016.
Actual Expenses Example
The first line of the table below provides information about actual account valuesand actual expenses. You may use the information in this line, together with theamount you invested, to estimate the expenses that you paid over the period. Simplydivide your account value by $1,000 (for example, an $8,600 account value dividedby $1,000 = 8.6), then multiply the result by the number in the first line under theheading entitled “Expenses Paid During the Period” to estimate the expenses youpaid on your account during this period.
Hypothetical Example for Comparison Purposes
The second line of the table below provides information about hypothetical accountvalues and hypothetical expenses based on the Fund’s actual expense ratio and anassumed rate of return of 5% per year before expenses, which is not the Fund’s actualreturn. The hypothetical account values and expenses may not be used to estimatethe actual ending account balance or expenses you paid for the period. You may usethis information to compare the ongoing costs of investing in the Fund and otherfunds. To do so, compare this 5% hypothetical example with the 5% hypotheticalexamples that appear in the shareholder reports of the other funds.
Please note that the expenses shown in the table are meant to highlight your ongoingcosts only and do not reflect and transactional costs, such as sales charges (loads).Therefore, the second line of the table is useful in comparing ongoing costs only, andwill not help you determine the relative total costs of owning different funds. Inaddition, if these transactional costs were included, your costs would have been higher.
Ending Expenses Paid Beginning Account During PeriodAccount Value Annualized Ended*
Value September 30, Expense September 30,April 1, 2016 2016 Ratio 2016
Actual $1,000 $1,271.08 2.34% $13.32Hypothetical** $1,000 $1,013.30 2.34% $11.81
* Expenses are equal to the Fund’s annualized expense ratio, multiplied by the average account value for theperiod, multiplied by 183 days in the most recent fiscal half year divided by 365 days in the current year.
** 5% return before expenses


Investment Adviser:
Perkins Capital Management, Inc.730 East Lake StreetWayzata, MN 55391-17694
Distributor:
First Dominion Capital Corp.8730 Stony Point Parkway, Suite 205Richmond, VA 23235
Independent Registered Public Accounting Firm:
Tait, Weller & Baker LLP1818 Market Street, Suite 2400Philadelphia, PA 19103
Transfer Agent, Fund Accounting and Fund Administration:
Commonwealth Fund Services, Inc.8730 Stony Point Parkway, Suite 205Richmond, VA 23235
Legal Counsel:
The Law Offices of John H. Lively & Associates, Inc.A member firm of The 1940 Act Law Group™11300 Tomahawk Creek Parkway, Suite 310Leawood, KS 66211
More Information:
For 24 hours, 7 days a week price information, and for information on any series ofthe World Funds Trust investment plans, and other shareholder services, callCommonwealth Fund Services, Inc. at (800) 673-0550 Toll Free.