semiconductor radioisotope detector for capillary … · radiation-counting system (radiation...
TRANSCRIPT
Journal of Chromatography, 480 (1989) 259-270 Elsevier Science Publishers B.V., Amsterdam ~ Printed in The Netherlands
CHROM. 21 922
SEMICONDUCTOR RADIOISOTOPE DETECTOR FOR CAPILLARY ELEC- TROPHORESIS
STEPHEN L. PENTONEY, Jr. and RICHARD N. ZARE*
Department of Chemistry, Star$ord University, Stanford. CA 94305 (U.S.A.)
and
JEFF F. QUINT
Beckman Instruments, Inc., Scient$c Instruments Division, Fullerton, CA 92634 (U.S.A.)
SUMMARY
A simple, semiconductor radioactivity detector for capillary electrophoresis is de- scribed. The capillary electrophoresis-radioisotope detector system utilizes a com- mercially available semiconductor device which is positioned external to the sep- aration channel and which responds directly to impinging y or high-energy /3 radiation. The system performance is evaluated using synthetic mixtures of 32P-la- beled sample molecules and the efficiency of the semiconductor detector (planar ge- ometry) is determined to be approximately 26%. The detection limit is determined to be in the low nanocurie range for separations performed under standard conditions (an injected sample quantity of 1 nCi corresponds to 110 . lo-” moles of 32P). The lower limit of detection is extended to the sub-nanocurie level by use of flow (voltage) programming to increase the residence time of labeled sample components in the detection volume.
INTRODUCTION
The highly efficient separations afforded by capillary electrophoresis (CE) are a direct result of employing extremely narrow separation channels. Effective dissipa- tion of heat generated by the passage of electrical current through the separation medium occurs only when the capillary inner surface area to internal volume ratio is sufficiently large (typically lo4 to lo5 m-l). For this reason capillary tubes with internal diameters ranging from 200 pm to as small as 10 pm have been selected for CE separations’.
Early in the development of capillary electrophoresis, Jorgenson and Lukacs2 noted that the successful detection of separated sample components present within the narrow confines of these capillary tubes posed a major challenge. In response to this challenge, much research has been directed towards the development of sensitive and selective detectors for capillary electrophoresis. The reported CE detector tech- nology has been largely borrowed from the field of high-performance liquid chroma- tography (HPLC), especially from microcolumn HPLC. Successful extension of the
0021.9673/89/$03,50 0 1989 Elsevier Science Publishers B.V
260 S. L. PENTONEY, Jr., R. N. ZARE, J. F. QUINT
various HPLC detection schemes to capillary electrophoresis has generally involved miniaturizing existing technology while at the same time striving for improved sensi- tivity.
One detection scheme that is used widely in HPLC but has received little atten- tion in capillary electrophoresis applications is radioisotope detection3p6. The avail- ability of an on-line radioisotope detector for CE would be especially appealing for several reasons. First, state-of-the-art radiation detection technology can offer ex- tremely high sensitivity. Second, radioisotope detection affords unrivaled selectivity because only those sample components that have been radio-labeled yield a response at the detector. Third, the radio-labeled molecule possesses the same chemical proper- ties as the unlabeled molecule, thereby permitting tracer studies to be conducted. Fourth, radioisotope detection can be directly calibrated to provide a measurement of absolute concentration of the labeled species. Finally, a CE system in which radio- activity detection is coupled with more conventional detectors would add extra versa- tility to this new separation technique.
Radioisotope detection of 32P, 14C and “Tc has previously been reported by Kaniansky et al7 for isotachophoresis. In their work, isotachophoretic separations were performed using 300~pm internal diameter fluorinated ethylene-propylene co- polymer capillary tubing and either a Geiger-Miiller tube or a scintillating foil/photo- multiplier tube combination to detect emitted /I particles. Neither detector efficiency nor quantitative detection limits were reported in their work, although the minimum amount of material that could be detected was stated to be less than that detectable by a conductivity detector.
Altria et aZ.* reported the CE separation and detection of radiopharmaceuticals containing ggmTc a y emitter with a 6-h half-life (see also ref. 9). Their design involved passing a capillary tube (ca. 2 cm long) through a solid block of scintillator material and detecting the light emitted as technetium-labeled sample zones traversed the detection volume. Unfortunately, detection limits and detector efficiency have not been reported.
We report here the design and characterization of a simple on-line radioisotope detector for capillary electrophoresis. The detector utilizes a commercially available semiconductor device that responds directly to emitted /I particles that pass through the walls of the fused-silica separation channel. A similar semiconductor detector for y-emitting radiopharmaceuticals separated by HPLC has previously been reported by Needham and Delaney . lo The detector described in the present work is applicable to both high-energy p emitters and y emitters. We report here on its application to the detection of 32P-labeled molecules separated by CE.
EXPERIMENTAL
Semiconductor radioactivity detector The on-line radioactivity detector (see Fig. 1) consisted of a Model S103.1/P4
spectroscopic-grade cadmium telluride semiconductor detector and a Model CTC-4B radiation-counting system (Radiation Monitoring Devices, Watertown, MA, U.S.A.). The cadmium telluride detector probe consisted of a 2-mm cube of CdTe which was set in a thermoplastic and positioned behind a thin film of aluminized mylar at a distance of appproximately 1.5 mm from the face of an aluminum housing

RADIOISOTOPE DETECTOR FOR CAPILLARY ELECTROPHORESIS 261
ctor r
Reservoir Reservoir
I I - HV -
I I
Fig. 1. Experimental setup of the capillary electrophoresis-radioisotope detector system. The inset shows the positioning of the CdTe probe with respect to the capillary tubing. HV = High-voltage power supply.
(see Fig. 1). A 2-mm-wide Pb aperture (0.008 in. thick) was used to shield the CdTe detector element from radiation originating from regions of the capillary adjacent to the detection volume. The aluminum housing incorporated a BNC-type connector which facilitated both physical and electrical connection to a miniature charge-sensi- tive preamplifier. The CdTe probe and preamplifier assembly were mounted on an x-y translation stage and the face of the aluminum housing was brought into direct contact with the polyimide-clad fused-silica capillary/Pb aperture assembly. The CdTe detector was operated at the manufacturer’s suggested bias voltage of 60 V and the detector signal (the creation of electron-hole pairs produced as fi particles were decelerated within the semiconductor material) was amplified by the charge-sensitive preamplifier and sent through a 6-ft. cable to the counting and display electronics of the CTC-4B counting unit. Although the CTC-4B is capable of room temperature energy discrimination, all experiments reported here were performed with a relatively large energy window. The upper energy discriminator setting was 1 MeV (the maxi- mum setting for the CTC4B) and the low energy setting was 0.01 MeV or 0.03 MeV.
The CdTe radioactivity detector was computer interfaced to a laboratory mi- crocomputer (IBM PC-XT) by using the open collector output of the CTC-4B count- ing unit. The open collector output was tied high by way of a l-kQ pull-up resistor so that the unit provided a negative going transistor-transistor logic (TTL) pulse for each count measured. This TTL signal was sent to a photon counter (Model 1109, EG&G Princeton Applied Research) and counting intervals (typically 1 s) for run- time data acquisition were preselected by way of front-panel thumbwheel switches on the photon counter. The binary coded decimal (BCD) output of the photon counter was read at the end of a preset counting interval (strobe sent by the 1109 counter) by a laboratory microcomputer using a 32-bit digital input/output board (Model DT2817, Data Translation, Marlboro, MA. U.S.A.). Data acquisition and storage were ac-
262 S. L. PENTONEY, Jr., R. N. ZARE, J. F. QUlNT
complished using software which was written in-house (BASIC). Migration times and peak widths reported here were determined manually from scale-expanded portions of the recorded electropherograms.
Apparatus
The experimental setup of the capillary electrophoresis system was similar to that described previously”,i2 and is illustrated in Fig. 1. A 2-mm section of a 100 cm x 100 pm I.D. fused-silica capillary tube (TSP 100/365 Polymicro Technologies) was
exposed to the CdTe semiconductor by placing the Pb foil aperture directly be- tween the face of the detector housing and the fused silica capillary at a distance of 75 cm from the inlet end of the capillary tube. This resulted in a detection volume of approximately 15 nl.
Each end of the capillary tubing was dipped into a 4-ml glass vial containing approximately 3 ml of electrolyte-buffer solution. Connection to high voltage was provided by a strip of Pt-foil submersed in each of the buffer reservoirs. The injection end of the capillary was connected to ground while the detection end was held at a high negative potential, typically -20 kV. Plexiglass shielding (0.25 in. thick) was placed around the ground buffer reservoir because the top of this vial was quickly contaminated by sample solution carried on the outside of the capillary tube during the sample injection procedure. This contamination, if unshielded, leads to unneces- sary operator exposure to radiation.
The current through the system was monitored as a potential drop across a l-kS2 resistor in the ground side of the circuit. The capillary system and detector were enclosed in a Plexiglass box to prevent operator exposure to high voltage. Electroos- motic flow-rates reported here were measured in a manner similar to that described by Huang et aZ.13. The capillary tube was filled with running buffer diluted by lo%, the buffer reservoirs were filled with running buffer, and the current was monitored as one tubing volume was displaced by supporting buffer under the influence of the applied potential. Sample introduction was accomplished in all experiments reported here by using hydrostatic pressure.
The high-voltage power supply (Model MG30N100, Glassmann High Voltage, Whitehouse Station, NJ, U.S.A.) was continuously programmable from 0 to - 30 kV by means of an external 0-10-V d.c. signal voltage. The flow programming experi- ments reported here were accomplished by manually reducing the program voltage to the high-voltage supply.
Reagents Aqueous ethanol solutions of the triethylammonium salts of adenosine 5’-[cc-
32P]triphosphate (ATP) and guanosine 5’-[a-32P]triphosphate (GTP) were purchased from Amersham (Arlington Heights, IL, U.S.A.). Radioactive sample concentrations reported for detector efficiency determination were adjusted from the manufacturer’s specifications after subjecting several diluted aliquots of the stock solution to liquid scintillation counting. The concentration was further corrected for radiochemical purity according to the manufacturer’s specifications because liquid scintillation counting measures the total sample activity and does not account for the presence of radio-labeled impurities. Stock solutions were stored at - 15°C in order to minimize sample loss due to hydrolysis. Injected sample solutions were prepared in 0.25 ml
RADIOISOTOPE DETECTOR FOR CAPILLARY ELECTROPHORESIS 263
plastic vials by diluting stock solutions with buffer and were also stored at - 15°C. Water used to prepare solutions was freshly deionized and distilled with a water
purifier (Model LD-2A coupled with a Mega-Pure Automatic Distiller, Corning Glassworks). The supporting electrolyte for all experiments reported here was a bo- rate buffer, (pH 8.1,0.20 M) prepared from reagent-grade sodium borate decahydrate and boric acid (J.T. Baker).
RESULTS AND DISCUSSION
Successful detection of 32P-labeled molecules separated by capillary electro- phoresis using the above detection scheme in which a sensor is positioned external to the separation channel is made possible by several factors. These include (1) the large energy associated with /I decay of 32P (1.7 MeV), (2) the high sensitivity and small size of commercially available semiconductor detectors, (3) the short lengths of fused silica (capillary wall thickness) and aqueous electrolyte through which the radiation must pass before striking the detector, and (4) the relatively short half-life of 32P (14.3 days).
The process of j?! decay for 32P may be written as14,
(1)
where fl- represents the negatively charged b particle and ? is the antineutrino. 32P is an example of a “pure p emitter” which populates only the ground state of the product nucleus. Each P-decay transition is characterized by a fixed decay energy which is shared between the fl particle and the antineutrino. As a result, the /II particle is emitted with an energy that varies from decay to decay and ranges from zero to the “/I end-point energy”, which is numerically equal to the transition decay energy. A p energy spectrum for 32P shows a maximum particle energy of 1.7 MeV and an aver- age particle energy of approximately 0.57 MeV. The penetrating ability of p particles through various media may be obtained from literature range-energy plots in which the product of particle range and medium density (“mass thickness”) are plotted against particle energy. Such plots are especially useful because they may be used to predict the penetration length at a given particle energy in media other than that used to obtain the original plot14. From such plots, one would predict that the average fl particle energy (ca. 0.57 MeV) produced by decay of 32P would correspond to a range of approximately 2000 pm in water and approximately 9.50 pm in fused silica. Thus, 32P decay would be detectable by a sensitive device positioned external to the fused- silica capillary tubing (of the dimensions normally selected for CE separations).
Because the CdTe detector was not visible through the aluminized mylar film, it was necessary to check for proper alignment of the capillary tube with respect to the CdTe cube. This was accomplished by filling the detection volume with radioactive material and monitoring the signal level as the detector was translated with respect to the capillary. The observed signal was not very sensitive to positioning when the capillary was offset over a range of f 1.5 mm from the center of the aluminum housing but dropped off rapidly at greater distances. All experiments reported here
264 S. L. PENTONEY, Jr., R. N. ZARE, J. F. QUINT
were performed with the capillary positioned at the center of the aluminum housing, as indicated in Fig. 1.
Detector eficiency In order to calculate the efficiency of the on-line radioactivity detector for 32P,
it was necessary to determine the volume of sample which was injected onto the capillary tube by the gravity flow technique. The volume of sample introduced by hydrostatic pressure was determined as follows: A plug of 32P-labeled ATP was introduced onto the capillary by raising the sample vial 6.5 cm above the high voltage reservoir for 30 s. The end of the capillary was then returned to the anode reservoir and electrophoresis was performed for 5 min at high voltage. This 5-min high-voltage period served to transfer the sample plug toward the detector and away from the injection end of the capillary as if an actual separation were being performed. At the end of the 5-min period the voltage was switched off and the electrolyte within the capillary tube was driven, via syringe, into a liquid scintillation vial located beneath the capillary outlet. This rinsing was continued until approximately 8 capillary vol- umes of electrolyte were collected. The collected sample plugs were mixed with scintil- lation cocktail and subjected to liquid scintillation counting. The injection volumes were determined by relating the activity of the sample plugs to that of the injected sample solution. This procedure indicated that 84 nl of sample solution was intro- duced onto the capillary column by the gravity flow method and that the repeatability of manual injection was 3.7% relative standard deviation (n = 10).
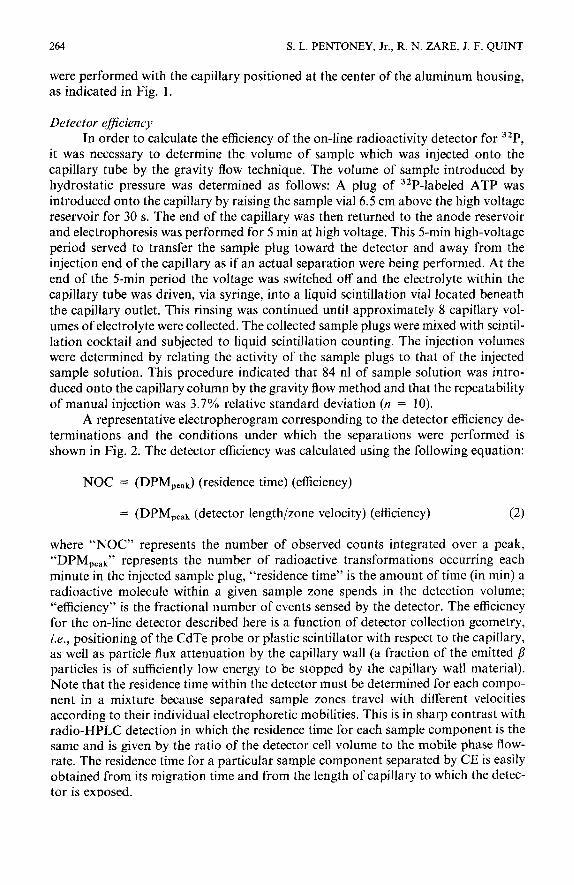
A representative electropherogram corresponding to the detector efficiency de- terminations and the conditions under which the separations were performed is shown in Fig. 2. The detector efficiency was calculated using the following equation:
NOC = (DPM,,,J (residence time) (efficiency)
= (DP&w,k (detector length/zone velocity) (efficiency)
where “NOC” represents the number of observed counts integrated over a peak, “DPMpeak” represents the number of radioactive transformations occurring each minute in the injected sample plug, “residence time” is the amount of time (in min) a radioactive molecule within a given sample zone spends in the detection volume; “efficiency” is the fractional number of events sensed by the detector. The efficiency for the on-line detector described here is a function of detector collection geometry, i.e., positioning of the CdTe probe or plastic scintillator with respect to the capillary, as well as particle flux attenuation by the capillary wall (a fraction of the emitted /? particles is of sufficiently low energy to be stopped by the capillary wall material). Note that the residence time within the detector must be determined for each compo- nent in a mixture because separated sample zones travel with different velocities according to their individual electrophoretic mobilities. This is in sharp contrast with radio-HPLC detection in which the residence time for each sample component is the same and is given by the ratio of the detector cell volume to the mobile phase flow-
rate. The residence time for a particular sample component separated by CE is easily obtained from its migration time and from the length of capillary to which the detec- tor is exposed.
0 10 20 30
Time (mid
Fig. 2. Capillary electropherogram of adenosine 5’-[a-3zP]triphosphate obtained by injecting approximate- ly 51 nCi (7 lo-* M solution) onto the capillary and applying a constant potential of -20 kV. The separation was continuously monitored using the CdTe semiconductor radioisotope detector. Data were subjected to a 5-point sliding smooth. The electrolyte was 0.2 A4 borate buffer, pH 8.1.
Results obtained for 11 replicate runs indicate that the efficiency of 32P detec- tion for the on-line CdTe radioactivity detector is approximately 26%. The back- ground noise level of the CdTe detector system is a function of the low energy dis- criminator setting. The value of 0.01 MeV selected for the efficiency determination experiments reported here gave a background count rate of approximately 10 counts/ min while leaving a wide energy window open for detection.
Flow programming
Eqn. 2 suggests that the number of counts measured (the detector sensitivity) over a sample peak may be increased by lengthening the residence time of the sample in the detection volume. This is equivalent to increasing the counting time on a liquid scintillation counter and this concept has been recognized in both radio-HPLC (see, e.g., ref. 15) and appears to have been applied to radioisotope detection in isotacho- phoresis7,‘6p18. In capillary electrophoresis, the velocity of a sample zone may be reduced and its residence time increased by simply reducing the applied potential as the zone passes through the detection volume. The most efficient implementation of this flow-programming concept would involve reducing the zone velocities only while the sample was present within the detection volume and operating at a relatively high potential at all other times. To our knowledge, this type of flow programming has not previously been explored in CE. Although it is demonstrated only for radioisotope detection here, this methodology should be applicable to other modes of sample detection in CE.
266 S. L. PENTONEY, Jr., R. N. ZARE, J. F. QUINT
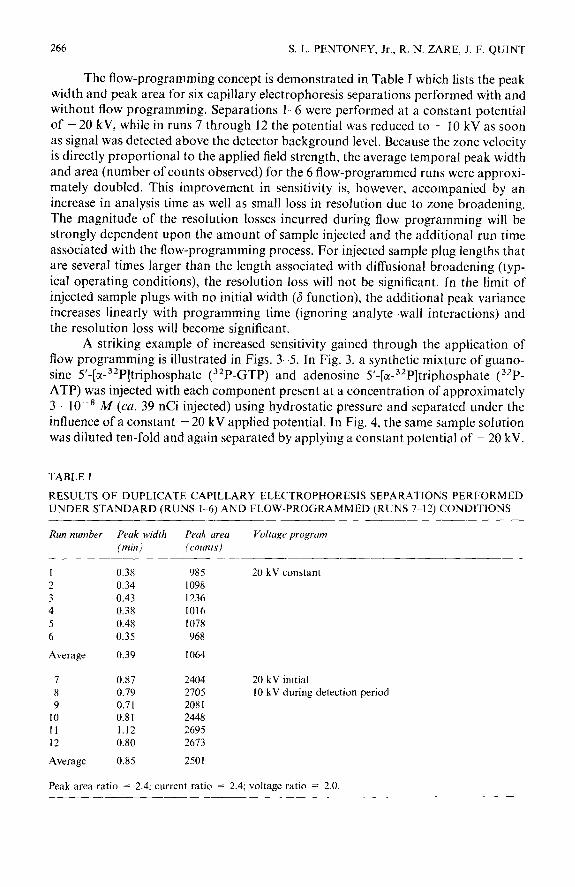
The flow-programming concept is demonstrated in Table I which lists the peak width and peak area for six capillary electrophoresis separations performed with and without flow programming. Separations 1-6 were performed at a constant potential of - 20 kV, while in runs 7 through 12 the potential was reduced to - 10 kV as soon as signal was detected above the detector background level. Because the zone velocity is directly proportional to the applied field strength, the average temporal peak width and area (number of counts observed) for the 6 flow-programmed runs were approxi- mately doubled. This improvement in sensitivity is, however, accompanied by an increase in analysis time as well as small loss in resolution due to zone broadening. The magnitude of the resolution losses incurred during flow programming will be strongly dependent upon the amount of sample injected and the additional run time associated with the flow-programming process. For injected sample plug lengths that are several times larger than the length associated with diffusional broadening (typ- ical operating conditions), the resolution loss will not be significant. In the limit of injected sample plugs with no initial width (6 function), the additional peak variance increases linearly with programming time (ignoring analyte-wall interactions) and the resolution loss will become significant.
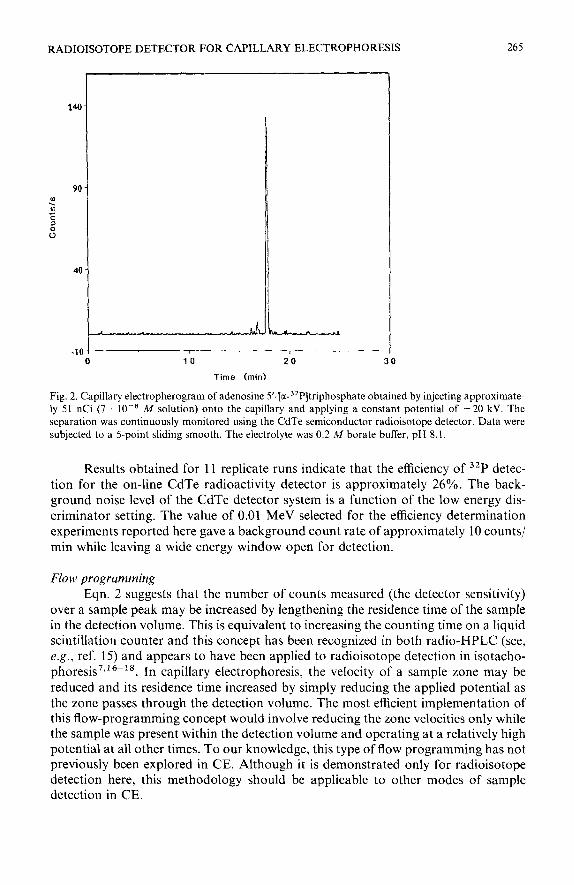
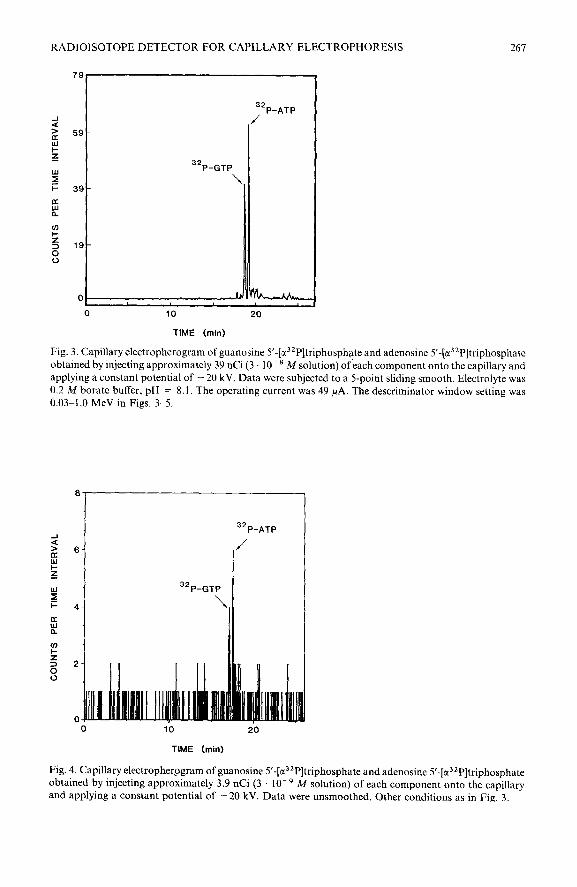
A striking example of increased sensitivity gained through the application of flow programming is illustrated in Figs. 3-5. In Fig. 3, a synthetic mixture of guano- sine 5’-[cx-32P]triphosphate (32P-GTP) and adenosine 5’-[cc-32P]triphosphate (32P- ATP) was injected with each component present at a concentration of approximately 3 lo-’ M (cu. 39 nCi injected) using hydrostatic pressure and separated under the influence of a constant - 20 kV applied potential. In Fig. 4, the same sample solution was diluted ten-fold and again separated by applying a constant potential of - 20 kV.
TABLE I
RESULTS OF DUPLICATE CAPILLARY ELECTROPHORESIS SEPARATIONS PERFORMED UNDER STANDARD (RUNS 1-6) AND FLOW-PROGRAMMED (RUNS 7-12) CONDITIONS
Run number Peak width Peak area Voltage propun
(min) (counts)
Average
7 8 9
10 I1 12
Average
0.38
0.34
0.43
0.38
0.48
0.35
0.39
0.87 0.79
0.71 0.8 I 1.12
0.80
0.85
985
1098 1236 1016
1078 968
20 kV constant
1064
2404 2705 2081 2448 2695 2673
20 kV initial 10 kV during detection period
2501
Peak area ratio = 2.4; current ratio = 2.4; voltage ratio = 2.0.
RADIOISOTOPE DETECTOR FOR CAPILLARY ELECTROPHORESIS 267
32P-ATP /
0 10 20
TIME (mid
Fig. 3. Capillary electropherogram of guanosine 5’-[c?P]triphosphate and adenosine 5’-[u32P]triphosphate obtained by injecting approximately 39 nCi (3 10-a A4 solution) of-each component onto the capillary and applying a constant potential of - 20 kV. Data were subjected to a 5-point sliding smooth. Electrolyte was 0.2 M borate buffer, pH = 8.1. The operating current was 49 PA. The descriminator window setting was 0.03-1.0 MeV in Figs. 3-5.
32P-ATP
32P-GTP
\
TIME (min)
Fig. 4. Capillary electropherpgram of guanosine S-[c?*P]triphosphate and adenosine 5’-[a3’P]triphosphate obtained by injecting approximately 3.9 nCi (3 lo-’ M solution) of each component onto the capillary and applying a constant potential of - 20 kV. Data were unsmoothed. Other conditions as in Fig. 3.
268 S. L. PENTONEY, Jr., R. N. ZARE, J. F. QUINT
TIME (mid
200° 5 10 15 , , 37 42 I I II t
0 3.6 7.2 10.8 14.4 18.0
ELECTROLYTE VOLUME DISPLACED (pl )
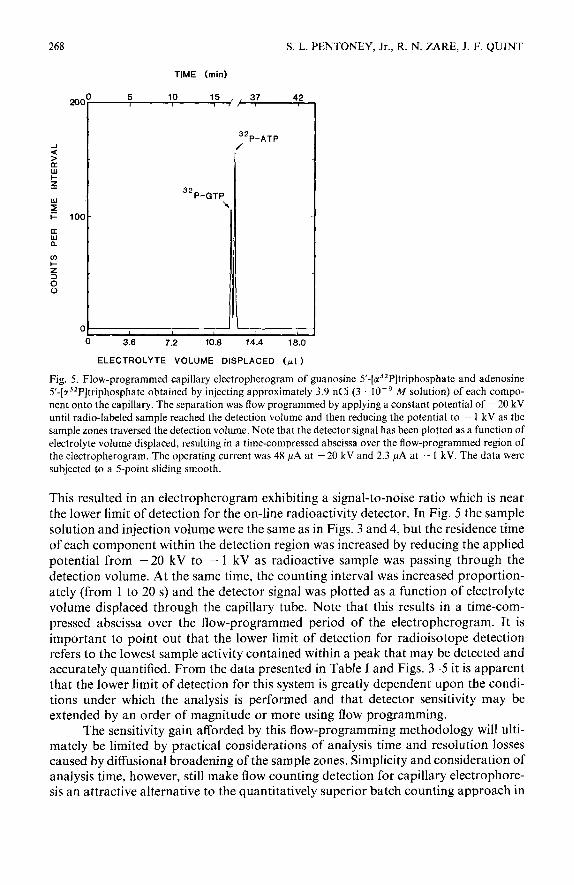
Fig. 5. Flow-programmed capillary electropherogram of guanosine 5’-[a32P]triphosphate and adenosine 5’-[a32P]triphosphate obtained by injecting approximately 3.9 nCi (3 10m9 M solution) of each compo- nent onto the capillary. The separation was flow programmed by applying a constant potential of - 20 kV until radio-labeled sample reached the detection volume and then reducing the potential to - 1 kV as the
sample zones traversed the detection volume. Note that the detector signal has been plotted as a function of electrolyte volume displaced, resulting in a time-compressed abscissa over the flow-programmed region of the electropherogram. The operating current was 48 PA at - 20 kV and 2.3 PA at - 1 kV. The data were subjected to a 5-point sliding smooth.
This resulted in an electropherogram exhibiting a signal-to-noise ratio which is near the lower limit of detection for the on-line radioactivity detector. In Fig. 5 the sample solution and injection volume were the same as in Figs. 3 and 4, but the residence time of each component within the detection region was increased by reducing the applied potential from - 20 kV to - 1 kV as radioactive sample was passing through the detection volume. At the same time, the counting interval was increased proportion- ately (from 1 to 20 s) and the detector signal was plotted as a function of electrolyte volume displaced through the capillary tube. Note that this results in a time-com- pressed abscissa over the flow-programmed period of the electropherogram. It is important to point out that the lower limit of detection for radioisotope detection refers to the lowest sample activity contained within a peak that may be detected and accurately quantified. From the data presented in Table I and Figs. 3-5 it is apparent that the lower limit of detection for this system is greatly dependent upon the condi- tions under which the analysis is performed and that detector sensitivity may be extended by an order of magnitude or more using flow programming.
The sensitivity gain afforded by this flow-programming methodology will ulti- mately be limited by practical considerations of analysis time and resolution losses caused by diffusional broadening of the sample zones. Simplicity and consideration of analysis time, however, still make flow counting detection for capillary electrophore- sis an attractive alternative to the quantitatively superior batch counting approach in
RADIOISOTOPE DETECTOR FOR CAPILLARY ELECTROPHORESIS 269
which fractions are collected and subjected to conventional counting techniques”. The batch counting approach, provided that sufficiently small fractions may be col- lected, does offer the advantage of decoupling separation considerations from mea- surement time.
Considering only the limitation imposed by diffusional spreading of sample zones during the flow-programmed portion of a run, it is possible to predict the extent to which detector sensitivity may be improved by flow programming. For an injection volume of 84 nl, as used for detector efficiency determination in this work, and a maximum allowable increase in zone variance defined to be lo%, approximately 84 min of flow programming would be permitted (this calculation assumes a rectangular injection profile, a solute diffusion coefficient of 10e6 cm’/s, and neglects both diffu- sional broadening prior to flow programming and velocity dependent analyte-wall interactions). For a single component, this 10% increase in variance would be accom- panied by a 250-fold increase in the number of counts observed over a peak. Because the sensitivity of radioisotope detection is governed by counting statistics, a 16-fold increase in the signal-to-noise ratio (NOC/(NOC)“2) would result. Thus, a lower limit of detection of about lo-l1 M would seem to be a conservative extrapolation. Obviously, the limitations imposed by diffusional broadening would become more severe if the initial injection volume were reduced.
In an automated implementation of the flow-programming methodology, that is, with the high-voltage power supply under computer control, there is a further limitation imposed upon achievable sensitivity gains. There must be enough labeled sample present to generate a signal that is sufficiently large to exceed the detector background level under standard (non-flow-programmed) conditions in order to ini- tiate the flow-programming procedure. In certain instances, however, prior knowl- edge of elution times for the compounds of interest would permit this limitation to be overcome.
CONCLUSION
A simple on-line radioisotope detector for CE has been described and charac- terized for the analysis of 32P-labeled analytes. The minimum limit of detection for this system was shown to be strongly dependent upon the conditions under which the analysis is performed. For standard CE separations that are performed at a relatively high (constant) voltage, the minimum limit of detection was found to be in the low nanocurie (injected sample quantity) range, corresponding to an analyte concentra- tion of about 10m9 M. The lower limit of detection for this type of detection system was extended to the sub-nanocurie level (cu. lo-” M) by application of flow-pro- gramming methodology which served to increase the residence time of labeled sample components within the detection volume. Thus radioisotope detection, when applica- ble, has a sensitivity which is superior to most other detection schemes and which is comparable to electrochemical detection19*20 and laser-induced fluorescence detec- tion 11,21,22
One improvement to the current systems will involve automation of the flow- programming methodology and such efforts are currently underway in this. A second improvement over the current semiconductor system would involve optimizing the detector geometry by capturing a larger solid angle with the CdTe detector. In certain
270 S. L. PENTONEY, Jr., R. N. ZARE, J. F. QUINT
instances it would be desirable to reduce the effective detection volume of this system in order to increase resolution. This could be accomplished by installing a narrower aperture in the semiconductor detector, although detector sensitivity will be reduced because the detection volume and effective residence time will be decreased. Hence, there is once again a practical trade-off between detector sensitivity and resolution.
ACKNOWLEDGEMENTS
S.L.P. wishes to thank David J. Rakestraw, Patrick H. Vacarro, and W. How- ard Whitted for many helpful conversations pertaining to this work. Support for this work by Beckman Instruments, Inc., is gratefully acknowledged.
REFERENCES
1 B. Nickerson and J.W. Jorgenson, J. High Resolut. Chromatogr. Chromatogr. Commun., I1 (1988) 533-534.
2 J. W. Jorgenson and K. D. Lukacs, Science (Washington, DC), 222 (1983) 266272. 3 M. J. Kessler, in D. M. Wieland, M. C. Tobes and T. J. Mangner (Editors), Analyticul und Chroma-
tographic Techniques in Radiopharmuceutical Chetrktry, Springer, New York, 1987, Ch. 557.
4 T. R. Roberts, Radiochromatography (Journal of Chromatogruphy Library, Vol. 14), Elsevier, Am- sterdam, Oxford, New York, 1978, Ch. 6.
5 M. J. Kessler, Am. Lab., 20, No. 6 (1988) 8695. 6 M. J. Kessler, Am. Lab., 20, No. 8 (1988) 76-81. 7 D. Kaniansky, D. Rajec, P. Svec, P. Havas and F. Macasek, J. Chromatogr., 258 (1983) 238-243. 8 K. D. Altria, C. F. Simpson, A. Bharij and A. E. Theobald, presented at the 1988 Pittsburgh Corzference
and Exposition, New Orleans, February, 1988, abstract No. 642. 9 V. Berry, LC GC, Mag. Liq. Gas Chromatogr., 6 (1988) 484-491.
10 R. E. Needham and M. F. Delaney, Anal. Chem., 55 (1983) 148~150. 11 E. Gassmann, J.E. Kuo and R. N. Zare, Science (Washington, D.C.), 230 (1985) 813-814. 12 M. J. Gordon, X. Huang, S. L. Pentoney, Jr., and R. N. Zare, Science (Washington, D.C.), 242 (1988)
224228. 13 X. Huang, M. J. Gordon and R. N. Zare, AnuI. Chem., 60 (1988) 1837-1838. 14 G. F. Knoll, Radiation Detection and Measurement, Wiley, New York, 1979. 15 P. Mark], in J. F. K. Huber (Editor), Instrumentation for High-Performance Liquid Chromatography,
(Journal of Chromatography Library, Vol. 13) Elsevier, Amsterdam, Oxford, New York, 1978, pp. 151-161.
16 S. Fanali, F. Foret and P. BoEek, J. Chromatogr., 330 (1985) 436-438. 17 F. Oerlemans and C. de Bruyn, J. Chromatogr., 225 (1981) 369-379. 18 H. E. M. Smuts and B. W. Russell, J. Chromutogr., 382 (1986) 326-330. 19 R. A. Wallingford and A. G. Ewing, Anal. Chem., 60 (1988) 258-263. 20 R. A. Wallingford and A. G. Ewing, An&. Chem.. 59 (1987) 1762-1766.
21 P. Gozel, E. Gassmann, H. Michelsen and R. N. Zare, Anal. Chem., 59 (1987) 4449. 22 N. J. Dovichi, presented at the 41~1 ACS Summer Symposium on Anal_vtical Chemistry, Starzford, CA
June 26-29. 1988.