senior design team 06112 rit formula sae …dyno.boxwithlights.com/deliver/pdr.pdf · fsae dyno...
TRANSCRIPT
FSAE Dyno Test Facility Team 06112
1
Senior Design Team 06112 RIT Formula SAE Dynamometer Test Facility
Preliminary Design Report
Fernando Fiore – Team Manager BS Mechanical Engineering, Auto Option
Matt Zimmer
BS Mechanical Engineering
Matthew Mudge BS Mechanical Engineering, Auto Option
Pat Augino
BS Mechanical Engineering, Auto Option
Mike Knauf BS Mechanical Engineering, Auto Option
Shay Coe
BS Electrical Engineering
Paul Williams BS Electrical Engineering
Professor Slack
Coordinator / Faculty Member
Dr. Alan Nye Mentor / Faculty Member
FSAE Dyno Test Facility Team 06112
2
Table of Contents 1. Recognize and Quantify Need
1.1.Project Background 1.2. Team Mission Statement 1.3. Dynamometer Description 1.4. Product Description 1.5. Scope Limitations 1.6. Stake Holder 1.7. Key Business Goals 1.8. Requirements 1.9. Financial Analysis
2. Existing Dynamometer 2.1.Overview of Existing Dynamometer 2.2.Areas of Concern
3. Needs Assessment/Concept Development 3.1. Dynamometer Absorber 3.1.1. Concept I: Re-Instrument the current water brake dynamometer 3.1.2. Concept II: DC Motor 3.2. Data Acquisition 3.3. Engine Mechanicals 3.4. Engine Management 3.5. Power Transmission 3.6. Dynamometer Interface (GUI)
4. Feasibility Assessment 4.1 DC Motor 4.2 Data Acquisition 4.3 Engine Mechanicals 4.4 Engine Management 4.5 Power Transmission 4.6 Dynamometer Control and Interface (GUI)
5. Preliminary Design 5.1 DC Motor 5.2 Data Acquisition 5.3 Engine Mechanicals 5.4 Engine Management 5.5 Power Transmission 5.6 Dynamometer Control and Interface (GUI)
6. References

FSAE Dyno Test Facility Team 06112
3
Terminology
AC- Alternating Current AN – Army/Navy DAQ – Data Acquisition DC- Direct Current DIN – Deutsches Institut für Normung DIP – Dual Inline Package FS – Full Scale FSAE – Formula SAE GmbH – Gesellschaft mit beschränkten Haftung MAP – Manifold Absolute Pressure PCI – Peripheral Component Interconnect RIT- Rochester Institute of Technology RPM – Revolutions per Minute SAE- Society of Automotive Engineers
FSAE Dyno Test Facility Team 06112
4
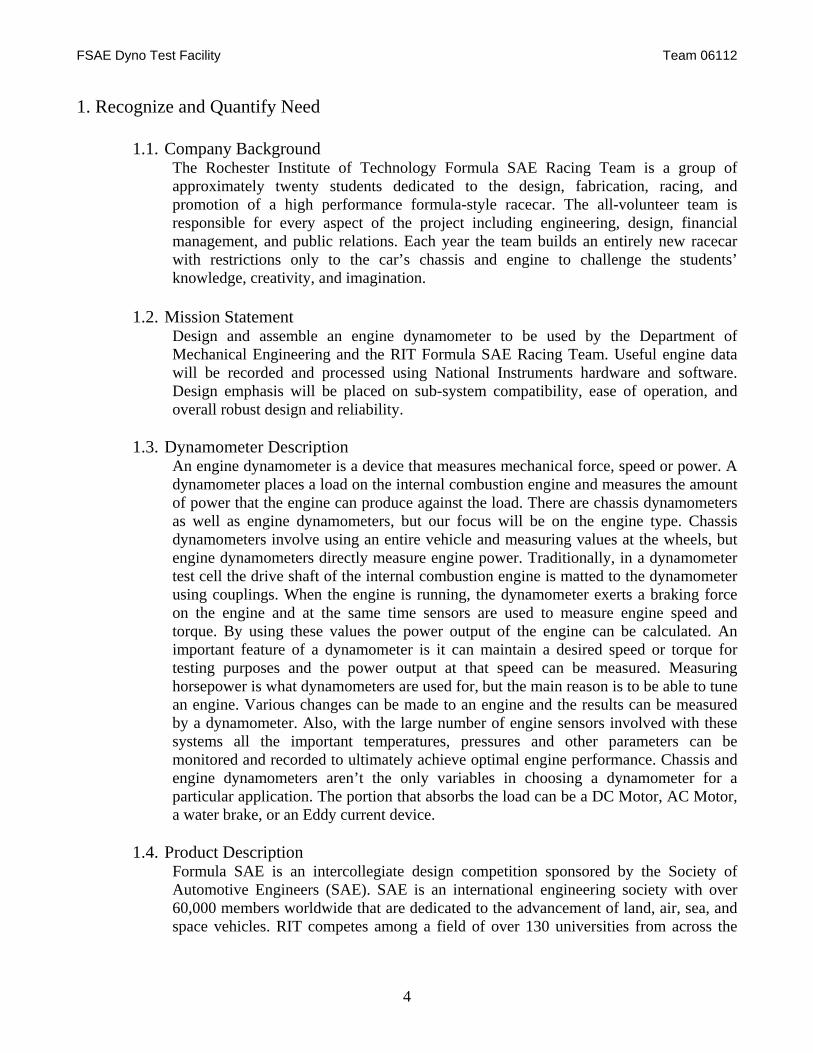
1. Recognize and Quantify Need 1.1. Company Background
The Rochester Institute of Technology Formula SAE Racing Team is a group of approximately twenty students dedicated to the design, fabrication, racing, and promotion of a high performance formula-style racecar. The all-volunteer team is responsible for every aspect of the project including engineering, design, financial management, and public relations. Each year the team builds an entirely new racecar with restrictions only to the car’s chassis and engine to challenge the students’ knowledge, creativity, and imagination.
1.2. Mission Statement
Design and assemble an engine dynamometer to be used by the Department of Mechanical Engineering and the RIT Formula SAE Racing Team. Useful engine data will be recorded and processed using National Instruments hardware and software. Design emphasis will be placed on sub-system compatibility, ease of operation, and overall robust design and reliability.
1.3. Dynamometer Description An engine dynamometer is a device that measures mechanical force, speed or power. A dynamometer places a load on the internal combustion engine and measures the amount of power that the engine can produce against the load. There are chassis dynamometers as well as engine dynamometers, but our focus will be on the engine type. Chassis dynamometers involve using an entire vehicle and measuring values at the wheels, but engine dynamometers directly measure engine power. Traditionally, in a dynamometer test cell the drive shaft of the internal combustion engine is matted to the dynamometer using couplings. When the engine is running, the dynamometer exerts a braking force on the engine and at the same time sensors are used to measure engine speed and torque. By using these values the power output of the engine can be calculated. An important feature of a dynamometer is it can maintain a desired speed or torque for testing purposes and the power output at that speed can be measured. Measuring horsepower is what dynamometers are used for, but the main reason is to be able to tune an engine. Various changes can be made to an engine and the results can be measured by a dynamometer. Also, with the large number of engine sensors involved with these systems all the important temperatures, pressures and other parameters can be monitored and recorded to ultimately achieve optimal engine performance. Chassis and engine dynamometers aren’t the only variables in choosing a dynamometer for a particular application. The portion that absorbs the load can be a DC Motor, AC Motor, a water brake, or an Eddy current device.
1.4. Product Description
Formula SAE is an intercollegiate design competition sponsored by the Society of Automotive Engineers (SAE). SAE is an international engineering society with over 60,000 members worldwide that are dedicated to the advancement of land, air, sea, and space vehicles. RIT competes among a field of over 130 universities from across the
FSAE Dyno Test Facility Team 06112
5
globe, and is judged on the vehicle’s design, cost, and performance, as well as the team’s ability to present the engineering concepts used in the final design.
1.5. Scope Limitations The preliminary design of the engine dynamometer shall be completed by the end of winter quarter, 2006 (RIT Qtr. 20052). At this time, the following deliverables shall be presented during the Preliminary Design Review:
• Needs Assessment • Concept Development • Feasibility Assessment • Preliminary Design Overview • Project Budget • Senior Design II: Spring Timeline
Upon completion of Senior Design II (RIT Qtr 20053) in May 2006, the following deliverables shall be presented during the Final Design Review:
• Functioning Engine Dynamometer • Technical Drawing Package • Operation Manual • Final Bill of Materials • Final Design Review
1.6. Stake Holders The primary stakeholders are the faculty and staff of the Rochester Institute of Technology Mechanical Engineering Department. The secondary stakeholders are the current and future members of the RIT Formula SAE Racing Team. The tertiary stakeholders are the current and future mechanical engineering students involved in Thermal Fluids Lab I and II and other labs to be developed in the future.
1.7. Key Business Goals The success of this project shall be determined by the following requirements:
• Fully functional DC dynamometer • Fully functional and adaptable data acquisition system • Automated control and operation of dynamometer
1.8. Requirements
1.8.1. Electrical Power Dissipation 1.8.1.1. Evaluate existing DC/AC current management 1.8.1.2. Size and obtain appropriately sized DC absorber 1.8.2. Dynamometer Controller Operation 1.8.2.1. Establish manual operation of controller with existing DC motor driver 1.8.2.2. Establish Serial communications with controller 1.8.2.3. Create graphical user interface for user to control dynamometer using a PC 1.8.3. Engine Instrumentation and Operation 1.8.3.1. Determine sensor types for desired engine data
FSAE Dyno Test Facility Team 06112
6
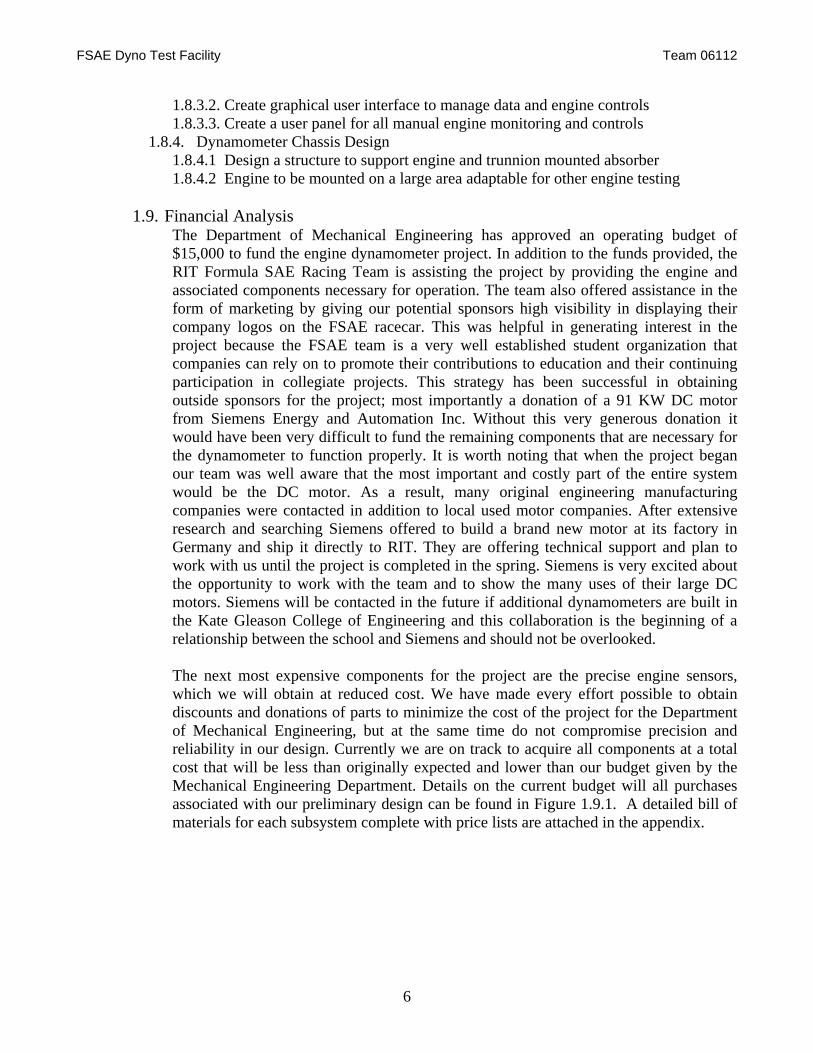
1.8.3.2. Create graphical user interface to manage data and engine controls 1.8.3.3. Create a user panel for all manual engine monitoring and controls 1.8.4. Dynamometer Chassis Design
1.8.4.1 Design a structure to support engine and trunnion mounted absorber 1.8.4.2 Engine to be mounted on a large area adaptable for other engine testing
1.9. Financial Analysis
The Department of Mechanical Engineering has approved an operating budget of $15,000 to fund the engine dynamometer project. In addition to the funds provided, the RIT Formula SAE Racing Team is assisting the project by providing the engine and associated components necessary for operation. The team also offered assistance in the form of marketing by giving our potential sponsors high visibility in displaying their company logos on the FSAE racecar. This was helpful in generating interest in the project because the FSAE team is a very well established student organization that companies can rely on to promote their contributions to education and their continuing participation in collegiate projects. This strategy has been successful in obtaining outside sponsors for the project; most importantly a donation of a 91 KW DC motor from Siemens Energy and Automation Inc. Without this very generous donation it would have been very difficult to fund the remaining components that are necessary for the dynamometer to function properly. It is worth noting that when the project began our team was well aware that the most important and costly part of the entire system would be the DC motor. As a result, many original engineering manufacturing companies were contacted in addition to local used motor companies. After extensive research and searching Siemens offered to build a brand new motor at its factory in Germany and ship it directly to RIT. They are offering technical support and plan to work with us until the project is completed in the spring. Siemens is very excited about the opportunity to work with the team and to show the many uses of their large DC motors. Siemens will be contacted in the future if additional dynamometers are built in the Kate Gleason College of Engineering and this collaboration is the beginning of a relationship between the school and Siemens and should not be overlooked. The next most expensive components for the project are the precise engine sensors, which we will obtain at reduced cost. We have made every effort possible to obtain discounts and donations of parts to minimize the cost of the project for the Department of Mechanical Engineering, but at the same time do not compromise precision and reliability in our design. Currently we are on track to acquire all components at a total cost that will be less than originally expected and lower than our budget given by the Mechanical Engineering Department. Details on the current budget will all purchases associated with our preliminary design can be found in Figure 1.9.1. A detailed bill of materials for each subsystem complete with price lists are attached in the appendix.
FSAE Dyno Test Facility Team 06112
7
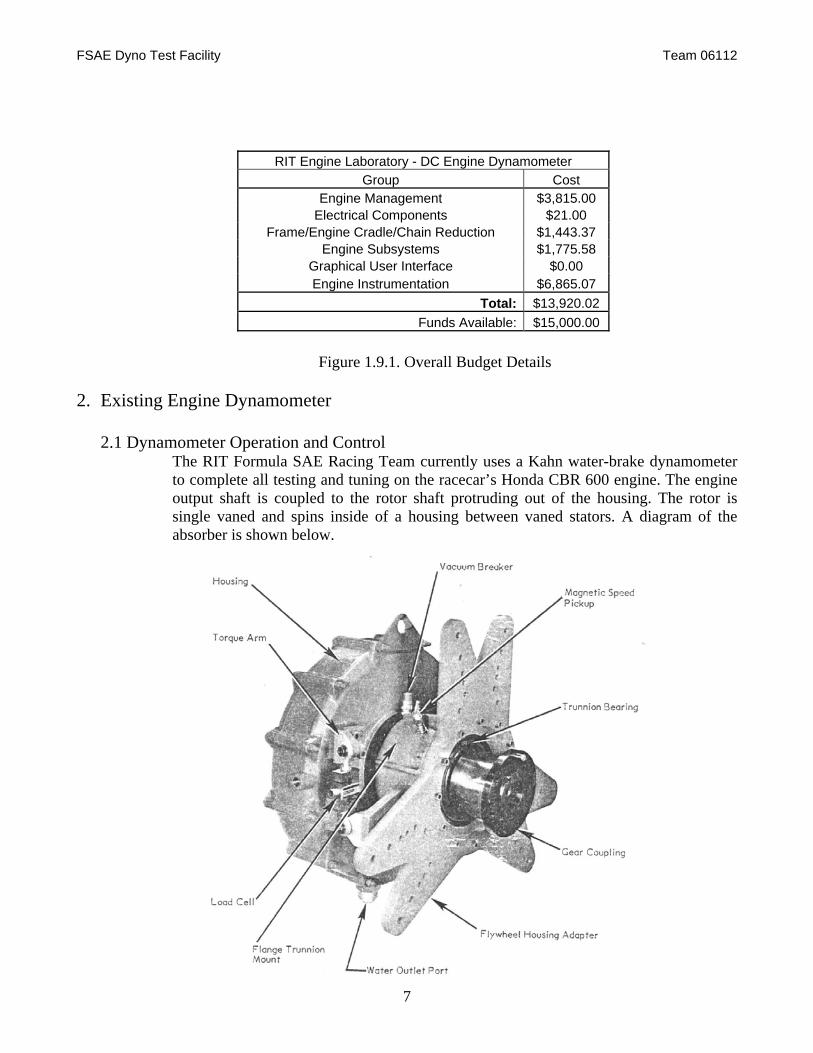
Figure 1.9.1. Overall Budget Details
2. Existing Engine Dynamometer
2.1 Dynamometer Operation and Control The RIT Formula SAE Racing Team currently uses a Kahn water-brake dynamometer to complete all testing and tuning on the racecar’s Honda CBR 600 engine. The engine output shaft is coupled to the rotor shaft protruding out of the housing. The rotor is single vaned and spins inside of a housing between vaned stators. A diagram of the absorber is shown below.
RIT Engine Laboratory - DC Engine Dynamometer Group Cost
Engine Management $3,815.00 Electrical Components $21.00
Frame/Engine Cradle/Chain Reduction $1,443.37 Engine Subsystems $1,775.58
Graphical User Interface $0.00 Engine Instrumentation $6,865.07
Total: $13,920.02 Funds Available: $15,000.00
FSAE Dyno Test Facility Team 06112
8
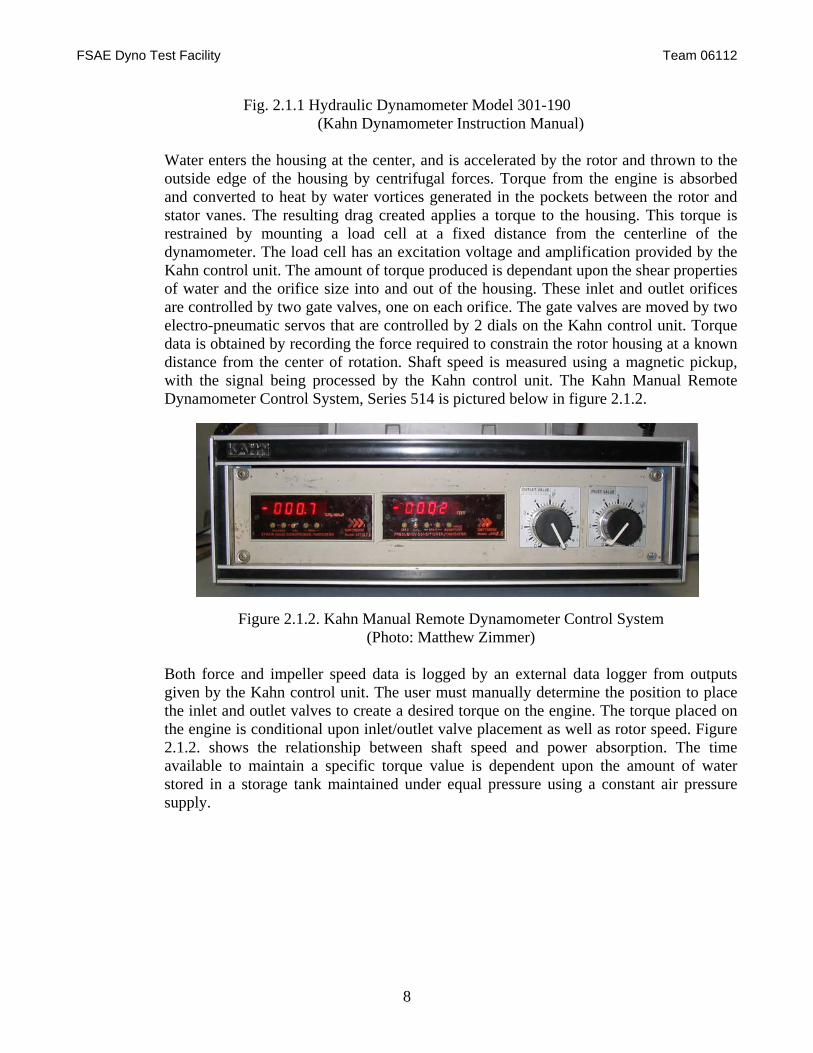
Fig. 2.1.1 Hydraulic Dynamometer Model 301-190 (Kahn Dynamometer Instruction Manual)
Water enters the housing at the center, and is accelerated by the rotor and thrown to the outside edge of the housing by centrifugal forces. Torque from the engine is absorbed and converted to heat by water vortices generated in the pockets between the rotor and stator vanes. The resulting drag created applies a torque to the housing. This torque is restrained by mounting a load cell at a fixed distance from the centerline of the dynamometer. The load cell has an excitation voltage and amplification provided by the Kahn control unit. The amount of torque produced is dependant upon the shear properties of water and the orifice size into and out of the housing. These inlet and outlet orifices are controlled by two gate valves, one on each orifice. The gate valves are moved by two electro-pneumatic servos that are controlled by 2 dials on the Kahn control unit. Torque data is obtained by recording the force required to constrain the rotor housing at a known distance from the center of rotation. Shaft speed is measured using a magnetic pickup, with the signal being processed by the Kahn control unit. The Kahn Manual Remote Dynamometer Control System, Series 514 is pictured below in figure 2.1.2.
Figure 2.1.2. Kahn Manual Remote Dynamometer Control System (Photo: Matthew Zimmer)
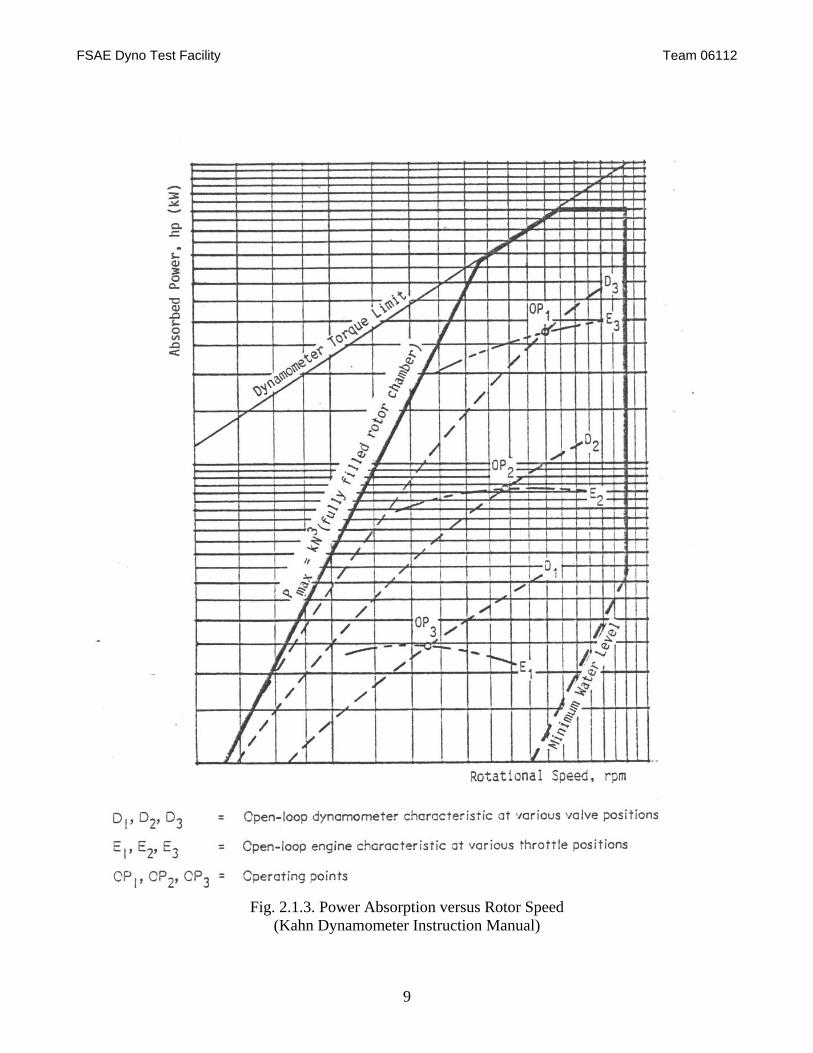
Both force and impeller speed data is logged by an external data logger from outputs given by the Kahn control unit. The user must manually determine the position to place the inlet and outlet valves to create a desired torque on the engine. The torque placed on the engine is conditional upon inlet/outlet valve placement as well as rotor speed. Figure 2.1.2. shows the relationship between shaft speed and power absorption. The time available to maintain a specific torque value is dependent upon the amount of water stored in a storage tank maintained under equal pressure using a constant air pressure supply.
FSAE Dyno Test Facility Team 06112
9
Fig. 2.1.3. Power Absorption versus Rotor Speed (Kahn Dynamometer Instruction Manual)
FSAE Dyno Test Facility Team 06112
10
2.2 Data Acquisition System Strawberry Tree data acquisition system specifications:
• 8 differential analog inputs • 12 digital I/O lines • 1 counter/timer • Sample rate up to 10 kHz • Selectable resolution from 9 to 12 bits • 6 software selectable voltage ranges • Thermocouple inputs, cold junction compensation and linearization • Signal conditioning for RTD’s • 50V over-voltage protection • High level functions driver useable from BASIC, Pascal, C, Fortran, assembly,
and ASYST
2.3 Engine Management System The Honda CBR600 fitted to the dynamometer is retrofitted from the standard carburetor induction to multi-port fuel injection system. The controller used to manage the fuel injection as well as ignition is the Autronic SMC engine management system. The system provides sequential operation of eight fuel injector outputs and four low current ignition outputs. The system uses inputs from manifold absolute pressure, engine coolant temperature, manifold air pressure and throttle position to determine the correct amount of fuel to allow into each intake port. Fuel and ignition tables are user defined at 32 available engine speeds as well as 16 available load sites, yielding 512 tunable parameter locations.
2.4 Areas of Concern
The current engine dynamometer limits the ability of the RIT Formula SAE Racing Team to conduct useful engine development. Due to its difficulty in operation and unreliability, the Department of Mechanical Engineering has not shown interest in integrating this equipment into the Thermal Fluids curriculum. Specific concerns are discussed below:
2.4.1 Absorber Concerns:
• Difficulty in controlling absorber The water brake absorber is currently controlled by manual inlet and outlet valves as explained in the overview. A great deal of experience is necessary to know where to place both valves for desired power dissipation.
• Difficulty in maintaining steady state test conditions When operating the dynamometer manually, it is extremely difficult to maintain a desired engine speed at a particular load especially at a partial throttle, minimal load situation. The time available to maintain this position is also limited by the water storage tank.
• Environmental and Facility Concerns
FSAE Dyno Test Facility Team 06112
11
The current setup requires a large amount of water to be pumped into the absorber and pumped out by the rotor into the facility’s drainage system. The water supply entering the storage tank is flowing at the maximum rate during full load testing, trying to replenish the storage tank supply. Leaks are common in the current system as the equipment is exceeding the age of 20 years.
2.4.2 Data Acquisition Concerns:
• Parameters not logged: o Cylinder Pressure o Oil Pressure o Fuel Pressure o Intake Air Temperature o Coolant Temperature o Oil Temperature o Crankshaft Position & Speed
• Low sample rates limits measurement capabilities • Windows support for software becoming obsolete • Limited resolution, 12 bit maximum • Not upgradeable or expandable • Faculty not familiar with this equipment • Technology is 15 years old
2.4.3 Engine Testing and Tuning Concerns: • Engine and Test Cell Cooling • Engine Controller Options
o Limited support in the USA o Parts and accessories are hard to procure and expensive o Limited input/output flexibility o No 0-5V input for wide band O2 signal o No Autotune feature currently installed o Less-intuitive software with little documentation
3. Needs Assessment/Concept Development
The dynamometer project required a significant amount of concept development due to the fact that the system is comprised of several subsystems that interact with one another. From the initial needs assessment, the development was broken up into the multiple categories including dynamometer type, data acquisition, engine mechanicals, engine management, power transmission, and dynamometer interface. Several brainstorming exercises including the entire team were conducted to develop design options for each subsystem and determine the most suitable solution for each problem. Figure 3.1 displays our completed House of Quality.

FSAE Dyno Test Facility Team 06112
12
Figure 3.1 House of Quality Diagram (QFD)
FSAE Dyno Test Facility Team 06112
13
3.1 Dynamometer Absorber Since the initial problem to be solved was creating a reliable engine dynamometer, the
team was not limited to the type of power absorber to use for the project. After discussing all of the options, two major concepts were left for more detailed scrutinizing.
3.1.1 Concept I: Re-Instrument the current water brake dynamometer
One relatively inexpensive and simple option that was considered was to improve the existing water brake dynamometer in the machine shop. In order to implement this solution we would have had to re-instrument the entire system. The problem is this doesn’t address many of the problems with the current system and the benefits of using new technology for instrumentation would not have been seen because the rest of the system is very outdated. Even with new instrumentation the system would still be difficult to control, would waste water, would not address problems of overheating, and still would not be able to maintain steady state. Overall, re-instrumentation would only address one of the many problems with the current system and this is simply unacceptable. Therefore, we came to the conclusion that in order to meet the requirements of the FSAE team and the mechanical engineering department that we would have to design an entirely new system with new components.
3.1.2 Concept II: DC Motor
After determining we would design a new system we considered the various methods of braking the internal combustion engine. Our options were DC motor, AC motor, Eddy Current, and water brake. We chose to use a DC motor partly because the Dyne systems controller is already owned by RIT and it is compatible only with a DC motor. The controller is a very expensive piece of equipment that we could not afford to replace, but we still discussed the other options of braking the engine to confirm we were making the right decision. A new water brake system would be cheap, but like the current one it would still be difficult to control and require a high amount of maintenance. The next option of an Eddy Current dynamometer would offer low maintenance and precise control, but it has high inertia and would be more costly than the water brake. Its benefits in relation to a water brake are impressive, but not better than the next two options. An AC motor has a number of benefits including its ability to motor and absorb, a very fast response, very low inertia, and it is line-generative meaning that it actually generates electricity. In fact, most modern-day dynamometers use AC motors now and are widely accepted in industry. Because they are more common, many companies manufacture them, but they are still quite expensive. DC motors also can motor and absorb, have fast response, and are line-generative also. Unfortunately, they have a high inertia and cost even more than AC motors. After Siemens offered to donate a DC motor, cost was not an issue and therefore it became the best option for our situation. It works with our current controller, has as many benefits as the AC
FSAE Dyno Test Facility Team 06112
14
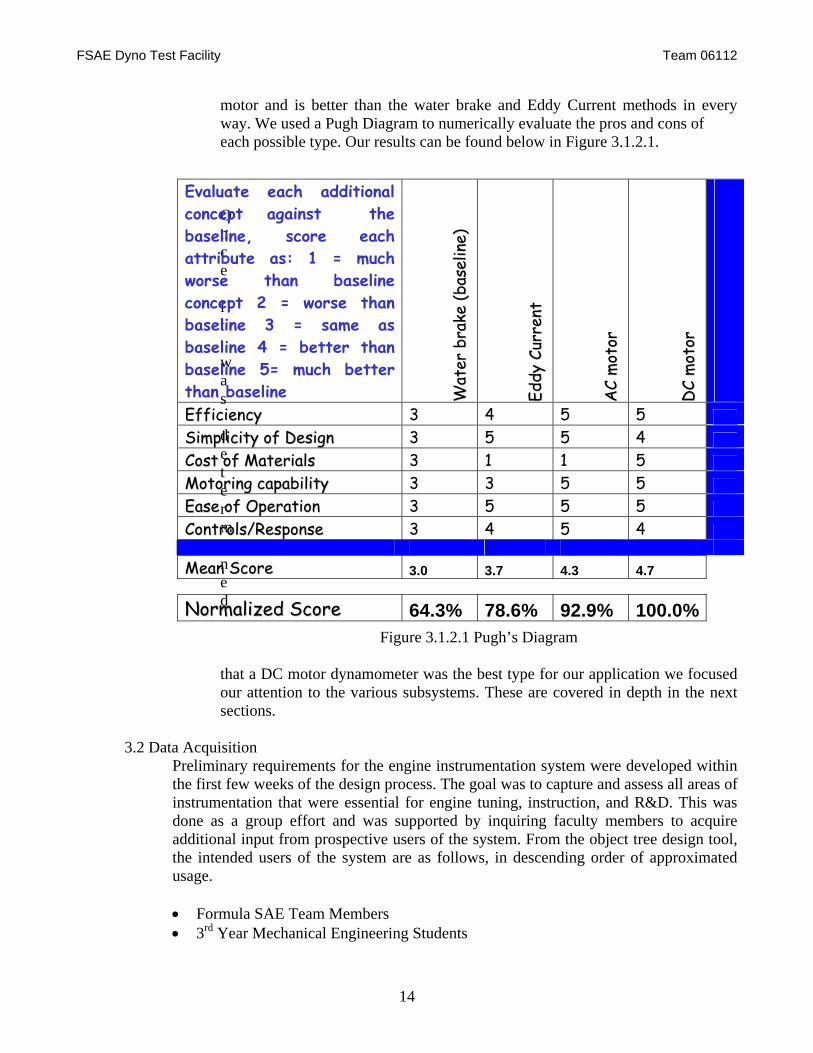
motor and is better than the water brake and Eddy Current methods in every way. We used a Pugh Diagram to numerically evaluate the pros and cons of each possible type. Our results can be found below in Figure 3.1.2.1.
Once it was determined
Figure 3.1.2.1 Pugh’s Diagram that a DC motor dynamometer was the best type for our application we focused our attention to the various subsystems. These are covered in depth in the next sections.
3.2 Data Acquisition
Preliminary requirements for the engine instrumentation system were developed within the first few weeks of the design process. The goal was to capture and assess all areas of instrumentation that were essential for engine tuning, instruction, and R&D. This was done as a group effort and was supported by inquiring faculty members to acquire additional input from prospective users of the system. From the object tree design tool, the intended users of the system are as follows, in descending order of approximated usage. • Formula SAE Team Members • 3rd Year Mechanical Engineering Students
Evaluate each additional concept against the baseline, score each attribute as: 1 = much worse than baseline concept 2 = worse than baseline 3 = same as baseline 4 = better than baseline 5= much better than baseline WW
aa ttee rr
bbrr aa
kk ee (( bb
aa ssee ll
ii nnee ))
EE dddd yy
CCuu rr
rr eenn tt
AACC
mmoo tt
oo rr
DDCC
mmoo tt
oo rr
EEffffiicciieennccyy 3 4 5 5 SSiimmpplliicciittyy ooff DDeessiiggnn 3 5 5 4 CCoosstt ooff MMaatteerriiaallss 3 1 1 5 MMoottoorriinngg ccaappaabbiilliittyy 3 3 5 5 EEaassee ooff OOppeerraattiioonn 3 5 5 5 CCoonnttrroollss//RReessppoonnssee 3 4 5 4 MMeeaann SSccoorree 3.0 3.7 4.3 4.7
NNoorrmmaalliizzeedd SSccoorree 64.3% 78.6% 92.9% 100.0%
FSAE Dyno Test Facility Team 06112
15
• Faculty from the Mechanical Engineering Department Knowing that the dynamometer will be an essential tool for the RIT Formula SAE Racing Team for engine tuning, troubleshooting and mapping, the team was solicited for input regarding the fundamentals requirements of this system. Additional requirements were suggested since every member of the team in the mechanical engineering discipline knows the downfalls of the current dynamometer system used for instruction in the thermo-fluids labs. Thus a key requirement was to not only pick up where the old system left off, but to completely surpass it and provide the department with a highly professional and modern system with capabilities for future expansion. Again, input from faculty members such as William Scarborough and John Wellin helped the team focus on the fundamental requirements while keeping the design versatile enough for specialized departmental research. With all this in mind, the engine parameters that will be monitored by the data acquisition system are as follows:
• Fuel Pressure • Fuel Flow • Exhaust Gas Temperature • Exhaust Pressure (Port) • Exhaust Pressure (Header Collector) • Exhaust Flow/Velocity • Intake Air Temperature • Intake Air Pressure (Port) • Intake Air Pressure (Manifold) • Intake Air Flow/Velocity • Cylinder Head Temperature • Combustion Chamber Temperature • Combustion Pressure • Oil Temperature • Oil Pressure • Engine Block Coolant Temperature • Radiator Inlet Coolant Temperature • Radiator Outlet Coolant Temperature • Radiator Inlet Air Temperature • Radiator Outlet Air Temperature • Crankshaft Position and Speed • Camshaft Position
Cylinder pressure is perhaps one the most important measurements that one could acquire from an internal combustion engine in the laboratory. Cylinder pressure is what does work on the piston of a reciprocating combustion engine. Therefore, how this pressure acts over the changing volume of the combustion chamber will inherently determine the output of the engine. For the engine tuner, this provides the best indication of whether or not the engine has been optimized other than torque and horsepower curves. Having data from each cylinder provides the means to determine
FSAE Dyno Test Facility Team 06112
16
whether or not each individual cylinder has been tuned properly, while also providing an indispensable diagnostic tool if such is needed. In addition, these sensors can be used specifically for intake manifold design by comparing the maximum intake pressure to the manifold pressure. This allows the tuner to quantify the inertial ram air effect of the manifold and optimize accordingly. Another advantage is being able to determine dynamic compression ratios when using different cam profiles. For educational purposes, this data is very useful for instruction in areas such as thermodynamics where cylinder pressure as a function of volume is used to describe the ideal performance of an engine. Theoretical models of the Otto cycle can be compared to hard data from an engine to reinforce the theory and expose possible limitations brought about by underlying assumptions. With this in mind, it is one of the foremost objectives of the instrumentation system to provide accurate, repeatable data, which correlates to cylinder pressure throughout the cycle. Temperature measurements are also a fundamental part of engine testing and they must be used to monitor critical parameters that are vital for proper engine operation. Measurements such as coolant temperature and oil temperature need to be measured to ensure that the engine does not overheat and become damaged. In addition, exhaust gas temperature and intake air temperature are used for engine tuning and thermodynamic analysis. Overall, it would be hard to picture a test engine that was not instrumented for fundamental temperature readings. Pressure measurements on the dynamometer are not limited to those of combustion pressure. Fuel and oil pressure measurements are also important parameters that must be accounted for in data acquisition system. Accurately monitoring fuel pressure is essential for engine tuning because fuel pressure is taken to be a constant by engine management system. Fuel mapping must rely on the tuner properly setting the fuel pressure and adjusting the fuel trim at each RPM and load accordingly. This will be an automated task on the new dynamometer; therefore this pressure must read into the computer and be recorded for each new fuel map. This measurement can also be used to estimate fuel consumption with data from the engine controller on injector pulse timing.
Oil pressure is vital for engine survival and due to the rigorous testing an engine will undergo on the dynamometer. Therefore, this parameter must be monitored. Monitoring oil pressure is more of a safety and reliability concern with regards to the engine, as opposed to a tuning device. Nonetheless, it is an essential measurement. The load cell is required by Dyne Systems dynamometer controller for current output to the DC motor. The load cell coupled to a torque arm provides a measurement of applied motor torque, which is also needed along with speed input for the controller to calculate horsepower. The fundamental requirement of the dynamometer is to measure torque and speed to calculate horsepower, therefore the load cell is essential and quite possibly the most essential part of the design. It was decided that the dynamometer would have an automated fuel mapping option for FSAE to setup the fuel injection system for the race vehicle. In order to do this, engine

FSAE Dyno Test Facility Team 06112
17
load, which is directly proportional to manifold pressure, must be accurately monitored. The fuel injection system implements a MAP sensor for airflow calculations to run the engine but it was decided that a separate sensor should be used for this specialized task. As such, the dynamometer will feature its own separate MAP sensor specifically for fuel mapping. Measurement of airflow into the engine is an essential measurement for engine tuning. This can be used to determine the volumetric efficiency of the engine at any particular RPM. Volumetric efficiency is defined as the following.
RPMengineNengineofvolumesweptV
anemometerofareationalcrossAanemometerfromvelocitymeasuredV
whereV
AV
s
Ns
v
==
−==
××
≡
sec
120
η
This in return can be used to tune intake manifolds for a particular performance at or with a specific speed range of the engine. In addition to the parameters listed above, the Dyne systems dynamometer controller that will be used requires the following inputs:
• DC Motor Torque • DC Motor Speed
These two sensors fall into a special category in that they are not part of the instrumentation system but rather fundamental requirements for the dynamometer and DC motor control. DC motor speed is monitored using a Hall Effect sensor specific to the dynamometer controller and is independent of the measurement of crank speed as listed previously. Motor torque will be measured using a load cell and torque arm of known length. This can be done because the DC motor that the design will implement will be trunnion-mounted and therefore free to rotate about its shaft if not constrained, similar to the previous water-brake absorber. Likewise, the load cell will be used to constrain the motor from rotation and measure the load required to constrain the motor. This load is related to the torque induced by the distance from the center of rotation. This torque value will be used to control current to the motor and along with shaft speed will provide means for horsepower calculation.
3.3 Engine Mechanicals
This group is comprised of all systems relating to the engine including cooling, fuel, and exhaust. For the cooling system, development work was done to design a system that will both cool the engine properly and cool the room that the dynamometer will be
FSAE Dyno Test Facility Team 06112
18
stationed in. This addresses one of the major problems with the current system. The water brake dynamometer used by the Formula SAE team right now cannot properly cool the engine after several sessions of testing and the room becomes too hot. It uses a automotive type radiator, but it is very old and beginning to show is age. To solve these problems we first considered a new radiator or heat exchanger to cool the engine. In order to design a system to correctly dissipate heat we ran a test using the current water brake dynamometer. We connected the dynamometer to a water-cooled heat exchanger to control the water temperature flowing back into the engine. After a few slight modifications to the current system the water temperature flowing back into the engine was 20° cooler than when it entered the heat exchanger. After a few more tests it was determined that a difference of 20°F would be sufficient to properly cool the engine for continuous dynamometer runs without introducing a thermal shock to the engine parts or overheating. We determined a radiator was best to handle this job. A heat exchanger would require too much maintenance and a slower heat transfer rate. The radiator that was selected to handle this task for the project is made by Ready-Rad (Part # 431390) This radiator is typically installed in the Ford F-Series truck with the 7.3L turbo Diesel. The reason that the radiator is so oversized is to provide the proper cooling for the engine. During the dynamometer tests, an excessive amount of heat is generated and transferred into the cooling water. A comparable situation would be holding the throttle wide open on your car for a few minutes. In order to provide the proper amount of reserve cooling for extensive runs, the largest radiator within our budget of $300.00 was selected. A supplement to this radiator is a large fan that will move air past it to transfer heat from the water to the air. Once we determined a 20 degree F difference was sufficient we calculated that the airflow past the radiator needed to be at least 1689CFM. The fan that will be mounted to the radiator to simulate a motor driven fan is a 230V two-speed wall exhaust fan. At low speed the fan will provide 1500CFM and at high speed it will provide 3800CFM. We intend to only use high speed when the temperature delta between inlet to the radiator and outlet falls below a threshold of 18 degrees F. We have proven that this will provide adequate cooling for the engine during all testing procedures and at all RPM ranges.
FSAE Dyno Test Facility Team 06112
19
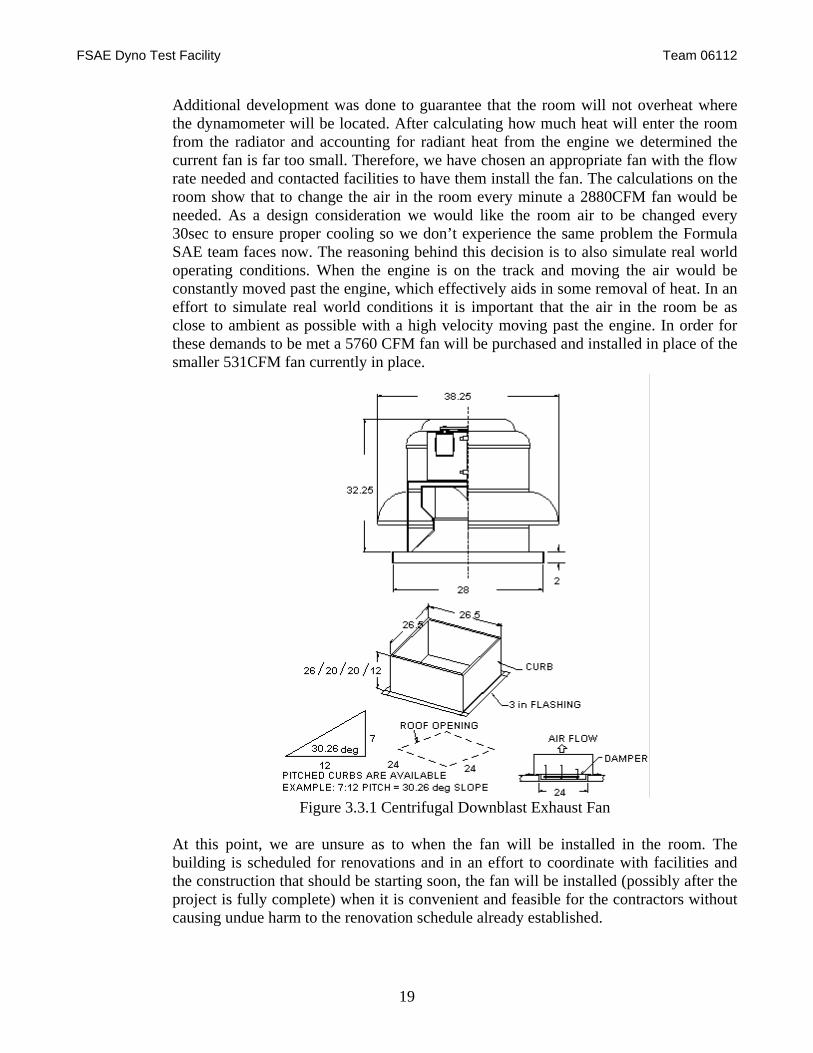
Additional development was done to guarantee that the room will not overheat where the dynamometer will be located. After calculating how much heat will enter the room from the radiator and accounting for radiant heat from the engine we determined the current fan is far too small. Therefore, we have chosen an appropriate fan with the flow rate needed and contacted facilities to have them install the fan. The calculations on the room show that to change the air in the room every minute a 2880CFM fan would be needed. As a design consideration we would like the room air to be changed every 30sec to ensure proper cooling so we don’t experience the same problem the Formula SAE team faces now. The reasoning behind this decision is to also simulate real world operating conditions. When the engine is on the track and moving the air would be constantly moved past the engine, which effectively aids in some removal of heat. In an effort to simulate real world conditions it is important that the air in the room be as close to ambient as possible with a high velocity moving past the engine. In order for these demands to be met a 5760 CFM fan will be purchased and installed in place of the smaller 531CFM fan currently in place.
Figure 3.3.1 Centrifugal Downblast Exhaust Fan
At this point, we are unsure as to when the fan will be installed in the room. The building is scheduled for renovations and in an effort to coordinate with facilities and the construction that should be starting soon, the fan will be installed (possibly after the project is fully complete) when it is convenient and feasible for the contractors without causing undue harm to the renovation schedule already established.

FSAE Dyno Test Facility Team 06112
20
For the fuel system very little concept development was required. A simple system that includes a fuel tank, fuel pump, fuel filter, and pressure regulator is all that is required for the engine. We did consider two types of systems, with the difference being whether or not there is a return line to the fuel tank. One system would have fuel leave the tank and enter the engine, but would have no return line. All fuel that passed through the fuel pump would enter the injectors. We chose to use the second type of system where any unused fuel can pass through the fuel rail back to the fuel tank. This system is the best choice for our application because it provides for constant cooling of the fuel pump due to the high flow rate of fuel through the system. For the exhaust system there was only a slight amount of concept development. The vacuum device used to remove exhaust gases from the engine is already owned by RIT and was what we focused our design around. From previous experience, the Formula SAE team notified the group that in previous testing the vacuum device was connected directly to the engine resulting in changing engine performance. Therefore, we used this information to design a nozzle type system in which the removal of exhaust will not affect engine performance. In addition, since the engine may be run during the day it can be very loud and distracting to everyone in the college of engineering. Therefore, we have decided to use a muffler to reduce noise during testing combined with the explosion safe room to ensure quiet operation.
3.4 Engine Management The Honda CBR 600 motorcycle engine was originally designed with four constant velocity carburetors for fuel management; one carburetor for each cylinder. The RIT Formula SAE Racing Team has modified the engine to use a computer controlled fuel injection system for many years. Through the years the system has changed along with advances in fuel injection technology. The use of a fuel injection system over a carburetor has many advantages in the areas of tuning, performance, economy, and reliability. Integrating ignition control into the engine management system helps make the system even more flexible, allowing the engineer to coordinate ignition timing changes with fuel settings to further optimize the engine control system. Several options in engine management systems were considered including upgrading the current Autronic SMC engine controller and purchasing a new engine controller. The new ECU choices were narrowed down to the list below:
• Autronic SM4 • MoTeC M400 • Bosch MS 3.4
Selection criterion for each controller includes basic comparisons of specifications between the ECU’s. All engine controllers in question fulfill all of the general requirements necessary to operate the fuel and ignition system of the engine, which is explained more in-depth in the design section. Other criterion used to decide on an ECU originates from the general list of areas for concern on the current dynamometer. After prioritizing these needs, the following list was created:
FSAE Dyno Test Facility Team 06112
21
• Closed-loop autotune feature for fuel mapping • Simple, user-friendly software interface • Customer support basis, dealer network • Wide-Band O2 sensor compatibility • Software-configurable inputs/outputs for flexibility
After weighing all needs and options, the decision was made to implement the MoTeC M400 to the engine. The ECU has integrated support for a wide-band O2 sensor as well as a very strong network of dealers and technical representatives to help new users in the future.
3.5 Power Transmission
The frame must be constructed to rigidly mount all of the components of the dynamometer including the DC motor, the Honda CBR600 engine, the exhaust, and possibly the fuel delivery and cooling systems. There must be minimal deflection of the frame under full loading of the Honda CBR600 engine and motor.
The motor and the Honda CBR600 engine must be coupled in order for the torque to be transmitted from one to the other. In addition to the coupling of the two, there must be a speed reduction as the maximum speed of the motor is slower than the maximum output speed of the Honda CBR600 engine. This coupling and reduction can be accomplished by using either a gear drive, belt drive or chain drive.
A desired feature of the dynamometer is the ability test various engines of approximately the same horsepower output for future engine development by RIT Formula SAE. In order to achieve this outcome an engine cradle could be used that bolts directly onto the dynamometer’s frame.
There are two methods of mounting the DC motor to the dynamometer’s frame. It can either be directly mounted by its base to the frame rails or it can be trunnion mounted on its axis by bearings. If the DC motor were to be directly mounted by its base, an in line torque coupling would be needed to measure the torque being absorbed by the DC motor. If trunnion mounted, a lever arm from the case of the DC motor to the frame with a load cell between them would be used to determine the absorbed torque.
3.6 Dynamometer Interface (GUI)
This is a mockup of the proposed LabVIEW front control panel GUI for manual mode. The front panels for the other modes will be very similar, with small changes to the log data, engage clutch, and set point entry controls. Given the versatility of the LabVIEW environment and the large number of sensors that we plan to use, there is virtually no limit to the different ways the front panel can be configured. The purpose of the program is to run the system and acquire data, and actual analysis will be performed later using the data files created by the program. Given this intended use for the GUI, it was decided to keep the control panel as simple as possible. This will avoid confusion on the part of the user and will allow for quick reading of the information necessary to
FSAE Dyno Test Facility Team 06112
22
ensure that the test is run safely and without damage to the system. It was decided that the most crucial instrumentation data for the control panel was the speed of the engine and dyno, horsepower, torque, coolant and oil temperature, fuel and oil pressure, alternator voltage, indicators to tell if the clutch speed is matched and if the clutch is engaged, and a low oil pressure warning light. We also considered using the DC motor to start the engine, instead of using the engine starter, and leaving the clutch permanently engaged. An emergency stop button was also included in case the user needs to perform a very fast shutdown of the system. The set point controls will allow the user to control the throttle set point through either a numerical entry on the control panel or an actual physical control. The set point controls also allow the user to control the RPM or torque set points for the DYN-LOC. In the automatic dyno run mode, the control panel will allow the user to specify the initial and final RPM set points and the rate of change of the dyno speed while going from the initial to the final RPM.
Given the versatility of the LabVIEW environment and the fact that information from all sensors will be read regardless of which sensors have a display on the front panel, changes to the control panel to add or remove instrumentation are so simple that the biggest concern with adding more instrumentation is arranging the new indicators in a way that is orderly and easy to understand.
4. Feasibility Assessment
Again, because of the size of our project we divided our assessment into the various subsystems. In considering the feasibility of our designs we referred to our object tree for analysis. Ease of operation, serviceability, environment, safety, performance, and cost were all considered before deciding on components for the design. 4.1 DC Motor The most important component of our design, the DC motor, was chosen over all other types because of our current components. The dynamometer controller that we are already in possession of only works with a DC motor, along with the main power supply component the SIEI DC Drive, therefore, this was the deciding factor in dynamometer type selection. The cost to purchase a new controller would far exceed our budget so we had no choice, but to use a DC motor. A DC motor is the most feasible of other types even when considering performance and ease of operation. The only consideration that would have made a DC motor not feasible is the cost. They are far more expensive than AC motors, but we knew this would not be a problem because we could purchase one used as a worst case and we were quite optimistic that we would have a motor donated. Another consideration is made relating to feasibility as to when we will be able to purchase a component. All other components are readily available and are easy to obtain. However, the DC motor being built by Siemens will take a maximum of 60 days from the order date to arrive in the Formula SAE shop. Any other new motor would have taken a similar amount of time to arrive, but this is still feasible because we have all the technical specifications of the motor to continue with our design. We will take delivery of the motor at least a month before the final design needs to be complete and this gives the team enough time
FSAE Dyno Test Facility Team 06112
23
to build and test. Therefore, we are not constrained by this at all. By purchasing a used motor we would have been able to take delivery much sooner, but we would not gain much in the process. 4.2 Data Acquisition For data acquisition hardware requirements the team was forced to rely on the mechanical engineering department and their equipment due to economic concerns in this area. Because the ME department has educational support from National Instruments, solutions for this company proved to be the most feasible. In regards to how the actual data was to be acquired, decisions had to be made as to what sensors were going to be implemented in the final system. Questions were posed in areas of technology, economics, performance, reliability, and time management. By assessing each of these on a weighted basis, the team was able to decide what sensors would provide the best instrumentation package in the final design. The assessment was carried about by assigning a numeric value from 1 to 5 for each question; a 1 would always represent the least desirable outcome while 5 would represent the best outcome. The following questions were used for assessment: Technology Questions
1. Does the team posses the skills necessary to implement this technology?
2. Does the team have the resources (i.e. software, hardware, etc.) necessary to implement
this technology?
3. Is this technology which is readily available for implementation?
4. Does this technology complement the tuning of the engine?
5. Does this technology complement laboratory instruction?
6. Does this technology complement research and development by the department?
7. Will this technology become quickly outdated?
Economics Questions
1. Does the team’s budget allow for purchasing of this sensor?
2. Will this sensor require purchasing further equipment (i.e. signal conditioning)?
Performance Questions
1. Will this sensor be of any detriment to the engines performance?
2. Will this sensor aid in improving the engine’s performance?

FSAE Dyno Test Facility Team 06112
24
3. Will this sensor provide reasonably accurate data?
4. Will this sensor provide redundant data?
Reliability Questions
1. Will this sensor hold up to the rigors of engine testing?
2. Is periodic maintenance or recalibration necessary?
3. In the event of failure, is replacement an issue?
4. Is this sensor monitoring parameters critical to engine life?
Time Management Questions
1. Can the sensor be implemented, calibrated, and tested within the time allowed?
2. Does the sensor require additional programming requirements for the GUI?
Table 4.2.1 Sensor Feasibility Chart
Sensor TQ1 TQ2 TQ3 TQ4 TQ5 TQ6 TQ7 EQ1 EQ2 PQ1 PQ2 PQ3 PQ4 RQ1 RQ2 RQ3 RQ4 TMQ1 TMQ2 Score
Fuel Pressure 5 5 5 4 3 5 4 5 1 5 2 4 5 4 5 5 1 5 5 78
Fuel Flow 5 4 5 4 3 5 5 1 1 3 1 3 2 5 5 1 1 3 1 58 Exhaust Gas Temperature 5 5 5 5 5 5 5 5 5 5 5 3 5 5 4 5 1 5 5 88 Exhaust Pressure (Port) 5 5 5 3 5 5 4 1 1 5 3 4 1 4 5 5 1 3 1 66 Exhaust Pressure (Header Collector) 5 5 5 3 1 5 4 1 1 5 3 4 1 4 5 5 1 3 1 62 Exhaust Flow/Velocity 5 4 5 5 1 5 3 1 1 4 5 4 5 3 5 3 1 3 1 64 Intake Air Temperature 5 5 5 5 5 5 5 5 5 5 5 3 5 5 4 5 1 5 5 88 Intake Air Pressure (Port) 5 5 5 3 1 5 4 1 5 5 5 4 1 5 5 5 1 3 1 69 Intake Air Pressure (Manifold) 5 5 5 5 5 5 4 5 5 5 5 4 5 5 5 5 1 5 1 85 Intake Air Flow/Velocity 5 4 5 5 5 5 3 5 5 4 5 4 5 4 5 3 1 4 5 82 Cylinder Head Temperature 5 5 5 4 5 5 5 1 5 5 4 3 1 4 4 5 1 5 1 73 Combustion Chamber Temperature 2 5 5 4 5 5 5 1 5 5 4 3 5 4 4 5 1 5 1 74 Combustion Pressure 5 5 5 5 5 5 2 5 5 5 5 4 5 3 5 3 3 5 5 85
Oil Temperature 5 5 5 1 1 5 5 5 5 5 1 3 5 5 4 5 4 5 5 79
Oil Pressure 5 5 5 1 1 5 5 5 1 5 1 4 5 4 5 5 5 4 5 76 Engine Block Coolant Temperature 5 5 5 1 5 5 5 5 5 5 1 3 1 5 4 5 5 5 1 76 Radiator Inlet Coolant Temperature 5 5 5 1 5 5 5 5 5 5 1 3 5 5 4 5 5 5 5 84

FSAE Dyno Test Facility Team 06112
25
Radiator Outlet Coolant Temperature 5 5 5 1 5 5 5 5 5 5 1 3 5 5 4 5 5 5 5 84 Radiator Inlet Air Temperature 5 5 5 1 5 5 5 5 5 5 1 3 5 5 4 5 5 5 5 84 Radiator Outlet Air Temperature 5 5 5 1 5 5 5 5 5 5 1 3 5 5 4 5 5 5 5 84 Crankshaft Position and Speed 5 4 5 5 5 5 4 5 5 5 1 5 5 5 5 5 4 5 5 88
Camshaft Position 5 4 5 5 1 5 4 2 1 5 4 5 1 5 5 5 1 5 1 69
Air Fuel Ratio 5 5 5 5 5 5 3 5 5 5 5 4 5 5 5 5 5 5 5 92
4.3 Engine Mechanicals This group consists of the exhaust, fuel, and coolant systems. For exhaust, there was really only one option. There is a Plymovent in the test cell and there would be no reason to replace it so we decided to incorporate that into our design. We could attach it to the engine directly or design ducting to connect it. We decided from a performance perspective that attaching the Plymovent directly to the engine would change the performance characteristics of the engine so this was definitely not an option. We then considered including a nozzle to eliminate this problem. It is an affordable solution that is more feasible than any other option considered. For fuel, we have a fuel tank but needed to design the system to feed fuel to the engine. There is only one way to make this work and that is to use a fuel pump and pressure regulator. The only components that need to be purchased are the pressure regulator and fuel lines, which are relatively inexpensive. The other components are already in possession of the Formula SAE team or can be acquired at a discounted price so again this is the most feasible system and really is the only option. For the coolant system, we had two options for cooling the engine. A radiator or heat exchanger were our two possibilities. The radiator works better to transfer heat so its performance is important and is quite affordable. It also is very low maintenance so it meets our goals and is the best option. As for cooling the room, we determined that the air would have to be moved to outside the building. A fan in the ceiling is the only option and is feasible. The only consideration is that it may not be installed immediately with the renovations that are about to occur, but we have no choice in the matter.
4.5 Power Transmission Motor Mounting Options 1. Direct Mounting
Advantages: • Simple to construct • Less complicated
FSAE Dyno Test Facility Team 06112
26
• Less shaft fatigue • Very accurate • Double ended motor not necessary
Disadvantages: • Expensive in-line torque transducer
2. Trunnion Mounting Advantages:
• Inexpensive load cell used Disadvantages:
• More complex mounting • Dual shafted motor necessary • More components to produce/purchase
A gearbox connecting the Honda CBR600 engine to the DC motor would be very expensive and would require much design effort. It would also not be very conducive in the attempt to make the dynamometer adaptable to various engines. The two remaining methods of power transfer are belt and chain. Between the belt and the chain the belt is much cleaner, transmits power more smoothly, and absorbs resulting from the power strokes of the engine’s cycle better than a chain can. The chain has the ability to transmit more torque than a belt.
4.6 Dynamometer Interface (GUI)
The LabVIEW environment makes displaying acquired data relatively easy. The area in which we are most limited is the number of digital I/O lines available on our National Instruments DAQ card. The PCI-6034E card has 8 digital I/O lines. Some of these lines will be dedicated to controlling the SCXI chassis for communication with the accelerometer, thermocouple, and analog input devices. The other lines may be used for some combination of controls for starting the engine, controlling the clutch, and controlling the throttle.
It was decided that the engine must be capable of being run independently of the dyno system for maintenance and setup operations. This would require separate physical engine and clutch controls, to be connected in parallel with the LabVIEW controls, adding complexity to the system. Compromises were reached on the engine start, throttle, and clutch systems.
It was decided to operate the clutch with a single acting, spring loaded pneumatic cylinder that will be configured to hold the clutch disengaged unless supplied with shop air pressure. A solenoid controlled valve controlling the pressure to the cylinder can be controlled with a relay and a single digital output from the DAQ card. This system will let the engine spin freely of the dyno unless the LabVIEW program explicitly engages the clutch. There is no reason to have the clutch engaged unless the dyno is in use.
The LabVIEW program will have no control over starting the engine; this will be accomplished by a separate physical switch and the normal starter. It is necessary to leave the engine starter motor physically attached anyway, as the motor plugs a hole which would otherwise allow oil
FSAE Dyno Test Facility Team 06112
27
to leak. This will allow the engine to be started with no involvement from LabVIEW and will not consume any digital I/O lines.
The throttle will have dual controls. LabVIEW will control a servo or stepper motor to actuate the throttle linkage. A physical lever will be connected to this linkage and also be able to move the throttle. For a stepper motor, two digital I/O lines will be used to control an IC stepper motor controller, one line for directional control and one to provide the step impulses to move the motor.
These three compromises allow full control over the engine without any input from LabVIEW, enabling non-dyno-related operation of the engine. The compromises require the engine to be manually started before the dyno is run, but otherwise allow full operation of the clutch and engine by the LabVIEW dyno interface.
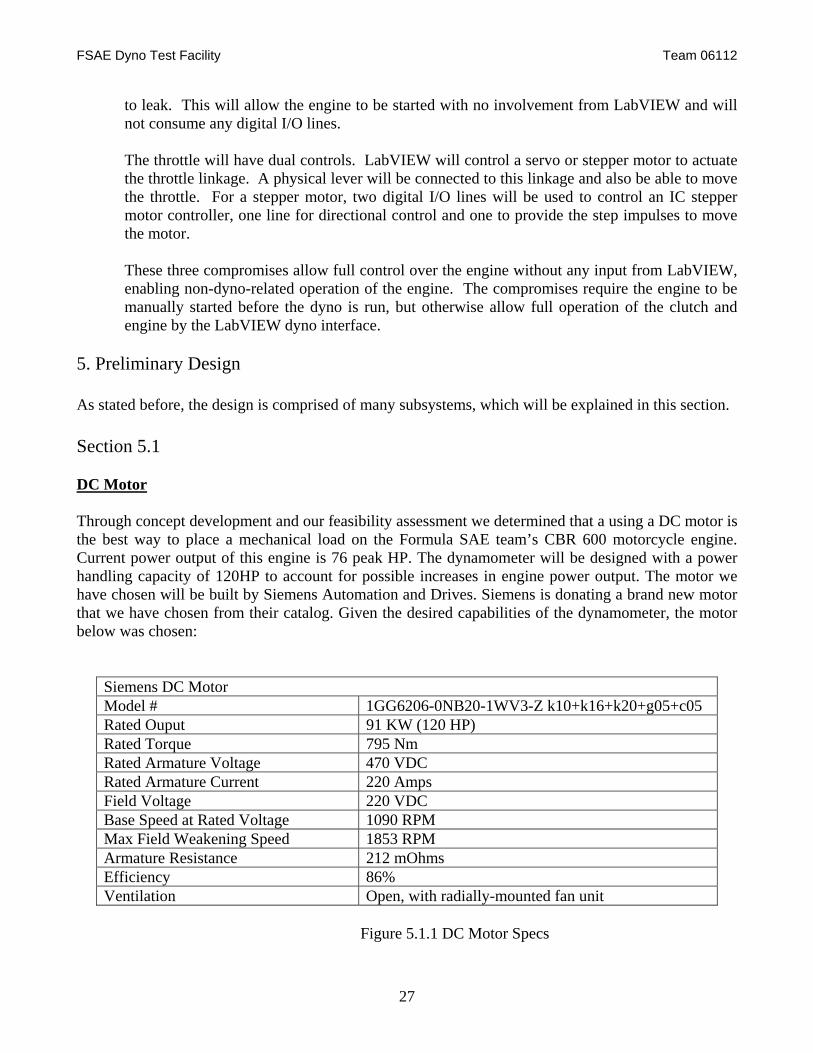
5. Preliminary Design As stated before, the design is comprised of many subsystems, which will be explained in this section. Section 5.1 DC Motor Through concept development and our feasibility assessment we determined that a using a DC motor is the best way to place a mechanical load on the Formula SAE team’s CBR 600 motorcycle engine. Current power output of this engine is 76 peak HP. The dynamometer will be designed with a power handling capacity of 120HP to account for possible increases in engine power output. The motor we have chosen will be built by Siemens Automation and Drives. Siemens is donating a brand new motor that we have chosen from their catalog. Given the desired capabilities of the dynamometer, the motor below was chosen:
Siemens DC Motor Model # 1GG6206-0NB20-1WV3-Z k10+k16+k20+g05+c05 Rated Ouput 91 KW (120 HP) Rated Torque 795 Nm Rated Armature Voltage 470 VDC Rated Armature Current 220 Amps Field Voltage 220 VDC Base Speed at Rated Voltage 1090 RPM Max Field Weakening Speed 1853 RPM Armature Resistance 212 mOhms Efficiency 86% Ventilation Open, with radially-mounted fan unit
Figure 5.1.1 DC Motor Specs
FSAE Dyno Test Facility Team 06112
28
The following options were added to the chosen motor: - K10 – Terminal box placed on left side of motor (when looking at drive end) - K16 – Second standard shaft end - K20 – Heavy duty bearing for high lateral loads - G05 – Fan mounted on non-drive end top, air intake from drive end - C05 – Increased field weakening speed to 1.7x base speed K10 and G05 were chosen to facilitate power cable routing and correct airflow. The motor must be trunnion mounted on two shafts to allow for the use of a load cell to measure torque on the motor and provide feedback to the Dyn-Loc controller. Trunnion mounted refers to mounting the motor at the drive shafts on each end allowing the motor case to be free. K16 and K20 were chosen to allow this mounting. C05 was chosen to facilitate a decrease in gear ratio from the motor ouput to the engine.
The following are the DC power components of the dynamometer: - Dyne Systems DYN-LOC IV Digital Dynamometer Controller - Olsun 3 Phase 460VAC Isolation Transformer - SIEI Typact TPD32-500/520-280-4B (DC Drive) - DC motor, 470VDC, 91kW, model 1GG6206ONB401WV3Z+K10+k16+K20+G05 - Various conduits/interconnects/disconnects
Motor control is managed by a Dyne Systems Dyn-Loc IV dynamometer controller. The Dyn-Loc controller provides closed loop digital control of RPM and torque. The controller manages dynamometer speed and loading while at the same time measuring engine power output based on voltage and current at the motor terminals. The Dyn-Loc controller directly communicates through serial RS-485 with the SIEI Typact TPD32 DC power amplifier (DC drive) to facilitate management of applied and absorbed power. See figure 5.1.2 for a graphic overview of the system’s data and power connections.

FSAE Dyno Test Facility Team 06112
29
Figure 5.1.2 Dynamometer Schematic
Dyn-Loc IV Dynamometer Controller
Figure 5.1.3 DynSystemsCo. Controller
The Dyn-Loc controller has the following capabilities: - Closed loop digital control of motor RPM and Torque. - RS485 communication with SIEI DC drive for monitoring and control of applied and absorbed power. - Constant RPM or constant torque motoring and loading of the engine using the DC motor.
FSAE Dyno Test Facility Team 06112
30
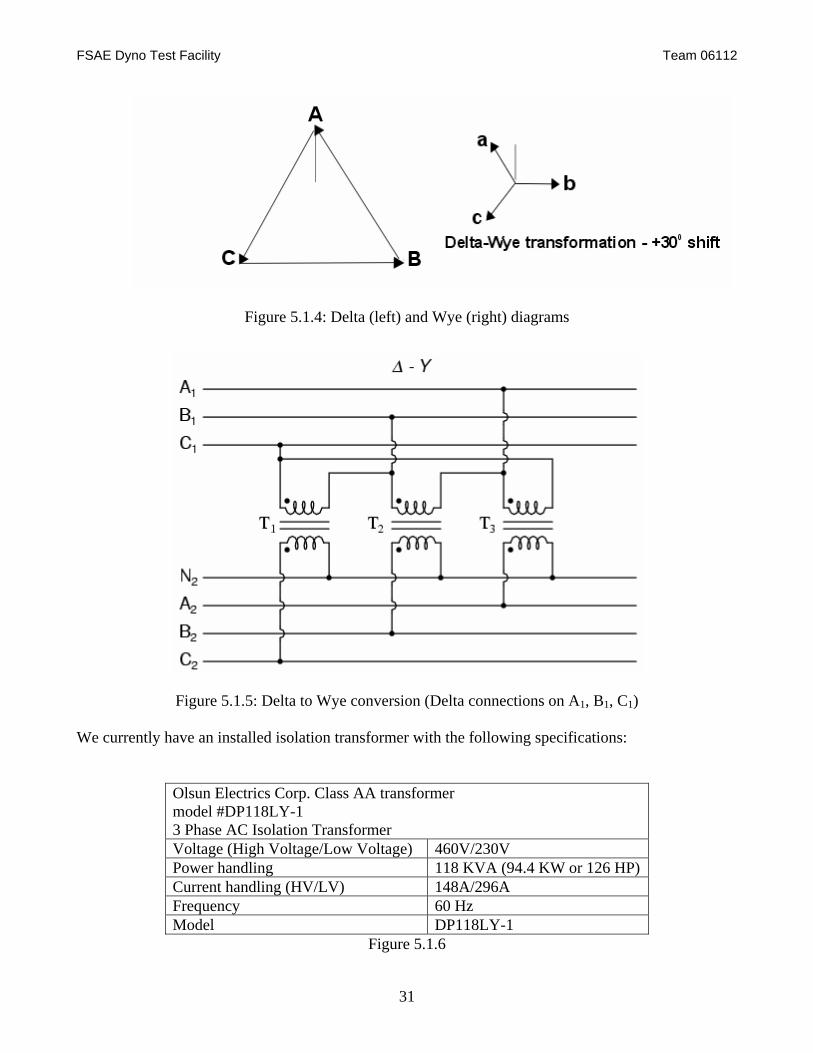
- Fixed rate of change of RPM or torque when motoring and loading. - Through computer control via RS232: extended RPM and torque ramp and variation functions. - Data Acquisition rates up to 200hz via special PAL frequency measurement methods. - 10hz display update rate averaging options to 8 seconds. - RS232 port baud rates up to 19200 baud. - 2 wire RS232 operation, no hardware handshake needed. - EEPROM setup storage (setup data is not lost when power removed). The Dyn-Loc IV controller controls the dynamometers basic functions. Through communication with the DC drive it operates at the most basic level in one of two modes: 1. The controller instructs the DC drive to apply regenerative braking (loading) to the engine with the DC motor. In this state the motor is acting as a generator and the DC drive is passing current into the power grid. The majority of the dynamometers operation will be in this mode. 2. The controller instructs the DC drive to apply voltage to the motor terminals (referred to as motoring). This will in turn cause the motor to spin. This mode is used for startup of the dynamometer and is unique to DC dynamometers. This allows the motor and engine to be started separately (with the clutch disengaged) and when the RPMs are matched, engaging the clutch with zero load and then applying load to the motor. In addition to the basic Dyn-Loc controller, the system also uses two additional Dyne Systems boards: The DS102B and DS256. The Dyne Systems DS102B current reference board provides a ±12V current reference to the controller based on the DC drive current power throughput. The Dyne Systems DS256 4SCR Current Regulator Board supplies the field circuit voltage. The Dyn-Loc controller uses closed loop feedback of RPM and torque to monitor and adjust the dynamometer performance. RPM feedback is through the use of a magnetic pickup of a 60 tooth gear attached directly to the DC motor output shaft. Torque feedback is through a load cell mounted between the dynamometer base and the motor case. This load cell will read effective torque applied by the motor or engine. Both signal wires are connected directly to the Dyn-Loc controller. 3 Phase AC Isolation Transformer A 3 phase 460VAC isolation transformer (delta to wye) is used between the DC drive and the RIT power grid. The transformer is required to eliminate DC current transfers between the SIEI DC drive and RIT’s power grid. The transformer also performs 3 phase AC delta to wye conversion as shown below in figures figures 5.1.4 and 5.1.5.
FSAE Dyno Test Facility Team 06112
31
Figure 5.1.4: Delta (left) and Wye (right) diagrams
Figure 5.1.5: Delta to Wye conversion (Delta connections on A1, B1, C1)
We currently have an installed isolation transformer with the following specifications:
Olsun Electrics Corp. Class AA transformer model #DP118LY-1 3 Phase AC Isolation Transformer Voltage (High Voltage/Low Voltage) 460V/230V Power handling 118 KVA (94.4 KW or 126 HP) Current handling (HV/LV) 148A/296A Frequency 60 Hz Model DP118LY-1
Figure 5.1.6
FSAE Dyno Test Facility Team 06112
32
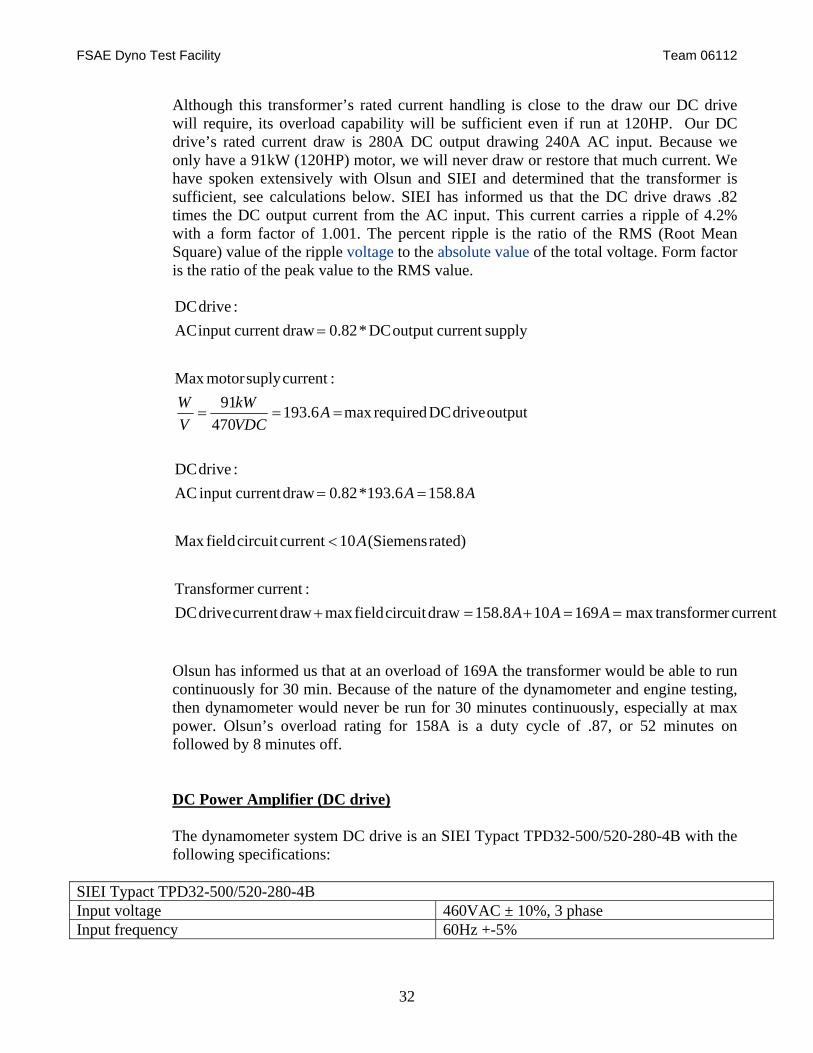
Although this transformer’s rated current handling is close to the draw our DC drive will require, its overload capability will be sufficient even if run at 120HP. Our DC drive’s rated current draw is 280A DC output drawing 240A AC input. Because we only have a 91kW (120HP) motor, we will never draw or restore that much current. We have spoken extensively with Olsun and SIEI and determined that the transformer is sufficient, see calculations below. SIEI has informed us that the DC drive draws .82 times the DC output current from the AC input. This current carries a ripple of 4.2% with a form factor of 1.001. The percent ripple is the ratio of the RMS (Root Mean Square) value of the ripple voltage to the absolute value of the total voltage. Form factor is the ratio of the peak value to the RMS value.
currentrtransformemax169108.158drawcircuitfieldmaxdrawcurrentdriveDC:currentr Transforme
rated)(Siemens10currentcircuitfieldMax
8.1586.193*82.0drawcurrentinput AC :driveDC
outputdriveDCrequiredmax6.193470
91:currentsuplymotorMax
supplycurrent output DC*82.0drawcurrent input AC:driveDC
==+=+
<
==
===
=
AAA
A
AA
AVDCkW
VW
Olsun has informed us that at an overload of 169A the transformer would be able to run continuously for 30 min. Because of the nature of the dynamometer and engine testing, then dynamometer would never be run for 30 minutes continuously, especially at max power. Olsun’s overload rating for 158A is a duty cycle of .87, or 52 minutes on followed by 8 minutes off. DC Power Amplifier (DC drive) The dynamometer system DC drive is an SIEI Typact TPD32-500/520-280-4B with the following specifications:
SIEI Typact TPD32-500/520-280-4B Input voltage 460VAC ± 10%, 3 phase Input frequency 60Hz +-5%
FSAE Dyno Test Facility Team 06112
33
Max output voltage (armature) at listed input 480VDC Rated output current (armature cont. @ 40 degrees C) 280A Max output voltage (field) 360VDC Rated output current (field @40 degrees C) 20A
Figure 5.1.7: SIEI DC drive specifications
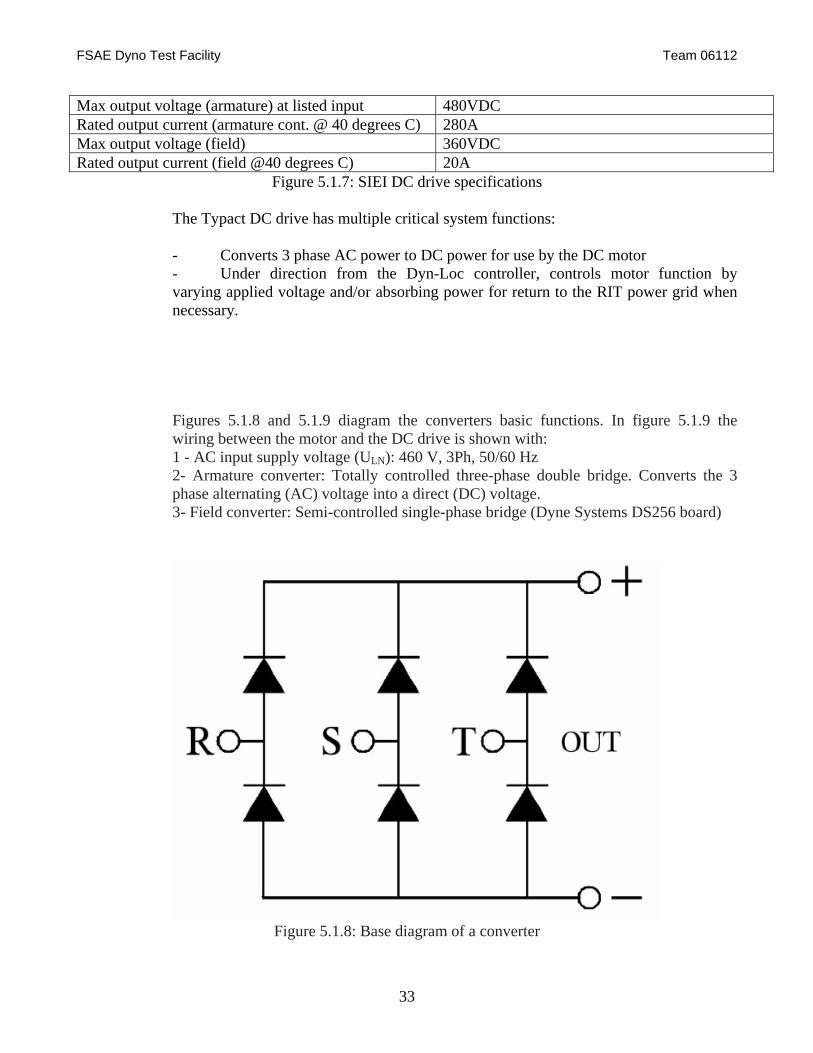
The Typact DC drive has multiple critical system functions: - Converts 3 phase AC power to DC power for use by the DC motor - Under direction from the Dyn-Loc controller, controls motor function by varying applied voltage and/or absorbing power for return to the RIT power grid when necessary.
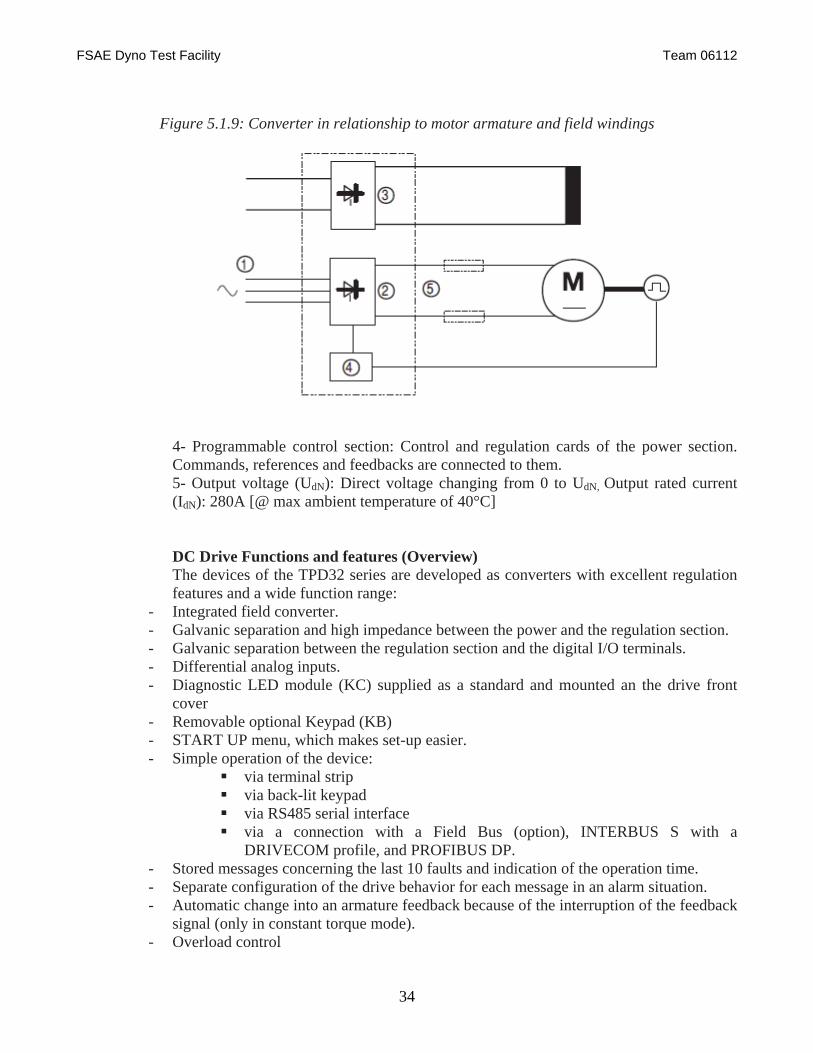
Figures 5.1.8 and 5.1.9 diagram the converters basic functions. In figure 5.1.9 the wiring between the motor and the DC drive is shown with: 1 - AC input supply voltage (ULN): 460 V, 3Ph, 50/60 Hz 2- Armature converter: Totally controlled three-phase double bridge. Converts the 3 phase alternating (AC) voltage into a direct (DC) voltage. 3- Field converter: Semi-controlled single-phase bridge (Dyne Systems DS256 board)
Figure 5.1.8: Base diagram of a converter
FSAE Dyno Test Facility Team 06112
34
Figure 5.1.9: Converter in relationship to motor armature and field windings
4- Programmable control section: Control and regulation cards of the power section. Commands, references and feedbacks are connected to them. 5- Output voltage (UdN): Direct voltage changing from 0 to UdN, Output rated current (IdN): 280A [@ max ambient temperature of 40°C]
DC Drive Functions and features (Overview) The devices of the TPD32 series are developed as converters with excellent regulation features and a wide function range:
- Integrated field converter. - Galvanic separation and high impedance between the power and the regulation section. - Galvanic separation between the regulation section and the digital I/O terminals. - Differential analog inputs. - Diagnostic LED module (KC) supplied as a standard and mounted an the drive front
cover - Removable optional Keypad (KB) - START UP menu, which makes set-up easier. - Simple operation of the device:
via terminal strip via back-lit keypad via RS485 serial interface via a connection with a Field Bus (option), INTERBUS S with a
DRIVECOM profile, and PROFIBUS DP. - Stored messages concerning the last 10 faults and indication of the operation time. - Separate configuration of the drive behavior for each message in an alarm situation. - Automatic change into an armature feedback because of the interruption of the feedback
signal (only in constant torque mode). - Overload control
FSAE Dyno Test Facility Team 06112
35
- Three freely configurable analog inputs on the standard device. - Widening of digital inputs and of digital, analog outputs via a option card. - Reference assignation and display of the feedback values as a percentage or in a
dimension, which can be defined by the user. - Possibility of a speed and torque regulation - Adaptive of the speed regulator - SIEI Current predictive regulator with an automatic adaptation. - Motor potentiometer function (increase / decrease speed command). - Jog function. - 8 internal speed references. - 5 internal linear or S-shaped ramps. - Internal signal conditioning (gains, min/max limits, offset ...). - Function widening available for specific applications (option).
The following devices will provide a fully functional basic dynamometer system. A DC motor to provide load for the engine under test, closed loop controller to manage dynamometer state, DC drive and AC isolation transformer to provide and regenerate the necessary power. In addition to this basic functionality, the coupling of the system with extensive data acquisition and remote computer control using National Instruments’ Labview software will provide an advanced dynamometer solution.
5.2 Data Acquisition
After the concept development phase, the team decided on a list of engine parameters needed to be logged to ensure a successful project. The selected parameters are listed below: • Cylinder Pressure • Fuel Pressure • Manifold Absolute Pressure (MAP) • Oil Pressure • Air Fuel Ratio • Exhaust Gas Temperature • Intake Air Temperature • Radiator Inlet Coolant Temperature • Radiator Outlet Coolant Temperature • Radiator Inlet Air Temperature • Radiator Outlet Air Temperature • Oil Temperature • Intake Air Velocity • Crankshaft Position and Speed
FSAE Dyno Test Facility Team 06112
36
Each of these individual parameters can be grouped into sub-categories according to the type of sensor used to monitor and record the information. The following sections will go into detail as to how each sub-system will function and how each will be implemented on the dynamometer.
5.2.1 Combustion Pressure Sensors
Combustion pressure sensors are typically piezoelectric devices, which take advantage of the charge output of a crystal. The phenomenon that occurs can be described as when a crystal such as quartz is compressed, a charge accumulates on either side of the crystal, which can be correlated to the induced strain. This charge is very small (on the order of pC) and is not something that is easily measured by most data acquisition systems. Charge amplifiers are used to convert this output into a mV signal. Piezoelectric devices are not well suited to static measurements but rather to those dynamic in nature because the charge will eventually “leak” over a certain time period thus rendering the reading inaccurate in static situations. Quick response and high stiffness resulting in excellent linearity make these sensors ideal for dynamic measurements.
In the search for solutions for this system, it was first necessary to determine the requirements. By using sound approximations and input from the rest of the team, the following criteria were determined, • Measure dynamic pressure from 0 psi to 1500 psi with some margin of safety in the event of spark knock • Provide quick response time <1.25 ms • Operate at temperatures up to 600°F and flash temperatures up to 3000°F • Resist mechanical vibration and shock • Natural Frequency >>7 kHz (typical knock frequency) • Resist thermal shock • Small size requirement • Provide accurate, repeatable data • Compatible with National Instruments DAQ • Low Cost System Solution After assessing the system requirements, research was done to determine what would provide the best system for this application. The end result was the selection of the 112B10 sensor from PCB Piezotronics. The following table provides a comparison of specifications with reference to design criteria,
Specified Pressure Transducer compared to Design Criteria

FSAE Dyno Test Facility Team 06112
37
Parameter 112B10 Design Criteria Sensitivity 1.0 pC/psi Not Specific Range 3000 psi 1500 psi Max. Pressure 5000 psi Not Specific Resonant Frequency ≥200 kHz >>7 kHz Rise Time ≤3.0 µs <1.25 ms Non-Linearity ≤2.0% FS Not Specific Acceleration Sensitivity 0.002 psi/g Not Specific Operating Temperature -100 to +600°F +60 to +600°F Max. Flash Temperature 4500°F 3000°F Max. Shock 10000 g pk Not Specific
Chart 5.2.1.1 By comparing the results it can be seen that this sensor meets or exceeds all the design requirements for this application. All other parameters that were not specific are well within the needs of this application.
Figure 5.2.1.1 112B10 Combustion Sensor (PCB Piezotronics)
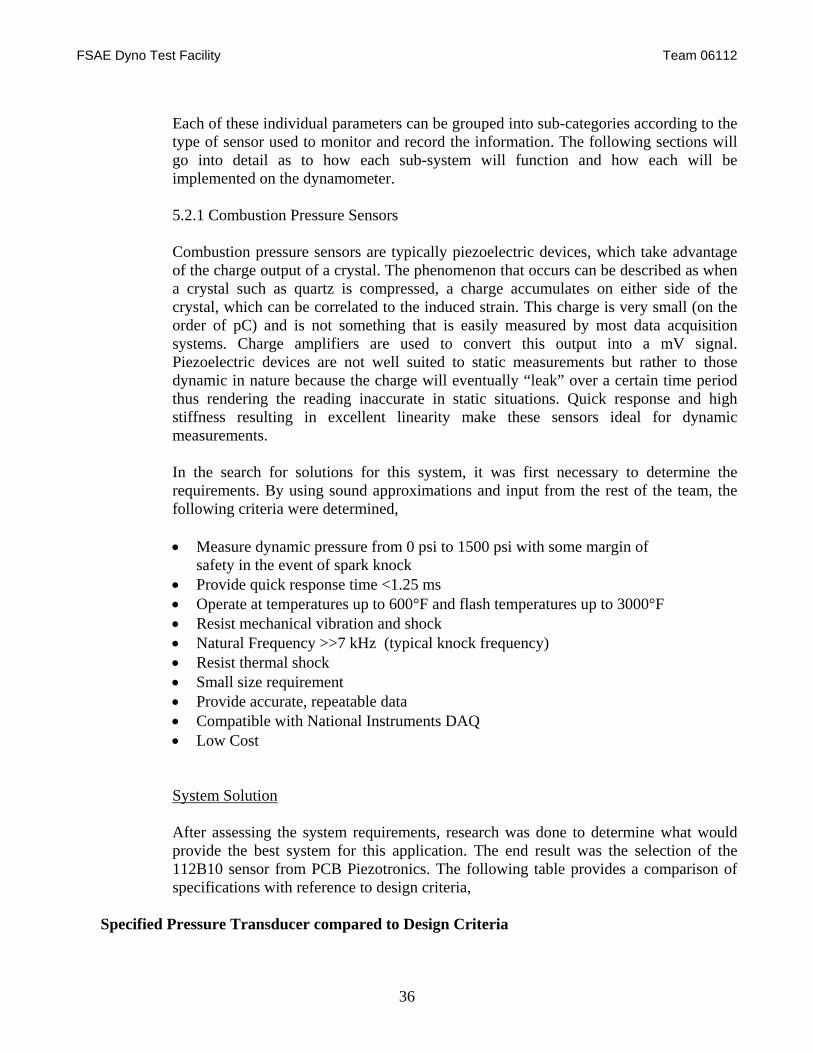
The decision was made to implement spark plug mounted sensors. Due to mounting and size requirements the lack of space in the Honda CBR600 cylinder head, ruled out the use of flush mount sensors were not a feasible solution. Another advantage of these sensors is the ease of mounting; the only requirement at this point is fabricating a special spark plug socket. The following diagram shows the layout of the spark plug adaptor. The Teflon sleeve pictured provides a means of cooling by passing compressed air over the sensor.
FSAE Dyno Test Facility Team 06112
38
Figure 5.2.1.2 Spark Plug Adaptor (PCB Piezotronics)
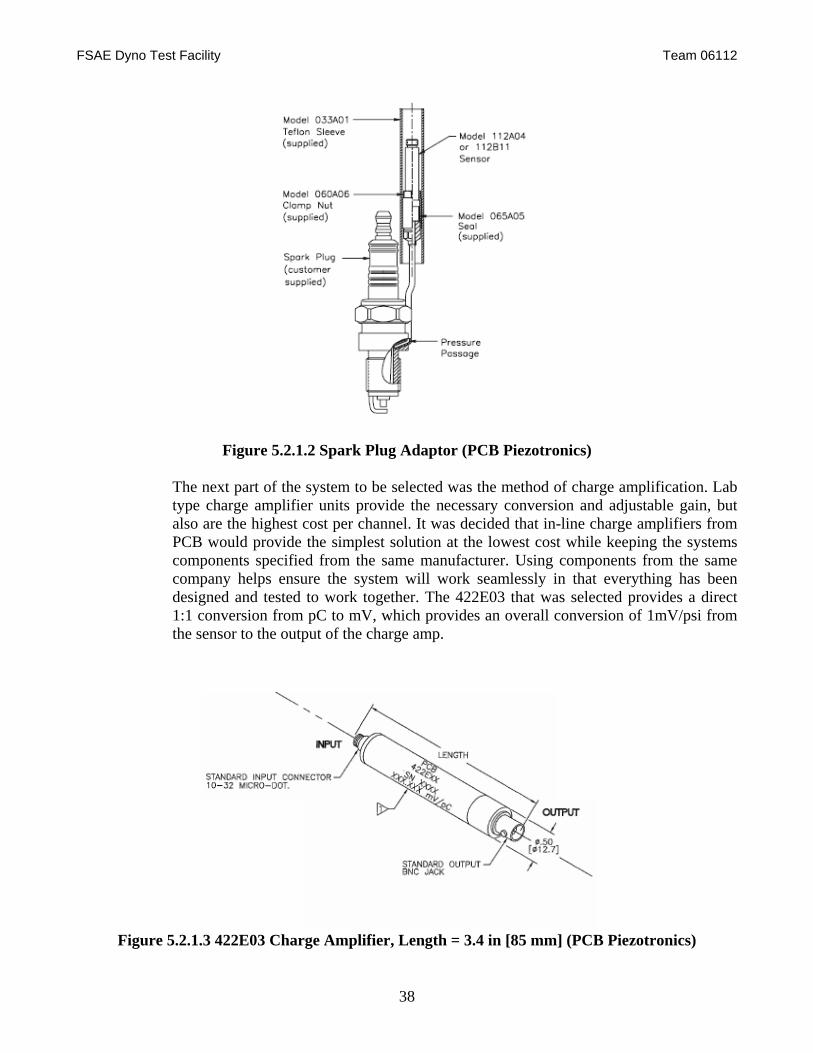
The next part of the system to be selected was the method of charge amplification. Lab type charge amplifier units provide the necessary conversion and adjustable gain, but also are the highest cost per channel. It was decided that in-line charge amplifiers from PCB would provide the simplest solution at the lowest cost while keeping the systems components specified from the same manufacturer. Using components from the same company helps ensure the system will work seamlessly in that everything has been designed and tested to work together. The 422E03 that was selected provides a direct 1:1 conversion from pC to mV, which provides an overall conversion of 1mV/psi from the sensor to the output of the charge amp.
Figure 5.2.1.3 422E03 Charge Amplifier, Length = 3.4 in [85 mm] (PCB Piezotronics)
FSAE Dyno Test Facility Team 06112
39
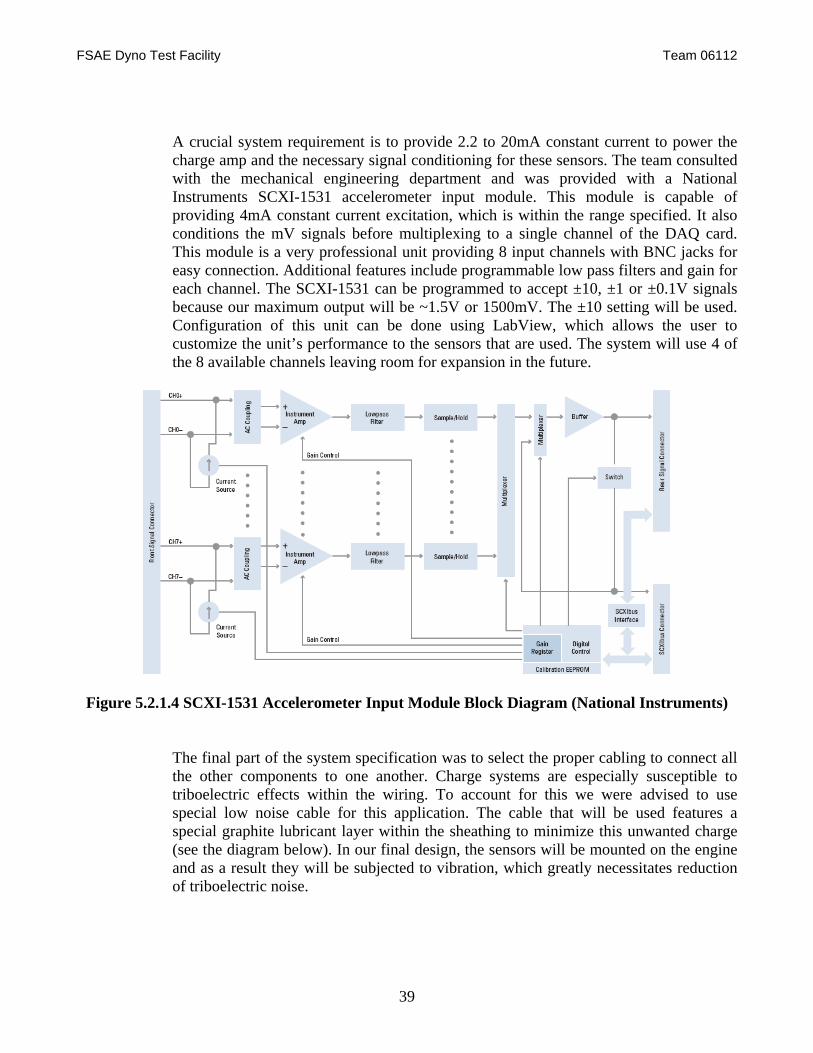
A crucial system requirement is to provide 2.2 to 20mA constant current to power the charge amp and the necessary signal conditioning for these sensors. The team consulted with the mechanical engineering department and was provided with a National Instruments SCXI-1531 accelerometer input module. This module is capable of providing 4mA constant current excitation, which is within the range specified. It also conditions the mV signals before multiplexing to a single channel of the DAQ card. This module is a very professional unit providing 8 input channels with BNC jacks for easy connection. Additional features include programmable low pass filters and gain for each channel. The SCXI-1531 can be programmed to accept ±10, ±1 or ±0.1V signals because our maximum output will be ~1.5V or 1500mV. The ±10 setting will be used. Configuration of this unit can be done using LabView, which allows the user to customize the unit’s performance to the sensors that are used. The system will use 4 of the 8 available channels leaving room for expansion in the future.
Figure 5.2.1.4 SCXI-1531 Accelerometer Input Module Block Diagram (National Instruments)
The final part of the system specification was to select the proper cabling to connect all the other components to one another. Charge systems are especially susceptible to triboelectric effects within the wiring. To account for this we were advised to use special low noise cable for this application. The cable that will be used features a special graphite lubricant layer within the sheathing to minimize this unwanted charge (see the diagram below). In our final design, the sensors will be mounted on the engine and as a result they will be subjected to vibration, which greatly necessitates reduction of triboelectric noise.
FSAE Dyno Test Facility Team 06112
40
Figure 5.2.1.5 Low Noise Cabling (PCB Piezotronics)
The cables running from the output of the combustion sensor to the input of the charge amp will use 10-32 coax connectors as shown below.
Figure 5.2.1.6 10-32 Connector, for reference (PCB Piezotronics)
The cables running from the output of the charge amp to the input of the SCXI module will also be low noise cable to eliminate any unwanted interference but will use BNC plugs like those shown below.
Figure 5.2.1.7 BNC Plug, for reference (PCB Piezotronics)
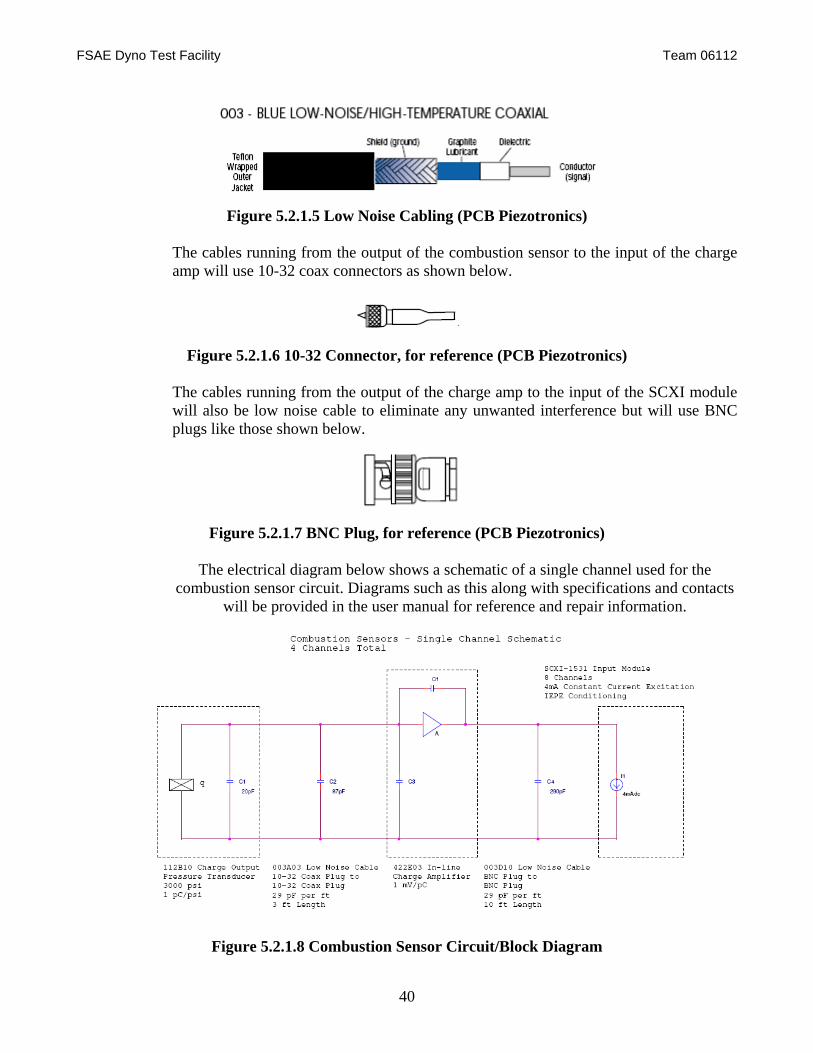
The electrical diagram below shows a schematic of a single channel used for the
combustion sensor circuit. Diagrams such as this along with specifications and contacts will be provided in the user manual for reference and repair information.
Figure 5.2.1.8 Combustion Sensor Circuit/Block Diagram
FSAE Dyno Test Facility Team 06112
41
5.2.2 Thermocouples
Thermocouples are widely used sensors which are comprised of two wires of different materials. One lead of the thermocouple is designated the positive leg and the other the negative leg. These two wires of dissimilar material are joined at one end; this is said to be the “hot” junction. The other end where they are connected to a readout instrument is the “cold” junction. Changes in temperature at the “hot” junction create a mV signal within the wires. By measuring this voltage and comparing it to a reference junction, the temperature at the “hot” junction can be determined. Because thermocouples create mV signals, amplification and signal conditioning are required to obtain a useful output. The reference junction mentioned is also needed for comparison, which is sometimes referred to as cold junction compensation. Some advantages/disadvantages of thermocouples as opposed to RTDs or thermistors are listed below Advantages • Low Cost • Rugged • Fast Response • High Temperature Operation • Point Temperature Sensing Disadvantages • Low Stability & Repeatability • Low Sensitivity • Low Accuracy • Susceptible to Noise if Unshielded
Requirements for each individual temperature measurement are dependent on the environment in which they must function and the accuracy required. In a short summary, the team has concluded the following (worst case estimates),
• Exhaust Temperature Sensor (1) for each port, (4) total Compatible w/ H2O, CO2, NOX, HC’s, etc. Measure temperatures up to 1200°F
• Intake Air Temperature Sensor (1) required Highest accuracy Measure temperatures up to 100°F
• Radiator Coolant Temperature Sensor (2) required
FSAE Dyno Test Facility Team 06112
42
Compatible w/ H2O Measure temperatures up to 300°F
• Radiator Air Temperature Sensor (2) required Measure temperatures up to 200°F
• Oil Temperature Sensor (1) required Compatible w/ engine lubricants Measure temperatures up to 300°F
System Solution Three common, inexpensive types of thermocouples that were considered are the J, K, and T types. The following tables list standard specifications of these thermocouples.
Figure 5.2.2.1 Selected Standard Thermocouples Material & Range Specifications (Watlow)
Thermocouple Standard Type
Metal ContentPositive Leg
Metal Content Negative Leg
Temperature Range
J 99.5% Iron (Fe)
55% Copper (Cu), 45% Nickel (Ni)
32 to 1380°F(0 to 750°C)
K 90% Nickel (Ni),10% Chromium (Cr)
95% Nickel (Ni), 5% Various
32 to 2280°F(0 to 1250°C)
T 100% Copper (Cu)
55% Copper (Cu), 45% Nickel (Ni)
-330 to 660°F(-200 to 350°C)
Figure 5.2.2.2 Accuracy Limits of Selected Thermocouples (Watlow)
Thermocouple Type
Maximum Temperature
Standard Tolerance
J 1380°F (750°C) ±3.96°F (±2.2°C) or ±0.75% K 2280°F (1250°C) ±3.96°F (±2.2°C) or ±0.75% T 660°F (350°C) ±1.8°F (±1.0°C) or ±0.75%
It can be seen that the J and the K types have the same standard tolerance but the K is superior in its range and material type. J types, because they are ferrous, are susceptible to corrosion. For this reason it was decided that K types would be used for the majority of temperature measurements on the engine. The one exception is the intake air temperature measurement, where greater accuracy is required. For this application a T type will be used which is well within the specifications required and has approximately half the tolerance of the J or K type. T types will also be used for measuring the temperature difference in the air flowing into and out of the radiator. This measurement will provide a means to monitor the efficiency of the radiator and fan system. By monitoring the delta across the radiator for both the air and water, issues with the cooling can system can be easily be corrected before any damage is done to the engine.
FSAE Dyno Test Facility Team 06112
43
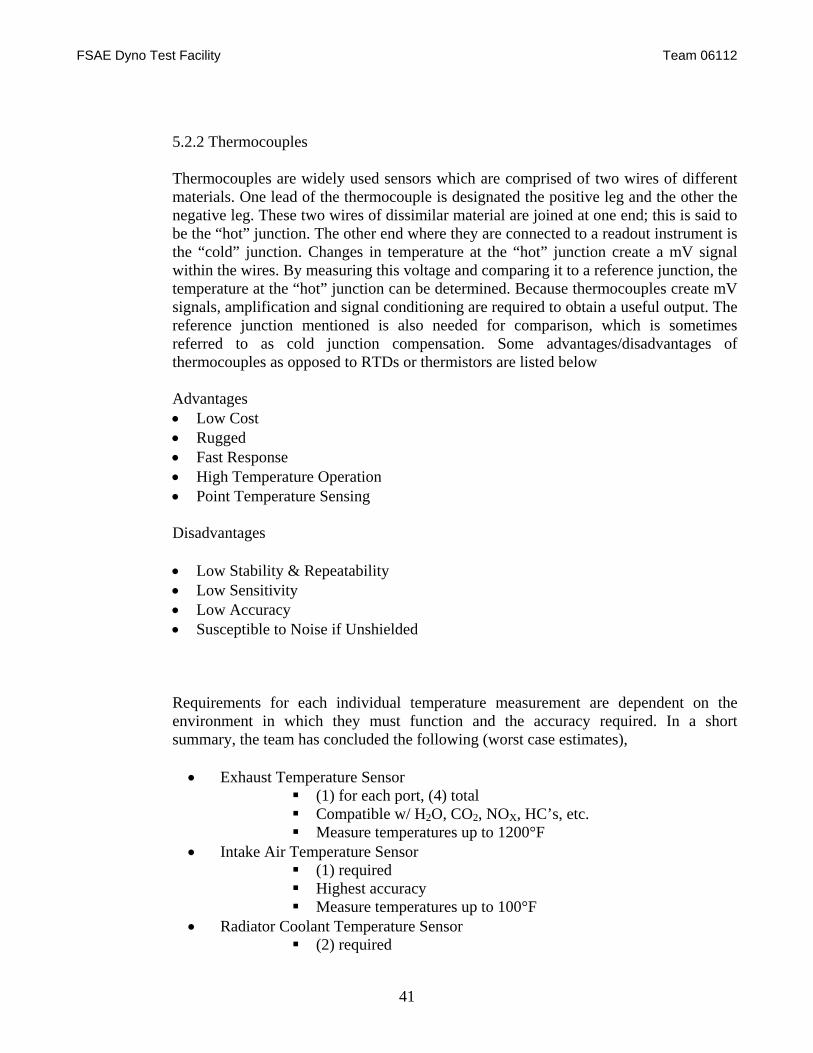
The following table lists the application specific requiremnets for each sensor along with a comparison to the critical limits.
Figure 5.2.2.4 Specified Thermocouples compared to Design Criteria
Application Thermocouple Type
Specified Range
Standard Range
Max. Tolerance within Specified Range
Exhaust Gas K 60 to 1200°F 32 to 2280°F ±9.0°F Intake Air T 60 to 100°F -330 to 660°F ±1.8°F Coolant K 60 to 300°F 32 to 2280°F ±3.96 Oil K 60 to 300°F 32 to 2280°F ±3.96
The K-Types that will be used are transition junction style probes with an ungrounded junction. The ungrounded junction isolates the thermocouple from the signal conditioning, providing insurance against damaging expensive hardware. Advantages of this style of thermocouple are 2100°F continuous use and high oxidation resistance. The diagram below shows a typical transition junction probe thermocouple.
Figure 5.2.2.5 Miniature Style Transition Junction Probe Thermocouple,
Sheath Diameter = 1/16”, Sheath Length = 6” (Omega)
Transition junction probes make for easy mounting with a compression fitting. Holes will be drilled and tapped for 1/8” pipe threads to accept the compression fittings. These ports will be conveniently placed where needed: one in each exhaust port, one at the inlet of the radiator, one at the outlet of the radiator, and one in an oil galley.
Figure 5.2.2.6 Compression Fitting for Ø1/16” Tube with 1/8 MNPT (Omega)
The T-type thermocouples that will be used for air temperature measurements have unshielded junctions, unlike the K-types. No special sheath is needed for these applications because it will be used to measure the temperature of clean, ambient air. A special fitting will be fabricated to mount the intake air thermocouple in the intake manifold.
Sheath Transition Joint
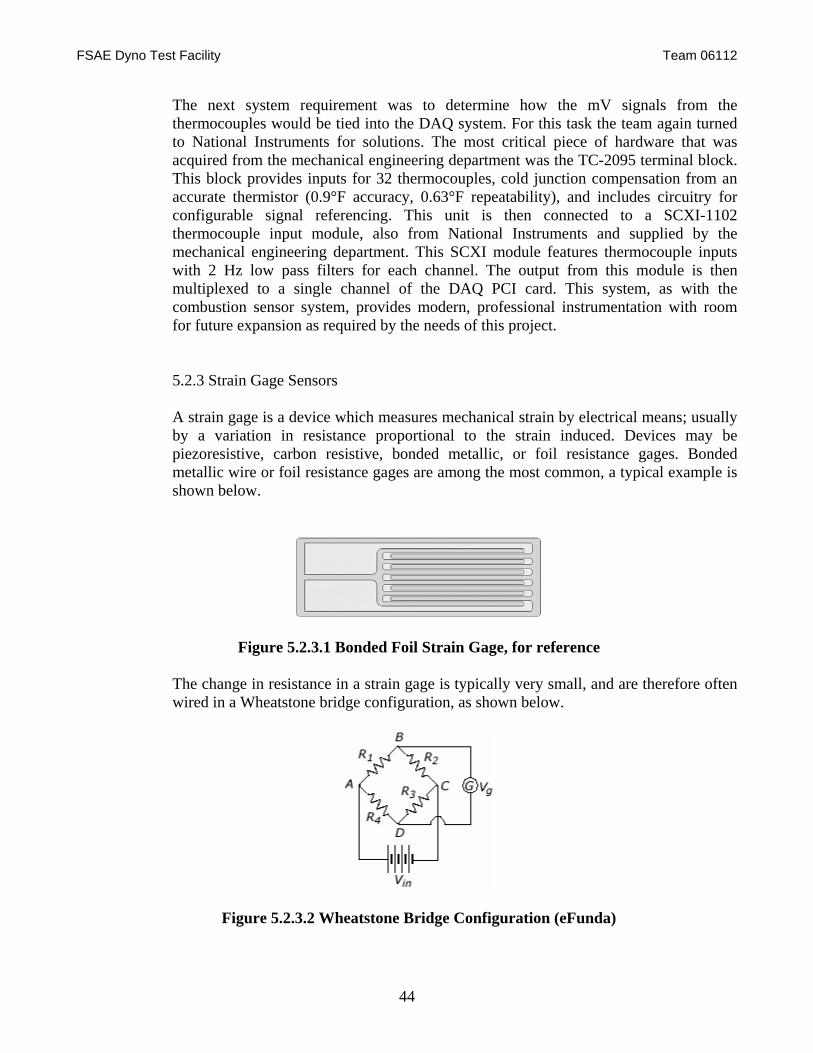
FSAE Dyno Test Facility Team 06112
44
The next system requirement was to determine how the mV signals from the thermocouples would be tied into the DAQ system. For this task the team again turned to National Instruments for solutions. The most critical piece of hardware that was acquired from the mechanical engineering department was the TC-2095 terminal block. This block provides inputs for 32 thermocouples, cold junction compensation from an accurate thermistor (0.9°F accuracy, 0.63°F repeatability), and includes circuitry for configurable signal referencing. This unit is then connected to a SCXI-1102 thermocouple input module, also from National Instruments and supplied by the mechanical engineering department. This SCXI module features thermocouple inputs with 2 Hz low pass filters for each channel. The output from this module is then multiplexed to a single channel of the DAQ PCI card. This system, as with the combustion sensor system, provides modern, professional instrumentation with room for future expansion as required by the needs of this project.
5.2.3 Strain Gage Sensors
A strain gage is a device which measures mechanical strain by electrical means; usually by a variation in resistance proportional to the strain induced. Devices may be piezoresistive, carbon resistive, bonded metallic, or foil resistance gages. Bonded metallic wire or foil resistance gages are among the most common, a typical example is shown below.
Figure 5.2.3.1 Bonded Foil Strain Gage, for reference
The change in resistance in a strain gage is typically very small, and are therefore often wired in a Wheatstone bridge configuration, as shown below.
Figure 5.2.3.2 Wheatstone Bridge Configuration (eFunda)
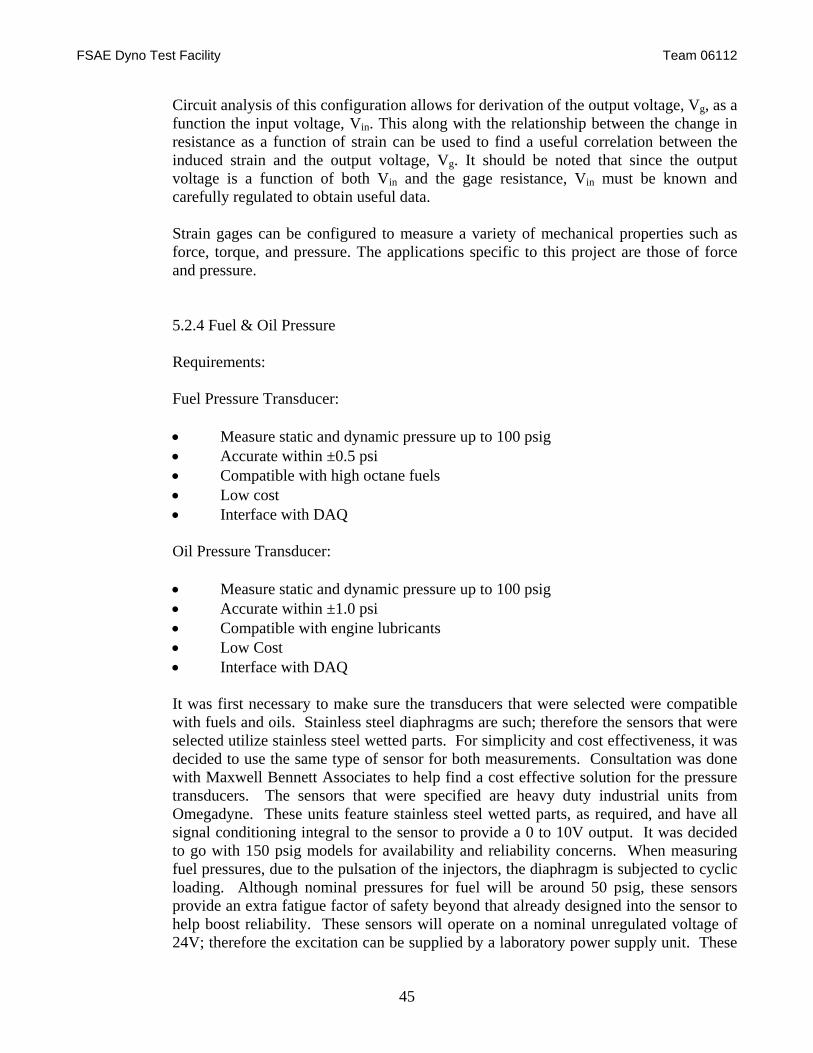
FSAE Dyno Test Facility Team 06112
45
Circuit analysis of this configuration allows for derivation of the output voltage, Vg, as a function the input voltage, Vin. This along with the relationship between the change in resistance as a function of strain can be used to find a useful correlation between the induced strain and the output voltage, Vg. It should be noted that since the output voltage is a function of both Vin and the gage resistance, Vin must be known and carefully regulated to obtain useful data. Strain gages can be configured to measure a variety of mechanical properties such as force, torque, and pressure. The applications specific to this project are those of force and pressure.
5.2.4 Fuel & Oil Pressure Requirements:
Fuel Pressure Transducer: • Measure static and dynamic pressure up to 100 psig • Accurate within ±0.5 psi • Compatible with high octane fuels • Low cost • Interface with DAQ Oil Pressure Transducer: • Measure static and dynamic pressure up to 100 psig • Accurate within ±1.0 psi • Compatible with engine lubricants • Low Cost • Interface with DAQ
It was first necessary to make sure the transducers that were selected were compatible with fuels and oils. Stainless steel diaphragms are such; therefore the sensors that were selected utilize stainless steel wetted parts. For simplicity and cost effectiveness, it was decided to use the same type of sensor for both measurements. Consultation was done with Maxwell Bennett Associates to help find a cost effective solution for the pressure transducers. The sensors that were specified are heavy duty industrial units from Omegadyne. These units feature stainless steel wetted parts, as required, and have all signal conditioning integral to the sensor to provide a 0 to 10V output. It was decided to go with 150 psig models for availability and reliability concerns. When measuring fuel pressures, due to the pulsation of the injectors, the diaphragm is subjected to cyclic loading. Although nominal pressures for fuel will be around 50 psig, these sensors provide an extra fatigue factor of safety beyond that already designed into the sensor to help boost reliability. These sensors will operate on a nominal unregulated voltage of 24V; therefore the excitation can be supplied by a laboratory power supply unit. These
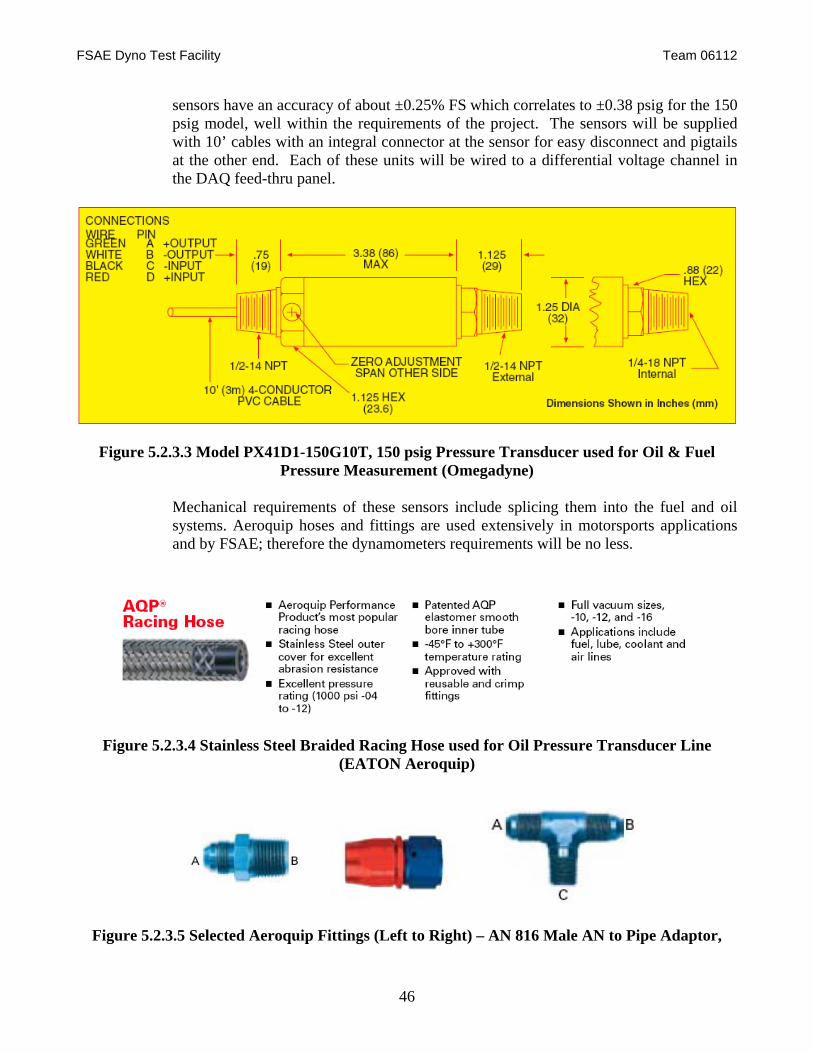
FSAE Dyno Test Facility Team 06112
46
sensors have an accuracy of about ±0.25% FS which correlates to ±0.38 psig for the 150 psig model, well within the requirements of the project. The sensors will be supplied with 10’ cables with an integral connector at the sensor for easy disconnect and pigtails at the other end. Each of these units will be wired to a differential voltage channel in the DAQ feed-thru panel.
Figure 5.2.3.3 Model PX41D1-150G10T, 150 psig Pressure Transducer used for Oil & Fuel Pressure Measurement (Omegadyne)
Mechanical requirements of these sensors include splicing them into the fuel and oil systems. Aeroquip hoses and fittings are used extensively in motorsports applications and by FSAE; therefore the dynamometers requirements will be no less.
Figure 5.2.3.4 Stainless Steel Braided Racing Hose used for Oil Pressure Transducer Line (EATON Aeroquip)
Figure 5.2.3.5 Selected Aeroquip Fittings (Left to Right) – AN 816 Male AN to Pipe Adaptor,
FSAE Dyno Test Facility Team 06112
47
AN Straight Hose End, AN 825 Male Branch Tee (EATON Aeroquip)
Fuel Pressure Sensor Mounting: The fuel pressure sensor will be spliced in-line after the fuel pump and filter, but before the fuel rail. The system will implement two -06 hose ends coupled to a tee fitting with a ¼ male pipe thread, which will thread into the ¼ female port on the transducer. Components required therefore are, • (2) -06 SAE 37° (JIC/AN) Straight Hose Ends • (1) AN 825 Male Branch Tee The sensor will then be securely mounted to the chassis of the dynamometer.
Oil Pressure Sensor Mounting: The oil pressure sensor will be spliced into the engines lubrication system on a pressurized oil galley. A 1/8 pipe port will be drilled and tapped into the galley and a -06 to 1/8 male pipe adaptor will be threaded in. A 2’ length of -06 hose with straight hose ends will be attached to the fitting on the engine. The sensor will be fitted with a -06 AN to ¼ male pipe adaptor in its ¼ female port. The hose will be attached to the -06 AN on the sensor. The sensor will be remotely and securely mounted on the dynamometer chassis, isolated from the engine. Components required are, • (2) -06 SAE 37° (JIC/AN) Straight Hose Ends • 2’ Length of -06 AQP Racing Hose • (1) -06 Male AN to 1/8 MNPT • (1) -06 Male AN to ¼ MNPT
5.2.5. Load Cell
The Dyne Systems Controller requires the following specifications for a strain gage type load cell, • 2-3 mV/V output • Compatible w/ +9V excitation Additional team requirements, • 500 lb Capacity • High Accuracy • Low Cost • Versatile Mounting
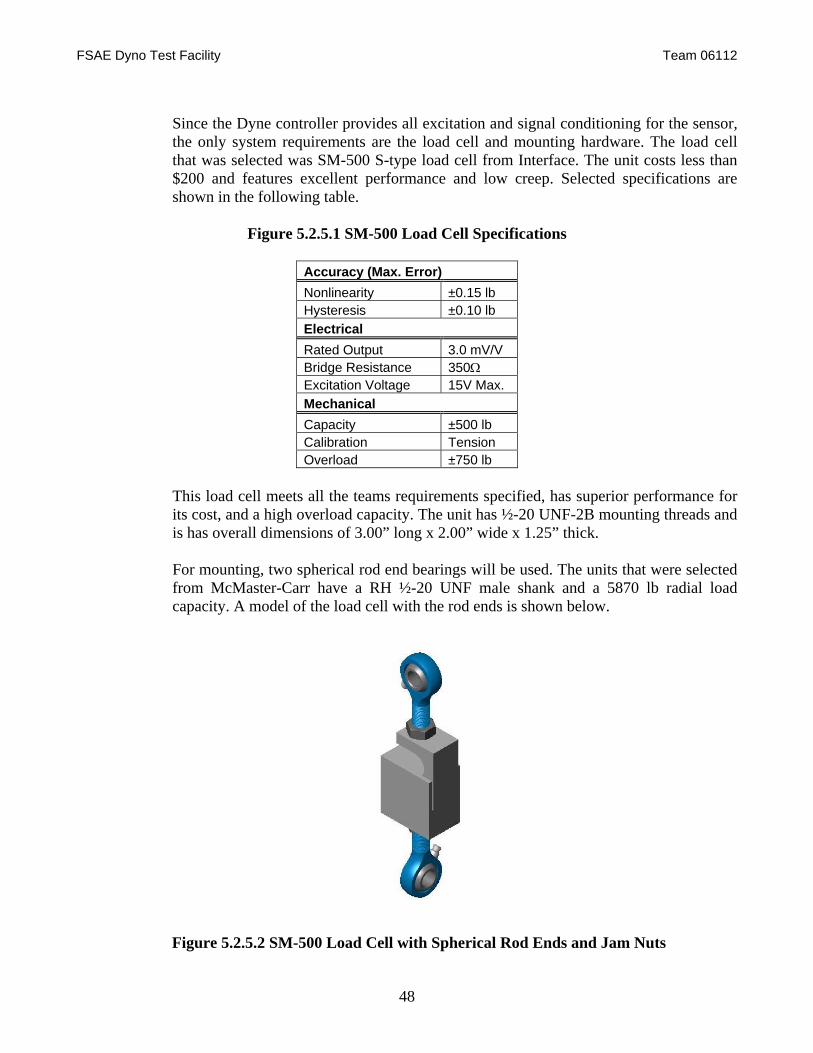
FSAE Dyno Test Facility Team 06112
48
Since the Dyne controller provides all excitation and signal conditioning for the sensor, the only system requirements are the load cell and mounting hardware. The load cell that was selected was SM-500 S-type load cell from Interface. The unit costs less than $200 and features excellent performance and low creep. Selected specifications are shown in the following table.
Figure 5.2.5.1 SM-500 Load Cell Specifications
Accuracy (Max. Error) Nonlinearity ±0.15 lb Hysteresis ±0.10 lb Electrical Rated Output 3.0 mV/V Bridge Resistance 350Ω Excitation Voltage 15V Max. Mechanical Capacity ±500 lb Calibration Tension Overload ±750 lb
This load cell meets all the teams requirements specified, has superior performance for its cost, and a high overload capacity. The unit has ½-20 UNF-2B mounting threads and is has overall dimensions of 3.00” long x 2.00” wide x 1.25” thick. For mounting, two spherical rod end bearings will be used. The units that were selected from McMaster-Carr have a RH ½-20 UNF male shank and a 5870 lb radial load capacity. A model of the load cell with the rod ends is shown below.
Figure 5.2.5.2 SM-500 Load Cell with Spherical Rod Ends and Jam Nuts
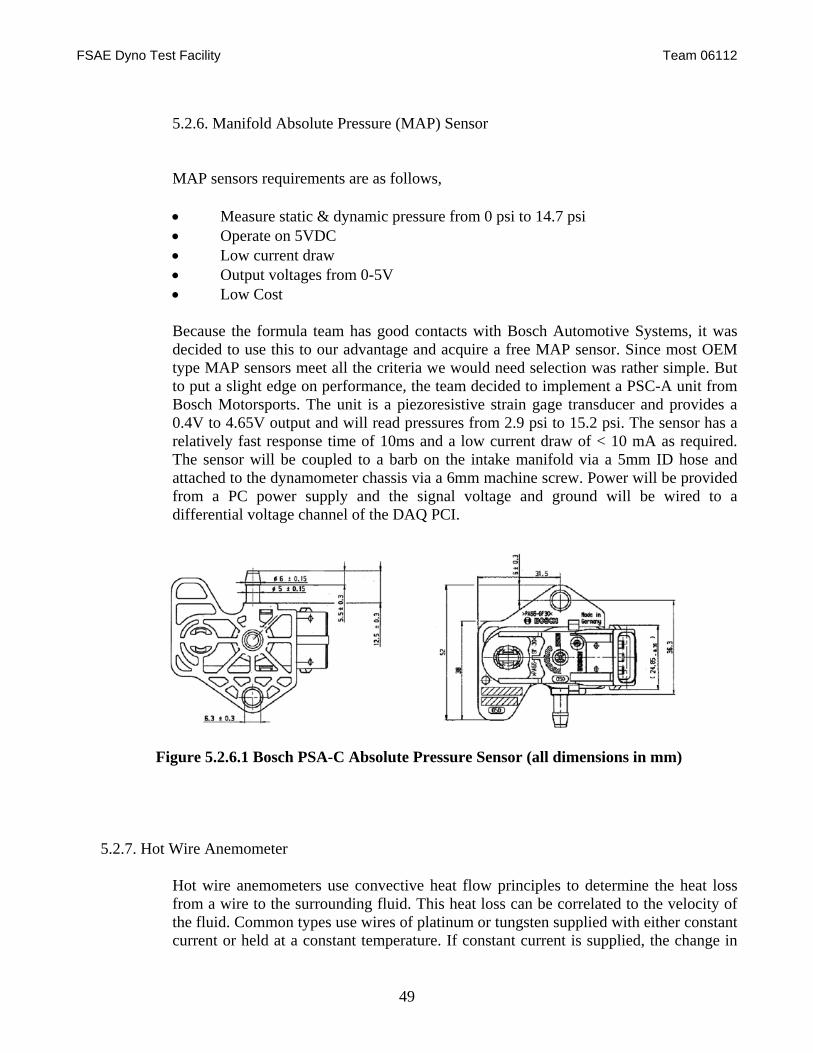
FSAE Dyno Test Facility Team 06112
49
5.2.6. Manifold Absolute Pressure (MAP) Sensor
MAP sensors requirements are as follows, • Measure static & dynamic pressure from 0 psi to 14.7 psi • Operate on 5VDC • Low current draw • Output voltages from 0-5V • Low Cost Because the formula team has good contacts with Bosch Automotive Systems, it was decided to use this to our advantage and acquire a free MAP sensor. Since most OEM type MAP sensors meet all the criteria we would need selection was rather simple. But to put a slight edge on performance, the team decided to implement a PSC-A unit from Bosch Motorsports. The unit is a piezoresistive strain gage transducer and provides a 0.4V to 4.65V output and will read pressures from 2.9 psi to 15.2 psi. The sensor has a relatively fast response time of 10ms and a low current draw of < 10 mA as required. The sensor will be coupled to a barb on the intake manifold via a 5mm ID hose and attached to the dynamometer chassis via a 6mm machine screw. Power will be provided from a PC power supply and the signal voltage and ground will be wired to a differential voltage channel of the DAQ PCI.
Figure 5.2.6.1 Bosch PSA-C Absolute Pressure Sensor (all dimensions in mm)
5.2.7. Hot Wire Anemometer
Hot wire anemometers use convective heat flow principles to determine the heat loss from a wire to the surrounding fluid. This heat loss can be correlated to the velocity of the fluid. Common types use wires of platinum or tungsten supplied with either constant current or held at a constant temperature. If constant current is supplied, the change in
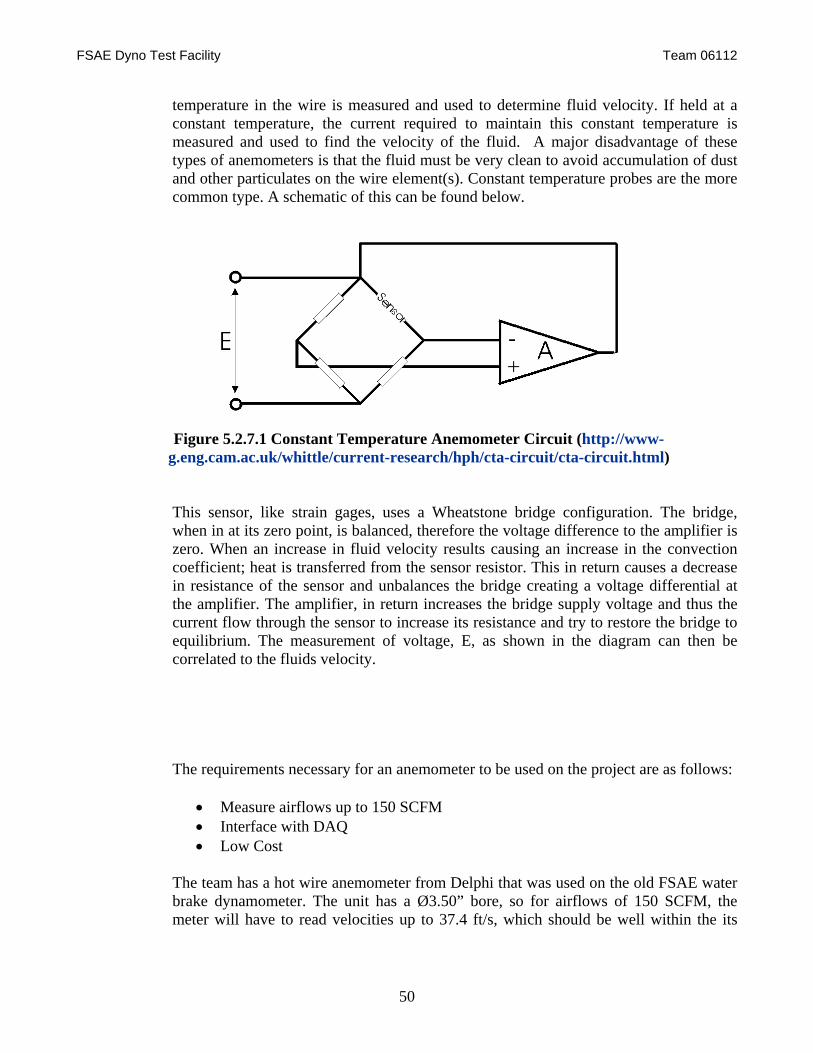
FSAE Dyno Test Facility Team 06112
50
temperature in the wire is measured and used to determine fluid velocity. If held at a constant temperature, the current required to maintain this constant temperature is measured and used to find the velocity of the fluid. A major disadvantage of these types of anemometers is that the fluid must be very clean to avoid accumulation of dust and other particulates on the wire element(s). Constant temperature probes are the more common type. A schematic of this can be found below.
Figure 5.2.7.1 Constant Temperature Anemometer Circuit (http://www-g.eng.cam.ac.uk/whittle/current-research/hph/cta-circuit/cta-circuit.html)
This sensor, like strain gages, uses a Wheatstone bridge configuration. The bridge, when in at its zero point, is balanced, therefore the voltage difference to the amplifier is zero. When an increase in fluid velocity results causing an increase in the convection coefficient; heat is transferred from the sensor resistor. This in return causes a decrease in resistance of the sensor and unbalances the bridge creating a voltage differential at the amplifier. The amplifier, in return increases the bridge supply voltage and thus the current flow through the sensor to increase its resistance and try to restore the bridge to equilibrium. The measurement of voltage, E, as shown in the diagram can then be correlated to the fluids velocity.
The requirements necessary for an anemometer to be used on the project are as follows:
• Measure airflows up to 150 SCFM • Interface with DAQ • Low Cost
The team has a hot wire anemometer from Delphi that was used on the old FSAE water brake dynamometer. The unit has a Ø3.50” bore, so for airflows of 150 SCFM, the meter will have to read velocities up to 37.4 ft/s, which should be well within the its
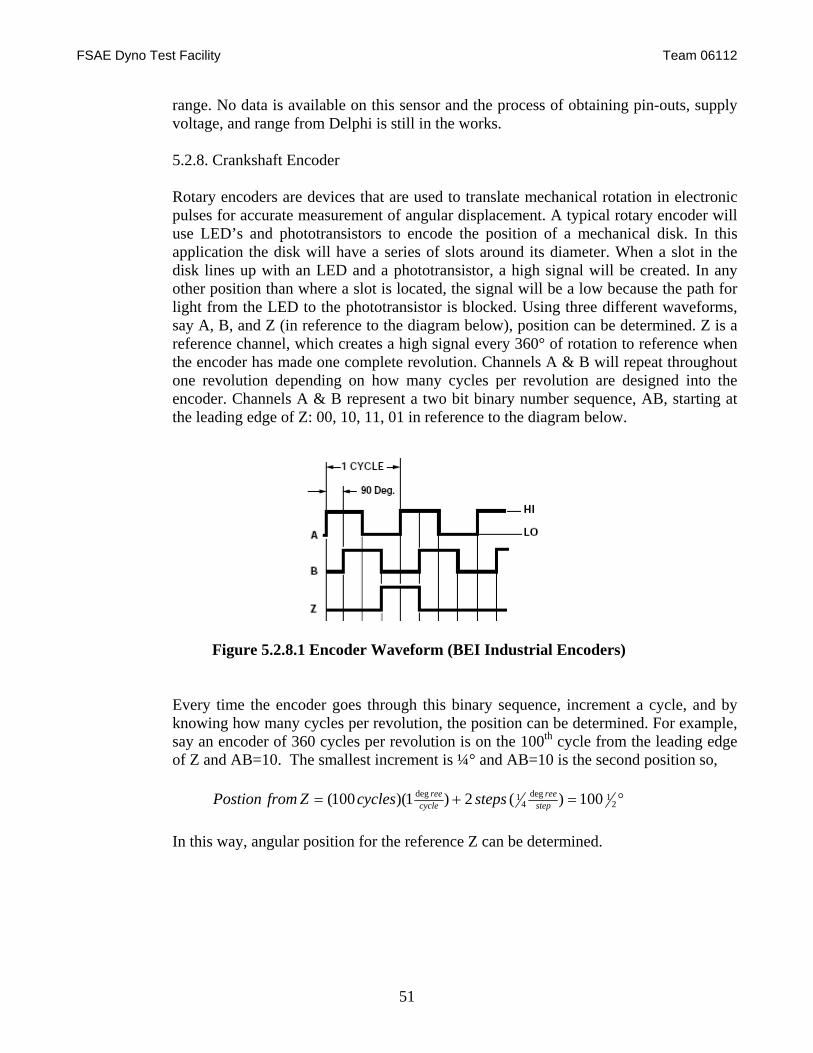
FSAE Dyno Test Facility Team 06112
51
range. No data is available on this sensor and the process of obtaining pin-outs, supply voltage, and range from Delphi is still in the works.
5.2.8. Crankshaft Encoder
Rotary encoders are devices that are used to translate mechanical rotation in electronic pulses for accurate measurement of angular displacement. A typical rotary encoder will use LED’s and phototransistors to encode the position of a mechanical disk. In this application the disk will have a series of slots around its diameter. When a slot in the disk lines up with an LED and a phototransistor, a high signal will be created. In any other position than where a slot is located, the signal will be a low because the path for light from the LED to the phototransistor is blocked. Using three different waveforms, say A, B, and Z (in reference to the diagram below), position can be determined. Z is a reference channel, which creates a high signal every 360° of rotation to reference when the encoder has made one complete revolution. Channels A & B will repeat throughout one revolution depending on how many cycles per revolution are designed into the encoder. Channels A & B represent a two bit binary number sequence, AB, starting at the leading edge of Z: 00, 10, 11, 01 in reference to the diagram below.
Figure 5.2.8.1 Encoder Waveform (BEI Industrial Encoders)
Every time the encoder goes through this binary sequence, increment a cycle, and by knowing how many cycles per revolution, the position can be determined. For example, say an encoder of 360 cycles per revolution is on the 100th cycle from the leading edge of Z and AB=10. The smallest increment is ¼° and AB=10 is the second position so,
°=+= 2
1deg4
1deg 100)(2)1)(100( stepree
cycleree stepscyclesZfromPostion
In this way, angular position for the reference Z can be determined.
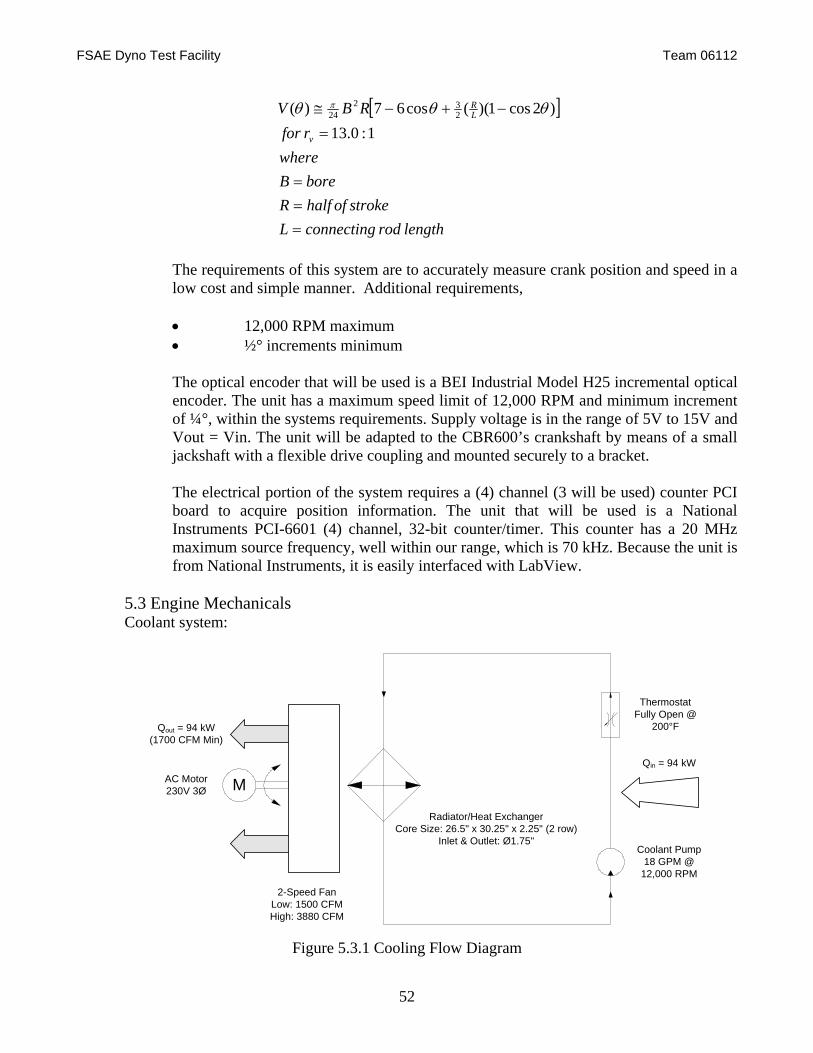
FSAE Dyno Test Facility Team 06112
52
[ ]
lengthrodconnectingLstrokeofhalfR
boreBwhere
rforRBV
v
LR
===
=
−+−≅
1:0.13)2cos1)((cos67)( 2
3224 θθθ π
The requirements of this system are to accurately measure crank position and speed in a low cost and simple manner. Additional requirements, • 12,000 RPM maximum • ½° increments minimum The optical encoder that will be used is a BEI Industrial Model H25 incremental optical encoder. The unit has a maximum speed limit of 12,000 RPM and minimum increment of ¼°, within the systems requirements. Supply voltage is in the range of 5V to 15V and Vout = Vin. The unit will be adapted to the CBR600’s crankshaft by means of a small jackshaft with a flexible drive coupling and mounted securely to a bracket. The electrical portion of the system requires a (4) channel (3 will be used) counter PCI board to acquire position information. The unit that will be used is a National Instruments PCI-6601 (4) channel, 32-bit counter/timer. This counter has a 20 MHz maximum source frequency, well within our range, which is 70 kHz. Because the unit is from National Instruments, it is easily interfaced with LabView.
5.3 Engine Mechanicals
Coolant system:
Figure 5.3.1 Cooling Flow Diagram
MAC Motor230V 3Ø
Qout = 94 kW(1700 CFM Min)
Qin = 94 kW
Coolant Pump18 GPM @
12,000 RPM
ThermostatFully Open @
200°F
Radiator/Heat ExchangerCore Size: 26.5" x 30.25" x 2.25" (2 row)
Inlet & Outlet: Ø1.75"
2-Speed FanLow: 1500 CFMHigh: 3880 CFM
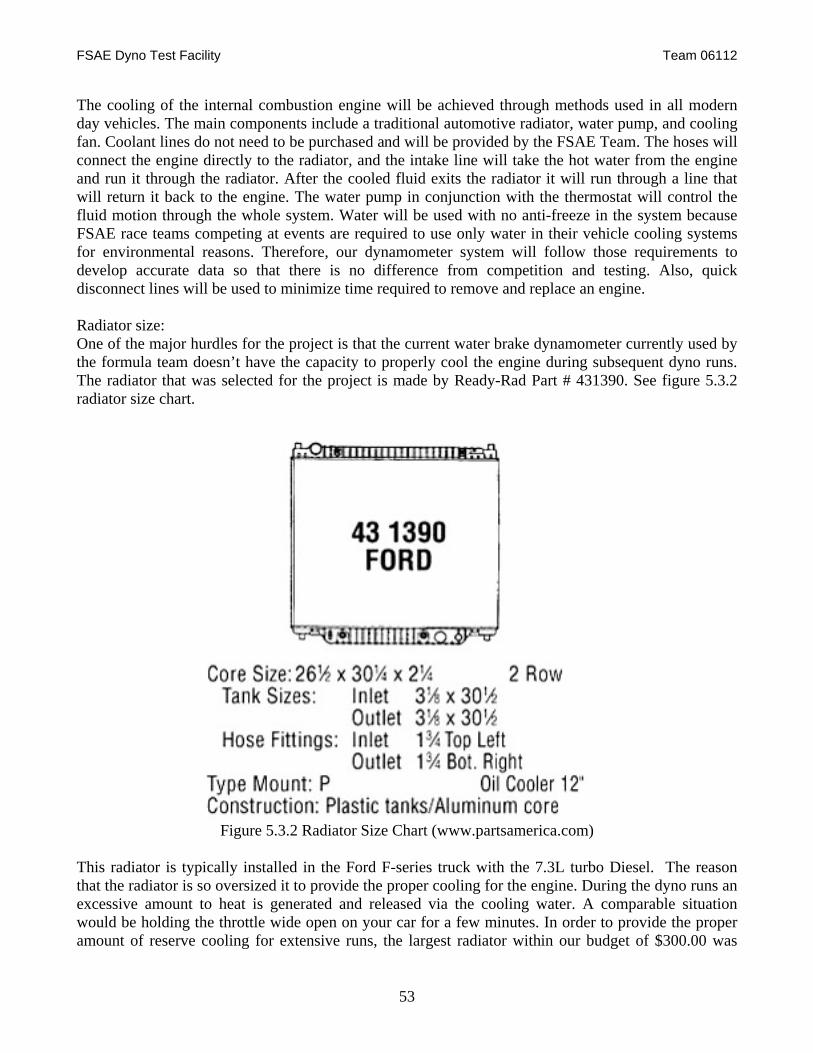
FSAE Dyno Test Facility Team 06112
53
The cooling of the internal combustion engine will be achieved through methods used in all modern day vehicles. The main components include a traditional automotive radiator, water pump, and cooling fan. Coolant lines do not need to be purchased and will be provided by the FSAE Team. The hoses will connect the engine directly to the radiator, and the intake line will take the hot water from the engine and run it through the radiator. After the cooled fluid exits the radiator it will run through a line that will return it back to the engine. The water pump in conjunction with the thermostat will control the fluid motion through the whole system. Water will be used with no anti-freeze in the system because FSAE race teams competing at events are required to use only water in their vehicle cooling systems for environmental reasons. Therefore, our dynamometer system will follow those requirements to develop accurate data so that there is no difference from competition and testing. Also, quick disconnect lines will be used to minimize time required to remove and replace an engine. Radiator size: One of the major hurdles for the project is that the current water brake dynamometer currently used by the formula team doesn’t have the capacity to properly cool the engine during subsequent dyno runs. The radiator that was selected for the project is made by Ready-Rad Part # 431390. See figure 5.3.2 radiator size chart.
Figure 5.3.2 Radiator Size Chart (www.partsamerica.com) This radiator is typically installed in the Ford F-series truck with the 7.3L turbo Diesel. The reason that the radiator is so oversized it to provide the proper cooling for the engine. During the dyno runs an excessive amount to heat is generated and released via the cooling water. A comparable situation would be holding the throttle wide open on your car for a few minutes. In order to provide the proper amount of reserve cooling for extensive runs, the largest radiator within our budget of $300.00 was
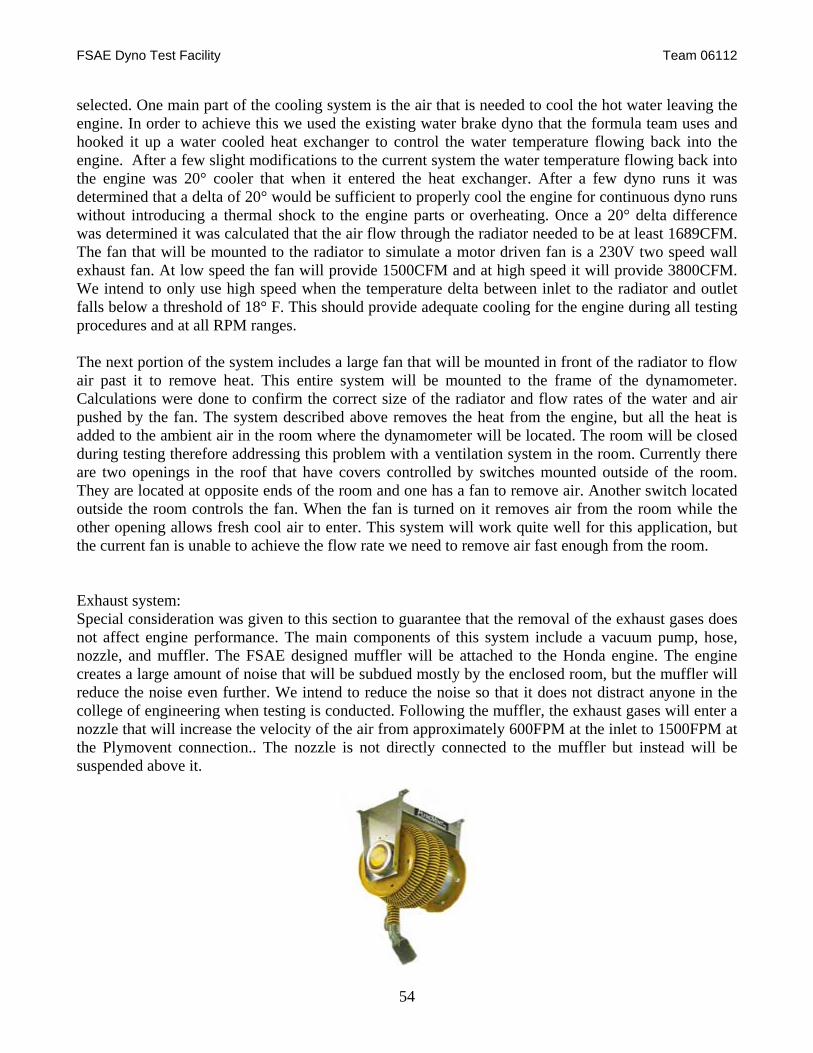
FSAE Dyno Test Facility Team 06112
54
selected. One main part of the cooling system is the air that is needed to cool the hot water leaving the engine. In order to achieve this we used the existing water brake dyno that the formula team uses and hooked it up a water cooled heat exchanger to control the water temperature flowing back into the engine. After a few slight modifications to the current system the water temperature flowing back into the engine was 20° cooler that when it entered the heat exchanger. After a few dyno runs it was determined that a delta of 20° would be sufficient to properly cool the engine for continuous dyno runs without introducing a thermal shock to the engine parts or overheating. Once a 20° delta difference was determined it was calculated that the air flow through the radiator needed to be at least 1689CFM. The fan that will be mounted to the radiator to simulate a motor driven fan is a 230V two speed wall exhaust fan. At low speed the fan will provide 1500CFM and at high speed it will provide 3800CFM. We intend to only use high speed when the temperature delta between inlet to the radiator and outlet falls below a threshold of 18° F. This should provide adequate cooling for the engine during all testing procedures and at all RPM ranges. The next portion of the system includes a large fan that will be mounted in front of the radiator to flow air past it to remove heat. This entire system will be mounted to the frame of the dynamometer. Calculations were done to confirm the correct size of the radiator and flow rates of the water and air pushed by the fan. The system described above removes the heat from the engine, but all the heat is added to the ambient air in the room where the dynamometer will be located. The room will be closed during testing therefore addressing this problem with a ventilation system in the room. Currently there are two openings in the roof that have covers controlled by switches mounted outside of the room. They are located at opposite ends of the room and one has a fan to remove air. Another switch located outside the room controls the fan. When the fan is turned on it removes air from the room while the other opening allows fresh cool air to enter. This system will work quite well for this application, but the current fan is unable to achieve the flow rate we need to remove air fast enough from the room. Exhaust system: Special consideration was given to this section to guarantee that the removal of the exhaust gases does not affect engine performance. The main components of this system include a vacuum pump, hose, nozzle, and muffler. The FSAE designed muffler will be attached to the Honda engine. The engine creates a large amount of noise that will be subdued mostly by the enclosed room, but the muffler will reduce the noise even further. We intend to reduce the noise so that it does not distract anyone in the college of engineering when testing is conducted. Following the muffler, the exhaust gases will enter a nozzle that will increase the velocity of the air from approximately 600FPM at the inlet to 1500FPM at the Plymovent connection.. The nozzle is not directly connected to the muffler but instead will be suspended above it.
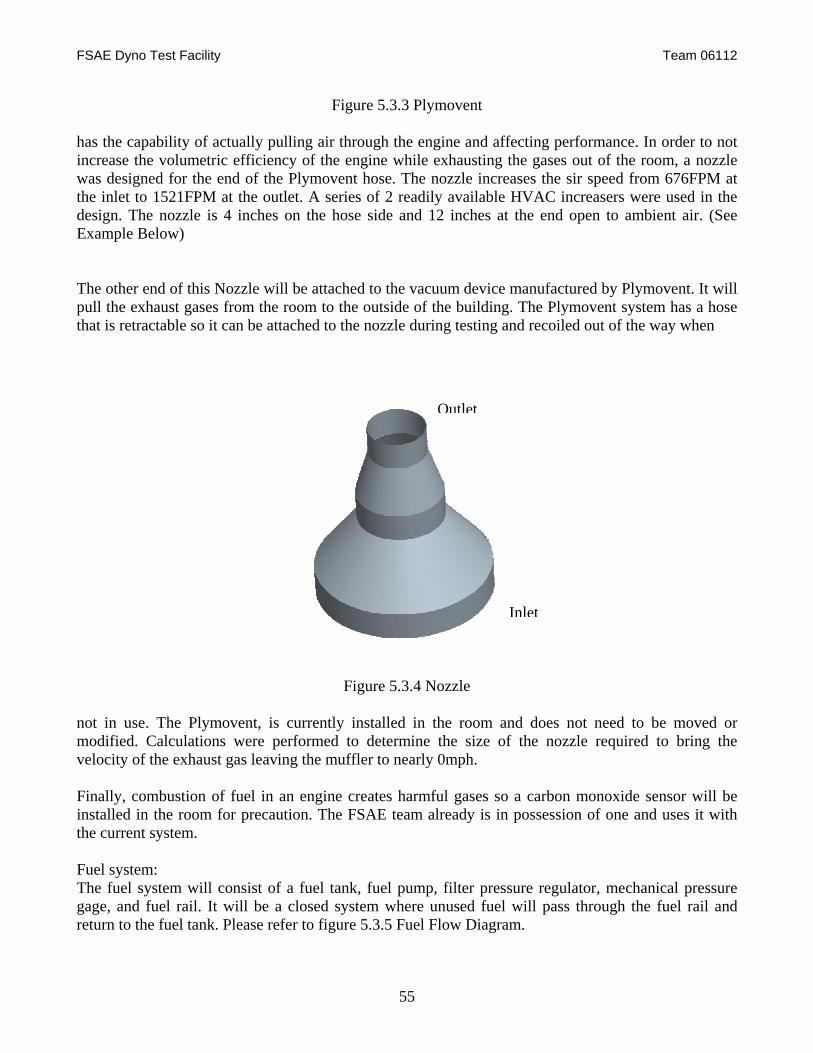
FSAE Dyno Test Facility Team 06112
55
Figure 5.3.3 Plymovent has the capability of actually pulling air through the engine and affecting performance. In order to not increase the volumetric efficiency of the engine while exhausting the gases out of the room, a nozzle was designed for the end of the Plymovent hose. The nozzle increases the sir speed from 676FPM at the inlet to 1521FPM at the outlet. A series of 2 readily available HVAC increasers were used in the design. The nozzle is 4 inches on the hose side and 12 inches at the end open to ambient air. (See Example Below) The other end of this Nozzle will be attached to the vacuum device manufactured by Plymovent. It will pull the exhaust gases from the room to the outside of the building. The Plymovent system has a hose that is retractable so it can be attached to the nozzle during testing and recoiled out of the way when
Figure 5.3.4 Nozzle not in use. The Plymovent, is currently installed in the room and does not need to be moved or modified. Calculations were performed to determine the size of the nozzle required to bring the velocity of the exhaust gas leaving the muffler to nearly 0mph. Finally, combustion of fuel in an engine creates harmful gases so a carbon monoxide sensor will be installed in the room for precaution. The FSAE team already is in possession of one and uses it with the current system. Fuel system: The fuel system will consist of a fuel tank, fuel pump, filter pressure regulator, mechanical pressure gage, and fuel rail. It will be a closed system where unused fuel will pass through the fuel rail and return to the fuel tank. Please refer to figure 5.3.5 Fuel Flow Diagram.
Outlet
Inlet
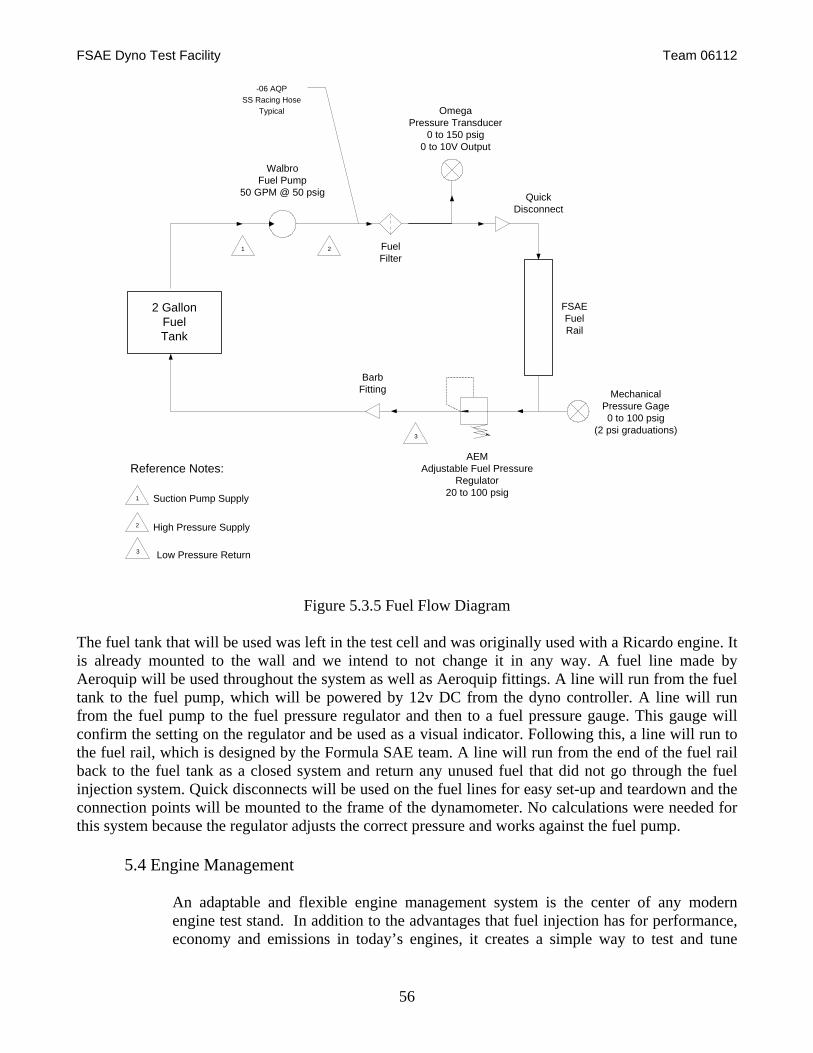
FSAE Dyno Test Facility Team 06112
56
Figure 5.3.5 Fuel Flow Diagram
The fuel tank that will be used was left in the test cell and was originally used with a Ricardo engine. It is already mounted to the wall and we intend to not change it in any way. A fuel line made by Aeroquip will be used throughout the system as well as Aeroquip fittings. A line will run from the fuel tank to the fuel pump, which will be powered by 12v DC from the dyno controller. A line will run from the fuel pump to the fuel pressure regulator and then to a fuel pressure gauge. This gauge will confirm the setting on the regulator and be used as a visual indicator. Following this, a line will run to the fuel rail, which is designed by the Formula SAE team. A line will run from the end of the fuel rail back to the fuel tank as a closed system and return any unused fuel that did not go through the fuel injection system. Quick disconnects will be used on the fuel lines for easy set-up and teardown and the connection points will be mounted to the frame of the dynamometer. No calculations were needed for this system because the regulator adjusts the correct pressure and works against the fuel pump.
5.4 Engine Management
An adaptable and flexible engine management system is the center of any modern engine test stand. In addition to the advantages that fuel injection has for performance, economy and emissions in today’s engines, it creates a simple way to test and tune
2 GallonFuelTank
AEMAdjustable Fuel Pressure
Regulator20 to 100 psig
WalbroFuel Pump
50 GPM @ 50 psig
FSAEFuelRail
FuelFilter
QuickDisconnect
BarbFitting
OmegaPressure Transducer
0 to 150 psig0 to 10V Output
-06 AQPSS Racing Hose
Typical
MechanicalPressure Gage0 to 100 psig
(2 psi graduations)
1 2
3
Suction Pump Supply
High Pressure Supply
Low Pressure Return
1
2
3
Reference Notes:
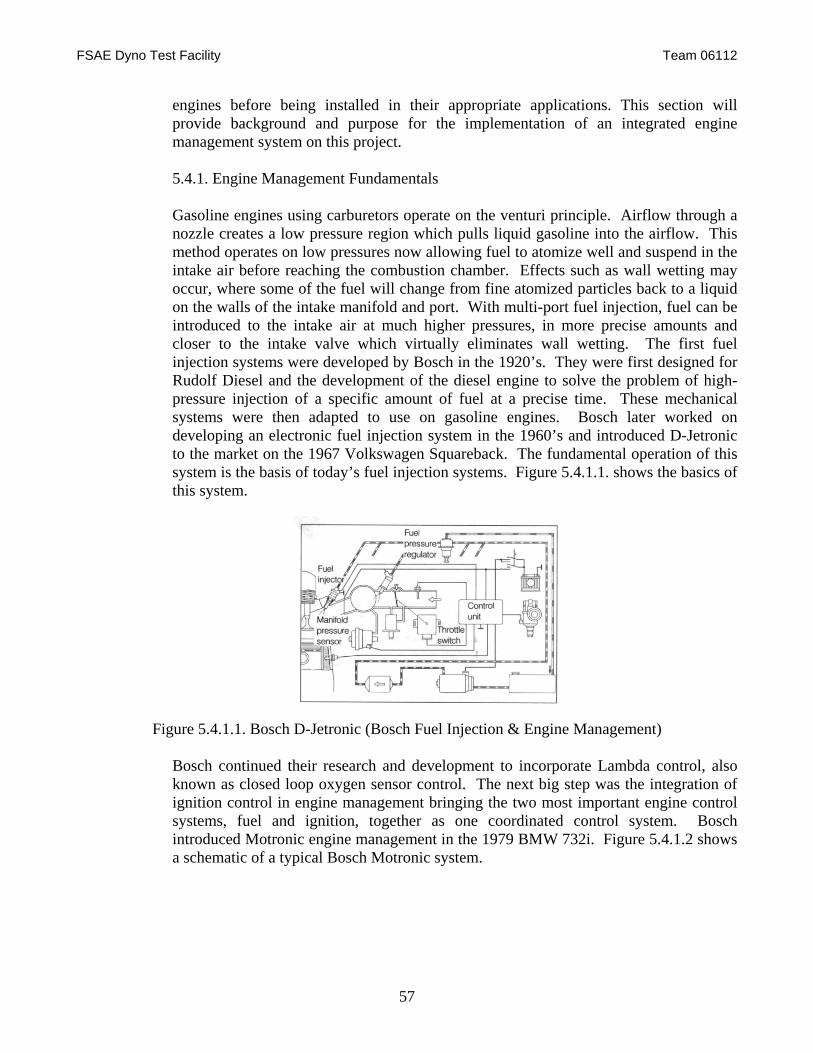
FSAE Dyno Test Facility Team 06112
57
engines before being installed in their appropriate applications. This section will provide background and purpose for the implementation of an integrated engine management system on this project. 5.4.1. Engine Management Fundamentals Gasoline engines using carburetors operate on the venturi principle. Airflow through a nozzle creates a low pressure region which pulls liquid gasoline into the airflow. This method operates on low pressures now allowing fuel to atomize well and suspend in the intake air before reaching the combustion chamber. Effects such as wall wetting may occur, where some of the fuel will change from fine atomized particles back to a liquid on the walls of the intake manifold and port. With multi-port fuel injection, fuel can be introduced to the intake air at much higher pressures, in more precise amounts and closer to the intake valve which virtually eliminates wall wetting. The first fuel injection systems were developed by Bosch in the 1920’s. They were first designed for Rudolf Diesel and the development of the diesel engine to solve the problem of high-pressure injection of a specific amount of fuel at a precise time. These mechanical systems were then adapted to use on gasoline engines. Bosch later worked on developing an electronic fuel injection system in the 1960’s and introduced D-Jetronic to the market on the 1967 Volkswagen Squareback. The fundamental operation of this system is the basis of today’s fuel injection systems. Figure 5.4.1.1. shows the basics of this system.
Figure 5.4.1.1. Bosch D-Jetronic (Bosch Fuel Injection & Engine Management)
Bosch continued their research and development to incorporate Lambda control, also known as closed loop oxygen sensor control. The next big step was the integration of ignition control in engine management bringing the two most important engine control systems, fuel and ignition, together as one coordinated control system. Bosch introduced Motronic engine management in the 1979 BMW 732i. Figure 5.4.1.2 shows a schematic of a typical Bosch Motronic system.
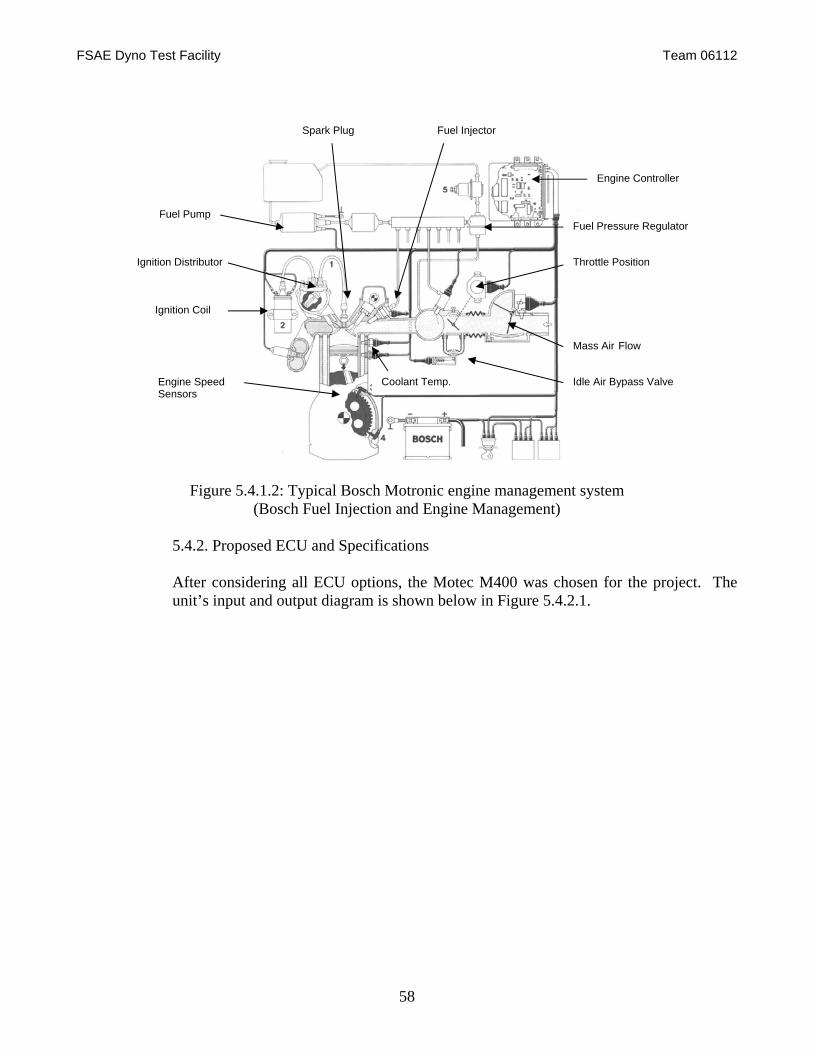
FSAE Dyno Test Facility Team 06112
58
Figure 5.4.1.2: Typical Bosch Motronic engine management system (Bosch Fuel Injection and Engine Management)
5.4.2. Proposed ECU and Specifications After considering all ECU options, the Motec M400 was chosen for the project. The unit’s input and output diagram is shown below in Figure 5.4.2.1.
Ignition Distributor
Fuel Pump
Spark Plug
Mass Air Flow
Engine Controller
Idle Air Bypass Valve
Throttle Position
Fuel Pressure Regulator
Engine Speed Sensors
Ignition Coil
Fuel Injector
Coolant Temp.
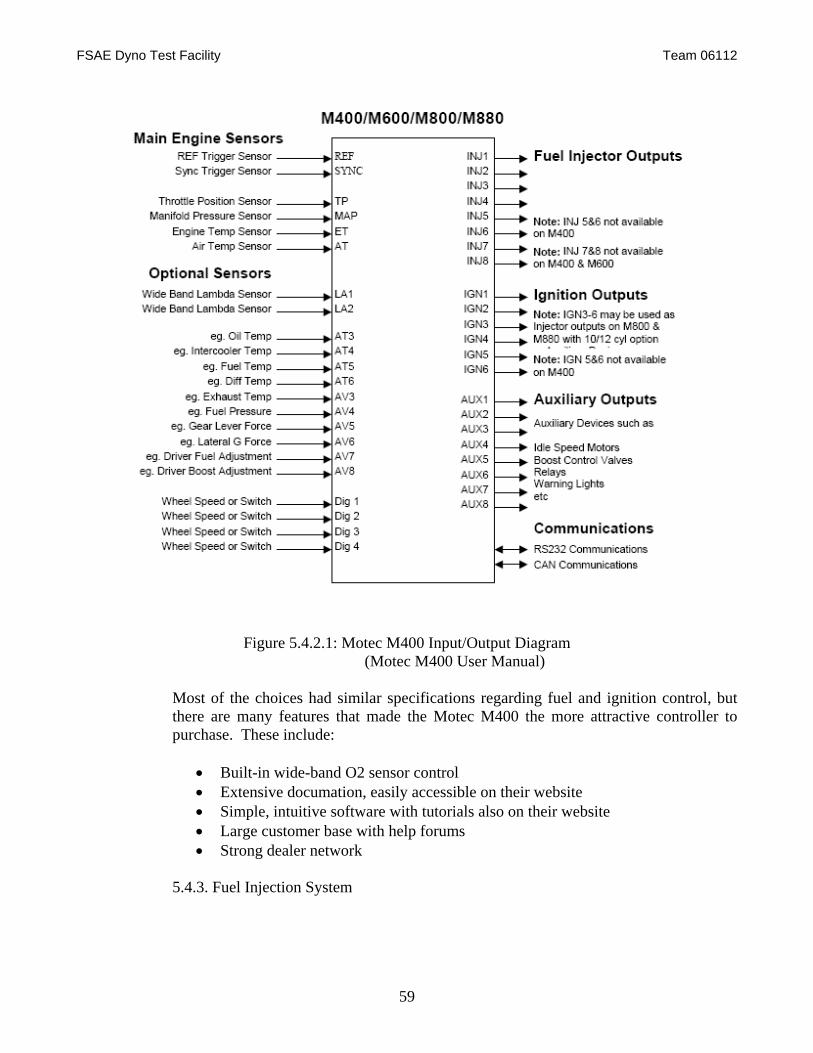
FSAE Dyno Test Facility Team 06112
59
Figure 5.4.2.1: Motec M400 Input/Output Diagram (Motec M400 User Manual)
Most of the choices had similar specifications regarding fuel and ignition control, but there are many features that made the Motec M400 the more attractive controller to purchase. These include:
• Built-in wide-band O2 sensor control • Extensive documation, easily accessible on their website • Simple, intuitive software with tutorials also on their website • Large customer base with help forums • Strong dealer network
5.4.3. Fuel Injection System

FSAE Dyno Test Facility Team 06112
60
The engine controller meters fuel to the engine by changing the pulse width of voltage applied to each fuel injector, which is a simple pintle valve that is actuated by a solenoid. A cross section of a simple fuel injector is shown below in Figure 5.4.3.1.
Figure 5.4.3.1: Fuel Injector
(Bosch Fuel Injection and Engine Management) Pulse width for each injector is obtained from a pre-set table fuel table which is created by the user for the particular engine. This table is based on engine speed and engine load, which will be determined using manifold vacuum. This table can be easily constructed using closed-loop air/fuel ratio control to tune the engine to a pre-determined table of desired air/fuel ratios. The actual ratios desired can vary depending on conditions and a balance between performance, economy, and emissions. In general, air/fuel ratios should be less than stoichiometric when under full load, approximately stoichiometric at partial load, and slightly more than stoichiometric at small loads or vehicle coasting conditions. In addition to the fuel table or map, many compensation tables and values are used to adapt to current or transient conditions. Ambient conditions are compensated by monitoring manifold air temperature and engine coolant temperature. Warm-up multipliers are applied to the map to compensate for more oxygen at colder air temperatures. Other transient compensations include acceleration enrichment, deceleration enleanment, and fuel injection timing. 5.4.4. Ignition System The Motec engine management system uses a user-defined crankshaft reference trigger and a crank index position trigger with either a magnetic reluctor or Hall Effect sensor. Using crank reference for crank speed and the crank index for position at one pulse per two revolutions, the engine controller can determine the precise ignition firing angle. The particular angle comes from a user defined table of values based on engine speed and RPM. These values are determined by empirical testing on the dynamometer under various load cases and engine speeds while holding all other engine values constant. Care must also be taken when switching between fuel types; the line between optimal ignition timing and pre-detonation is very fine.
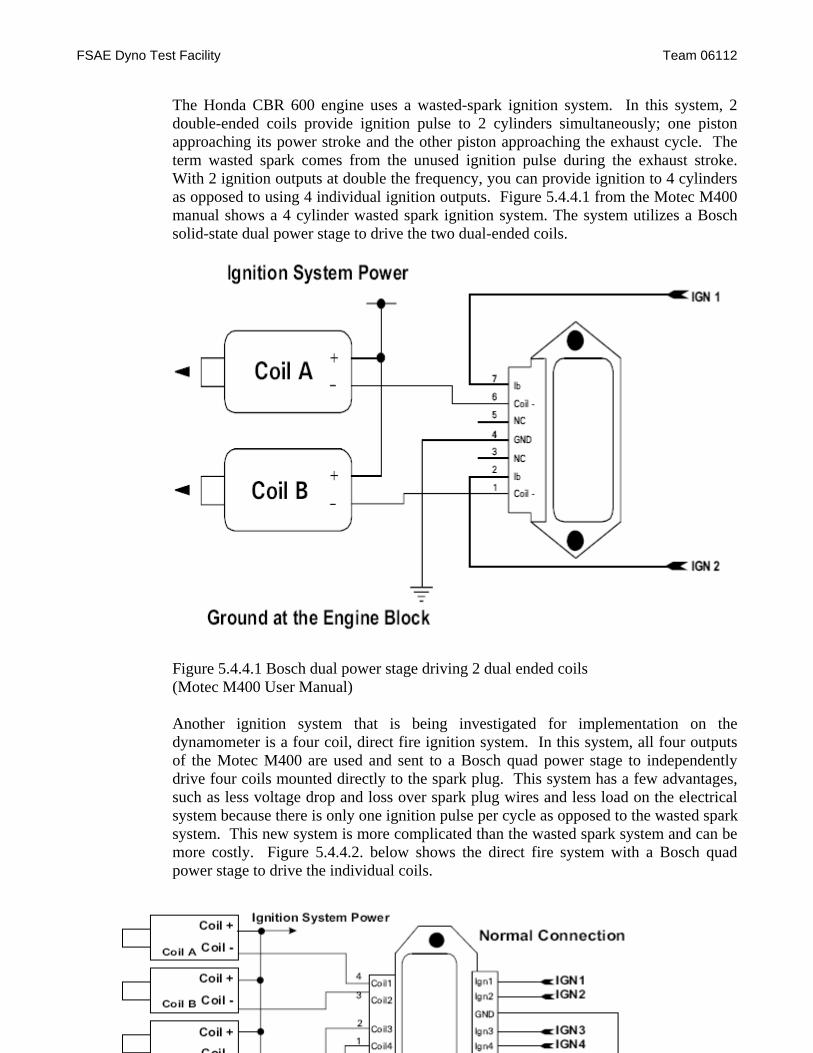
FSAE Dyno Test Facility Team 06112
61
The Honda CBR 600 engine uses a wasted-spark ignition system. In this system, 2 double-ended coils provide ignition pulse to 2 cylinders simultaneously; one piston approaching its power stroke and the other piston approaching the exhaust cycle. The term wasted spark comes from the unused ignition pulse during the exhaust stroke. With 2 ignition outputs at double the frequency, you can provide ignition to 4 cylinders as opposed to using 4 individual ignition outputs. Figure 5.4.4.1 from the Motec M400 manual shows a 4 cylinder wasted spark ignition system. The system utilizes a Bosch solid-state dual power stage to drive the two dual-ended coils.
Figure 5.4.4.1 Bosch dual power stage driving 2 dual ended coils (Motec M400 User Manual) Another ignition system that is being investigated for implementation on the dynamometer is a four coil, direct fire ignition system. In this system, all four outputs of the Motec M400 are used and sent to a Bosch quad power stage to independently drive four coils mounted directly to the spark plug. This system has a few advantages, such as less voltage drop and loss over spark plug wires and less load on the electrical system because there is only one ignition pulse per cycle as opposed to the wasted spark system. This new system is more complicated than the wasted spark system and can be more costly. Figure 5.4.4.2. below shows the direct fire system with a Bosch quad power stage to drive the individual coils.
FSAE Dyno Test Facility Team 06112
62
Figure 5.4.4.2. Bosch quad power stage driving four individual coils.
(Motec M400 User Manual) The team is considering both options at the time and will decide on a system in the near future. Cost impact for the actual project is minimal considering all components can be sourced from RIT Formula SAE and Robert Bosch GmbH.
5.4.5. Lambda Sensor (Wide-Band O2)
In order to tune a fuel map for an engine, the air-fuel ratio or Lambda value must be
known. The simplest way to determine this value is through an oxygen sensor. The
oxygen sensor is a galvanic oxygen concentration cell with a solid state electrolyte, with
one open end and one closed end. Exhaust gases are exposed to the outer cavity and
ambient air is exposed to the inner cavity for a reference gas. The ceramic oxygen cell
conducts oxygen ions at temperatures above 350°C. Differences in oxygen between
ambient air and the exhaust result in a differential voltage between the two surfaces.
This is referred to as the Nernst principle. Wide-band oxygen sensors also use a second
chamber called the pump cell. The pump cell maintains a constant stoichiometric air-
fuel ratio within the Nernst cell. The cell responds to lean exhaust by discharging
oxygen ions from the diffusion gap to the outside but pumps in oxygen from the exhaust
gas into the cell under rich conditions. The current necessary to maintain stoichiometric
conditions inside the cell is measured to determine the oxygen content of the exhaust.
The sensor is also heated to help maintain 600°. Figure 4.5.5.1 shows how the two cells
are arranged with exhaust flow.
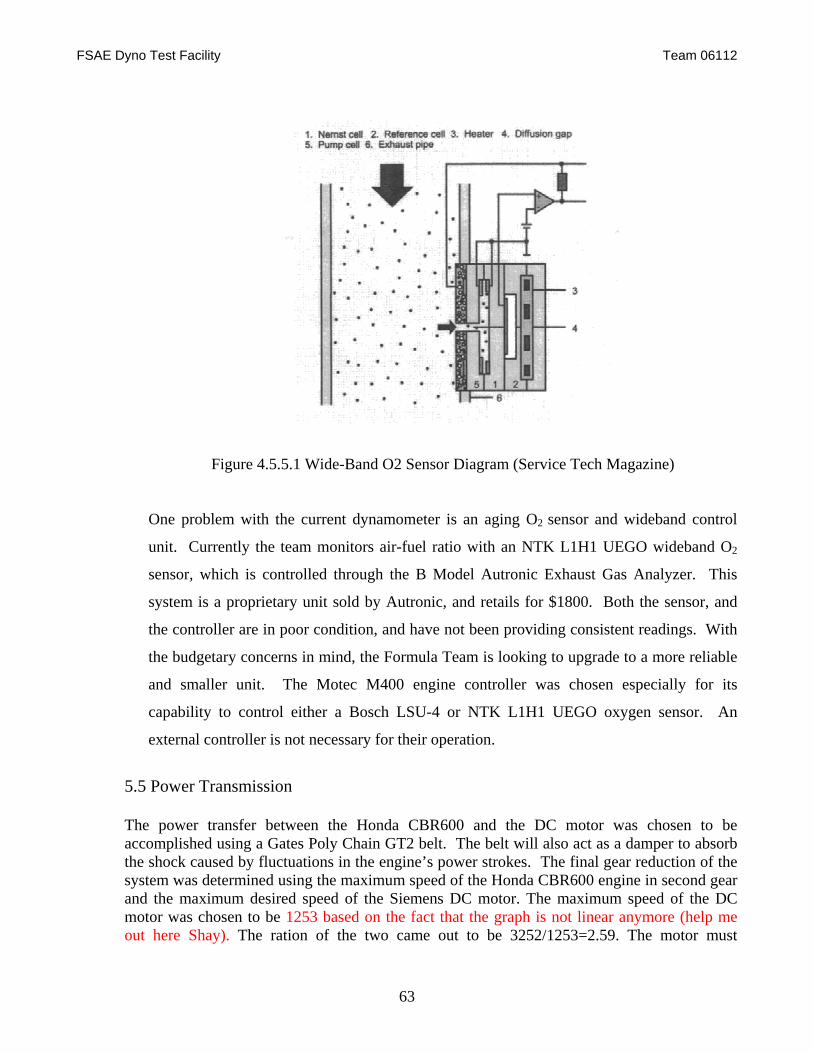
FSAE Dyno Test Facility Team 06112
63
Figure 4.5.5.1 Wide-Band O2 Sensor Diagram (Service Tech Magazine)
One problem with the current dynamometer is an aging O2 sensor and wideband control
unit. Currently the team monitors air-fuel ratio with an NTK L1H1 UEGO wideband O2
sensor, which is controlled through the B Model Autronic Exhaust Gas Analyzer. This
system is a proprietary unit sold by Autronic, and retails for $1800. Both the sensor, and
the controller are in poor condition, and have not been providing consistent readings. With
the budgetary concerns in mind, the Formula Team is looking to upgrade to a more reliable
and smaller unit. The Motec M400 engine controller was chosen especially for its
capability to control either a Bosch LSU-4 or NTK L1H1 UEGO oxygen sensor. An
external controller is not necessary for their operation.
5.5 Power Transmission The power transfer between the Honda CBR600 and the DC motor was chosen to be accomplished using a Gates Poly Chain GT2 belt. The belt will also act as a damper to absorb the shock caused by fluctuations in the engine’s power strokes. The final gear reduction of the system was determined using the maximum speed of the Honda CBR600 engine in second gear and the maximum desired speed of the Siemens DC motor. The maximum speed of the DC motor was chosen to be 1253 based on the fact that the graph is not linear anymore (help me out here Shay). The ration of the two came out to be 3252/1253=2.59. The motor must
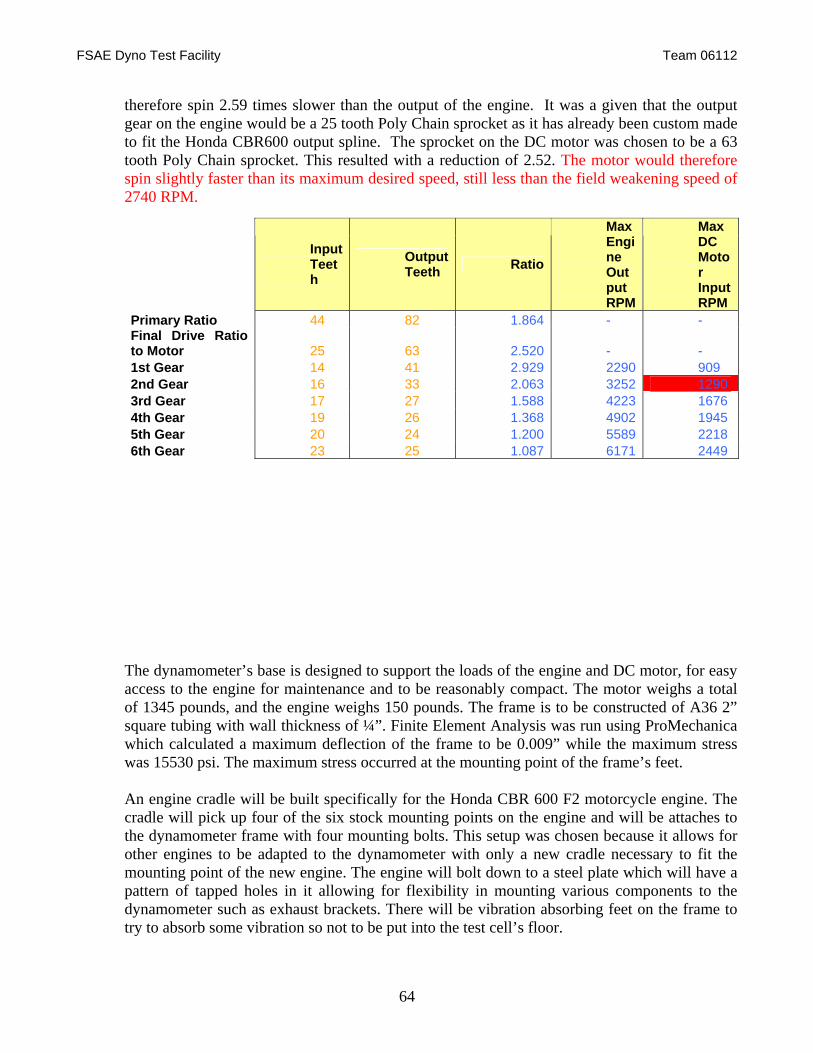
FSAE Dyno Test Facility Team 06112
64
therefore spin 2.59 times slower than the output of the engine. It was a given that the output gear on the engine would be a 25 tooth Poly Chain sprocket as it has already been custom made to fit the Honda CBR600 output spline. The sprocket on the DC motor was chosen to be a 63 tooth Poly Chain sprocket. This resulted with a reduction of 2.52. The motor would therefore spin slightly faster than its maximum desired speed, still less than the field weakening speed of 2740 RPM.
The dynamometer’s base is designed to support the loads of the engine and DC motor, for easy access to the engine for maintenance and to be reasonably compact. The motor weighs a total of 1345 pounds, and the engine weighs 150 pounds. The frame is to be constructed of A36 2” square tubing with wall thickness of ¼”. Finite Element Analysis was run using ProMechanica which calculated a maximum deflection of the frame to be 0.009” while the maximum stress was 15530 psi. The maximum stress occurred at the mounting point of the frame’s feet. An engine cradle will be built specifically for the Honda CBR 600 F2 motorcycle engine. The cradle will pick up four of the six stock mounting points on the engine and will be attaches to the dynamometer frame with four mounting bolts. This setup was chosen because it allows for other engines to be adapted to the dynamometer with only a new cradle necessary to fit the mounting point of the new engine. The engine will bolt down to a steel plate which will have a pattern of tapped holes in it allowing for flexibility in mounting various components to the dynamometer such as exhaust brackets. There will be vibration absorbing feet on the frame to try to absorb some vibration so not to be put into the test cell’s floor.
Input Teeth
Output Teeth Ratio
Max Engine Output RPM
Max DC Motor Input RPM
Primary Ratio 44 82 1.864 - - Final Drive Ratio to Motor 25 63 2.520 - - 1st Gear 14 41 2.929 2290 909 2nd Gear 16 33 2.063 3252 1290 3rd Gear 17 27 1.588 4223 1676 4th Gear 19 26 1.368 4902 1945 5th Gear 20 24 1.200 5589 2218 6th Gear 23 25 1.087 6171 2449
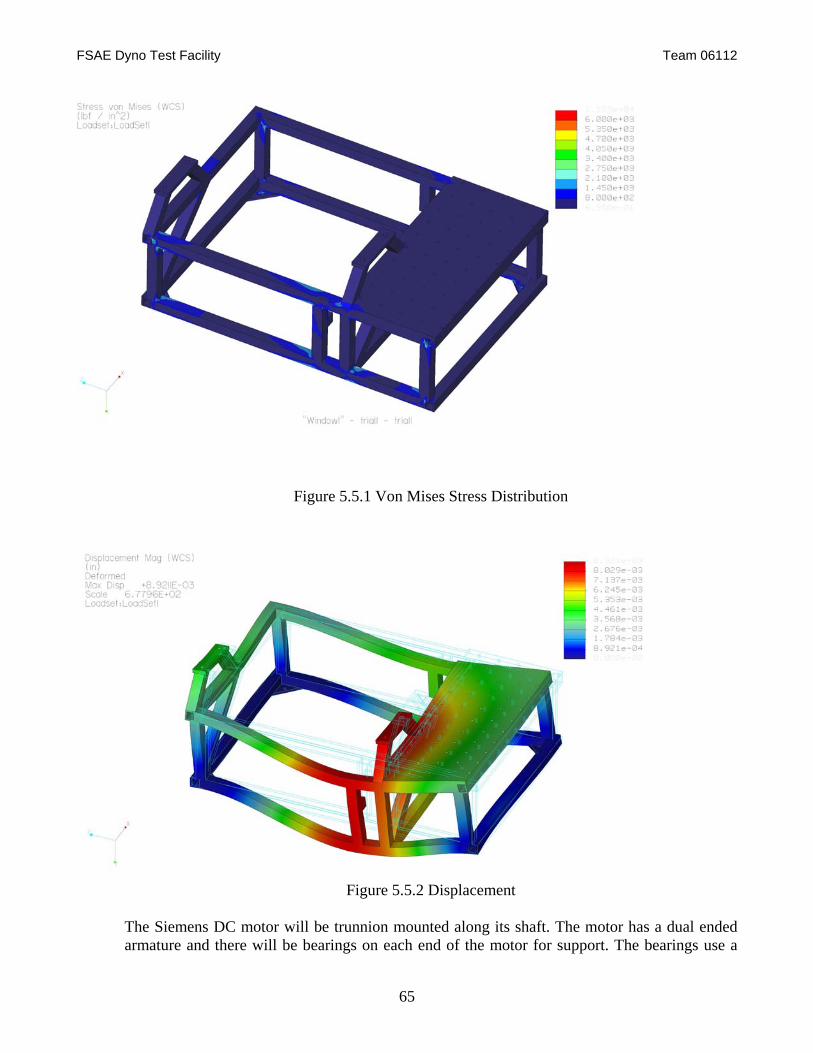
FSAE Dyno Test Facility Team 06112
65
Figure 5.5.1 Von Mises Stress Distribution
Figure 5.5.2 Displacement
The Siemens DC motor will be trunnion mounted along its shaft. The motor has a dual ended armature and there will be bearings on each end of the motor for support. The bearings use a
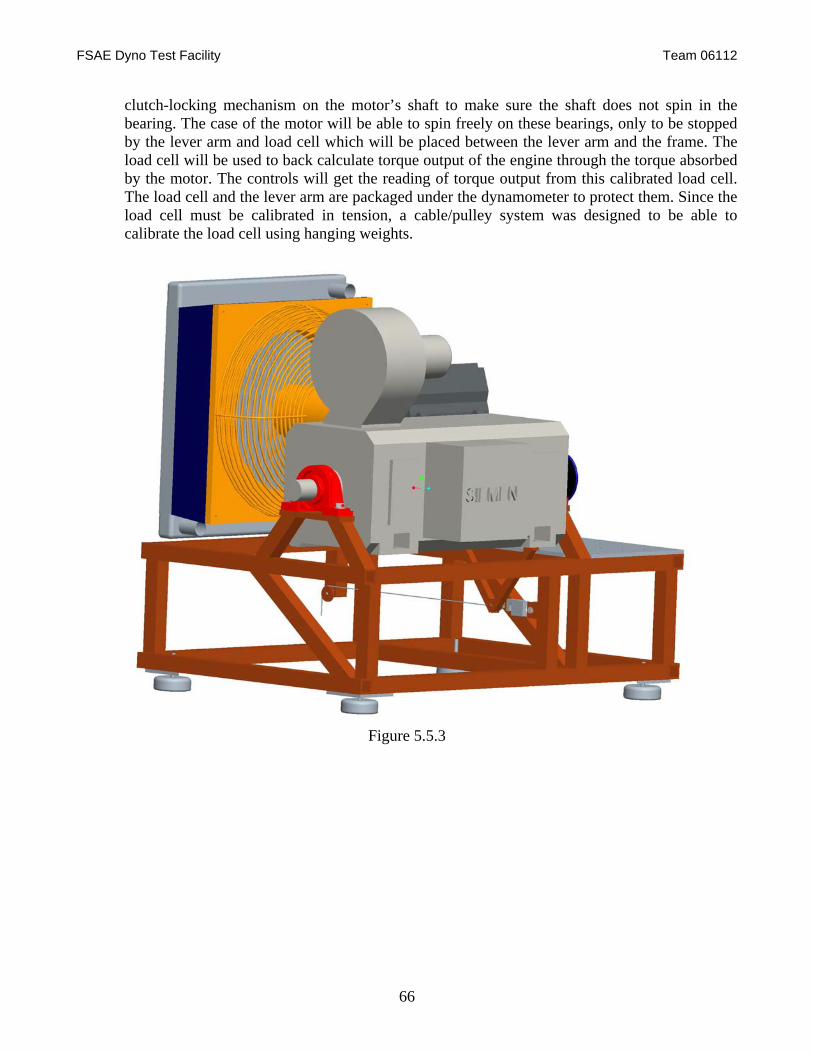
FSAE Dyno Test Facility Team 06112
66
clutch-locking mechanism on the motor’s shaft to make sure the shaft does not spin in the bearing. The case of the motor will be able to spin freely on these bearings, only to be stopped by the lever arm and load cell which will be placed between the lever arm and the frame. The load cell will be used to back calculate torque output of the engine through the torque absorbed by the motor. The controls will get the reading of torque output from this calibrated load cell. The load cell and the lever arm are packaged under the dynamometer to protect them. Since the load cell must be calibrated in tension, a cable/pulley system was designed to be able to calibrate the load cell using hanging weights.
Figure 5.5.3
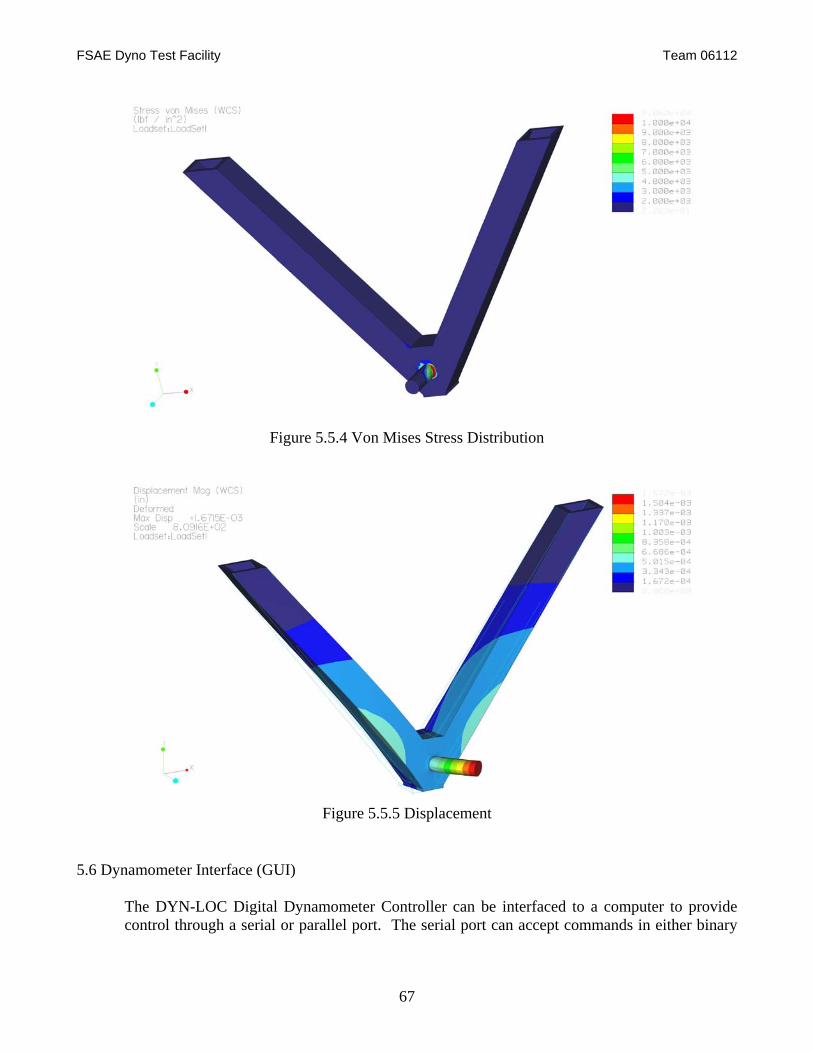
FSAE Dyno Test Facility Team 06112
67
Figure 5.5.4 Von Mises Stress Distribution
Figure 5.5.5 Displacement
5.6 Dynamometer Interface (GUI)
The DYN-LOC Digital Dynamometer Controller can be interfaced to a computer to provide control through a serial or parallel port. The serial port can accept commands in either binary
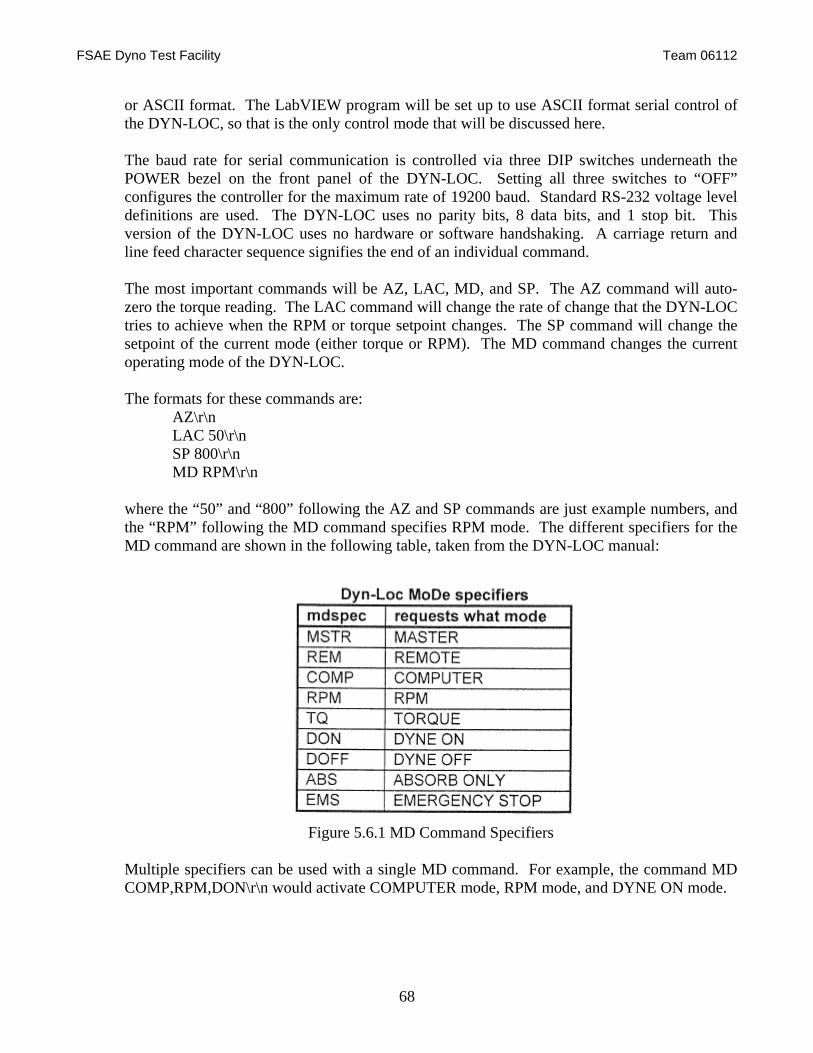
FSAE Dyno Test Facility Team 06112
68
or ASCII format. The LabVIEW program will be set up to use ASCII format serial control of the DYN-LOC, so that is the only control mode that will be discussed here. The baud rate for serial communication is controlled via three DIP switches underneath the POWER bezel on the front panel of the DYN-LOC. Setting all three switches to “OFF” configures the controller for the maximum rate of 19200 baud. Standard RS-232 voltage level definitions are used. The DYN-LOC uses no parity bits, 8 data bits, and 1 stop bit. This version of the DYN-LOC uses no hardware or software handshaking. A carriage return and line feed character sequence signifies the end of an individual command. The most important commands will be AZ, LAC, MD, and SP. The AZ command will auto-zero the torque reading. The LAC command will change the rate of change that the DYN-LOC tries to achieve when the RPM or torque setpoint changes. The SP command will change the setpoint of the current mode (either torque or RPM). The MD command changes the current operating mode of the DYN-LOC. The formats for these commands are: AZ\r\n LAC 50\r\n SP 800\r\n MD RPM\r\n where the “50” and “800” following the AZ and SP commands are just example numbers, and the “RPM” following the MD command specifies RPM mode. The different specifiers for the MD command are shown in the following table, taken from the DYN-LOC manual:
Figure 5.6.1 MD Command Specifiers
Multiple specifiers can be used with a single MD command. For example, the command MD COMP,RPM,DON\r\n would activate COMPUTER mode, RPM mode, and DYNE ON mode.
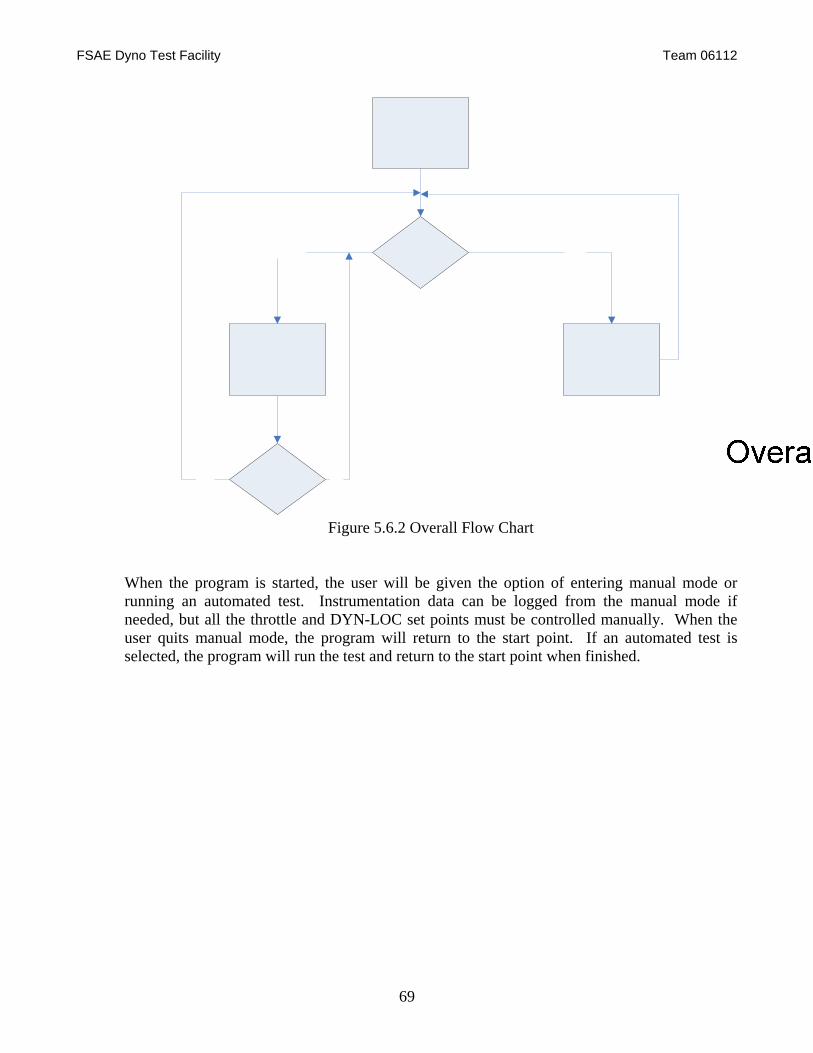
FSAE Dyno Test Facility Team 06112
69
Figure 5.6.2 Overall Flow Chart
When the program is started, the user will be given the option of entering manual mode or running an automated test. Instrumentation data can be logged from the manual mode if needed, but all the throttle and DYN-LOC set points must be controlled manually. When the user quits manual mode, the program will return to the start point. If an automated test is selected, the program will run the test and return to the start point when finished.
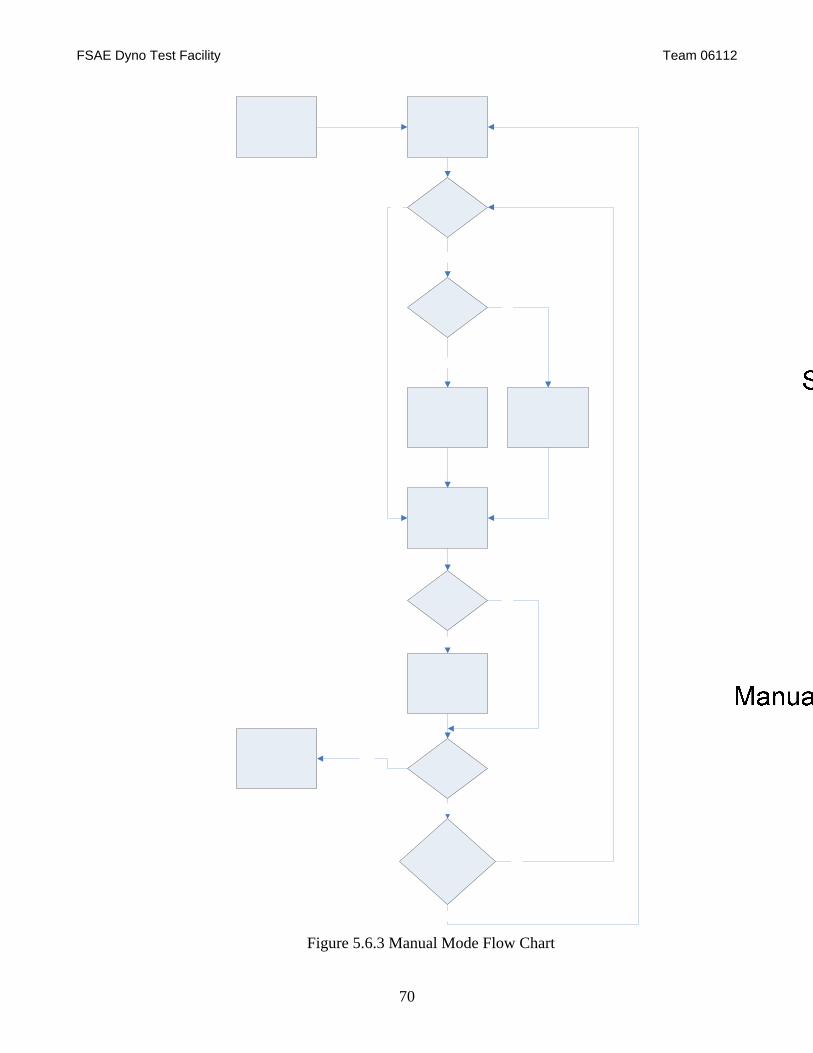
FSAE Dyno Test Facility Team 06112
70
Figure 5.6.3 Manual Mode Flow Chart
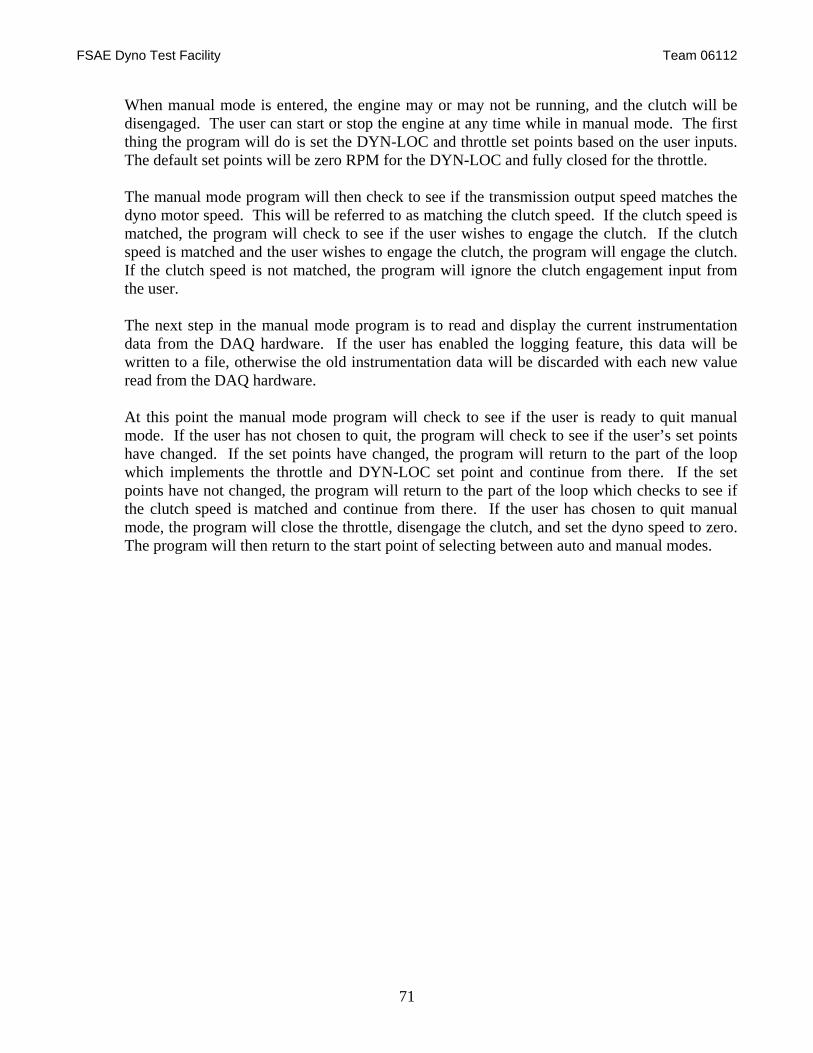
FSAE Dyno Test Facility Team 06112
71
When manual mode is entered, the engine may or may not be running, and the clutch will be disengaged. The user can start or stop the engine at any time while in manual mode. The first thing the program will do is set the DYN-LOC and throttle set points based on the user inputs. The default set points will be zero RPM for the DYN-LOC and fully closed for the throttle. The manual mode program will then check to see if the transmission output speed matches the dyno motor speed. This will be referred to as matching the clutch speed. If the clutch speed is matched, the program will check to see if the user wishes to engage the clutch. If the clutch speed is matched and the user wishes to engage the clutch, the program will engage the clutch. If the clutch speed is not matched, the program will ignore the clutch engagement input from the user. The next step in the manual mode program is to read and display the current instrumentation data from the DAQ hardware. If the user has enabled the logging feature, this data will be written to a file, otherwise the old instrumentation data will be discarded with each new value read from the DAQ hardware. At this point the manual mode program will check to see if the user is ready to quit manual mode. If the user has not chosen to quit, the program will check to see if the user’s set points have changed. If the set points have changed, the program will return to the part of the loop which implements the throttle and DYN-LOC set point and continue from there. If the set points have not changed, the program will return to the part of the loop which checks to see if the clutch speed is matched and continue from there. If the user has chosen to quit manual mode, the program will close the throttle, disengage the clutch, and set the dyno speed to zero. The program will then return to the start point of selecting between auto and manual modes.
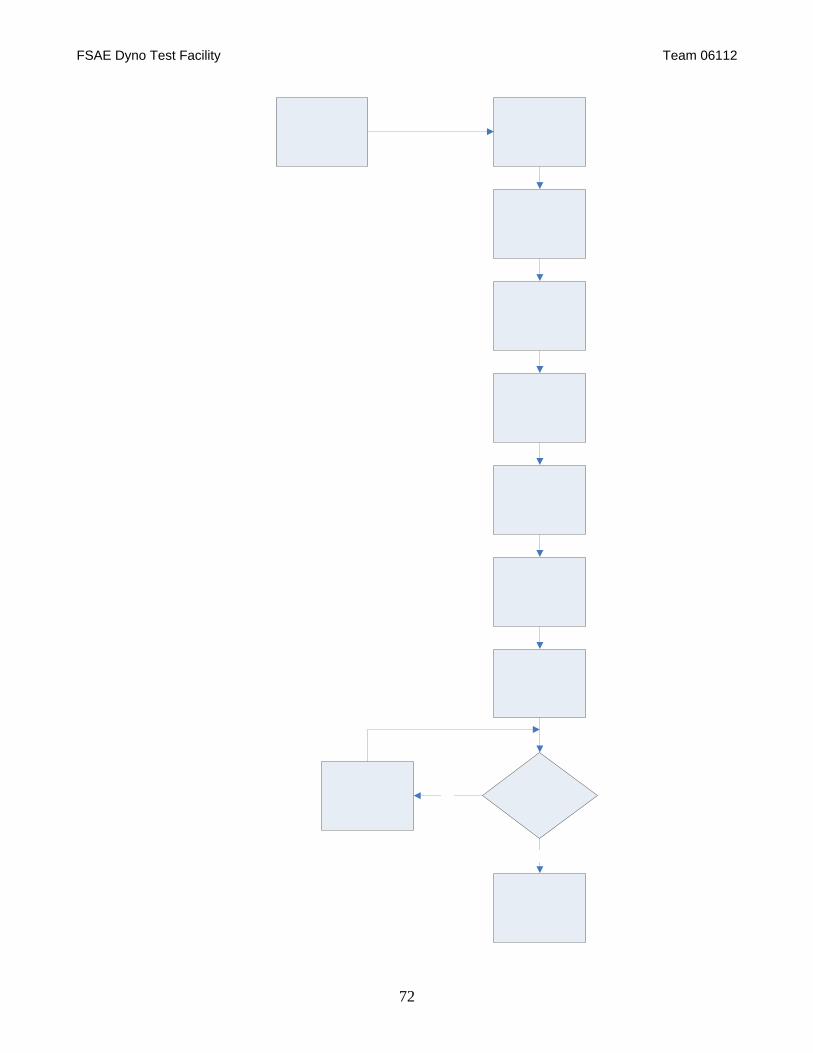
FSAE Dyno Test Facility Team 06112
72
FSAE Dyno Test Facility Team 06112
73
Figure 5.6.4 Automatic (Dyno Run) Mode Flow Chart
The first auto test mode is a regular dyno run. For both auto modes it is assumed that the engine is running and the clutch is disengaged before starting the test. The first step in this mode will be to get the start and end RPM set points from the user. The program will then match the clutch speed and engage the clutch. The dyno will then be set to the initial RPM set point, and the LAC (rate of RPM change) will be set. At this point the program will open the throttle, begin logging data, and send the second RPM set point to the DYN-LOC, and the dyno speed will ramp from the initial set point to the final set point. The program will continuously check to see if the final RPM endpoint has been reached. If the final RPM has not been reached, the program will continue logging data. If the final RPM point has been reached, the program will close the throttle, disengage the clutch, set the dyno speed to zero, and then return to the start point of selecting between auto and manual modes.
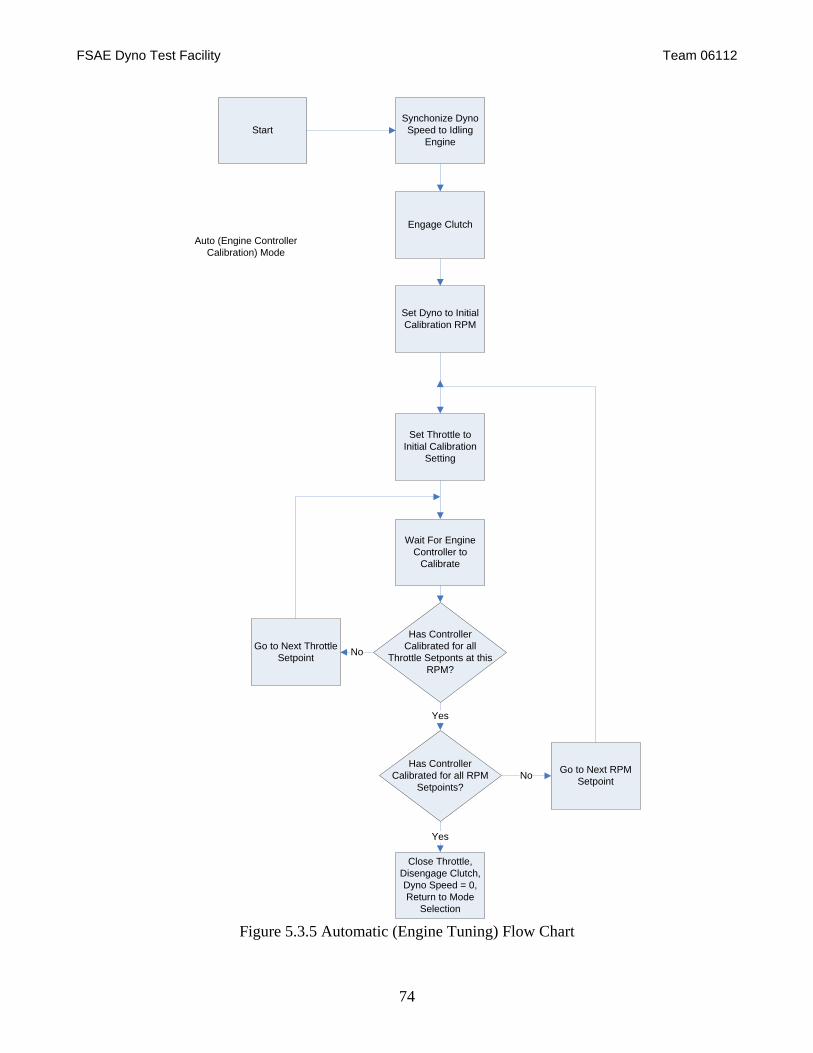
FSAE Dyno Test Facility Team 06112
74
StartSynchonize Dyno
Speed to Idling Engine
Engage Clutch
Set Dyno to Initial Calibration RPM
Set Throttle to Initial Calibration
Setting
Wait For Engine Controller to
Calibrate
Has Controller Calibrated for all
Throttle Setponts at this RPM?
Go to Next Throttle Setpoint No
Has Controller Calibrated for all RPM
Setpoints?
Yes
Go to Next RPM SetpointNo
Close Throttle, Disengage Clutch, Dyno Speed = 0,Return to Mode
Selection
Yes
Auto (Engine Controller Calibration) Mode
Figure 5.3.5 Automatic (Engine Tuning) Flow Chart

FSAE Dyno Test Facility Team 06112
75
The second auto test mode is the engine controller auto calibration mode. Again, it is assumed that the engine is running and the clutch is disengaged before starting the test. This test involves cycling the engine through several load conditions at several RPM set points so that the ECU can optimize its fuel injection map. This test is not presently intended to be a data logging test, although that feature can be added if necessary. The first step in this test is to match the clutch speed and engage the clutch. The dyno will then be set to the initial calibration RPM. Next, the throttle will be set to achieve the initial load condition for that RPM. After the parameters have been met, the program will wait the necessary amount of time for the ECU to calibrate at that set point. After calibration is complete at that setpoint, the program will check to see if the ECU has been calibrated for all the load levels/throttle set points for that RPM. If not, the program will adjust the throttle to achieve the next set point and loop back to the point where it waits for the ECU to calibrate. If the ECU has been calibrated for all the load levels/throttle set points at that RPM, the program will then determine if the ECU has been calibrated for all the necessary RPM set points. If not, the program will set the dyno to the next RPM set point and then loop back to the point in the program that sets the initial load level/throttle position for that rpm. If the final RPM has been calibrated, the program will close the throttle, disengage the clutch, set the dyno speed to zero, and return to the start point of selecting between auto and manual modes. Figure 5.6.6 shows a proposed mock-up of the GUI control panel for manual mode. Instrumentation is kept to a minimum to allow easy reading of the most critical engine parameters. An option is given to log data during manual mode; setpoint controls for the Dyn-Loc and throttle are included. The emergency stop button is the most prominent control so that the user can activate it very easily in the event of an emergency. The control panels for the automatic modes will be very similar to the manual mode control package shown.
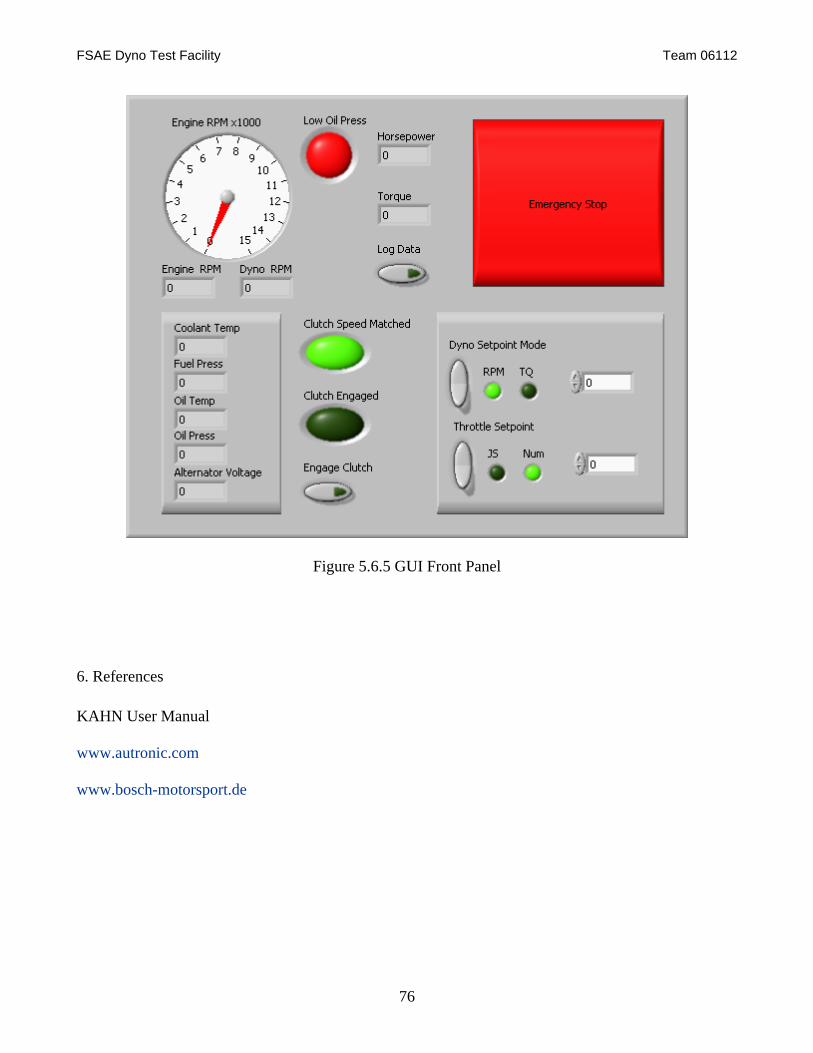
FSAE Dyno Test Facility Team 06112
76
Figure 5.6.5 GUI Front Panel 6. References KAHN User Manual www.autronic.com www.bosch-motorsport.de