sense and avoid uas project final design report
TRANSCRIPT
Sense and Avoid UAS Project
Final Design Report
Team Members
Katie Peticolas - [email protected]
Cesia Cazares - [email protected] Trevor Elsbree - [email protected]
Courtney Smith - [email protected]
Herberth (Elie) Navas - [email protected]
Project Advisor
Lee McFarland - [email protected]
Multidisciplinary Senior Project California Polytechnic State University
San Luis Obispo June 2015
© 2015 Katie Peticolas, Cesia Cazares, Trevor Elsbree, Courtney Smith, and Herberth (Elie) Navas

ENGR459/460/461 Senior Design Project 2014-2015
1
Statement of Disclaimer Since this project is a result of a class assignment, it has been graded and accepted
as fulfillment of the course requirements. Acceptance does not imply technical
accuracy or reliability. Any use of information in this report is done at the risk of the
user. These risks may include catastrophic failure of the device or infringement of
patent or copyright laws. California Polytechnic State University at San Luis Obispo
and its staff cannot be held liable for any use or misuse of the project.

ENGR459/460/461 Senior Design Project 2014-2015
2
Table of Contents List of Tables List of Figures List of Nomenclature Executive Summary Chapter 1. Introduction
A. Sponsor Background and Needs
B. Formal Problem Definition
C. Objective and Specification Development
D. Project Management
E. Potential Users
Chapter 2. Background
A. Existing Products and Competitor Information
NASA U.S. Navy U.S. Air Force General Dynamics Robotic Systems The Brigham-Young University YINSAR System General Atomics Integrated Robotics ImSAR The Sandia National Labs SAR System R-3 Engineering Automobile Collision Avoidance Systems Google Car Technology
B. Current State of the Art
C. Specific Technical Data
D. Applicable Regulations
Chapter 3. Design Development
A. Options for Conceptual Design
Important System Parameters Sensor Circuit Microcontroller Housing Battery Decision Matrix
B. Supporting Preliminary Analysis
Analysis for Initial Component Selection Analysis for Final Component Selection
C. Final Selection of Components
Sensor Circuit Microcontroller Housing

ENGR459/460/461 Senior Design Project 2014-2015
3
Battery D. Proof of Concept Analysis
E. Design Process
Chapter 4. Description of the Final Design
A. Layout of Final Concept
B. Mounting Components
Battery Arduino and Breadboard Sensor Mounting Bracket
C. Wiring Configuration
D. System Operation
State Machine Diagram Process Diagram Control System Block Diagrams
E. Microcontroller Software
F. Algorithm Development
G. Analysis Results
H. Prototype Cost Analysis
I. Safety Considerations
Radar Emissions System Failure
J. System Risks
Radar Interference Operating COnditions Lack of Vertical Data Output
K. Maintenance and Repair Considerations
Chapter 5. Product Realization
A. Plan for Manufacturing
Component Manufacturing Wires Mounting Bracket System Assembly
B. Actual System Assembly
C. Testing Assembly
D. System Wiring
E. Recommendations for Future Manufacturing
F. Manufacturing Cost Analysis
Chapter 6. System Testing
A. Testing Plan
Power System Ground Interference Ideal Target Material Determining Actual Field of View Target Elevation Changes Detection of Different Sized Targets Multiple Targets Detection Velocity Detection Future Testing
B. Test Results

ENGR459/460/461 Senior Design Project 2014-2015
4
Sensor Characterization Ground Interference Distance Testing Conclusion
C. Specification Verification Checklist
Chapter 7. Conclusions and Recommendations Acknowledgements References
Radar Resources Search and Avoid Resources Regulation Resources Component Resources Picture Resources
Appendix
Appendix I. Sensor Evaluation Appendix II. Quality Function Deployment Appendix III. Sensor Exploded View Appendix IV. Sensor Dimensioned Drawing Appendix V. Sensor Beam Sign Conventions Appendix VI. Sensor Vehicle Connector Dimensioned Drawing Appendix VII. Sensor Cable Schematics Appendix VIII. Plastic Plate Solid Model Appendix IX. Mounting Bracket Dimensioned Drawing Appendix X. Purchase Order for Continental Appendix XI. Sensor Costs for Mass Production Appendix XII. Continental Sensor Information (Email Correspondence) Appendix XIII. Sensor Specifications Appendix XIV. Sensor Field of View Specifications Appendix XV. Sensor CAN Network Appendix XVI. Sensor Protective Circuit for Power Supply Input and Wakeup Appendix XVII. Sensor Key Electrical Data Appendix XVIII. Circuit Calculations Appendix XIX. Safe Work Procedure Appendix XX. Detailed Testing Procedure Appendix XXI. Gantt Chart

ENGR459/460/461 Senior Design Project 2014-2015
5
List of Tables
1. Requirements
2. Arduino Uno Specifications
3. TI MSP430 Launch Pad Specifications
4. Raspberry Pi Specifications
5. State Transition Table (from state machine diagram)
6. Research and Development Costs
7. Pinout of Continental Sensor
8. Cost per Unit of Product (for mass production)

ENGR459/460/461 Senior Design Project 2014-2015
6
List of Figures
1. Potential users and benefits.
2. Functional block diagram of MicroSAR.
3. MicroSAR system configuration.
4. ImSAR/NanoSAR system.
5. Sandia national Laboratories Evolution of SAR.
6. AWAS system developed by R-3 Engineering.
7. Decision matrix with listed considerations and their ranks.
8. a) Continental ARS 308. b) Back side of sensor.
9. Circuit design powering sensor with battery and voltage regulators.
10. Solid model of Arduino Uno.
11. Solid model of the batter chosen.
12. Project timeline.
13. Solid model of flat plate concept along with configuration of components.
14. Mounting case for the Arduino and breadboard.
15. Solid model of Arduino and circuit case assembly.
16. Solid model of breadboard with resistors.
17. Solid model of sensor mounting bracket.
18. Black box diagram.
19. 11-bit CAN opcode.
20. Simple state machine diagram depicting operation of system.
21. Process diagram depicting how the system operates.
22. Control system block diagram.
23. System algorithm flowchart.
24. Detailed system state machine diagram.
25. Avoidance algorithm flowchart.
26. System assembly.
27. PVC testing apparatus.
28. Close up, bottom view of box, bracket, steel rotation ring, and PVC
connections.
29. Close up, top view of bracket, bolt, and box connection.
30. Test location.
31. Data output being monitored by team members during testing.
32. Number of targets detected by the sensor when oriented to point straight at
the sky.
33. Number of targets detected by the sensor when oriented so that the sensor’s
beam was parallel to the flat ground.
34. Testing with sensor beam directed parallel to the slope of a hill.
35. Number of targets detected by the sensor when oriented so the sensor beam
was pointed parallel to a slope at a flat portion of ground.
36. Number of targets detected during distance testing.
37. Distances of target from sensor.
38. Filtered data showing target distances from sensor.
39. Unfiltered distance data including zero target points.
40. Filtered distance data including zero target points.
ENGR459/460/461 Senior Design Project 2014-2015
7
List of Nomenclature
ABSAA Airborne Sense and Avoid COA Certificate of Authorization CSU California State Universities FAA Federal Aviation Administration FCC Federal Communications Commission QFD Quality Function Deployment SWaP Size Weight and Power UAS Unmanned Aerial System I Current [Amps] R Resistance [Ohms] V Voltage [Volts]

ENGR459/460/461 Senior Design Project 2014-2015
8
Executive Summary The goal of this project was to evaluate if radar sensors used in high-end automobile
cruise control systems could be utilized in an unmanned aerial system (UAS) for a
sense and avoid function. The Federal Aviation Administration (FAA) recently
conveyed its opposition to commercial use of UAS largely because of a lack of ability
to ‘see and avoid’ other airborne traffic. Thus, the FAA decided to halt operation of
UAS for commercial purposes unless the system has an FAA approved exemption.
These exemptions have strict rules for where and when a UAS can be flown in order
to protect other users of the airspace. This project includes four different working phases. These reflect the process the
team used to approach the project. The phases are research, design and
manufacturing, testing, and data analysis. It is important to note that these refer to
general overviews of very complex processes. Each phase is briefly discussed below. At the start of this project, none of the team members had any experience with how
radar functions or the applications that it could be used in. Since the project is
centered around radar the team needed to complete extensive research on radar
function, as well as the various applications that radar is currently being used in.
Additionally, the team needed to become familiar with the domain of UAS. This
included knowledge of the regulations currently being posted by the FAA as well as
the basics of how to operate UAS. Once the project’s goal was understood, the team needed to complete further
research on various components that could be used to assemble a sense and avoid
system. This project was a proof of concept rather than a design project, so the team
knew the system would largely be composed of commercial off the shelf
components. Therefore, detailed research and evaluation of each component was
completed in order to determine which would be integrated into the system. Choosing the components required a balance between performance, cost, and ability
to integrate with the rest of the system. Once the components were chosen and
ordered, the team began to construct a plan for how to assemble the components.
While the team was waiting for parts to arrive test plans were constructed, test
apparatus was designed, and various data analysis tools were compiled. Once all of the components arrived, the team assembled the system, albeit in a
slightly different manner than originally planned. The system was prepared for
testing, then the team was able to start executing the test plan. The team was not
able to complete all of the tests because of time constraints. However, the team
examined the test plans and chose to execute those which would give the most
useful information to the project’s sponsor. These included sensor characterization,
ground interference testing, and distance testing. Data analysis was done on all the
data collected and the results are included below. Due to the limited amount of testing completed, the team does not feel comfortable
making a recommendation on the suitableness of radar for sense and avoid systems
in small UAS. The team completed detailed documentation of all research and testing
in the hopes that this project will be passed on to another group. Hopefully this
group will then be able to finish testing and give the sponsor more test results and a
more educated recommendation.

ENGR459/460/461 Senior Design Project 2014-2015
9
Chapter 1. Introduction
A. Sponsor Background and Needs
A sponsor proposed this project to determine if consumer available technology found
in cars could be adapted for use in small unmanned aircraft. The sponsor wants the
team to evaluate the performance of a radar sensor currently being used in luxury
automobiles, in order to ascertain if such a system could be viable for a sense and
avoid application in UAS. The sponsor is interested in an analytical report and
presentation of the team’s findings so that the sponsor can assess the potential of
the system.
B. Formal Problem Definition
The purpose of this project is to evaluate and demonstrate the suitability, or
unsuitability, of a system. The system in question is a small, inexpensive radar
sensor currently being used as part of an automatic control system in luxury
automobiles. The team will determine if this could be utilized as part of a sense and
avoid system in a small unmanned aircraft.
C. Objective and Specification Development
The team will develop a prototype system to evaluate the possible benefits of this
concept and to examine potential system integration. The goal is to create a robust
data acquisition system to enable precise data analysis. The team plans on
completing detailed documentation of all testing processes in order to give the
sponsor as much useful data as possible. Additionally, analyses of this data will be
completed to give the sponsor meaningful information. This will allow him to more
easily evaluate the potential of the system. The project objectives are shown in the list below: - Evaluate available SWaP (Size,Weight and Power) on small UAS for sense and avoid
sensor - Evaluate a radar sensor for use as an airborne sense and avoid sensor - Develop a suitable example system implementation - Test the system in order to evaluate potential use in sense and avoid applications Examining these objectives allowed the team to determine which aspects of the
system were the most important. From that, the team was able to start compiling
important specifications and setting those values as requirements for the system.
These requirements are discussed in detail in the following chapter.
D. Project Management The team developed a project management strategy at the beginning of the year to
ensure that work would be accomplished in a timely and efficient manner. First, the
team assigned different administrative roles to each person. Five different roles were
designated: chief financial officer, internal relations officer, records management
officer, external relations officer, and chief operations officer.

ENGR459/460/461 Senior Design Project 2014-2015
10
Herberth (Elie) Navas was assigned to the position of chief financial officer. He was
responsible for managing the money available to the team through the sponsor. This
includes talking to Dr. Laiho about how to access that money. Navas was responsible
for keeping track of the money being spent and what it was being spent on, as well
as filing away receipts from purchases. All this information was kept in the group’s
Google Drive where it was accessible to all members. The position of internal relations officer was filled by Trevor Elsbree. He was
responsible for staying in contact with all members of the group. He scheduled
meeting times and always had a general idea what was being worked on so that he
could be an information source for anyone who missed previous meetings. He also
created and maintained the Google Calendar for the group. The records management officer was Courtney Smith. She was in charge of taking
notes at every meeting and logging the minutes. She also took attendance at each
meeting and kept an updated excel sheet of all the meeting days, times, and
attendance. All her notes were uploaded to the Google Drive folder so the group
would have access to the information. Courtney’s other duties included printing out
all documents to be turned in and emailing Professor McFarland any assignments
collected through email. Cesia Cazares took over the external relations officer position. She was the point of
contact for all outside sources. She was responsible for staying in contact with the
sponsor. This included scheduling meeting times, gathering questions from the team
and communicating them to the sponsor, and updating the sponsor on the progress
being made. She was also responsible for being in contact with any other outside
resources the team chose to utilize. Finally, the chief operations officer position was filled by Katie Peticolas. She was
responsible for conducting meetings. She planned out the agenda beforehand,
ensured that the topics of conversation are related to the project 90% of the time,
and made certain that all important things were discussed. She was also be
responsible for evenly delegating tasks to team members. This included keeping a
record of what needed to be done, who was completing it, and when it needed to be
completed by. The team also discussed how team meetings would be organized. Each member was
given a specific task each week with an accompanying due date to present the
information to the rest of the group. The entire group utilized class time for group
meetings, as it was extremely difficult to find times where all five members were
available to meet. However, when additional work was required, extra meeting times
were set up using majority rule, described below, by Trevor. Since the team was so large and there was not always a time outside of class that
everyone was able to get together, the team implemented a majority rule. This
states that if the majority (three members out of five) could make a meeting then
the meeting was scheduled. If a member cannot make a meeting due to an excused
reason (i.e. class, meeting, or work) there were no consequences. However, as a
group the team expected the member to still contribute and stay up to date on all
the information discussed at the missed meeting. If a member could not make a
meeting due to a last minute complication, the member would contact Trevor to let

ENGR459/460/461 Senior Design Project 2014-2015
11
him know. The group would decide if the reason was valid. If a member was late or
needed to leave early, they contacted Trevor. The team either used class time, or
found another time where all members were available for meetings with the sponsor. Each member was given one grace, where they could miss a meeting without any
consequences, and one grace where they could be more than twenty minutes late to
a meeting. Besides these graces, if a team member missed a meeting for an
inexcusable reason (as described above or decided by majority rule), or was more
than twenty minutes late to a meeting, they were responsible for bringing some sort
of food for everyone to the next meeting. The team also discussed how conflict would be handled. In the event of a conflict the
group agreed to discuss the issue at the next available meeting. If the issue was
between two members then the group was available for mediation. If the issue split
the group then a vote was called to decide the matter. If after voting on the issue a
clear decision could not be decided then the group contacted Professor McFarland to
help resolve the issue. The team worked hard to acquire good communication skills
in order avoid such problems. Lengths were taken to maintain respectful and clear
communication between all members. Gaining an understanding of individual
characters and personality types was useful in the pursuit of successful mediation. After discussing these administrative tasks, the team discussed how technical tasks
would be accomplished. Each member agreed to take care of the work that was
directly related to their specialty. Along with this came the expectation that each
member would be able to explain their work to the other members if the need arose.
In addition to this, the team knew that there would be many technical tasks to
complete which none of the group was specialized in. These the team chose to
handle on a case by case basis, with all of the members contributing at one time or
another.
E. Potential Users
The main user of this sense and avoid system prototype will be an aerospace
company. The team will use the proof of concept to help determine if it would be
useful for the aerospace company to incorporate this system into its unmanned
aircraft products. If this does prove to be a useful approach to the UAS sense and
avoid problem, then a different group of users will be considered. There are two main
groups of potential users: the military/government and the commercial industry.
Both groups could use this system to contribute to safe UAS operation, as well as to
more autonomous applications. The UAS will be able to better carry out the mission
needed by the user. A diagram of this user relationship with the accompanying
benefits is shown below in Fig. 1.
Figure 1: Potential users and benefits.

ENGR459/460/461 Senior Design Project 2014-2015
12
Chapter 2. Background
A. Existing Products and Competitor Information NASA NASA is looking at low altitude UAS air traffic control systems and working with
Google on sense and avoid technology for package delivery systems. NASA wants to
become a part of the developing market, while still satisfying the privacy and safety
concerns of the public. NASA has conducted flight demonstrations in order to test
sense and avoid software developed by the MITRE Corp., the University of North
Dakota, and Draper Labs. The system uses ADS-B (automatic dependent
surveillance-broadcast) as its sensing technology. U.S. Navy The U.S Navy is another group seeking a sense and avoid solution, specifically for
the MQ-4C Triton. The current design does not meet certain performance and
manufacturing requirements needed for it to properly complete surveillance and
reconnaissance. It is desired that an improved system be designed which fits within
SWaP constraints. Additionally, the system must be modular and scalable for
applications in other airborne systems. The goal is for the Triton to be capable of
operating in a wide range of air traffic environments. Previously there have been
performance issues associated with ground clutter. For this reason the U.S Navy
anticipates that the onboard air-to-air radar may require ground based radars as a
supplement when the vehicle is operating at low altitudes. The main challenge is creating the system so as to fit within the constraints of the
aircraft’s design while still functioning correctly. This has been so problematic that
the development of a sense and avoid sensor has been stopped so that an
alternative solution can be evaluated. Both on and off-board sensors have been
utilized to avoid conflict with air traffic. This approach combines the collision
avoidance system with the surveillance position reporting system. This allows the
location of the UAV to be determined and its path to be predicted. Neither approach
meets current FAA regulations, but the U.S Navy is working with the FAA and other
regulatory agencies to develop a plan for combining these systems. U.S Air Force The U.S Air Force is currently developing a common airborne sense and avoid
system. They have used NGC’s Global Hawk for trials in surveillance and testing of
Multiple Intruder Autonomous Avoidance, which has improved sensor technologies
and algorithms. These systems are scalable and allow easy integration of tailored
sensors. Automatic maneuvering is done with autopilot to avoid oncoming aircraft. General Dynamics Robotic Systems General Dynamics Robotic Systems (GDRS) has developed and demonstrated
autonomous UAS obstacle avoidance. GDRS uses a LADAR sensor in its unmanned
RMAX helicopter sense and avoid system. It is able to completely scan its
surroundings with a 360 degree field of view. The LADAR gives a 3D representation

ENGR459/460/461 Senior Design Project 2014-2015
13
of the targets it detects, then compiles all the representations to build a map. While
the UAV is moving, autonomous path planning algorithms draw on LADAR data and
interact with the aircraft’s autopilot, allowing the system to fly around obstacles in
real time. It can detect obstacles at distances of up to 200 meters under different
weather conditions. It can scan its entire field of view in just over one second and
can detect very small targets. Once targets are detected, the system reacts in a
fraction of a second. A new flight path is computed, and the aircraft executes a
change in both direction and altitude simultaneously allowing the aircraft to travel
along a smooth path.
The Brigham-Young University YINSAR System
Brigham-Young University students have successfully worked on a similar system.
They are creating low-cost, compact, and low-power synthetic aperture radar
systems for small UAS. The systems include an interferometric system they call
“YINSAR” as well as “MicroSAR”. In the MicroSAR system there is a tradeoff between coverage and precision, and cost
and size. It is a very low power system designed to “turn on and forget”. The images
recorded are formed after the flight when the data is loaded on laptop and
processed. Real time imaging is still in development. The system weighs less than two pounds and has a power consumption of 16 Watts,
it consists of a stack of small circuit boards and two flat microstrip antennas. The
difference between MicroSAR and conventional SAR is instead of transmitting short
pulses that are separated by a receive interval, transmission and receipt happen
simultaneously. This is done with continuous wave linear frequency modulation which
enables low power operation. Performance is optimized with bistatic operation where there are different antennas
transmitting and receiving signals. The system operates in an altitude range of 300
to 2500 feet and velocity range of 20 to 50 meters per second. Cost was minimized through the use of a double-sideband transmit chirp and an all-
digital final intermediate frequency. The DSB chirp doubles the effective bandwidth of
the transmit signal with only a small signal-to-noise ratio loss due to reduced carrier
suppression.
Figure 2: Functional block diagram of MicroSAR.

ENGR459/460/461 Senior Design Project 2014-2015
14
Figure 3: MicroSAR system configuration.
General Atomics General Atomics has a successfully tested UAS that can sense and avoid aircraft. The
first time a target was detected, the detection system included radar, a transponder,
and traffic alert systems. All three systems were required for successful sense and
avoid operations. Integrated Robotics UAV Alaska has Integrated Robotics Imaging Systems that are being specifically
developed and patented for small unmanned aerial systems. Integrated Robotics
holds the rights to this system, which is yet to be finished. This radar will eventually
be made available for integration into UAS. The system uses frequency shift keyed
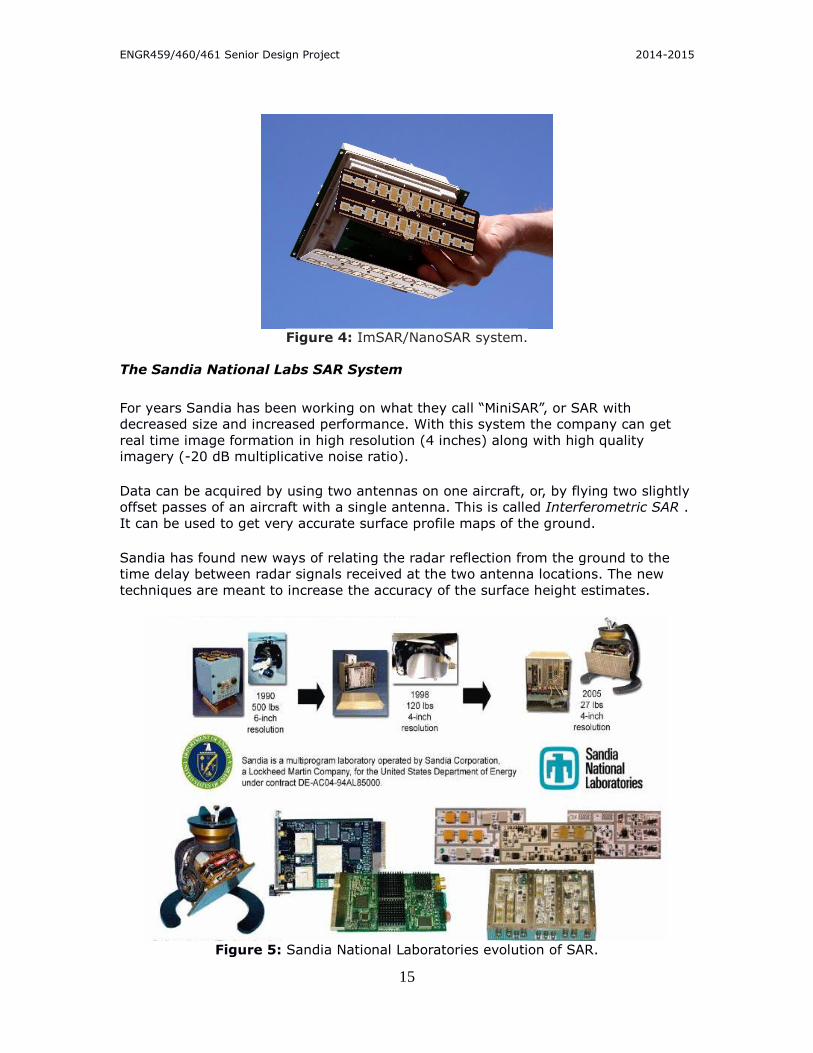
continuous wave collision avoidance radar with a phased array patch antenna. ImSAR ImSAR, a small company in Utah has been working on making sensors smaller for
tactical use on lightweight aircraft. The purpose of these small sensors is for
surveillance systems to be able to detect targets in all types of weather. This will give
the system an advantage over infrared and optical sensors since they are affected by
weather conditions. The sensor, called “NanoSAR,” weighs two pounds and is the
size of a shoe box. This shows significant progress in the minimization of radar
systems since SAR systems usually weigh 50 to 200 pounds. This company has been able to reduce the weight by using printed board technology
instead of heavy metal tubes that guide radio waves in standard SAR. ImSAR is using
fiberglass boards similar to the ones used in laptops and cell phones; this also makes
NanoSAR much less expensive than standard SAR. The NanoSAR has a short range
because the circuit boards are small and UAS have restricted power supplies.
Currently the data collected during flight testing must be converted into visual
images after the UAS lands. The company is currently working on creating images in
real time.
ENGR459/460/461 Senior Design Project 2014-2015
15
Figure 4: ImSAR/NanoSAR system.
The Sandia National Labs SAR System
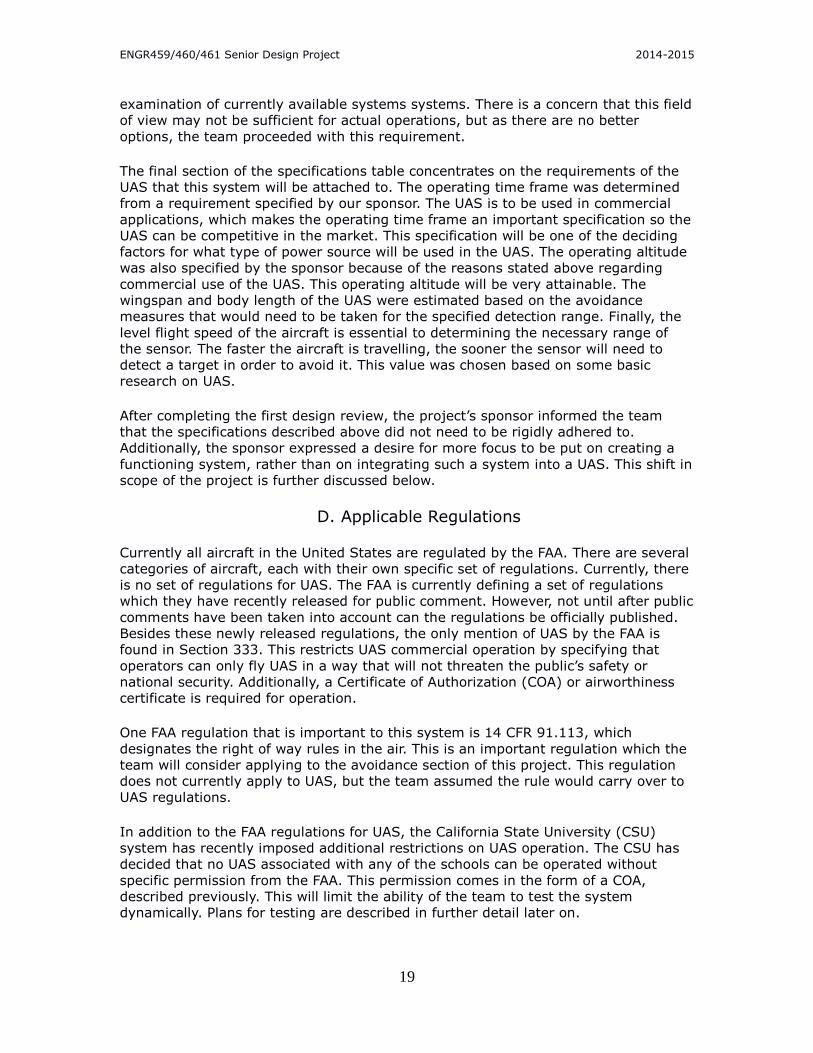
For years Sandia has been working on what they call “MiniSAR”, or SAR with
decreased size and increased performance. With this system the company can get
real time image formation in high resolution (4 inches) along with high quality
imagery (-20 dB multiplicative noise ratio). Data can be acquired by using two antennas on one aircraft, or, by flying two slightly
offset passes of an aircraft with a single antenna. This is called Interferometric SAR .
It can be used to get very accurate surface profile maps of the ground. Sandia has found new ways of relating the radar reflection from the ground to the
time delay between radar signals received at the two antenna locations. The new
techniques are meant to increase the accuracy of the surface height estimates.
Figure 5: Sandia National Laboratories evolution of SAR.

ENGR459/460/461 Senior Design Project 2014-2015
16
R-3 engineering R-3 engineering developed an All Weather Sense and Avoid System for UAVs. The
unit weighs 15.5 ounces, occupies less than 35 cubic inches and requires less than 1
Watt of power. The design includes a 978 MHz universal access transceiver, a 1090
MHz, Mode S, ADS-B receiver, and an SD memory card. The memory card is able to
preload known obstacle databases and recover data from the onboard data logger. It
also has enough computing power to record 200 targets, track the 24 closest
contacts, record all flight and target data, predict potential encounters, and provide
appropriate and timely warnings of impending collisions to UAS pilots. In
emergencies, the system directly commands the unmanned aircraft’s autopilot to
implement a safe avoidance maneuver.
Figure 6: AWSAS system developed by R-3 Engineering.
The open architecture is compatible with any algorithm, autopilot, display, sensor,
and platform. It receives ADS-B radio transmissions on both 978 MHz ES and 1090
MHz. It also decodes 1090 MHz. It receives FAA re-transmitted information such as
traffic and weather announcements. The system is also reported to receive ported
non-cooperative sensor inputs such as those emitted by radar, lidar, EO/IR, and
acoustic systems, as well as many others. It transmits its own ADS-B position on 978
MHz. It stores available database information (e.g. terrain, obstacles, and no-fly
zones). The system then analyzes and smartly communicates real time, assured safe
separation or collision avoidance guidance, to GCS or auto-pilot.
Automobile Collision Avoidance Systems Collision avoidance systems used in luxury automobiles for automatic cruise control
may be useful in the development of airborne systems. Autonomous Cruise Control is an optional cruise control system that automatically
adjusts vehicle speed to maintain a safe distance from vehicles ahead. Cruise control
is implemented based on sensor information from on-board sensors only. The
extension to cooperative cruise control requires fixed infrastructure, as with satellites
or roadside beacons, or mobile infrastructures, such as reflectors or transmitters on
the backs of other vehicles. These systems use either radar or laser sensors. These prompt the vehicle to slow
when approaching another vehicle and to accelerate again to the preset speed when
traffic allows. Laser-based systems and radar-based systems compete in quality and
price. Laser-based ACC systems have trouble detecting targets in bad weather
conditions and have problems detecting dirty cars, since the dirt stops the laser from

ENGR459/460/461 Senior Design Project 2014-2015
17
reflecting. Also, laser-based sensors must be exposed, so the sensor is usually
placed lower on one side of the car in a box. Radar-based sensors can be more easily hidden, but the cover they are hidden
behind may look different from a vehicle without this feature. Single radar systems
are often used in automobiles. Systems involving multiple sensors use either two
sensors of similar range, such as the systems utilized in the 2010 Audi A8 and 2010
Volkswagen Touareg, or use one central long range radar coupled with two short
radar sensors placed on the corners of the vehicle, as seen in the BMW 5 and 6
series. Google Car Technology Google has developed a new autonomous driving car prototype with no steering
wheel, accelerator or brake pedal. The Toyota Prius and customized Lexus SUVs now
use the sensors used in the Google car. These cars have cruise control cameras as
well as a spinning laser scanner. GPS is used to locate the car; then radar, lasers,
and cameras take over to monitor all 360 degrees of surroundings. The software
utilized can recognize targets and obey road rules. The major component used to detect targets is the $70,000 LiDAR system, a laser
range finder that is mounted on the roof of the car. The device is a Velodyne 64-
beam laser; it generates a detailed 3D map of its environment. The car then
combines the laser measurements with high-resolution maps of the world to produce
different data models. It also carries other sensors including four radar sensors,
mounted on the front and rear bumpers, which allow the car to see far enough to be
able to deal with fast traffic on freeways. There is also a camera positioned near the
rear-view mirror that detects traffic lights. It is important to note that the new
prototype cannot detect targets in heavy rain or snow covered roads.
B. Current State of the Art
Currently, sense and avoid systems are still being developed for use in aircraft. The
military has begun implementing some such systems in their larger manned aircraft.
However, they are still in development and are not commercially available. Currently
there are no such systems being implemented in small UAS. Therefore, there is not
really a “state of the art” product for this type of technology. The state of radar systems is slightly different. Radar is a proven technology in most
large aircraft. They are used to detect and communicate with other aircraft. Radar
systems are used in both manned and unmanned aircraft. However, most radar
systems are large and heavy, making it difficult to implement them into small
unmanned vehicles. Therefore, the team again lacks a “state of the art” product for
this class of vehicle. The team chose to focus on existing systems, as described
above, and the requirements specified in the next section as inspiration for this
system.
C. Specific Technical Data The design requirements were decided in part by the sponsor and in part by the
team. Originally, the given target weight for the entire system limited the choices for

ENGR459/460/461 Senior Design Project 2014-2015
18
the final design. Below, the requirements in Table 1 show what the team deemed to
be the crucial elements of the design.
Table 1. Requirements
Spec.
# Parameter
Description Requirement
or target with
units
Tolerance Risk Compliance
1 Weight (Radar System) approx. 2 lbs. 10% M/H A, I
2 Size (Radar System) <2 ft3 <1% M I
3 Power (Radar System) 10 W Min. L A, T
4 Production Cost (Radar
System) $5,000 Max. L I
5 Detection Distance
(Sensor) 650 ft Min. H A, T, S
6 Update Time (Sensor) 50 milliseconds 2% H A, T, S
7 Field of view - Vertically
and Horizontally
(Sensor)
+/- 10o Min. H A, T, S
8 Operating Time Frame
(UAS) 24 hours Max. H A, T
9 Operating Altitude
(UAS) 2000 ft Max. L S
10 Wingspan (UAS) 7 ft Max. L S
11 Body Length (UAS) 7 ft Max. L S
12 Level Flight Speed
(UAS) 60 ktas Max. H A, S
The requirements table is separated into three sections. The first is the entire radar
system (which includes a sensor, microprocessor, controller, and power source). The
team was able to project the other overall system requirements based on a payload
weight limit of two pounds. The second section of the specification table focuses on the sensor. The detection
distance and update time are two of the most important specifications for the
system. The team wants the system to detect a target as soon as possible so that it
can begin avoidance maneuvers right away. The current detection range of 650 ft
and update time of 50 milliseconds were determined through research on current
automobile radar systems. It is in part dependent on the specifications of the UAS.
The update time should be adequate for any needed response. The field of view of
the sensor is also very important. The above value was set according to research
done on radar systems in automobiles. This field of view was based on the
ENGR459/460/461 Senior Design Project 2014-2015
19
examination of currently available systems systems. There is a concern that this field
of view may not be sufficient for actual operations, but as there are no better
options, the team proceeded with this requirement. The final section of the specifications table concentrates on the requirements of the
UAS that this system will be attached to. The operating time frame was determined
from a requirement specified by our sponsor. The UAS is to be used in commercial
applications, which makes the operating time frame an important specification so the
UAS can be competitive in the market. This specification will be one of the deciding
factors for what type of power source will be used in the UAS. The operating altitude
was also specified by the sponsor because of the reasons stated above regarding
commercial use of the UAS. This operating altitude will be very attainable. The
wingspan and body length of the UAS were estimated based on the avoidance
measures that would need to be taken for the specified detection range. Finally, the
level flight speed of the aircraft is essential to determining the necessary range of
the sensor. The faster the aircraft is travelling, the sooner the sensor will need to
detect a target in order to avoid it. This value was chosen based on some basic
research on UAS. After completing the first design review, the project’s sponsor informed the team
that the specifications described above did not need to be rigidly adhered to.
Additionally, the sponsor expressed a desire for more focus to be put on creating a
functioning system, rather than on integrating such a system into a UAS. This shift in
scope of the project is further discussed below.
D. Applicable Regulations Currently all aircraft in the United States are regulated by the FAA. There are several
categories of aircraft, each with their own specific set of regulations. Currently, there
is no set of regulations for UAS. The FAA is currently defining a set of regulations
which they have recently released for public comment. However, not until after public
comments have been taken into account can the regulations be officially published.
Besides these newly released regulations, the only mention of UAS by the FAA is
found in Section 333. This restricts UAS commercial operation by specifying that
operators can only fly UAS in a way that will not threaten the public’s safety or
national security. Additionally, a Certificate of Authorization (COA) or airworthiness
certificate is required for operation. One FAA regulation that is important to this system is 14 CFR 91.113, which
designates the right of way rules in the air. This is an important regulation which the
team will consider applying to the avoidance section of this project. This regulation
does not currently apply to UAS, but the team assumed the rule would carry over to
UAS regulations. In addition to the FAA regulations for UAS, the California State University (CSU)
system has recently imposed additional restrictions on UAS operation. The CSU has
decided that no UAS associated with any of the schools can be operated without
specific permission from the FAA. This permission comes in the form of a COA,
described previously. This will limit the ability of the team to test the system
dynamically. Plans for testing are described in further detail later on.

ENGR459/460/461 Senior Design Project 2014-2015
20
One reason that regulations for UAS are finally being made, and more strictly
enforced, is that the general public has become more aware of the use of UAS. One
concern many people now have is that there is an increased risk of collisions due to
the lack of a pilot. First person view cameras are not considered to be reliable
enough for collision avoidance as the field of view is very limited. Having a reliable
sense and avoid system could alleviate some of these concerns about UAS operation.
Chapter 3. Design Development
A. Options for Conceptual Design
The development of this design first required that the team determine which
parameters from the requirements list would have the most impact on the success of
the system. Then the team evaluated what the components of the system would be.
These components were determined to be the sensor, the circuit, the microcontroller,
the housing, and the battery. The development of this design required extensive
research into the options for these components. The results of this research along
with the benefits and deficiencies of each option are discussed in detail below. Important System Parameters A discussion of all system parameters and their required values was completed
above. When the design development portion of the project began, the team realized
that meeting some requirements was more important to the success of the system
than meeting others. The team chose seven parameters to evaluate the components
with. The chosen parameters were the weight, dimensions, cost, field of view, power
consumption, range, and processing time. Not all of these were relevant to all of the
components, so each component was evaluated according to the parameters that
were applicable. Then within these parameters some were considered more important than others.
The requirement that the weight of the system be less than two pounds greatly
limited the choice of components, as some components weighed up to a pound on
their own. Additionally, having a large enough range and field of view is essential to
the success of the system. If the system is unable to detect a target soon enough,
avoidance will be impossible. These three parameters were the most constraining for
the system. Therefore, adherence of the system to the required values for these
parameters was more closely considered than adherence to the other requirements. Sensor One of the most important decisions made in this design process was which sensor
would be utilized. The success of this system hinges on the ability of the sensor to
detect targets that may be on a collision path with the aircraft. Therefore,
considerable research on various sensors was completed. First, the type of sensor
needed to be chosen. Many different types of sensors are currently being used in
unmanned systems including radar, lidar, infrared, and several other detection
technologies. Ultimately, after getting feedback from the project sponsor, radar was
chosen as the type of sensor to move forward with.

ENGR459/460/461 Senior Design Project 2014-2015
21
Then, comprehensive research on radar functionality was done. This research
provided important information such as the output of radar systems, applications for
which radar is being used, factors which limit radar usage, and many other
specifications. Research was also completed on the options for the radar system. The
team’s knowledge about radar systems in general allowed for a logical evaluation of
the capabilities of the radar options in order to make an educated decision on which
would be most suited for use in a sense and avoid system on a UAS. Originally research on airborne systems was completed, as it seemed the most
applicable to this project. This included systems such as the Traffic Alert and Collision
Avoidance System, the Ground Based Sense and Avoid Network currently being
tested by the army, and the Air Traffic Control system used for commercial and
recreational aircraft flights. Unfortunately, research indicated that no airborne radar
systems would be compatible with this project. Currently all of the above systems
are too large and heavy to be supported by a small UAS. There are several
universities working on making radar systems smaller and lighter so that they can be
more easily used for airborne applications, but right now nothing is available for
commercial purchase. Therefore, attention was focused on radar systems that are being used in other
industries. At the direction of the project’s sponsor, the team turned to radar systems
being used in the automotive industry. Currently radar is being used in automobiles
for anti-collision applications. Hence these systems were a very good fit for this
project. However, there were limiting factors because of some key system
differences. One difference was that aircraft operate in all three dimensions and
generally do not operate in the same horizontal plane of motion as other aircraft.
However, automobiles mostly operate in only two dimensions, and usually all operate
on the same horizontal plane of motion. Therefore, radar sensors for automobiles
mostly operate in only two dimensions. This will limit the capabilities of the system
for use on an aircraft. Another limiting factor is that automobiles generally travel
within close proximity to each other, which means the radar system does not require
a long range for most situations. Aircraft, on the other hand, do not usually fly in
close proximity to each other, and therefore need a longer sensing range. This need
for a longer range greatly reduced the viable sensor options, as most automobile
radar systems have a maximum range that was much less than specified by the
system requirements. Ultimately, the team was able to narrow down the sensor choice to options from
three different companies: UAV Alaska, Banner, and Continental. After getting as
much information from these companies’ websites as possible, the team asked each
company for more system specifications. Banner and Continental promptly replied
with more information about their sensors. Unfortunately, UAV Alaska did not
consistently remain in contact with the team and did not provide enough information
about its sensor. Circuit A circuit is required for the system so the voltage of the battery could be ramped up
and data could be transferred. The ramp up of the battery was required because the
team could not find a battery that had the amount of voltage needed for the sensor
and came in under the weight limit. While discussing the options the team broke the

ENGR459/460/461 Senior Design Project 2014-2015
22
two purposes into two categories: the circuit for powering the system and the circuit
for transferring data. For the circuit powering the system the team and the sponsor formulated the
following two options. Option one is a lower voltage battery with a circuit that
amplifies the voltage for the system. Originally, the team had a simple operational
amplifier but after talking with the sponsor, the team realized that the voltage could
not be amplified with just a simple operational amplifier. The sponsor pointed out
that the team oversimplified this problem and in order to amplify the gain a DC to DC
(direct current to direct current) voltage converter would be needed. In order to
create the DC to DC voltage converter, the team would have to build one from
scratch or purchase one. Designing one would complicate this subsystem and
increase the weight of the overall system past the two pound limit. The second option is a higher powered battery with a voltage divider to step the
voltage down to 12V. This circuit would be simpler, however it would put us over the
two pound limit. The simplicity of this circuit would allow the circuit to be designed
and fabricated reasonably quickly. Also, the higher voltage battery guarantees that
the system will have enough power. The next part of the circuit the team had to consider was how the data was going to
be transferred. The team narrowed it down to two options. Option one was to
transfer data through simple wiring and option two was transferring data using a
transceiver. Transferring data through a wire creates a lot of resistance. The wiring would need to
be of minimal length in order to minimize the power draw. Setting up a circuit is also
the more complicated route. Creating a transceiver and sending the data wirelessly
would be a simpler form of data transfer. However, the simpler transceiver creates
more problems in the system. The error risk increases, as well as the processing
time. Also, the sensor would require a circuit and transmitter to send the data and
the microprocessor would require a receiver and circuit to encode the data. This
causes the weight of the system to increase and increases system complexity. Microcontroller The microcontroller is a central aspect of this project. The radar sensor is limited to a
range of 200 meters. Therefore, it is important to minimize the total processing time.
There were three microcontrollers the team investigated, the Arduino Uno, MSP
430G2 and the Raspberry Pi.

ENGR459/460/461 Senior Design Project 2014-2015
23
The Arduino Uno has the following specifications:
Table 2: Arduino Uno Specifications
Microcontroller ATmega328
Operating Voltage 5V
Input Voltage (recommended) 7-12V
Input Voltage (limits) 6-20V
Digital I/O pins 14 (of which 6 provide PWM output)
Analog Input 6
Flash Memory 32 kB
SRAM 2 kB
EEPROM 1 kB
Clock Speed 16 MHz
The Arduino Uno has a sufficient amount of memory and meets the requirements of
the system. The Arduino Uno is a high powered microcontroller with a plethora of
functionality. The system the team is creating may not need all of the functionality of
the Arduino Uno so utilizing the Arduino may result in wasted power, which will affect
the power lifespan of the system. Additionally, one of the drawbacks of the Arduino is
it has a relatively slow clock speed. The Texas Instrument Launch Pad has the following specifications:
Table 3: TI MSP430 Launch Pad Specifications
Microcontroller MSP 430
Operating Voltage 3V
Input Voltage (recommended) 3.7V
Input Voltage (limits) 5V
Digital I/O pins 14
Analog Input 16
Flash Memory 16 kB
SRAM 512 B
EEPROM NA
Clock Speed 16 MHz

ENGR459/460/461 Senior Design Project 2014-2015
24
Texas Instrument’s Launch Pad has the same clock speed as the Arduino but runs on
less voltage. Additionally, the Launch Pad does not have very much memory, which
could be problematic for the system. The Raspberry Pi has the following specifications:
Table 4: Raspberry Pi Specifications
Microcontroller Raspberry Pi
Operating Voltage 3.3V
Input Voltage (recommended) 5 V
Input Voltage (limits) 5V
Digital I/O pins 14
Analog Input 8
Flash Memory NA
SRAM 512 MB
EEPROM NA
Clock Speed 700 MHz
Relative to the Arduino and TI Launch Pad, the Raspberry Pi is extremely fast.
However, there is no flash memory. The Raspberry Pi is also larger than what the
team originally anticipated during the first round of system design. Housing Another component of the system to be considered was the housing. This was
considered an important component for two reasons: the housing affects the
placement of the system in the aircraft and will protect the system from damage. The team determined early on that when the system was integrated into an aircraft,
it would need to be located in the nose of the aircraft. This would allow the radar to
obtain data without concern about interference from other sections of the aircraft.
Additionally, the system could be incorporated into multiple aircraft with only minor
adjustments required. However, this placement did put a couple of limiting factors on
the system. One, the nose of the aircraft must be hollow and not housing any other
system. Two, the system will be constrained by the size of the nose of the aircraft.
Using this information, three different housing options were evaluated. Boxes are traditionally used to house all types of systems and so were the first to be
considered. The largest benefit of housing the system in a box was that it would
allow the system to be completely protected. However, there were concerns about
how the box would be integrated into the aircraft. One concern was regarding the
total weight of the system. The weight requirement of less than two pounds is one of

ENGR459/460/461 Senior Design Project 2014-2015
25
the most constraining parameters of the system. Finding or creating a box that was
large enough to house the system, but would not be a large contribution to the total
weight of the system, would require additional consideration and research. Another
concern was about how the radar sensor would access unobstructed airspace in order
to send transmissions without interference. In order for the sensor to access the
open air it would need to pass through two surfaces: the surface of the box and the
surface of the aircraft. This could be accomplished in two manners. The shape of the box could have been
modified so that one side of the box was adjacent to the inside of the nose cone. This
would require the design and construction of a specialized box and would make
integrating the system into multiple aircraft more difficult. Another manner would be
to have the sensor located outside of the box against the surface of the nose cone.
However, this configuration would not provide protection for the sensor and would
require more wiring, which would result in additional resistance. The second housing option was a flat plate. Using a flat plate eliminated the two
concerns the team had with the box housing. A flat plate would still contribute some
additional weight to the system, but not as much as the box housing. Also, it would
eliminate one of the surfaces between the sensor and the open air. In order for the
system to have access to the open air, the flat plate would need to be customized for
each nose shape. However, this customization would be much easier to accomplish
than the customization of the box. One negative aspect of this housing option is that
it provides no protection to the system. The final option considered was to mount the system on the inside of the nose cone
itself. The most appealing aspect of this option was that it provided no additional
weight to the system. All aircraft have a nose cone, so the weight of the nose cone
was not considered as a part of this specific subsystem. It also allowed the sensor to
more easily access to unobstructed airspace, as it would only need to go through the
surface of the aircraft. Finally, the circular cross section of the nose cone allowed for
the most efficient and coherent wiring of the system. The components could be
arranged so as to be easily connected to each other with the least possible amount
of wire. These benefits made the nose cone housing an attractive option, but there
were also some concerns which needed to be addressed. One concern was that
housing the system directly in the nose cone provided no additional protection for
the system. If the aircraft were to undergo a head-on collision with anything, the
system would most likely be destroyed. Another concern was how the system would
be mounted to the inside of the nose cone. Most of the components have flat
surfaces that could be challenging to affix to the inner surface, since it will most
likely be curved. Battery The battery was the most difficult subsystem to narrow down. The power and the
weight of the battery are directly related and the biggest trade-off. When choosing a
battery the team had to consider the circuit needed in order to make an educated
decision on the battery requirements. The first option was an 11.1 volt battery. The 11.1 volt battery is the lightest of the
three batteries, however, the sensor needs twelve volts in order to operate. In order

ENGR459/460/461 Senior Design Project 2014-2015
26
to supply the sensor with this voltage, the system would need a DC to DC voltage
converter, and as mentioned previously this complicates the circuit. The second option was a 14.8 volt battery. The 14.8 volt battery would have enough
voltage to power the system. This battery exceeds the weight percentage of the
overall system given to the battery. This could cause the overall system weight to be
more the required weight set by the specifications of the system. The third option was a 24V battery. The 24V battery is significantly heavier. The
sensor can either run on twelve volts with 0.3A or 24V with 0.55A. After much
discussion the team decided running the sensor at 24V with 0.55A was unnecessary,
so this option was quickly eliminated. Decision Matrix All of the above component options needed to be compared and evaluated in order to
determine which would be best for the system. This evaluation was done using a tool
known as a decision matrix. A decision matrix assesses each component option
according to a set of parameters by comparing the relevant values to a benchmark.
Seven parameters were used for this evaluation: weight, dimensions, cost, field of
view, power consumption, range, and processing time. Each parameter is then given
a different “weight” that indicates which parameters are more important to the
success of the system. The components can be either better than, worse than, or the
same as the benchmark. The combination of the importance “weight” and the status
of the component in comparison to the benchmark is used to calculate a score for
each component. Higher scores indicate that the component is better suited for the
system. The benchmark is often an available system that the team is attempting to improve
upon. For this project, however, the requirements specified above were used as the
benchmark. This is largely due to the fact that currently no systems of the same
scale, capability, and application exist. Using the defined requirements as a
benchmark may seem counter-intuitive, and would be for most projects. However,
for this project, the design requirements are flexible. The nature of the system will
necessitate different tradeoffs of requirements so that the system can function
properly. The fact that the requirements are flexible was clearly stated by the
project’s sponsor and is further elaborated upon below. Shown below is the decision matrix. The components highlighted in green are the
options that would be the best for our system according to the scoring system
implemented. The evaluation of the decision matrix’s choices and the final decision of
which components to use are discussed in detail below.

ENGR459/460/461 Senior Design Project 2014-2015
27
Figure 7: Decision matrix with listed considerations and their ranks.
B. Supporting Preliminary Analysis
Typically this section would follow the selection of final components, not precede it.
However, for this project, if that order was implemented, the reader would be
confused about the requirements that the team is attempting to meet. Originally, the
team wanted to meet the requirements stated earlier in this report and made
decisions in line with those requirements. After reviewing the resultant decisions with
the sponsor, the requirements were adjusted and so the component choices had to
be adjusted. The details of this process are further elaborated upon below. Analysis for Initial Component Selection Originally an analysis of the weights, voltage, battery life, and time to impact was
completed. These analyses guided the original component decisions made for the
preliminary design review. These analyses were completed to ensure that the system
chosen would meet the requirements specified above in Table 1. The team discussed
these analyses and the resultant decisions with the project sponsor and were
informed that the requirements specified were not meant to be fixed requirements.
Instead, the requirements were meant to be adjustable according to what the
system needed to function properly. Many of the limiting requirements came from the vehicle that the team believed the
system would be integrated into. After the sponsor informed the team that the main
goal was proof of concept, not integration into a specific system, the team adjusted

ENGR459/460/461 Senior Design Project 2014-2015
28
the previously set requirements. Adjusting these requirements led to a
reconsideration of the decisions previously made. Therefore, the original analyses
completed were no longer relevant. Support for Final Component Selection The analyses originally completed were re-evaluated and resulted in the final
component selection described above. One of the most limiting requirements was the
weight. Aircraft designers always want to minimize the weight of the aircraft, and
therefore the team previously tried to minimize the weight of the system. This meant
that a smaller, lower power battery was chosen. Once the weight requirement was
made flexible, a weight analysis was no longer needed because there was no longer
a weight requirement to restrict the system. This led the team to choose a larger,
higher power battery, which in turn allowed a simpler power circuit to be used. This simpler power circuit still required voltage calculations to show that it would
sufficiently power all the components of the system. The new results are shown
below in Appendix VII. Originally the battery life calculations were driven by the requirement that the
system be operating for a full day (24 hours). The team is still trying to meet this
requirement in order to demonstrate the capabilities of the system. With the current
battery selected, the expected battery life does not meet this requirement. The
supporting analysis is also shown in the Appendix VII. At this time, the team has
decided that, similar to the weight requirement, the full day requirement is not
strictly necessary for the successful testing of the system. The current battery life is
13 hours, which will be more than enough for testing sessions. Finally, since the system is not being designed to fit a specific vehicle, time to impact
is no longer a relevant calculation to complete. The speed previously used for these
calculations was assumed based on a vehicle. Without a vehicle, this speed becomes
arbitrary and the time to impact also becomes arbitrary. This analysis will be
examined again after testing of the system is completed. This will allow the team to
derive a range of speeds at which the system would operate most effectively, and
these could then be converted to a range of times to impact.
C. Final Selection of Components The decision matrix in Fig. 7 shown above was instrumental in the choices the team
made for the components of the final design concept. However, the team did not
blindly accept the results of the decision matrix. The options chosen by the decision
matrix were closely examined to ensure that they would contribute to the success of
the system. Ultimately the options that the design matrix suggested were not chosen for several
components. One of the reasons the team believes that the components indicated in
the design matrix were not the most optimal options is because there are only three
levels of evaluation used by the design matrix: worse than, same as, and better than
the standard set by the benchmark. This was a problem for the team since some
components were worse than the standard, but still better than another component
option and there was no way to indicate this in the decision matrix.

ENGR459/460/461 Senior Design Project 2014-2015
29
Another reason that choices other than those suggested by the decision matrix were
made was because all of the components had to be compatible with each other, while
the decision matrix only evaluated components individually. As previously discussed,
the sensor is the most important component of the system. Therefore once the
sensor was chosen, the rest of the options had to be compatible with that sensor. Sensor According to the decision matrix, the company Banner had the best sensor option for
the system. However, when looking at the sensor’s specifications, which can be found
in Appendix V, it was clear that the Banner sensor did not have sufficient range for
the system to successfully operate. Also, there was no information about the field of
view. Not having access to this information concerned the team since it is has such a
large impact on the success of the system. Finally, the Banner sensors cannot be
modified without express consent of the company. The differences between
automobiles and aircraft may require modifications to be made to the sensor in order
to get the best system operation. All of these factors resulted in the team choosing to use a sensor from the company
Continental. Since the team had no specifications for the sensor from UAV Alaska, it
was not considered as an alternate choice. The benefits of the choice of the
Continental sensor were a much longer range (one that fit the system’s
requirements) and a defined field of view. These both give the system a much better
chance of being successful. Additionally, the Continental system was designed so that
it could adapted for different applications. This was especially appealing to the team
since modifications will most likely be needed in order to integrate the system into
an aircraft. There were some drawbacks to this choice that had to be accounted for. These were
that the Continental system has a bigger weight than the Banner sensor and a much
higher cost. Both drawbacks were considered and it was decided that the system
could be adjusted to compensate for these. The additional weight would be taken
from another component. The cost of the sensor was more than desirable, but was
still well within the team’s budget. The team completed a final evaluation of the benefits of the Continental sensor, after
having made adjustments to the system design to compensate for the deficiencies.
This process allowed the team to be completely confident in the choice of sensor.
a) b) Figure 8: a) Continental ARS 308. b) Back side of sensor.

ENGR459/460/461 Senior Design Project 2014-2015
30
Circuit After a discussion with the sponsor, the team decided to move forward with the
simpler circuit. As stated previously, the purpose of the project is to decide if the
technology used in automobiles can be implemented in UAS in the sense and avoid
application. Therefore, the team decided to make the requirements of the system
adjustable. The weight limit was one of the most restricting requirements of the
system; making this requirement adjustable opened up several opportunities for use
of various technologies. The first design of the circuit will consist of a simple voltage divider. The battery will
supply the input voltage which is connected to voltage regulators. There will be
separate voltage regulators for each component to in order to step down the voltage
from 14.8 voltage to the voltage needed to supply each subsystem. This is illustrated
below in Fig. 9. The voltages were measured at each node to verify the correct
voltages needed to power each component.
Figure 9: Circuit design powering sensor with battery and voltage regulators.
The microprocessor and the sensor will be connected with a wire designed for the
sensor provided by Continental. This is the best option because it has the minimal
drawbacks. The wireless communication has a higher risk of error which may result
in failure of the system. Although the team has decided on a circuit, this is just a starting point. The circuit
will have to be modified in the future in order to stabilize the system. As time passes
and testing is completed, the circuit will be modified to achieve the best circuit. Microcontroller The microcontroller was one of the harder decisions to make. There are many trade-
offs that needed to be considered. The speed and power draw were the top
considerations. Although the Raspberry Pi is extremely fast, it is also is more than a microcontroller
and has much more functionality. During the team’s discussion of microcontroller

ENGR459/460/461 Senior Design Project 2014-2015
31
options it was noted that sometimes more is less. Although the Raspberry Pi has a
faster processing time, the Arduino and Launch Pad are capable of sufficiently
completing the required tasks. The team chose the Arduino Uno. Several factors had an impact on this decision. The
programmers on the team are more familiar with the Arduino Uno language. This will
allow the programmers to focus on the task at hand when programming, instead of
trying to learn a new programming language simultaneously. Initially, the code will
be written for the ATmega. Then if the Arduino is drawing too much power, the team
may switch to the Launch Pad, which has less capabilities but can still complete the
required tasks. Changing the microcontroller should not cause too many
complications since the language for the both are very similar. The team has access
to one TI Launch Pad, which will be utilized if the switch is made.
Figure 10: Solid model of Arduino Uno.
Housing As far as the housing, the decision matrix suggested that the nose cone would be the
best option for the system. The team was in agreement with this. The benefits
discussed above (the decreased weight, circular cross section, and easier access to
unobstructed airspace) had the most impact on this decision. There were drawbacks
to this choice, but the team originally believed that the benefits outweighed them.
This was especially true because even though the drawbacks could affect the success
of the system, they were things that needed to be considered during assembly and
operation, and were not inherent flaws in the fundamental nose cone concept. However, after discussing this issue with the team’s sponsor and learning that weight
is no longer an important concern, the team transitioned to the flat plate layout. This
will make testing easier for the team, because the team will be able to more quickly
access the system. Changing out or making minor adjustments to components will
not require disassembly of the entire system.

ENGR459/460/461 Senior Design Project 2014-2015
32
To compensate for the lack of protection, when testing the team will ensure that
appropriate measures are taken so that the system is not damaged. A very
experienced remote control RC pilot will operate the aircraft, and flight tests will only
be done on days with optimal weather conditions in order to minimize the chance of
loss of control of the aircraft. Additionally, extra caution will be used every time the
system is moved or adjusted. For the safety of the subsystems the team will
examine each subsystem and determine if a protective case will be needed. If after
several tests the team determines that the subsystems have a high probability of
being damaged in this configuration, a protective cover will be designed, built, and
implemented. Battery The battery was evaluated by examining the voltage values and evaluating which
would be best for the system. After careful consideration, a 12V battery was decided
on. This allows for the easier circuit and provides enough voltage to supply the entire
system. Although the 12V battery exceeds the weight limit, as discussed, the weight
requirement was deemed less important than simplicity for this project. The focus of
the project is to test the technology. Therefore, it is more practical to simplify the
circuit and compromise on the weight problem. The specific battery chosen is the
DURA12-1.3F Battery 12V Duracell Ultra SLA Sealed Lead Acid Battery. It has ratings
of 12V and 1.3Ah which will give the team a lifespan of approximately 20 hours at
165mA. The details of this analysis are shown in Appendix VII.
Figure 11: Solid model of the battery chosen.
ENGR459/460/461 Senior Design Project 2014-2015
33
D. Proof of Concept Analysis The ultimate goal of this project is to prove that this system is a viable solution for
UAS; in other words, the team is showing proof of concept for the sponsor.
Therefore, extensive proof of concept analysis will be completed later on, largely
after testing data has been collected. The nature of this project means that preliminary proof of concept analysis and
testing would not be relevant or useful. The system that this team has designed is
not meant to be a finalized design that the sponsor could actually implement into a
vehicle. Rather, the system is meant to be a testing platform, which the team will use
to show that this system either will, or will not work in UAS applications. This
planned further analysis and testing are described in greater detail below.
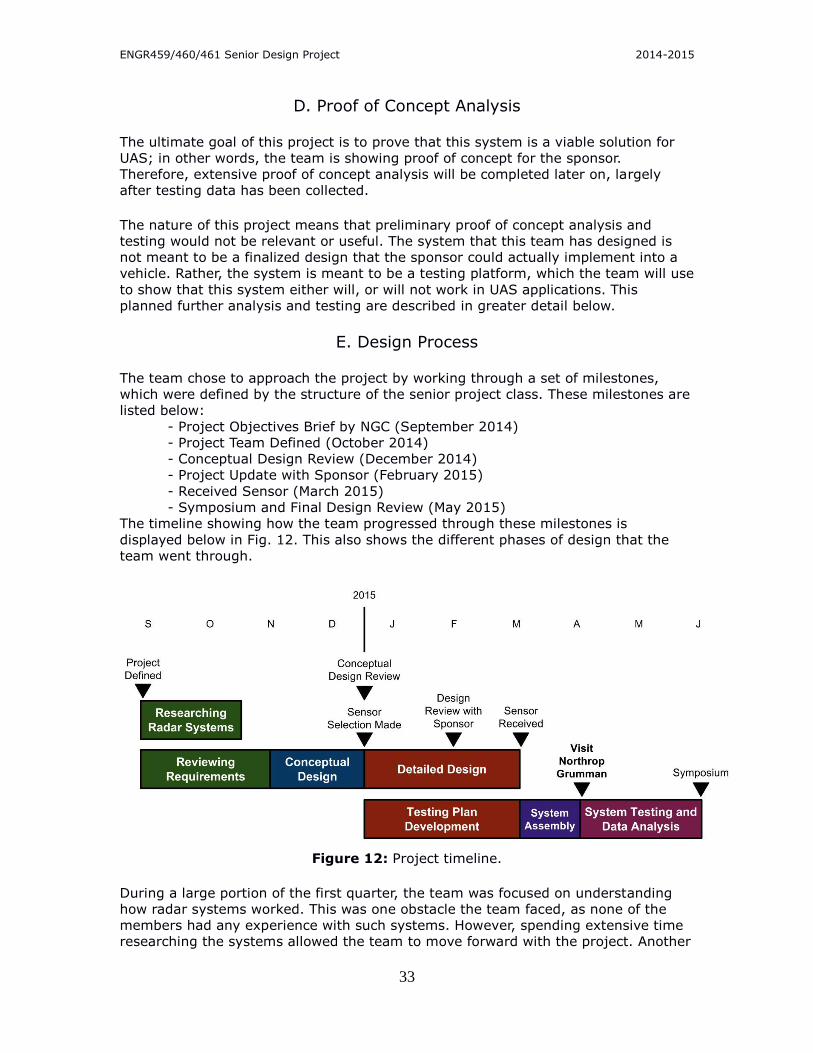
E. Design Process The team chose to approach the project by working through a set of milestones,
which were defined by the structure of the senior project class. These milestones are
listed below:
- Project Objectives Brief by NGC (September 2014)
- Project Team Defined (October 2014)
- Conceptual Design Review (December 2014)
- Project Update with Sponsor (February 2015)
- Received Sensor (March 2015)
- Symposium and Final Design Review (May 2015)
The timeline showing how the team progressed through these milestones is
displayed below in Fig. 12. This also shows the different phases of design that the
team went through.
Figure 12: Project timeline.
During a large portion of the first quarter, the team was focused on understanding
how radar systems worked. This was one obstacle the team faced, as none of the
members had any experience with such systems. However, spending extensive time
researching the systems allowed the team to move forward with the project. Another

ENGR459/460/461 Senior Design Project 2014-2015
34
obstacle was defining the problem the sponsor wanted solved. The team was
originally under the impression that the sponsor wanted a full radar system to be
designed and implemented into a small UAS. In reality, the sponsor only wanted to
show proof of concept and to gather test data on such systems. Therefore, the team
began to look at different commercial off the shelf sensors. Once the sensor was selected, the team progressed into detailed design of the entire
system. Detailed design took up most of the second quarter of the year. Since this
project was focused more on proof of concept than design of a system, a large
portion of detailed design work involved developing a testing plan. Creating the test
plan was another obstacle the team faced, as it was difficult to narrow down the
types of testing which would be most useful. Eventually the team decided to design
the test plan with two objectives in mind: giving the sponsor as much data as
possible and evaluating the sensor’s ability to operate in the air. This testing plan was
to be implemented as soon as possible. However, things did not go quite as planned. The team ordered the sensor through the school midway through the second quarter,
but the team had no estimated time of arrival for the sensor. Unfortunately it took
approximately six weeks for the team to receive the sensor. Delays were caused by
mishandling of paperwork after it was submitted to the school administration. The
team’s progress was limited by the fact that the sensor took so long to be delivered. All testing had to wait until the sensor arrived. Until that time, the team continued to
make step by step testing plans to be executed (as best as could be done with the
limitations of not having the sensor). Additionally, the team continued building the
algorithms, analysis tools, and component related hardware so that once the sensor
arrived, the team could go straight into testing without any delays. The team’s
development was split into three sections: hardware, software, and test plan. Each
section focused on the components necessary for testing to begin once the sensor
arrived. Thankfully the sensor did arrive at the conclusion of the second quarter. The team
immediately began system assembly as soon as the final quarter began. System
assembly took longer than anticipated due to some complications with powering the
sensor, which are discussed in further detail below. Therefore, the team was not able
to accomplish all of the test plans. However, some were accomplished, and the team
hopes to pass on the testing plan to another group of students next year. All details of this design process are covered in the following sections. The Gantt
chart shown in Appendix VI was the original progress plan for the year. While the
team still planned on completing all the tasks in the specified order, the lack of
sensor and trouble with powering the sensor caused serious delays. Throughout this project, the team learned several very important lessons. One was
the importance of communication. The team could have begun work on the project
sooner if communication had been initiated with the sponsor about what exactly he
wanted. Another lesson was about how to deal with bureaucracy. The team had to
follow up with administration and fight to figure out what was happening with the
sensor being ordered. Finally, the team learned the value of research and self-
teaching. Much of the project involved topics that no members of the team had ever
dealt with before. Therefore, a lot of research and self-teaching was required to
make progress.

ENGR459/460/461 Senior Design Project 2014-2015
35
Chapter 4. Description of the Final Design
A. Layout of Final Concept Displayed below is a model of the final design concept for the system.
Figure 13: Solid model of flat plate concept along with configuration of components. As discussed above, the housing system chosen was a flat plate. Plastic was chosen
for the material, as the team believes plastic has the least chance of interfering with
the sensor’s operation. Additionally, plastic is sturdy enough for this application, and
is more affordable than other material options. All of the separate components will
be attached to one side of the flat plate. The current plan is to purchase the flat plate
as an off-the-shelf component, and then modify it accordingly to fit the system. A
dimensioned model of the flat plate is shown in Appendix III. Most of the components will be attached to the plastic plate with screws that are
small enough to not completely go through the plate. The specific mounting methods
are discussed in detail in the next section. The components were arranged as shown
above in Fig. 13 in order to have the simplest wiring configuration possible.

ENGR459/460/461 Senior Design Project 2014-2015
36
B. Mounting Components
Battery The current plan for the battery is to secure it to the plastic plate with command
strips, or another similar adhesive material. After examining the specifications of the
command strips, the team believes that these will be secure enough to ensure that
the battery stays on the plate. If during testing it seems that the battery could easily
fall off of the flat plate, the team will investigate other methods of securing the
battery. Arduino and Breadboard The Arduino and the breadboard will be mounted into a case that will be screwed
onto the flat plate. Originally the team planned to design and manufacture a case for
the Arduino and breadboard. However, an inexpensive case which holds both
components and has mounting holes was found during research. The Arduino will be
attached using the available mounting spacers while the breadboard will be attached
to the case with adhesives. This case is shown below in Fig. 14. The team decided to
proceed with the purchase of this ready-made case instead of trying to manufacture
it.
Figure 14: Mounting case for the Arduino and breadboard.
Below is an illustration of how the Arduino and breadboard will be mounted to the
case. The Arduino will be positioned near the sensor and breadboard. The wiring
details will be discussed in the next section.

ENGR459/460/461 Senior Design Project 2014-2015
37
Figure 15: Solid model of Arduino and circuit case assembly.
The circuit is being constructed using a small breadboard and resistors. The other
option for constructing the circuit was to use a printed circuit board. However, using
the breadboard is just as effective and weighs less. Only four resistors will be used,
so assembling the resistors on a breadboard helps minimize system complexity.
Additionally, use of a breadboard is better because the resistors may need to be
adjusted in order to tune the voltage regulators and provide the correct amount of
voltage to each component. The breadboard allows ease of changing out components
when needed. The circuit diagram is displayed above in Fig. 9. The first layout of the
resistors is shown in Fig. 16, below. This does not reflect the full circuit as it does not
include voltage regulators or wiring for connecting the circuit to the other
components in the system.
Figure 16: Solid model of breadboard with resistors.

ENGR459/460/461 Senior Design Project 2014-2015
38
Sensor Mounting Bracket In order for the sensor to be correctly positioned for best use and securely attached
to the plastic plate, a mounting bracket will be used to hold the sensor upright. The
simple bracket will be made of plastic material and will be 3D printed. The bracket
has been designed to fit the size and shape of the sensor. In particular, the mounting
holes that are provided on the sensor need to match mounting holes on the bracket.
The mounting bracket will then be screwed into the flat plate. Below in Fig. 17 is an
illustration of the shape of the mounting bracket. Dimensioned drawings are included
below in Appendix III.
Figure 17: Solid model of sensor mounting bracket.
C. Wiring Configuration
The current design has three main components, shown below in the black box
diagram in Fig. 18. The gray box represents the radar sensor which has two
input/output lines labeled hi and low, as well as an input power line. The green box
represents the Arduino which is running all software. It is connected to the sensor
through the two input/output lines discussed, and has an USB out connection so that
data can be recorded on another device, such as a PC. The light blue box represents
the power circuit, which as shown in the diagram, provides power to both the sensor
and the Arduino.

ENGR459/460/461 Senior Design Project 2014-2015
39
Figure 18: Black box diagram.
This configuration is simpler and more cost effective than a smaller battery with a
DC-DC voltage converter. This layout was chosen so that the battery could supply the
entire system with enough power for the duration of various tests. The battery also
needed to provide the sensor and microcontroller with the appropriate voltages. A 12V battery helps achieve this goal through a voltage regulator that reduces the
voltage to 12V for powering the sensor. In addition, a voltage divider is implemented
to apply 7V to the Arduino microcontroller. The team chose to power the sensor and
Arduino through two wires that plug into the positive and ground terminals. On one
end, these two wires have a connector that links them to the battery. On the other
end the wires are soldered to a 24 gauge wire, which allows the sensor to be
powered through the breadboard. The connection between the sensor and the Arduino is a CAN bus. The dual
input/output wires are used to create a voltage differential which indicates logic high
or logic low. In order to read data from the Arduino a CAN shield will be attached.
Connectors for both sides of the CAN bus shield were purchased and wired by the
team in order to make a solid physical attachment. Communication over the CAN bus occurs in serial. Messages are sent as a series of
data bits preceded by a message that identifies the contents to follow. The ARS-308
2C uses an 11 bit CAN shown below.
Figure 19: 11-bit CAN opcode.

ENGR459/460/461 Senior Design Project 2014-2015
40
D. System Operation State Machine Diagram
Figure 20: Simple state machine diagram depicting operation of system.
As shown above, the system, or state machine, has two states: standby and active.
An external input such as a signal from the sensor triggers the interrupt of the
system, where the system is currently in standby mode. There are two outputs,
which affect the state of the system, that are dependent on the input signal. These
outputs declare whether a target has been detected (yes output) or do nothing and
repeat the process (no output). In the standby state, if the signal does not provide
target information no matter how many times the same input is given, the system
stays in the standby state. Once the signal provides target information, the system
shifts from the standby state to the active state. The active state does not have any
additional inputs, so the state returns to standby again until another signal triggers
the system. A state transition table is given below in Table 5.
Table 5: State Transition Table (from state machine diagram)
Current State Input Next State Output
Standby
yes Active avoid target
no Standby wait for next signal
Active - Standby wait for next signal
Process Diagram
Figure 21: Process diagram demonstrating how system operates.

ENGR459/460/461 Senior Design Project 2014-2015
41
The sensor first gathers data on whether a target has been detected or not. It then
sends a signal to the microcontroller for analysis. If the signal contains information
about a target, then the microcontroller decides whether there will be a collision or
not. If a collision is imminent the microcontroller communicates the target
information to the UAS control system so the plane can implement an evasive
maneuver in compliance with the procedure for aircraft in 14 CFR 91.113. If not,
then the sensor will continuously communicate with the microcontroller until the
sensor finally detects another target. Control System Block Diagrams
Figure 22: Control system block diagram.
As displayed in the block diagram above in Fig. 22, the control system is comprised
of the sensor, microcontroller, and a controlled process. This is a very simplified view
of the system. The sensor is an input in this case. It helps the microcontroller decide
what to do for the process. If the sensor detects a target, then the microcontroller
will begin the avoid process where it will communicate with the plane’s control
system. If no target is detected, then the system is reset, and waits for the next
signal from the sensor. Thus, the output is dependent on if a target is detected.
E. Microcontroller Software
The routine programmed onto the Arduino translates the output data from the sensor
into parseable structures readable over USB. Depending on the ID of the message
being sent, different structures will be used to hold the needed information. Output
from the sensor is sent at 500kB/s in a repeating format. Each cycle, the sensor
sends out a configuration message and 96 pairs of messages about specific targets.
The radar outputs the full list of 96 targets regardless of how many it actually sees.
This makes it necessary to limit the number of messages being sent via the serial
connection so the system is not bottlenecked by the Arduino. Shown below is the
code needed to read from the CAN.

ENGR459/460/461 Senior Design Project 2014-2015
42
#include <SPI.h> #include "mcp_can.h"
unsigned char Flag_Recv = 0; unsigned char len = 0; unsigned char buf[8]; char str[20];
MCP_CAN CAN(10); // Set CS to pin 10 void loop() { if(CAN_MSGAVAIL == CAN.checkReceive()) // check if data coming { CAN.readMsgBuf(&len, buf); // read data, len: data length, buf:
data buf for(int i = 0; i<len; i++) // print the data { Serial.print(buf[i]);Serial.print("\t"); } Serial.println(); } } This program will read the network for any message it can receive, and print the
contents of the message to the console. The loop function is Arduino standard
syntax. While the microcontroller is powered it will continuously run the contents of
the function. Due to the relatively slow serial speed compared to the CAN speed this
routine will not function properly. It is important to filter the output stream for
required data when testing. The simplest way to filter for simple tests is by message
ID. Each CAN message has an ID preceding the maximum eight bytes of data.
F. Algorithm Development Once the system is fully setup as described above, then the algorithms for reading
the data and developing an avoidance model will be implemented. Shown below in
Fig. 23 is a flowchart describing what the system of both algorithms will accomplish.
Figure 23: System algorithm flowchart.

ENGR459/460/461 Senior Design Project 2014-2015
43
Originally, the goal was to develop one algorithm to complete all four tasks, so that
the avoidance path could be communicated directly to the control system of the
vehicle. However, upon examining these four tasks, the team realized that
developing a live responding avoidance algorithm which would output direct
commands to the aircraft control system was outside the scope of what was possible
to accomplish this year. Therefore, the team split the software into two separate sections. One section is
going to be used for data collection and interpretation, and will be written to the
Arduino. This software will be accounting for two out of the four states of the system
algorithm, shown above in Fig. 23. The first is the scanning state. This will be the
standard phase when the system has not detected any targets. The next state,
target detection, is entered when a targets is detected by the radar. The system will
remain in this state until the targets can be positively differentiated from possible
noise. A more detailed flowchart and description of this process is shown below. The job of the data collection software is split into two sections. The first task is to
set up the sensor with the correct initialization parameters. This includes the angle it
is mounted at with respect to the ground, the distance mode (farthest away it should
be scanning), and what size of targets to be looking for. The second task is to
periodically query the sensor for a list of the targets it sees, and to record that data
into a structure for use by the avoidance algorithm. The sensor will output a list of
signals via a CAN message. That CAN message once written into memory on the
Arduino will need to be parsed into an array of targets. Each target will be a potential
hazard to be avoided. Included in the target’s message are these parameters:
velocity, heading, size, and likelihood of being noise.

ENGR459/460/461 Senior Design Project 2014-2015
44
Figure 24. Detailed system state machine diagram.
This algorithm will be developed before and during the time testing is occurring.
Initial tests will require a more simple version of the data collection algorithm, while
final testing will require a more robust and detailed version. Therefore, the algorithm
will need to adapt and expand as testing progresses. Once the data from the sensor has been collected and stored, it will be transferred
into Matlab, where the second half of the system algorithm will be developed. This
will be the avoidance algorithm. The specific steps that the algorithm will progress
through is shown in the flowchart in Fig. 25 below.

ENGR459/460/461 Senior Design Project 2014-2015
45
Figure 25: Avoidance algorithm flowchart.
All of the data going into this algorithm will be stored data, not live data. However,
the algorithm will cycle through the above flow for each data point in order to
demonstrate what the sensor is detecting and model how a vehicle would respond in
live time if this algorithm was incorporated into the control system of a vehicle. An important aspect of the avoidance algorithm to note is that the system can only
choose to move to the left or right in order to avoid the oncoming target. This is
because of a limitation in the sensor data output. The sensor does not output the
vertical location of any targets, only the target’s location on the horizontal plane.
Since the system can not know where targets are in relation to itself vertically,
choosing to climb or dive to avoid a target could put the system on another collision
course instead of putting the system on a safe path. This is a huge limitation to the
system, and is discussed further in later sections. The construction of this avoidance model algorithm will take place throughout the
duration of the testing of the system as the model is ultimately going to be used to
model the dynamic testing data, which will be taken during the final phase of testing
(more detailed testing plan discussed below). Some initial testing of the avoidance
model algorithm will be completed with sensor data from the initial static tests. This
will determine if the avoidance algorithm is functioning properly. Once proper
function of the avoidance model algorithm is confirmed, the dynamic data can be run
through the algorithm to show the final output of the sensor and potential avoidance
path of the vehicle.

ENGR459/460/461 Senior Design Project 2014-2015
46
G. Analysis Results The nature of this project requires extensive analysis to show that this system either
will or will not be viable. However, since this is a proof of concept project instead of a
design-focused project, the analysis will need to be completed after testing. There is
no other applicable analysis at this time that would be relevant or useful to achieving
the end goal of this project. Therefore, the team is in the process of ordering the sensor so that testing can be
started. Once some data is gained from testing, meaningful analysis will be
completed. This analysis will likely be completed in Matlab.
H. Prototype Cost Analysis
Next, the team wanted to examine the potential cost of this system. First the team
examined the prototype cost. The potential future manufacturing cost was discussed
in Chapter 5 Section D.
Table 6: Research and Development Costs
Item Cost($)
Sensor Continental
4100.00
Microcontroller Arduino Uno
24.99
Battery Powerwing YTB50004
79.99
Circuit 13.36
Total 4218.34
The costs of each component is laid out and calculated above in Table 6. The cost of
the sensor, microcontroller, and battery are all the respective company’s listed prices.
The sensor purchase order form has been submitted and the team is waiting to
receive the sensor. These forms are attached in Appendix IV. The circuit price is
estimated based on the sum of resistors, voltage regulators, the breadboard, and the
case for the Arduino and breadboard. Additionally, the circuit price includes the wires
to be created for powering the sensor and for communication between the sensor
and microprocessor. The team owns two Arduino Uno, boards so the Arduino will not
be factored into the team’s final prototype cost. However, the team plans on
purchasing two batteries; one for testing of the actual system, one for testing the
battery’s ratings. This test is further described below.

ENGR459/460/461 Senior Design Project 2014-2015
47
I. Safety Considerations The current safety considerations the team has contemplated for this system fall into
two categories. One is radar emissions and the other is system failure. These are
discussed in detail below. Radar Emissions The general public will be concerned about the radar emissions of the system. Many
people are under the impression that all radar emissions can cause negative health
effects. Many of these fears are unfounded, but there are certain situations where
radar emissions can negatively impact a person’s health. In order to ensure that the
radar emissions of this system have no negative health effects on people, the team
will ensure that the system adheres to the regulations set by various governmental
institutions, including those from the Federal Communications Commision. In
examination of the sensor data, the team discovered that the company claims that
people should not be harmed in any way by the radar emissions from this sensor.
This is supported by the fact that the company has adhered to international
regulations of radar emissions, including the regulations of the Federal
Communications Commission (FCC). Additional support for this claim was shown with
references to independent studies that have been completed. Therefore, this safety
concern has been accounted for as best as the team is able to. System Failure It is clear that system failure is a safety concern. If the system does not detect an
oncoming target, correctly determine a way to move off of a collision path, or
communicate the control deflections needed to move off of the collision path, the
system could collide with an oncoming target. This could result in not only system
destruction, but complete destruction of the aircraft utilizing the system, and
destruction of or damage to whatever target was collided with. If such a collision
were to occur in a populated area, then it could also potentially cause harm to a
person. This is a very important concern. It will need to be addressed by making
both the sensor detection and the avoidance model as accurate as possible. Nothing
can be perfectly accurate, but the team will strive for the highest degree of accuracy
possible. The accuracy of the sensors measurements will be determined through
testing. Extensive work on the avoidance model will be completed to ensure that it
can determine the correct response to as many situations as is feasible. Component
redundancies will also be included to help prevent individual component failures from
causing the entire system to fail. Some concerns that the team has with the system
are further elaborated upon in the next section. These concerns will need to be
elaborated upon or addressed before the team can give a recommendation regarding
the potential of the system.
J. System Risks As the project has proceeded, the team has discovered some risks in the system.
The team is concerned and hopes that further research and testing will help mitigate
these risks. Some of the risks discovered thus far are radar interference, varying
operating conditions, and lack of vertical data output.

ENGR459/460/461 Senior Design Project 2014-2015
48
Radar Interference Radar interference can create risk for the system. If the system runs into
interference the data can be skewed which may create error. Then the
microcontroller may interpret the data incorrectly and instruct the plane to perform a
task which may result in a crash. This is a problem that has not been entirely
considered. The team is looking into simple filters, however that may not be enough
to fix the problem as other radar systems may be running on the same frequency. Operating Conditions The team is assuming that the sensor has been extensively tested in different
weather and environmental conditions. The fact that this sensor is currently being
utilized in automobiles gives the team confidence that the sensor will be able to at
least function in almost all conditions. There is a chance that the performance and
accuracy of the sensors detection abilities will be diminished. The team will make
sure to take this into account in any data analyses completed. The rest of the prototype system is at a greater risk of being affected by weather and
environmental conditions. Electrical components are very sensitive to environmental
conditions and so will need to be closely monitored; verification of proper component
function will need to be completed before any testing. Component malfunction could
cause errors in the data. Currently the plan is to have the system exposed to the elements. Therefore, it will
not be possible to complete any testing in bad weather conditions. The team will also
need to monitor the system closely to ensure that no components are malfunctioning
or improperly connected. Precautions must be taken in all system handling to ensure
the safety of the system. Lack of Vertical Data Output Recently when reviewing the data outputs from the sensor, the team discovered that
the sensor did not output any data in the z-direction. The sensor does detect targets
in all three dimensions, but does not differentiate where targets are vertically. Since
this system is typically used in a car, which only travels in two dimensions, and
cannot move up or down vertically, it makes sense that the sensor would not output
this data. A car is only operating on a single plane and so would have no use for the
data in the third dimension. An aircraft, however, does travel in all three dimensions, and often changes its
vertical position. Therefore, the lack of vertical data is a severe limitation on the
system. Since the system does not know where targets are in relation to itself
vertically, the system can only recommend a move to the left or right to avoid a
target, as mentioned above in the avoidance algorithm flow chart. Otherwise, the
system could be putting itself on a collision path with the target. Testing will show
whether this limitation cripples the system, or if this limitation can accommodated so
the system can still function properly.

ENGR459/460/461 Senior Design Project 2014-2015
49
K. Maintenance and Repair Considerations
Due to the re-scoping of the project into a proof of concept, maintenance and repair
considerations are not nearly as important as for a design focused project. This
system is not intended to be commercially manufactured, but is rather meant solely
to prove that such a system either could or could not work. Therefore the only
maintenance and repair considerations that need to be completed are those that are
needed for the system to function during testing. For this proof of concept, if the
system is not working the team will first check that all connections are secure and
correct, including the circuit and the pin layouts of the microprocessor. The next step
will be to evaluate the voltage at each node to ensure each component is getting the
required power for operation of the subsystem. Then the team will create a test to
check the output after each stage in the code to guarantee the outputs will be
correct. Proper function of the sensor is an important consideration. Due to the large cost of
the sensor, measures were taken during testing to insure its safety. Additionally, the
sensor is provided with a manufacturer’s warranty should it fail. All other
components are easily replaceable if they should fail.
Chapter 5. Product Realization
Since this project morphed into a proof of concept and research project rather than a
strictly design-focused project, the manufacturing of the system was important. It
was necessary to have a system before the team could begin testing. The team
developed a plan for how the system would be assembled before the sensor arrived.
However, once the sensor arrived and assembly actually began, the team adjusted
the plan to best fit the system. This process is discussed in further detail below.
A. Plan for Manufacturing Some manufacturing was required for this project, though most of the system was
made of commercial off the shelf components. Some additional manufacturing will be
required in the future for testing apparatus as well. This section describes the team’s
initial plan for manufacturing the system. Component Manufacturing Most of the components were purchased from a company. The dimensions of the
components did not directly affect the successful application of the system. The
mounting components were to be used for attachment and support of the
subsystems only. The plastic flat plate was to be purchased from a local source, or
online, depending on where the team was able to find the plate with the closest
dimensions to the design. It was not vital for the plate be dimensionally exact; for
instance, the plate could be larger in size, as all the components would still fit on it,
but could not be smaller. The sensor purchase order form was submitted through Cal
Poly. The sensor was purchased from Continental, whose distribution center and
manufacturer are located in Germany. The microprocessor was purchased from the
Arduino online store. Two members of the team owned Arduinos so new units did not
need to be purchased. The circuit was assembled using parts that team members
have collected over the years; these parts included breadboards, wires, and voltage

ENGR459/460/461 Senior Design Project 2014-2015
50
regulators. The battery was to be purchased from the Hobby Express website. This
battery was designed for hobbyist RC planes but could be used in many other
applications, and is perfect for powering the system. The team planned to use a case
for the Arduino and breadboard which would be mounted onto the flat plate. This
case was to be bought from a distributor. However, there are two components that
needed to be manufactured: the wires and the mounting bracket. Wires Two wires had to be made: one for providing power to the sensor and the other for
communicating with the sensor. The team ensured that the power cable had the
correct connector for powering the sensor. The other end of the cable would be
correctly connected to the power circuit so that the sensor could be powered.
Communication would be achieved by connecting the mating part of the sensor’s
vehicle connector to the microprocessor. The microprocessor side of the wire would
have individual wires all connected to the main wire, which would then connect to
the specified ports of the microprocessor. For more details on the wiring configuration
refer to Chapter 4 Section C. This wiring configuration must be utilized or the sensor
will not “wake up” and function properly. Mounting Bracket As stated previously, the bracket would be either purchased and modified to
successfully support the sensor, or completely made by 3D printing. Plastic would be
used to avoid affecting the output of the sensor. Additionally, plastic is relatively
lightweight and inexpensive. A dimensioned drawing of the bracket is displayed in
Appendix III. System Assembly The only other manufacturing task that needed to be completed would be the
assembly of the system. First, all of the components would need to be affixed to the
plastic plate. The battery would be attached with a command strip. The Arduino
would be screwed to the case and the breadboard would be glued into the case. The
case would then be screwed onto the plastic plate. The sensor would be screwed
onto the mounting bracket, and then the mounting bracket would be screwed onto
the plastic plate. All screws going into the plastic plate must be sized so as to not
protrude through the back side of the plate. Next, the components needed to be connected with wiring. First the power circuit
would be constructed. Then, the power circuit would be connected to the battery and
the Arduino. The manufactured power wire would be used to connect the battery to
the sensor. The other set of manufactured wires (with the shield for the Arduino)
would connect the Arduino to the sensor for CAN bus data transmission. Once all the
components were properly connected, the wires would be secured to the plastic plate
with electrical tape. This would minimize the chances of connections coming apart.
Finally, the system would be connected to the data reading device (in this case, most
likely a laptop). This would be done with a USB connection. This full system would only need to be assembled once (except the connection to the
data reading device, which will need to be done before each test), but all of the
wiring connections, including the components of the circuit, should be examined

ENGR459/460/461 Senior Design Project 2014-2015
51
before every test to ensure that component failure does not cause the entire system
to fail. This would allow the team to accurately test the sensor. If other system
components fail, the team would have no way of accurately gathering data about the
sensor’s capabilities.
B. Actual System Assembly The plan for assembling the system described above was a good starting point.
However, once the physical components arrived, the team realized that there were
easier and more efficient ways of assembling the system. These methods were
implemented and are described below. The components needed to be configured to create the most compact system
possible and allow the sensor to be positioned correctly. Though originally the team
planned to have the system mounted on a flat plate, it ended up being easier and
safer for the system to be stored inside a box during testing. This allowed the
batteries and delicate circuit components to be protected from the environment. This
meant that the sensor bracket was unnecessary because the sensor was more easily
mounted on the outside of the circuit box. The team also chose to disassemble and
reassemble the system for each test. This allowed all of the components to be stored
separately in more secure containers. This meant that none of the components were
secured in any way to the box (except the sensor which was screwed onto the
outside of the box, as previously mentioned). The system assembly can be seen in
Fig. 26 below.
Figure 26: System assembly.
C. Testing Assembly In order to begin testing, a mechanism needed to be built to hold the system in a set
position so the sensor and system would always be at the same height above ground
during different tests. The team chose to build a mechanism similar to a tripod which

ENGR459/460/461 Senior Design Project 2014-2015
52
would allow the system to rotate about one axis. The mechanism was designed to
help the team complete the first test. The team wanted to create an apparatus that
was simple, inexpensive, and disposable. A simple, lightweight, and portable apparatus was built from supplies available at a
local hardware store. PVC is light and can be used to create different structures using
a variety of elbow and tee connections. It is also easy to handle and cut and is sturdy
enough to support the system. Eight PVC pipe sections were used with ten different
connections to create the test apparatus shown in Fig. 27 below. The PVC was cut to
size with a bandsaw available in the machine shops at Cal Poly. The pipe sections
were attached to the fittings with PVC cement. Additionally, the team later spray
painted the test apparatus black for aesthetic purposes.
Figure 27: PVC testing apparatus.
The most important parts of the PVC assembly were the steel rings and foam rings
used to allow 360 degree rotation of the system. This capability was vital for testing.
These components can be seen below in Fig. 28. These rings were only available in a
one inch diameter size. However, the team did not want to drill one inch diameter
holes into the system box so one test apparatus could be used, especially since
different types of test apparatus would likely be required for other tests. Also, the
team did not want to have to open and close the system box every time the sensor’s
orientation needed to be adjusted. Therefore brackets were purchased to connect the
system box to the testing apparatus. The only brackets which were an adequate size
for this system were made of steel.

ENGR459/460/461 Senior Design Project 2014-2015
53
Figure 28: Close up, bottom view of box, bracket, steel rotation ring and PVC
connections.
The steel brackets caused some complications during manufacturing. Steel is an
extremely high strength alloy that hardens at very high temperatures. The biggest
available drill bit at the machine shop was slightly less than one inch. This forced the
team to use creative measures to enlarge the original bracket holes to the required
size. In order to drill one inch holes in the brackets with the drill press, the team
started with small drill bits and then increased the size slowly until the hole was the
desired size. The lowest available speed for the drill press was used so that the alloy
would not heat up, as this would have caused the material to harden and further
complicate the process. Once the largest drill bit was used, an electric grinder was
utilized to slowly widen the holes until they were one inch in diameter and fit the
pipe fittings. The proper grinder tip was used; it was one that could grind metal
without damaging the small extrusions on the grinder tip. Black rubber rings were
used to make the connection as tight as possible and prevent metal to metal contact. The rest of the holes were easy to drill with the drill press. The team needed two
small holes on each bracket to connect the bracket to the bottom of the box. A
bottom view of the bracket, bolt, and screw assembly is shown above in Fig. 28 and
a top view is shown below in Fig. 29. Therefore, only two small holes needed to be
drilled into the circuit box for the testing apparatus. These holes were simple to drill
since the box is made of hard plastic. Nuts and bolts were used to connect the
assembly. The team did not need to drill threaded holes because of the use of nuts. Finally, the sensor needed to be mounted to the box. The sensor had four
unsymmetrical threaded extrusions for mounting. Therefore, the team drilled holes
into one side of the box and used nuts to secure the sensor.

ENGR459/460/461 Senior Design Project 2014-2015
54
Figure 29: Close up, top view of bracket, bolt, and box connection.
D. System Wiring
The team initially struggled to turn the sensor on and get data output. It took the
team a significant amount of time to figure out that a specific component was
missing and that the setup code needed to be adjusted to properly initialize the
sensor. This section describes how the team overcame this obstacle. A minimum voltage of 12V (or a maximum of 24V, according to the provided
datasheets) must be applied to the sensor to “wake” it up. The peak current can be
up to 3A immediately after powering on. As shown in Table 7, the supply voltage
must be connected to Pin 1 and ground to Pin 8. As described previously in Chapter 3, the battery used to power on the sensor was
rated at 12V and 1.3Ah. If the sensor does not receive enough current after
powering on, then it will power down. Therefore, the battery must have enough
capacity to supply up to 3A. The chosen battery fulfills this requirement. The sensor
consumes about 500mA at rated voltage when it is operational. Therefore, a battery
with a high enough amp-hour rating was chosen to achieve the desired endurance of
the battery. The team must remember to be safe while handling the batteries. This includes
making sure the wires do not touch while they are connected to the battery and that
the plastic coverings are kept on the individual terminals when the battery is not in
use to prevent short circuiting. There are also some important things to note regarding the data connection wiring.
It is important to keep the length of the CAN bus connection short enough to prevent
reflections from occurring. Standard CAN bus cables have internal terminating
resistors to eliminate this concern. The CAN shield has one built in resistor which is

ENGR459/460/461 Senior Design Project 2014-2015
55
sufficient as long as the cable is not several feet long. The cable provided by the
sensor’s manufacturer only had one built in resistor, which was insufficient for
preventing reflections. Therefore the team fabricated a cable. The mating connector
for the sensor is an 8 pin connector. Pins 1 and 8 are reserved for power and ground
respectively. Pins 3 and 6 are reserved for high and low CAN bus, respectively. Wires
were crimped in the required configuration.
Table 7: Pinout of Continental Sensor
E. Recommendations for Future Manufacturing PVC is an excellent resource for testing apparatus. However, the team should keep in
mind the weight of the system in order to prevent excessive bending from occurring. Another recommendation is to avoid thick steel when using the drill press. As
mentioned previously, steel is a high strength, carbon-iron alloy that hardens at high
temperatures. When drilling large holes, it is best to either avoid metals or use a
different means of drilling holes. Some other resources which can be utilized for
drilling holes are CNC machines or mills. However, both of these do require higher
levels of machinery experience or CNC coding knowledge. Finally, it is very important to plan and mark the places where desired holes should
be drilled. This is especially important when dealing with unsymmetrical components
(like in the case of the sensor mounting extrusions). Accuracy in these
measurements will prevent damage and mistakes when attaching the necessary
components.
F. Manufacturing Cost Analysis As seen previously in Chapter 4 Section I, the team’s prototype is rather expensive,
costing about 85% of the $5,000 budget given to us. However, the cost of mass
producing the system is decreased by about 85% from the prototype cost, as seen
below in Table 8.

ENGR459/460/461 Senior Design Project 2014-2015
56
Table 8: Cost per Unit of Product (for mass production)
Item Cost($)
Sensor Continental
553.82
Microcontroller Arduino Uno
19.99
Battery Powerwing YTB50004
79.99
Circuit 8.72
Total 662.52*
*These costs do not take into account the cost of personnel needed to manufacture the system or factory needed to produce system and are the costs of shipping from Germany The company selling the sensor provided the team with the data for mass
production. However, the microcontroller and circuit costs were estimated. In reality
a corporation could most likely purchase these two items for much less. The actual
price will depend on contracts between companies. The company selling the batteries
has no indication of discounts for mass purchases, but again a corporation could
probably negotiate with the providing company.
Chapter 6. System Testing
Another important part of the project was testing, which was the main focus of the
project. An overview of the testing plan is shown below. These procedures were
developed with additional detail before testing, and were adjusted as testing
occurred due to changes in understanding of how the system works, as well as
technical difficulties that the team anticipated would occur. The team was able to
accomplish some testing, but not all. The delays in receiving the sensor and attempt
to turn it on put the team behind schedule, which prevented all the tests from being
finished. Finally, the team assembled a specification checklist to ensure that all the
requirements specified by the sponsor were being met.
A. Testing Plan
When the team originally looked at how to test the sensor, there was a plan for
completely different tests than are currently being implemented. The need for testing
changed as the team learned more about how the sensor functioned. There are still a
lot of unknowns about how the sensor functions. Therefore, the team anticipates that
this test plan will continue to change as testing continues. As more is learned about
what the data output looks like and what the sensor is actually capable of, more
questions about sensor performance will be generated. Therefore, the final test plan
may include different plans than shown here. Additionally, as testing progresses,
technical difficulties may be encountered which force a change in test procedures.
The team is prepared to handle such changes and to be flexible about the tests being
completed.

ENGR459/460/461 Senior Design Project 2014-2015
57
The overall objective for all testing is to determine if there are conditions in which
the sensor will become “confused” and output incorrect data. Therefore, a multitude
of complex tests will be completed to see how the sensor handles a multitude of
targets in different conditions. The current testing plan for the sensor is described
below. There are eight different phases of testing with detailed plans. The actual
testing plans for each phase are attached in Appendix VIII. A brief overview of each
phase is included below. Additionally, there are some potential future tests that the
team does not have detailed plans for yet. The team was concerned that these tests
would not be completed because of time constraints, and this proved to be true.
However, a future team should be able to take the base ideas and expand them to
make detailed plans. A safe work procedure was created to show how to best handle the sensor and
related system to ensure that no one is harmed while testing is completed. This safe
work procedure is attached in Appendix IX. Power System Characterizing the power system will allow the team to check the theoretical analysis
previously completed to determine how much error is present. The two analyses that
will be checked are the voltage calculations and the battery life. The voltage calculations will be checked with a voltmeter. The voltage will be
measured across the battery and across all the voltage dividers to ensure that the
proper amount of voltage is going to each component. To test the battery life, the battery will be run, supplying the expected current of the
system, until it dies. This will provide the actual lifespan of the battery. This will allow
the team to know the limitations of the system, and to properly care for the batteries
so that they last as long as possible. Ground Interference Since this radar sensor is regularly used in a car, the team has assumed there must
be some kind of filter implemented so that the sensor is not constantly detecting the
ground. This assumption needs to be verified with a test. This is a very simple test.
The sensor will first be pointed directly at the ground. Then, it will be directed at a
point where the ground is in part of the sensor’s field of view. Finally, the sensor will
be pointed directly up into the air so that the ground is not at all in the sensor’s field
of view. The data from these three tests will be compared to see if there is any
difference when the ground is in the sensor’s field of view. Ideal Target Material The sensor outputs a target detection confidence rating, which shows the team how
confident the sensor is that a target is a real target. One thing the team feels will
affect this confidence is the type of material the target is made of. Therefore, the
team wanted to determine which material the sensor detects best. The rest of testing
will then be completed with targets of this material. The list of materials being tested
is aluminum, steel, copper, foam (preferably the type RC planes are made of),
carbon fiber, humans, ice, plants, and plastic. A target of each material type will be
chosen and measured so that the exact dimensions are known. Then, the target will

ENGR459/460/461 Senior Design Project 2014-2015
58
be placed at a point in the sensor’s field of view where the team is confident the
sensor should be detecting the target. This point will be directly in line with the
sensor at some distance away. The data output will be recorded, then the same thing
will be done with the next type of material, and again until all materials have been
tested. Determining Actual Field of View The team needs to know exactly where the field of view of the sensor begins and
ends, so that the accurate detection of targets can be evaluated in different
applications. First, the field of view specified by the data sheet for the sensor will be
marked out so that the team knows where the sensor should be detecting targets.
Then, a target of the ideal material (determined in the previous test) will be placed
at as many points as possible within this field of view. The positions of the target will
be recorded by hand so that the actual position of the target can be compared with
the sensor data output. This will allow the team to determine where the sensor can
truly detect a target and will allow us to better evaluate sensor performance for the
remainder of testing. Target Elevation Changes The sensor does not output any data in the z dimension. However, targets will still be
moving in the z direction with respect to the sensor. Therefore, the team wants to
determine if changing the elevation (or z position) of a target affects the x and y
position output data, even if the target does not move in the x or y directions. The
team is hoping that moving in the z direction will have no effect. If it does, the team
will need to determine a way to mitigate this effect so that accurate data can still be
obtained. Detection of Different Sized Targets Smaller targets are less reliably detected at longer ranges. Therefore, several
different sizes of targets of the best detected material will be placed in the field of
view of the sensor at different ranges to determine where the sensor stops detecting
different sized targets. First the targets need to be accurately measured so that the
sensor output can be evaluated later. Then, the targets will be placed in the field of
view. First, they will be placed close to the sensor. Then, they will be slowly moved
further and further away from the sensor. This will be done for each size of target
and will allow the team to further determine the limitations of the sensor’s detection
abilities. Additionally, the team wants to determine exactly what dimension the
sensor is measuring and how the data output will change if the target is rotating. Multiple Target Detection The team is concerned that the sensor will have trouble keeping track of multiple
targets. The team would like to determine how the sensor tracks different targets, as
well as the conditions that will cause the sensor to output incorrect data due to
confusion. One concerning condition is when targets are overlapping. The team
needs to determine what separation distance must between targets before the
sensor detects that there are two targets instead of only one. The team would like to
determine how the sensor prioritizes the targets it sees. Finally, the team needs to

ENGR459/460/461 Senior Design Project 2014-2015
59
look into how the sensor deals with both moving targets and stationary targets being
in its field of view. Velocity Detection The targets the sensor is detecting will largely be moving. Therefore, the team
needed to examine the sensor data output for moving targets. This set of testing will
be completed with a hanging wire system, which the team is in the process of
developing. First a target will be moved across the field of view in different directions
to determine if the sensor has a problem with any specific directions in the same
plane as the sensor. Then, multiple targets travelling in different directions will be
tested in the same plane as the sensor. Another concern the team has, as previously
mentioned, is any movement in the z direction. Therefore, the team will move one
target in the x, y, and z directions to see how the sensor handles this change. Finally,
the team will complete testing with two targets moving in different directions, but
only in the same plane as the sensor, with one target moving in all three directions. Future Testing The team has further concerns about the ability of the sensor to perform adequately.
Therefore ideas for several other tests which will help determine this were
developed. The team hoped that there would be enough time to complete all of the
above testing as well as these tests, but was concerned about the time constraints
created by the school year. These tests were not completed, so the team hopes to
pass the project with these test plans on to another team, so that they can
successfully finish the testing of this system.
B. Test Results After struggling to power the system, the team was finally able to start testing.
Originally the team planned to strictly follow the order of the testing plan described
above. However, so little time was available for testing that the team prioritized the
tests according to what was most interesting and easiest to execute. Three days of
testing were completed. The first was used to characterize the sensor, the second
was used to test ground interference, and the third was used to test the sensor’s
ability to measure distance. Data analysis was also completed on the results of the
test and is described below. Sensor Characterization Once the team was able to power the sensor, the next step was to attempt to
characterize the sensor by attempting to collect data. Therefore, the team found a
test location where there was a large area of open space: the Cal Poly recreational
fields. A picture of this testing area is shown in Fig. 30 below. This location allowed
the team to complete testing without having to worry too much about targets
interfering with data gathering.

ENGR459/460/461 Senior Design Project 2014-2015
60
Figure 30: Test location.
The purpose of this testing session was to practice setting up the system, familiarize
the team with the data output format, and inspect the data output to gain insight on
how the sensor functions. The sensor has so much capability so it was important for
the team to familiarize themselves with sensor. For this test, the testing apparatus
discussed above was not used. This made some of the testing difficult, which
encouraged the team to utilize the testing apparatus in all future tests. Additional
apparatus will need to be designed and manufactured for other tests. The data output that the team examined was the number of targets detected, the
distance of those targets from the sensor, and finally, the velocity of the target in
relation to the velocity of the sensor. Some team members volunteered themselves
to be targets for the sensor. The members walked through the field of view of the
sensor at different distances and speed to examine how the sensor split up data
outpoints. The team also discovered that putting certain types of material in front of the sensor
would block the signal. This will need to be taken into account when implementing
such a system in a UAS. These tests were not completed according to the procedures
described previously, but instead were done informally. Therefore, the team did not
save any data, and could not complete data analysis. However, the team walked
away feeling confident about their understanding of the sensor’s capabilities and data
output. Some members of the team are monitoring data output in Fig. 31 shown
below.

ENGR459/460/461 Senior Design Project 2014-2015
61
Figure 31: Data output being monitored by team members during testing.
Ground Interference Next, the team completed ground interference testing. Testing was done on the Cal
Poly recreational fields described above, on a 64 oF day with scattered clouds and 14
miles per hour winds. The objective of this test was to determine whether or not the
sensor detects the ground as a target when it is placed in different orientations.
Three different orientations were examined: the sensor pointing straight up at the
sky, parallel to the horizontal, and straight down at the ground. In each orientation,
the number of targets detected by the sensor was gathered from the sensor for
approximately five minutes. Each data set had a different number of points in it. In
order to compare the data from each orientation, the team chose to limit the number
of data points to 3500, and compare those. Shown below in Fig. 32 is a histogram of
the number of targets detected by the sensor.
Figure 32: Number of targets detected by the sensor when oriented to point straight
at the sky.

ENGR459/460/461 Senior Design Project 2014-2015
62
It is clear that the sensor detects zero targets most of the time. However, there are a
significant number of targets detected once or twice, even though the team intended
there to be no targets within the field of view. The team is not sure what caused this
phenomenon. Next, in Fig. 33 is the data output from when the sensor’s beam is parallel to the
ground.
Figure 33: Number of targets detected by the sensor when it was oriented so that
the sensor’s beam was parallel to a flat ground slope.
Again, it is clear that the sensor does not detect any targets the majority of the time.
However, there is still a small percentage of data points where one target is
detected, even though the team was unaware of any targets within the field of view. Finally, the team wanted to complete testing when the sensor was pointed straight at
the ground. Initially, the team did just that and there was little to no targets
detected. However, the sensor was in the test apparatus, which is only about a foot
tall. Therefore, there was some concern about the sensor being too close to the
ground to detect any targets. Therefore, the team chose to carry out a similar test.
The sensor was placed at the top of a hill and the sensor beam was pointed parallel
to the slope, towards the bottom of the hill where the ground flattened out again.
This testing orientation is shown in Fig. 34 below.

ENGR459/460/461 Senior Design Project 2014-2015
63
Figure 34: Testing with the sensor beam directed parallel to the slope of a hill.
The results of this test are shown below in Fig. 35.
Figure 35: Number of targets detected by the sensor when oriented so the sensor
beam was pointed parallel to a slope at a flat portion of ground.
In this orientation, the sensor detects a target at the majority of the data points.
Only in 4% of the data points does the sensor detect nothing, even though there
were no targets in the field of view of the sensor. This was a very disconcerting
result, especially since there were data points where the sensor detected up to seven
targets. In all three orientations the team found that the sensor would detect targets that
were not actually present. Some possible explanations for this are the possibility of
false-positives being detected by the sensor, an error being present in the data
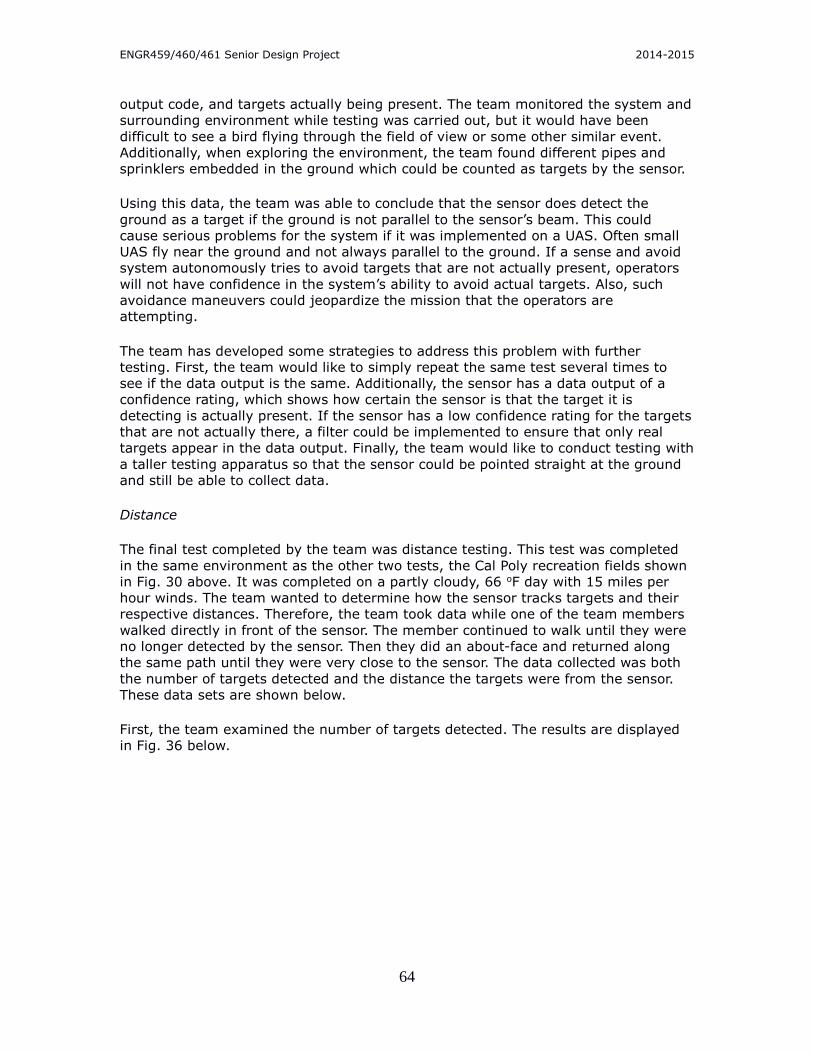
ENGR459/460/461 Senior Design Project 2014-2015
64
output code, and targets actually being present. The team monitored the system and
surrounding environment while testing was carried out, but it would have been
difficult to see a bird flying through the field of view or some other similar event.
Additionally, when exploring the environment, the team found different pipes and
sprinklers embedded in the ground which could be counted as targets by the sensor. Using this data, the team was able to conclude that the sensor does detect the
ground as a target if the ground is not parallel to the sensor’s beam. This could
cause serious problems for the system if it was implemented on a UAS. Often small
UAS fly near the ground and not always parallel to the ground. If a sense and avoid
system autonomously tries to avoid targets that are not actually present, operators
will not have confidence in the system’s ability to avoid actual targets. Also, such
avoidance maneuvers could jeopardize the mission that the operators are
attempting. The team has developed some strategies to address this problem with further
testing. First, the team would like to simply repeat the same test several times to
see if the data output is the same. Additionally, the sensor has a data output of a
confidence rating, which shows how certain the sensor is that the target it is
detecting is actually present. If the sensor has a low confidence rating for the targets
that are not actually there, a filter could be implemented to ensure that only real
targets appear in the data output. Finally, the team would like to conduct testing with
a taller testing apparatus so that the sensor could be pointed straight at the ground
and still be able to collect data. Distance The final test completed by the team was distance testing. This test was completed
in the same environment as the other two tests, the Cal Poly recreation fields shown
in Fig. 30 above. It was completed on a partly cloudy, 66 oF day with 15 miles per
hour winds. The team wanted to determine how the sensor tracks targets and their
respective distances. Therefore, the team took data while one of the team members
walked directly in front of the sensor. The member continued to walk until they were
no longer detected by the sensor. Then they did an about-face and returned along
the same path until they were very close to the sensor. The data collected was both
the number of targets detected and the distance the targets were from the sensor.
These data sets are shown below. First, the team examined the number of targets detected. The results are displayed
in Fig. 36 below.

ENGR459/460/461 Senior Design Project 2014-2015
65
Figure 36: Number of targets detected during distance testing.
The majority of the time the sensor did not detect any target, even though there
should have been one target for every data point. As shown in later data output
figures, this large number of zero target points largely represents the portion of the
test where the sensor can no longer see the target. It is reassuring to see that the
sensor only detects more than one target a few times during the test. Next, the team examined the distance that each target was from the sensor. The
unfiltered results are shown below in Fig. 37.
Figure 37: Distances of targets from the sensor.

ENGR459/460/461 Senior Design Project 2014-2015
66
The above plot shows a smaller number of data points than was actually taken
because there was no distance output for the zero target data points. It is also
difficult to see a trend because of random spikes in the distances. The data was
filtered by discarding any distance point that was more than four meters larger than
the previous distance point. The filtered results are shown below in Fig. 38.
Figure 38: Filtered data showing target distances from the sensor.
The trend of the plot is much easier to see once the data is filtered. The trend clearly
reflects the path of the target traveling away from the sensor, then returning to the
sensor. Additionally, the plot shows that the target returned to the sensor more
quickly than it travelled away. The spikes of data near 300 data points represent the
time right before and right after the target is not detected by the sensor. The team
found it logical that the data output at those points in time would be less accurate
than during the rest of the test. Next the team examined the data output including the zero target data points. The
unfiltered data is shown in Fig. 39 below.
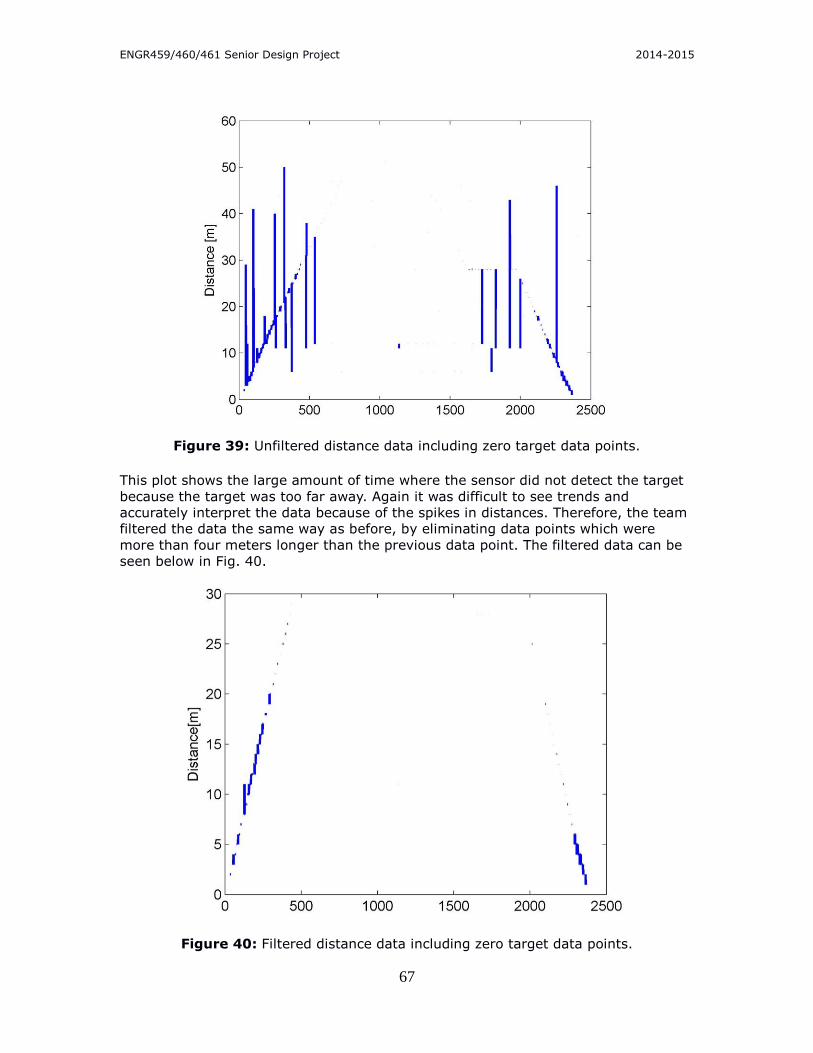
ENGR459/460/461 Senior Design Project 2014-2015
67
Figure 39: Unfiltered distance data including zero target data points.
This plot shows the large amount of time where the sensor did not detect the target
because the target was too far away. Again it was difficult to see trends and
accurately interpret the data because of the spikes in distances. Therefore, the team
filtered the data the same way as before, by eliminating data points which were
more than four meters longer than the previous data point. The filtered data can be
seen below in Fig. 40.
Figure 40: Filtered distance data including zero target data points.

ENGR459/460/461 Senior Design Project 2014-2015
68
In the above plot it is easier to see the trend of the target walking away from the
sensor and then back towards the sensor. It is interesting to note that the sensor can
detect targets at farther distances, but often detects the target less often. This
means that a UAS using this sensor may not have a lot of time to perform an
avoidance maneuver because the sensor may not confidently pick up a target until it
is near the UAS. The team was also intrigued to see that targets must be closer to
the sensor to be confidently detected when the target is travelling towards the
sensor. This is potentially a serious problem for the system. Oncoming targets pose
the biggest threat to UAS. Therefore, the vehicle is put at larger risk if the sense and
avoid system cannot reliably pick up the target until it is close to the vehicle. To investigate this problem further, the team would want to repeat this test several
times and compare the data output. It would also be useful to complete the test with
different sized targets. Knowing the speed of the target could also give the team
valuable insight into the ability of the sensor to detect receding targets versus
oncoming targets. Finally, the team would like to repeat the test, but time the target
as it travels and record by hand the distance the target is from the sensor. Then the
hand recorded data could be compared to the sensor data to determine the accuracy
of the sensor’s measurements. Testing Conclusion Though the team was only able to accomplish a minimal amount of testing, there
were already potential problems discovered. The team hopes that another team will
be able to further investigate these issues in the future. Also, the team hopes that
another team will be able to complete the rest of the testing plan. These tests will
likely need to be adjusted as more information about the sensor is discovered, but
hopefully the test plan provides a good place to begin investigating the sensor’s
capabilities.
C. Specification Verification Checklist
Power System - Voltages going to each component
- Battery life
Ground Interference - Will the sensor detect the ground as a target or be affected by the lack of
ground
Ideal Target Material - Best detected material to be used in further testing
Determining Actual Field of View - Long range
- Short range
- Field of view in the x-plane
- Field of view in the y-plane
- Field of view in the z-plane
- Position of target(s)
Target Elevation Changes - Changes in x and y position (that did not actually occur) caused by changes in
z position
Detection of Different Sized Targets

ENGR459/460/461 Senior Design Project 2014-2015
69
- Ability to detect targets of different sizes
Multiple Target Detection - Ability to discriminate between different targets
- Number of targets
Velocity Detection - x direction velocity
- y direction velocity
- z direction velocity
- Velocity of multiple targets
Chapter 7. Conclusions and Recommendations
Eventually the goal of this project was to use the data gathered during testing to
evaluate if similar systems could be used in UAS for a sense and avoid system. Over
the course of the past few months the team has encountered some specifications of
the sensor which have caused concern about the potential usefulness of the system.
The results of the testing that the team was able to complete caused even more
concerns about a radar system’s ability to serve in sense and avoid applications.
However, not enough information has been obtained to make any final decisions.
Therefore, the team will refrain from stating any specific conclusions or making any
recommendation until enough supporting data is obtained from testing and then
analyzed. Until such a time as this information is available, the team would like to
conclude the paper by reviewing the methods that will potentially be used to make
conclusions and recommendations. The team hopes that a future group of engineers
will be able to execute these methods and come to a reasonable conclusion for the
sponsor. Currently the team was planning to appraise the system largely through evaluation
of the sensor capabilities. This evaluation was going to be based on two contributing
factors: the accuracy of the sensor’s measurements and the changes in performance
of the sensor due to changes in direction of motion. Both of these should be
evaluated based on data obtained through testing. Ultimately this information alone
will not allow anyone to make an informed decision on the potential of this system in
sense and avoid applications. This criteria is solely applicable to the “sense” side of
the problem. The avoidance issue will need different evaluation criteria. The adjustment of the scope of this project guided the team to be mostly focused on
the sensing side of the problem. The team was not expected to come up with a
justified, comprehensive solution for the avoidance problem. However, this problem
will need to be addressed before a recommendation on the usefulness of this system
can be made. An avoidance model is an excellent first step in addressing this
problem. The purpose of the avoidance model would be to show that it is possible for a UAS to
avoid a detected target solely using the information the sensor gives to the control
system. This proof of concept could be shown in any condition. The team should
show a variety of conditions the system would work properly in and define the
limitations put on the system by the restrictions from the sensor data output. Finally, the team should complete a brief overview of various solutions which could
make this system work better or in more conditions. Hopefully all of this information
helps the team make a recommendation regarding the system. The other important

ENGR459/460/461 Senior Design Project 2014-2015
70
goal for the team is to effectively record and convey all the data obtained through
testing and research so that the sponsor is able to come to their own conclusions
about the feasibility of this system.
Acknowledgements
This team has put a large amount of work into this project, but it would not have
been possible without the help of several other people. The team would like to thank Professor McFarland, the team’s project advisor, who
gave the team extensive advice and direction on how to proceed with the project.
The team would also like to thank Dr. Laiho for helping with any administrative
concerns, but especially for tracking down the sensor when it got lost in a the
bureaucratic mess. The team would also like to thank the sponsor for always being
available to answer questions, for being prompt in email responses, and for providing
excellent feedback on the progress being made. Finally, the team would like to thank Cal Poly for creating an environment where
hands on work is encouraged and there is always an opportunity to gain more
knowledge.
References
Radar Resources www.pilotfriend.com/training/flight_training/communication/radar.htm www.ll.mit.edu/publications/journal/pdf/vol16_no2/16_2_04Kuchar.pdf www.ll.mit.edu/publications/journal/pdf/vol03_no1/3.1.6.radaraUAV.pdf www.avweb.com/news/avionics/183231-1.html?redirected=1 gcn.com/blogs/emerging-tech/2014/06/uav-radar-sense-and-avoid.aspx www.janes.com/article/32294/us-army-to-install-ground-based-uav-radar-at-five-
sites-by-2016 www.quora.com/Why-dont-commercial-aircraft-have-their-own-radar www.radartutorial.eu/index.en.html www.who.int/peh-emf/publications/facts/fs226/en/ www.fcc.gov/ www.barnardmicrosystems.com/UAV/features/synthetic_aperture_radar.html www.sandia.gov/RADAR/images/SAND2005-3445PMiniSAR-fact-sheetp2-v4-redo.pdf

ENGR459/460/461 Senior Design Project 2014-2015
71
www.rcubedengineering.com www.uav-alaska.com/
Sense and Avoid Resources www.lockheedmartin.com/us/100years/stories/sar.html www.janes.com/article/45431/us-navy-seeks-new-sense-and-avoid-solution-for-
triton-uav www.janes.com/article/42846/dod-reports-advances-in-unmanned-aircraft-sense-
and-avoid-capabilities theuavdigest.com/tag/sense-and-avoid/
Regulation Resources www.faa.gov/uas/legislative_programs/section_333/ rgl.faa.gov/Regulatory_and_Guidance_Library/rgFAR.nsf/0/934f0a02e17e7de086256
eeb005192fc!OpenDocument
Component Resources www.sparkfun.com/products/11235 www.barnardmicrosystems.com www.fairchildsemi.com/datasheets/LM/LM317.pdf
Picture Resources polyland.calpoly.edu
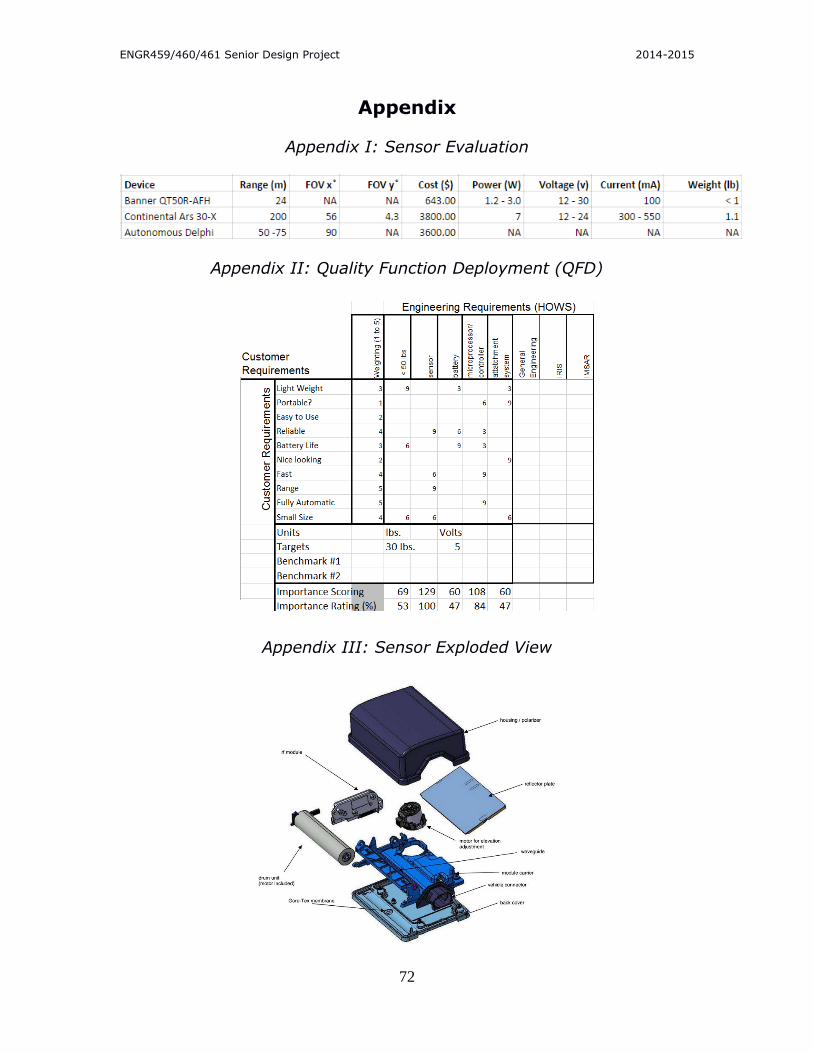
ENGR459/460/461 Senior Design Project 2014-2015
72
Appendix
Appendix I: Sensor Evaluation
Appendix II: Quality Function Deployment (QFD)
Appendix III: Sensor Exploded View

ENGR459/460/461 Senior Design Project 2014-2015
73
Appendix IV: Sensor Dimensioned Drawing
Appendix V: Sensor Beam Sign Convention

ENGR459/460/461 Senior Design Project 2014-2015
74
Appendix VI: Sensor Vehicle Connector Dimensioned Drawing

ENGR459/460/461 Senior Design Project 2014-2015
75
Appendix VII: Sensor Cable Schematics

ENGR459/460/461 Senior Design Project 2014-2015
76
Appendix VIII: Plastic Plate Solid Model
Appendix IX: Mounting Bracket Dimensioned Drawing

ENGR459/460/461 Senior Design Project 2014-2015
77
Appendix X: Purchase Order for Continental

ENGR459/460/461 Senior Design Project 2014-2015
78
Appendix XI: Sensor Costs for Mass Production
Appendix XII: Continental Sensor Information (Email Correspondence)
Dear Courtney, Thank you for your inquiry on long range radar sensors type ARS 30X 77 GHz. There are no proprietary rights on our CAN protocol - see hereinafter information
about our business. We designed the standard automotive CAN protocol for using in
other applications as well as small automotive resp . vehicle series. You do not need
the usually necessary inputs from the car as gear rate or speed etc. to work without
disturbances, but you can use this inputs. It is a protocol for free communication and
you can switch between target mode and object mode or close range 50 m and far
range 200 m - all via CAN commands as described in the attached documentation.
The radar sensors ARS can be used for many applications - mostly our customers will
use it for automated guided vehicles resp. autonomous vehicles. You can buy our radar sensors, which has been developed and manufactured for
automobile industry (ARS for adaptive cruise control, breaking assist, forward
collision warning etc. and SRR for blind spot detection, surround view etc.). We alone
are allowed to transfer this sensors from our devision ADAS Advanced Driver
Assistance Systems to the industry and other markets. It is the same hardware as
used in automobile applications, but with a special open CAN protocol, so that other
user can communicate and work with this sensors.

ENGR459/460/461 Senior Design Project 2014-2015
79
We only can sell the hardware (radar sensor) and accessories like cable and
connector and mounting bolts from 1 unit up to 10.000 units. Further devices as an
evaluation unit or similar each customer has to generate or buy by himself from
another supplier. Currently we are able to deliver different radar sensor software, which are described
in the attached price scale. World wide all our customers, also internally in the Continental concern, will have to
pay the same prices. We are not allowed to give additional discount or samples or
development kits free of charge for universities, high schools, institutes or similar. Hereinafter and in our price scale we will explain the different versions of ARS radar
sensors. You have to choose the best version for your application resp. you can also choose
two or three different versions for first tests - to find the best performance for you.
For the same application as the sensors has been developed for, the version ARS
308-2 or ARS 308-2T standard types would be the best. 1. ARS 30X 77 GHz Long Range Radar Sensor The standard automotive version is ARS 300, but it has a confidential CAN protocol
and you need several inputs from the car, which you cannot generate in other
applications - so we cannot use it for our business. Here you can find an example for the order of 2 units ARS 308-2 with accessories: Taking possession of 2 x A.D.C. Multimode-RADAR-Sensor type ARS 308-2 Long
Range Radar Sensor 77 GHz flashed with special software named ARS 308-2, incl.
accessories. 1. 2 pcs. ARS 308-2 Long Range Radar Sensor 77 GHz with ARS 308-2 CAN protocol, with type shield, without cable Article no. 10.005.152-01 AL : N - ECCN : EAR99 – Country of Origin Germany Commodity Code 85261000 Price: 2080.00 €/unit (in case of an order of a single unit, the price is 3100 Euro) 2. 2 pcs. Cable ARS 3XX, 5 m, Power Supply and CAN bus, with ARS 3XX connector
(without termination) Article no. 10.005.170-00 AL : N - ECCN : EAR99 – Country of Origin Germany Commodity Code 85444290 Price: 170.00 €/set 3. 1 X Flat for 1 one-way transport case, cover box, shipment free Uni San Luis,
U.S.A.

ENGR459/460/461 Senior Design Project 2014-2015
80
- CPT San Luis, U.S.A. acc.Incoterms 2010 (duty unpaid - without import taxes and
fees - have to be paid by the customer) Price: 170.00 € Total sum: 4670.00 € (in case of an order of a single unit, the price is 3440
Euro) Additionally cable and transport case prices each sensor, accord. item 2 and 3 of this
quotation will have no price scale. Option: Instead of the 5 m cable with connector (see item 2) you also can order only the
connector. 2 pcs connector ARS 3XX, 8 pole connector with pins and sealing type MQS BU-GEH DICHT 8P Article no. 10.005.163-00, Price per unit 6.50 Euro (See attached file: ARS30X_-2_-2C_-2T_-21_datasheet_en_120531_V09.pdf)(See attached file: ADC_Price scale_ARS30X_-2_-2T_-2C_-21_140906.pdf)(See attached file: 1CAN_ARS308_Technical_Documentation_ v1.15_2012-12-11.pdf) (See attached file: 1CAN_ARS308-2C +21_Technical_Documentation_v1.27_2012-12-10.pdf)(See attached file: TKU ARS300-Technical Description_2_4_100713.pdf)(See attached file: CT-DAS_ARS200_SecondarySurfaceTestSpecV2.00.pdf)(See attached file: Power-Supply-Datacable_ ARS308-2+ARS308-2T_with CAN 1_V01.pdf)(See attached file: Sensorcable terminated ARS 308-2X en final.pdf) Further remarks: The radar sensors of series ARS 3XX as well as the type ARS 308-2T or ARS 308-2
are allowed for the usage in research & testing purposes. A preliminary radio license for the bandwidth of 76 - 77 GHz for industrial
applications, that means outside of vehicles in public road traffic, has to be
submitted from the customer for 2014 in each country by himself. A generally license for ground based vehicles in Europe and U.S.A. is available since
begin of 2012. It is not allowed to measure or work with these sensors with the range of 77 GHz
stationary in the public road traffic e.g. for traffic measurement or traffic supervision
from the roadside or from sign bridge or from pylons or in flying objects. The usage of this radar sensors in vehicles in Europe and most countries in the world
is permitted - see automobiles and trucks. Here also rail mounted cranes, trains and so
on will be a vehicle. Payment: 100% pre-payment before delivery

ENGR459/460/461 Senior Design Project 2014-2015
81
Delivery time: app. 1 - 2 weeks after reception of purchase order and pre-
payment Warranty: 12 months beginning from delivery date Delivery terms: acc. item 3 of these quote example ADC VAT no.: DE812185464 Procurement procedure: In case of an order we can quote official - you will send a purchase order - we will
confirm and send a proforma invoice during the next 1 - 2 weeks (installation of your
customer data in SAP needs time for the first business) - with the proforma invoice
you can make a bank transfer of 100% payment - after reception of the pre-payment
we could deliver the goods during a few days - max. 1 week. The original invoice will
be sent by postal service direct after the shipment. Validity of Quotation: The price and delivery condition as mentioned above only have availability in
combination with the complete blanket order. Reservation of proprietary rights: The delivered goods remains property of the A.D.C. GmbH up to the complete
payment. The extended and enlarged reservation of proprietary rights shall be
deemed to be agreed. Salvo: The fulfilment of a contract has to be under reserve, that no barriers because of
national and international laws, in particular export inspection terms, to be opposed. Liability: A.D.C. takes no responsibility for disadvantages, which are based on defects in
A.D.C. sensors or on customer applications. The exclusion of liability relates not to
cases of prohibited exclusion of liability due to mandatory lawfully regulations,
particularly at deliberately behaviour or grossly negligent behaviour, in case of
malicious concealment of a deficit, at product liability claims as well as in case of
injury of life, body or health. Further Remarks: We should like to point explicit out that in dependence on the Continental / A.D.C.
company policy, the A.D.C. GmbH will not assist or support the use of the offered
products in and with weapons system and for such applications will make no
deliveries. Here you will find the complete bank account information for the pre-payment: Deutsche Bank AG Friedrichshafen Karlstraße 13 D-88045 Friedrichshafen Phone: 0049-7541-702-0 Facsimile: 0049-7541-702-54 Account name: A.D.C. GmbH Automotive Distance Control Systems GmbH Account no.: 3 400 082 00

ENGR459/460/461 Senior Design Project 2014-2015
82
Sort Code: 650 700 84 SWIFT: DEUTDESS650 IBAN: DE90 6507 0084 0340 0082 00 Account holder: A.D.C. GmbH Automotive Distance Control Systems GmbH Peter-Dornier-Straße 10 D-88131 Lindau Phone: 0049-8382-9699-418 Please make an indication of the number of the proforma invoice (top -right side) in
the wire transfer. After reception of the payment we will inform you by email and
start the shipment procedure. If you have further questions or if you need an official
quotation for choosed types and quantities, so do not hesitate to contact us. Kind regards, Roland Mit freundlichen Gruessen/Best regards, Roland Liebske Manager Marketing & Sales Industrial Sensors Segment Surround View A.D.C. Automotive Distance Control Systems GmbH C PSAD AI Advanced Driver Assistance Systems Continental, Peter-Dornier-Str. 10, 88131 Lindau, Germany Tel: +49 8382 9699-114 Fax: +49 8382 969922-114 Mob.: +49 170 3211881 E-Mail: [email protected] www.continental-automotive.com/industrial-sensors www.continental-corporation.com __________________________________________ A.D.C. Automotive Distance Control Systems GmbH, Peter-Dornier-Straße 10, D-88131 Lindau/Bodensee Vorsitzender des Aufsichtsrats / Chairman of the Supervisory Board: Werner Volz Geschäftsführer/Managing Director: Karlheinz Haupt, Uwe Grau Sitz der Gesellschaft/Registered office: Lindau Registergericht/Registered Court: Amtsgericht Kempten HR B 6408 USt.-ID-Nr./VAT-ID-No.: DE 812185464 __________________________________________ Proprietary and confidential. Distribution only by express authority of Continental AG or its subsidiaries. Additional specifications are attached.

ENGR459/460/461 Senior Design Project 2014-2015
83
Appendix XIII: Sensor Specifications

ENGR459/460/461 Senior Design Project 2014-2015
84
Appendix XIV: Sensor Field of View Specifications
Appendix XV: Sensor CAN Network
Appendix XVI: Sensor Protective Circuit for Power Supply Input and
Wakeup

ENGR459/460/461 Senior Design Project 2014-2015
85
Appendix XVII: Sensor Key Electrical Data
Appendix XVIII: Circuit Calculations
The LM317 datasheet connections are below
The output voltage equation as stated in the data sheet is:
assuming , it is neglected
For the Sensor:
= 9.6

ENGR459/460/461 Senior Design Project 2014-2015
86
9.6-1 = , choose and
For the Microprocessor:
= 5.6
5.6-1 = , choose and
VIII. Battery Life Calculations ● The battery is rated at 14.8, 5000 mAh
● The sensor draws 300 mA
● The microprocessor draws 80 mA
● The system draws approximately 380 mA
Appendix XIX: Safe Work Procedure This procedure should be used for all tests and all handling of the sensor and
system. Additional safety measures required for each test will be added to the
specific test plans as necessary.
SAFE WORK PROCEDURE - Radar Sensor and System
Environment ● Electronic components
● Radar sensor
Preparation ● Travel to appropriate setting
● Handle system carefully at all times
Step by Step Instructions 1. Be gentle when transferring the system
2. Be aware of the direction the radar is pointed; if a
team member is uncomfortable, ensure that they
are minimally exposed to the radar waves
3. HAZARD! Be careful of touching exposed wiring
when system is powered on
4. FINISH! Power down system
Clean up ● Leave the area the way you found it
Key Hazards Risks from Hazard Control Measure
● Battery
● Power circuit
● Radar sensor
● Electrical shock
● Negative health
effects caused by
radar waves
● Guarding
● Careful handling of
wires
● Avoiding being in
directly in front of
radar sensor

ENGR459/460/461 Senior Design Project 2014-2015
87
Appendix XX: Detailed Testing Procedure
Sensor Setup Procedure
1. Read the attached Safe Work Procedure (SWP) for this test and have a copy on
hand to ensure that all testing is completed safely. 2. Set up the table to rest the system on. 3. Check all wiring of the system to ensure that all components are correctly
connected. 4. Check voltages going into the sensor and the microprocessor to ensure that all
components are being correctly powered. 5. Connect system to the data recording device. Power on the system to ensure that
the data recording device is receiving data from the sensor. 6. Record the environmental conditions: temperature, cloud cover, precipitation,
winds, location. 7. Take a picture of the test setup.
Ground Interference Objective: Determine whether or not the sensor detects the ground as a target. Determine if
the sensor falsely detects a target when the sensor is pointed at open sky (there
should be no actual targets). Determine if type of ground has an effect on whether or
not the sensor detects the ground to be an object. The following types of “ground” covering will be utilized for this test: concrete, soft
dirt, hard dirt, asphalt, sand, water, grass, Morro rock , and astro-turf. Important Parameters to Record: Each set of parameters shall be recorded for each ground condition. Data from Sensor - Target detection rating and object distance when sensor is pointed directly at
ground - Target detection rating and object distance when sensor FOV is approximately
50% open air and 50% ground - Target detection rating and object distance when sensor is pointed directly into
open air Data Taken by Hand - Distance between sensor and the ground when sensor is being pointed directly at
ground - Distance between sensor and the ground when sensor FOV is approximately 50%
open air and 50% ground - Environmental conditions (e.g. cloud cover, temperature, wind, precipitation) - Picture of the test setup to show conditions and environments the test is being
done in Analyses to be Completed:

ENGR459/460/461 Senior Design Project 2014-2015
88
- Bar graph comparing detection rating in each terrain when sensor is pointing at
ground - Bar graph comparing detection rating in each terrain when sensor FOV is
approximately 50% open air and 50% ground - Bar graph comparing detection rating in each terrain when sensor is pointing into
open air - Bar graphs comparing detection rating in each sensor orientation for each ground
condition Test Procedure: 1. Travel to an area where there is concrete on the ground, an open sky (no objects
above the area), and a horizon that’s clear for the full range of the sensor (200m). 2. Complete sensor setup procedure. 3. Secure the sensor to the rotating test fixture, shown in the figure below.
4. Position the fixture so the sensor is pointing directly up into the air where no
targets should be detected. Start data collection. 5. Collect data for five minutes. The most important parameter to be recorded is
whether or not the sensor is detecting a target. If it is detecting a target, it is
important to record the rating the sensor outputs that shows how confident the
sensor is about the fact that it is detecting a target. 6. End data collection. 7. Then position the system so it is facing the direction with the open horizon. In
this position, the sensor’s field of view will be approximately 50% open air and
approximately 50% ground. 8. Start data collection. 9. Collect data for five minutes, then end data collection. 10. Next, position the system so that it is pointing directly at the ground. Record the
distance between the sensor and the ground. 11. Start data collection. 12. Collect data for five minutes. Then end data collection.

ENGR459/460/461 Senior Design Project 2014-2015
89
13. Make sure this set of data output has been saved and descriptively labeled, then
power down the system. Disconnect the system from the data recording device. Pack
up the system, leaving the area as it was found. 14. Repeat steps 2-17 in different locations. These locations should be places where
there is soft dirt, hard dirt, grass, asphalt, water, and sand covering the ground. 15. Complete data analyses to determine if different types of ground will interfere
with the sensor output.
Ideal Target Material Objective: Determine what type of material the sensor detects best so that targets of this
material can be used for the remainder of testing. Important Parameters to Record: Each set of parameters should be collected for each target. Data from Sensor - Target detection rating, object distance, and object size Data Taken by Hand - Locations of targets that are not the target in sensor’s FOV - Dimensions of target - Parallel distance from sensor to target - Direct distance from sensor to target Analyses to be Completed: - Graph comparing detection rating of all the different target materials - Comparison of sensor data and hand data for target distance; use this to determine whether sensor measures direct distance or parallel distance Test Procedure: 1. Travel to a 75 ft by 75 ft area where the horizons are clear and the area is free of
targets. 2. Complete sensor setup procedure. 3. Secure the system in the testing apparatus and point the sensor beam in a
direction where there are no targets within 75 ft. 4. Measure and record the locations of any targets within the sensor’s FOV that are
more than 75 ft away. 5. For the first round, obtain an aluminum box; measure it and record the
dimensions of the box. 6. Place the target more than 70 ft away from the sensor, directly in front of the
sensor on the ground. Make sure a flat surface is facing the sensor. Measure and
record the distance between the sensor and the target. Measure both the direct
distance, and the distance parallel to the sensor beam. See figure below for
clarification on these two different distances.

ENGR459/460/461 Senior Design Project 2014-2015
90
7. Start data collection 8. Collect data for five minutes. The most important parameter to be recorded is
whether or not the sensor is detecting a target. If it is detecting a target, it is
important to record the rating the sensor outputs that shows how confident the
sensor is about the fact that it is detecting a target. Additionally, it is important to
record the size of the target and distance to the target so that the actual data can be
compared to the data collected by the sensor. 9. End data collection 10. Ensure data output has been saved and descriptively labeled. 11. Repeat steps 8-13 for targets of different materials. Some materials that must be
tested are plastic, foam (the type typically used in RC planes), steel, copper,
humans, ice, plants, and glass. Additional materials may be added. All targets should
be approximately the same size and be the same distance from the sensor. 12. Power down the system. Disconnect the system from the data recording device.
Pack up the system, leaving the area as it was found. 13. Complete data analyses to determine which type of material is best detected by
the sensor. Additionally, determine whether the sensor measures the direct distance
to the target or the parallel distance. Finally, compare the sensor data output to the
actual data.
Determining the Tolerance and Accuracy of the Field of View Objective: To determine the actual field of view of the sensor and analyze
tolerances or errors in the specifications. Also to visualize the capability limits. Important Parameters to Record: Each set of parameters should be recorded for each distance from the sensor, and for
each sensor setting. Data from Sensor - Confidence level on presence of actual target - x and y location of target Data Taken by Hand - x, y, and z location of target Analyses to be Completed: - Comparison between hand recorded data and sensor data Test Procedure:

ENGR459/460/461 Senior Design Project 2014-2015
91
1. Travel to an area where there is a horizon that is clear for the full range of the
sensor (200m). 2. Complete sensor setup procedure. 3. Measure 200 m from the sensor with a tape measure and mark that point. 4. Place target at that point. 5. Secure the sensor in the testing apparatus and point the sensor’s beam in the
direction of an target made of the ideal material target as determined from Test IV)
and parallel to the floor. Start data collection. 6. Once the sensor detects the target, move the target further away from the sensor
until it is not detected anymore. 7. Mark the point at which the target was the farthest and still detected. 8. Measure and mark two points 29.89 m from the first point in the -x and + x
directions, this is where the targets should be detected. 9. Place the target at either of those two points without moving the sensor, if the
target is detected, move the target further away from the y axis until it can no
longer be detected. 10. Mark the point at which the target was the farthest and still detected. 11. Repeat steps 14 and 15 for the opposite point. 12. Place the long stick straight up from the ground at the 200m mark. Measure and
mark a point at 15.038 m on the stick at the z axis, above the 200 m theoretical
point. 13. If the target is detected, move the target further away from the y axis until it
can no longer be detected. 14. Mark the point at which the target was the farthest and still detected. Stop data
collection. 15. Repeat steps 8-19 for the midpoint at 100 m, and for the 10 ft. arbitrary point. 16. Repeat the entire test for short range setting and short range measurements in
the table below. 17. Make sure each set of data output has been saved, then power down the system.
Disconnect the system from the data recording device. Pack up the system, leaving
the area as it was found.
Critical Point Measurement -x (m) +x (m) +y (m) +z (m)
Long
Range
Theoretical Max 29.89 29.89 200 15.038
Actual
%Error
Mid-Point 15.945 15.945 100 7.519
Actual
%Error
Theor. @10 ft .455 .455 3.048 .229
Actual
%Error
Theoretical max 31.9025 31.9025 60 ?

ENGR459/460/461 Senior Design Project 2014-2015
92
Short Range
Actual
%Error
Mid-Point 15.951 15.951 30 ?
Actual
%Error
Theoretical @10 ft .486194 .48619 3.048
Actual
%Error
Target Elevation Changes Objective: Determine if changing the elevation of the target will affect the x and y position data
recorded by the sensor. Important Parameters to Record: Each set of parameters should be recorded for each change in elevation of the target
object. Data from Sensor - Target x and y location Data Taken by Hand - Locations of objects that are not the target in sensor’s FOV - Target’s distance from sensor - Target x and y location - Target elevation (z position) Analyses to be Completed: - Comparison of sensor data and hand data for x location of target at each z position - Comparison of sensor data and hand data for y location of target at each z position Test Procedure: 1. Travel to a 75 ft by 75 ft area where the horizons are clear and the area is free of
objects. Bring the target that was best detected by the sensor based on the Ideal
Target Material test. 2. Complete sensor setup procedure. 3. Secure the sensor in the test apparatus and point the sensor beam in a direction
where there are no targets within 75 ft. 4. Measure and record the locations of any objects within the sensor’s FOV that are
more than 75 ft away. 5. Place the target of the ideal material (as determined from Test IV) more than 70
ft away from the sensor, directly in front of the sensor, on the ground. Make sure a

ENGR459/460/461 Senior Design Project 2014-2015
93
flat surface is facing the sensor. Measure and record the distance from the sensor to
the target. 6. Start data collection. 7. Collect data for five minutes. The most important parameter to be recorded is the
x and y position of the target. 8. End data collection. 9. Ensure data output has been saved and descriptively labeled. 10. Repeat steps 8-12, placing the targets at the same x and y location, but varying
the elevation. Raise the target in 6 inch increments from the ground until it is out of
the FOV of the sensor. Raising the target will be done with a pulley and string
system, ensuring that any test apparatus the sensor could potentially detect stays
out of the FOV of the sensor. 11. Power down the system. Disconnect the system from the data recording device.
Pack up the system, leaving the area as it was found. 12. Complete data analyses to determine if changing the elevation of the target will
change the x and y location recorded by the sensor.
Detection of Different Sized Targets Objective: Evaluate the limits of the sensor’s size detection ability at different distances.
Determine exactly what dimension the “size” measurement is (height, width, length,
some combination). Evaluate how the data output changes as targets are rotated or
are oriented differently with respect to the sensor. Important Parameters to Record: Each set of parameters should be collected for each target. Data from Sensor - Distance between the sensor and target - Size of the target - Velocity of the target Data Taken by Hand - Locations of objects that are not the target in sensor’s FOV - Dimensions of all targets, including surface areas and cross-sectional areas - Distances between the sensor and the target - Height of the target above the ground - Angular speed of the target when being rotated Analyses to be Completed: - Evaluate data to determine the smallest target that can be detected at various
distances - Comparison between size of each target according to the sensor and dimensions
recorded by hand in order to determine which dimension is being detected by the
sensor - Graph of how size of each target varies with distance from sensor - Graph of how size of each target varies with orientation of the object when the
target is being rotated; plot of degrees (angle that target has been rotated) vs.
size of target - Graph of how velocity of the target varies with time when the target is being
rotated

ENGR459/460/461 Senior Design Project 2014-2015
94
- Comparison of sensor data and hand taken data for the distance between the
sensor and the target Test Procedure: 1. Travel to a 75 ft by 75 ft area where the horizons are clear and the area is free of
targets. 2. Complete sensor setup procedure. 3. Secure the sensor in the testing apparatus with the sensor’s beam pointed in a
direction where there are no objects within 75 ft. 4. Measure and record the locations of any objects within the sensor’s FOV that are
more than 75 ft away. 5. Obtain a square box of the best material (as determined by the Ideal Target
Material test). One of the surface areas of the box must be at least 1 m2. Measure
and record all the dimensions of the box, including the surface areas. 6. Place the target more than 70 ft away from the sensor, directly in front of the
sensor on the ground. Make sure a flat surface with a surface area of at least 1 m2 is
facing the sensor. Measure and record the distance between the sensor and the
object. 7. Start data collection and collect data for five minutes. The most important
parameter to be collected here is the “size” of the target. Additionally it is important
to record the distance between the sensor and the target so the sensor output can
be compared to hand taken data. 8. End data collection. 9. Ensure data output has been saved. 10. Repeat steps 8-13 with smaller boxes until the box becomes so small that the
sensor does not detect the object. Decrease the size by approximately 10% each
time. 11. Repeat steps 8-14 with the boxes placed 490 ft from the sensor. Start with a box
that has a surface area of 2 m2 and decrease the size by 50% from there. Then
repeat steps 8-14 again with the boxes placed 650 ft from the sensor. Start with a
box that has a surface area of 4 m2 and decrease the size by 10% from there. 12. For the next segment, use objects of the size that the sensor could detect at
about 70 ft away from the sensor. 13. Place the target more than 70 ft away from the sensor, directly in front of the
sensor on the ground. Make sure a flat surface is facing the sensor. Measure and
record the distance between the sensor and the target. 14. Start data collection 15. Collect data for five minutes. The most important parameter to be collected here
is the “size” of the target. Additionally it is important to record the distance between
the sensor and the target so the sensor output can be compared to hand taken data. 16. End data collection 17. Ensure data output has been saved. 18. Repeat steps 15-20 for different object shapes. Some important shapes to be
tested are a rectangular box, a triangular prism, and a cylinder. Additional shapes
can be added as needed, but all shapes should have some sort of flat surface that is
perpendicular to the ground so that it is easy for the radar waves to reflect off of the
target and return to the sensor. 19. Next suspend the square box with a thin string of a material that will not be
detected by the radar sensor. The object should be more than 70 feet away from and
directly in front of the sensor. Measure and record the distance between the sensor
and the target, as well as the height of the object above the ground. Determine the
cross-sectional areas in each orientation for 360o of rotation. 20. Start data collection.
ENGR459/460/461 Senior Design Project 2014-2015
95
21. Use the string to rotate the object slowly at a constant angular speed, after
ensuring that the target starts out with a flat surface facing towards the sensor.
Measure and record the angular speed. 22. Continue to collect data until the target has been rotated a full 360o. The most
important parameter to collect here is the “size” of the target. Additionally it is
important to record the distance between the sensor and the target and the velocity
of the target so the sensor output can be compared to data taken by hand. 23. End data collection. 24. Ensure data output has been saved and descriptively labeled. 25. Repeat steps 22-27 for all of the different object shapes previously tested.
Suspend all targets at approximately the same height above ground to get consistent
data output. 26. Power down the system. Disconnect the system from the data recording device.
Pack up the system, leaving the area as it was found. 27. Complete data analyses to evaluate the size limits of the sensor at different
distances. Determine what the “size” sensor data output refers to. Additionally,
evaluate how the size data output is affected by targets with varying width. Examine
how size of the target changes as the object is rotated. For all analyses, consider
how changing the shape of the target affects the data output. Finally, compare the
sensor data output to the actual data.
Multiple Target Detection Objective: To observe the data output with respect to multiple targets. Detect any ways in
which the sensor may be “confused” and therefore output incorrect data. Testing will
include overlapping targets in the view of the sensor, which may cause the sensor to
confuse multiple objects for one. Additionally, the team needs to determine how the
sensor prioritizes the targets it sees. Important Parameters to Record: Each parameter should be recorded for each testing condition. Data from Sensor - Target detection rating - Target distance - Target size - Number of targets - x and y location of targets Data Taken by Hand - Locations of objects that are not the target in sensor’s FOV - Dimensions of target - Distance between target and sensor - Number of targets - Path that any moving targets travel throughout the FOV Analyses to be Completed:
- Comparison between how many targets are actually present and how many the
sensor detects when targets are overlapping - Determination of how far apart targets must be before the sensor detects them
as individual targets

ENGR459/460/461 Senior Design Project 2014-2015
96
- Comparison of detection confidence level for each of the 5 targets when they are
in a straight line in front of the sensor - Determination of how the sensor tracks different moving objects
Test Procedure: 1. Travel to an area where there is concrete on the ground, an open sky (no targets
above the area), and a horizon that’s clear for the full range of the sensor (200m). 2. Complete sensor setup procedure. 3. Place 5 targets (material decided in previous tests) 10 feet in front of the sensor
in a straight line. 4. Start data collection. 5. Collect data for five minutes. If it is detecting the objects, it is important to
record the rating the sensor outputs that shows how confident the sensor is about
the fact that it is detecting the targets. 6. Move one of the targets back and leave it stationary. 7. Analyze the sensor’s ability to detect it. 8. Stop data collection 9. Now place that same object on the “fish pole” mechanism and restart data
collection. 10. Move the target around anywhere in the sensor’s field of view. 11. Now move the target in between the stationary objects. 12. Stop data recording. 13. Now, suspend another one of the stationary targets on the second “string pole
mechanism”. Start data collection again. 14. Move both targets around and in between the stationary objects. 15. Stop data recording. 16. Repeat steps 7-18 after switching out two of the targets with targets of a
different size. 17. Make sure this set of data output has been saved, then power down the system.
Disconnect the system from the data recording device. Pack up the system, leaving
the area as it was found.
Velocity Detection Objective: Determine if and how changing the velocity of the target will change the data output
or cause the sensor to output inaccurate data. Important Parameters to Record: Each set of parameters should be recorded for the various conditions of each test. Data from Sensor - x Velocity - y Velocity - Distance of target Data Taken by Hand - Locations of objects that are not the target in sensor’s FOV - Target’s distance from sensor - Angles of the hanging wire system respective to relevant axes - Time it takes the target to cross the field of view of the sensor - Distance across the field of view of the sensor

ENGR459/460/461 Senior Design Project 2014-2015
97
Analyses to be Completed: - Hand calculation of the velocities of the target in each test run - Comparison of hand calculations of velocities to sensor recorded velocities at each
angle in x-y plane - Comparison of hand calculations of velocities to sensor recorded velocities at each
angle in x-y-z plane Tests: 1. Travel to a 75 ft by 75 ft area where the horizons are clear and the area is free of
objects. 2. Complete sensor setup procedure. 3. Secure the sensor in the testing apparatus with the sensor’s beam pointed in a
direction where there are no objects within 75 ft. 4. Measure and record the locations of any targets within the sensor’s FOV that are
more than 75 ft away. 5. Set up the hanging wire system (currently being developed) so that the wire
stretches across the sensor’s field of view about 70 ft in front of the sensor,
perpendicular to the radar’s beams, but the support system is outside of the field of
view. Measure and record the exact distance that the wire is from the sensor. 6. Attach the object with a string to the motorized mechanism (currently being
developed) that will carry the target on the string across the field of view. Ensure
that the string is of a length that will allow the target to be on the same plane as the
sensor. 7. Start data collection. 8. Send the target across the field of view. Measure and record the time it takes for
the target to cross the entire field of view, so that the velocity of the object can be
calculated later. 9. End data collection. 10. Repeat steps 8-12, varying the direction of the target’s velocity by 5o until the
target is travelling parallel to the radar’s beam. A diagram of how to change the
direction of the velocity of the target is shown below.

ENGR459/460/461 Senior Design Project 2014-2015
98
11. Set up two hanging wire systems. For one the wire should stretch across the
sensor’s field of view about 70 ft in front of the sensor, at some angle. The same
should be done for the second, at a different distance from the sensor and angle. The
systems should be oriented so that the wires never cross. The support system should
be outside of the field of view. Measure and record the distance that the wires are
from the sensor. 12. Attach the targets with string to the motorized mechanisms that will carry the
targets across the field of view. Ensure that the strings are of lengths that will allow
the targets to be on the same plane as the sensor. 13. Start data collection. 14. Send the target across the field of view. Measure and record the time it takes for
the target to cross the entire field of view, so that the velocity of the target can be
calculated later. 15. End data collection. 16. Repeat steps 14-18, varying the angle of the targets to include several different
situations listed below: a. Both targets travelling in the positive x direction away from the sensor. b. Both targets travelling in the positive x direction towards the sensor. c. One target travelling in the positive x direction away from the sensor, the other
target travelling in the negative x direction away from the sensor. d. One target travelling in the positive x direction towards the sensor, the other
target travelling in the negative x direction away from the sensor. e. One target travelling in the positive x direction away from the sensor, the other
target travelling in the positive x direction away from the sensor. f. One target travelling in the positive x direction towards the sensor, the other
target travelling in the positive x direction towards the sensor. 17. Set up one hanging wire system so that the wire stretches across the sensor’s
field of view about 70 ft in front of the sensor, at some angle. Additionally, set one
side of the system to be higher than the other side, so that the wire is slanted 10o in
the z direction. Measure and record the distance from the sensor to the wire. 18. Attach the targets with string to the motorized mechanisms that will carry the
targets across the field of view. 19. Start data collection. 20. Send the targets across the field of view. Measure and record the time it takes for
each target to cross the entire field of view, so that the velocity of each target can be
calculated later. 21. End data collection. 22. Repeat steps 20-23, increasing the slant angle of the wire until it is 80o. 23. Set up three hanging wire systems. Two as described in step 14 and one as
described in step 20. Attach the targets with string to the motorized mechanisms
that will carry the targets across the field of view. 24. Start data collection. 25. Send the targets across the field of view. Measure and record the time it takes for
each target to cross the entire field of view, so that the velocity of each target can be
calculated later. 26. End data collection. 27. Repeat steps 26-29 five times, varying the relevant angles of each hanging wire
system each time.

ENGR459/460/461 Senior Design Project 2014-2015
99
Future Testing Plan Overview Included here are further tests that should be completed with the sensor. These are
just general ideas, not full test plans. However, once these tests are fully elaborated
upon, it should be easier to make a determination about the suitability for this
system for use in a UAS. More tests may be added as the project progresses and the
team learns more about the performance capabilities of the sensor.
Varying Radar Pitch One of the biggest concerns with the current system is the fact that the sensor does
not output any z data. This largely affects the avoidance side of the problem, as it
limits the avoidance maneuvers available to the UAS. One way to mitigate this concern would be to determine z data. Velocities in the z
direction may not be able to be determined, but z position data could potentially be
ascertained. This would be done using a motorized gimbaled system. The pitch of the
radar system would be able to be varied up and down from its original centered
position. A diagram with the details of how this would be carried out is shown in the
figures below.
Sensor with its original field of view (FOV)
Sensor with FOV pitched upwards by gimbal
Sensor with FOV pitched all the way down by gimbal

ENGR459/460/461 Senior Design Project 2014-2015
100
When the sensor detects a target within its original FOV (Figure 1), the gimbal will
then pitch the radar sensor upwards (Figure 2). The instant the target disappears
from the FOV, the gimbal angle and distance between sensor and target are
recorded. With these two pieces of data, the z position of the target can be
determined. Another benefit to having a gimbaled radar system is that the FOV of the sensor
could be much larger. The FOV could be constantly pitching up and down. This would
triple the FOV of the sensor, which would largely increase confidence in the system’s
ability to detect and avoid targets. Once a target was detected, the FOV could be
pitched accordingly to determine the z position of the target. Once that task was
completed, the FOV could return to pitching up and down. A problem may be
encountered when there are multiple targets detected within the FOV. However, the
system could prioritize according to which target is closest, similar to how the
avoidance model will be structured.
Dynamic Testing Ultimately this sensor is going to be moving with another vehicle while taking data.
This will likely affect the sensor’s performance. In order to determine the effect this
has on the sensor, it needs to be tested dynamically. First the sensor should be attached to a car or other vehicle that operates on the
ground. Testing should be done with stationary targets initially, and then with moving
targets. Tests similar to those planned now will be done including monitoring the
position of targets, determining the size of targets, testing with multiple targets in
different conditions, and evaluating moving targets. It is important to come up with
an accurate way to collect data by hand so that the data can be compared to the
sensor data to determine the differences in accuracy between this situation and
when the sensor was stationary. Finally, the sensor should be tested while moving in three dimensions instead of two.
This will simulate the conditions that the sensor would be in if it was attached to a
UAS. The best way to implement this test would be to use a quadcopter to hold the
sensor. Tests similar to the ones discussed in the previous paragraph could be done.
One additional test would need to be related to the target moving in the z-direction
and how the sensor interprets that it while is also moving in the z-direction.

ENGR459/460/461 Senior Design Project 2014-2015
101
Appendix XXI: Gantt Chart