sensex nifty price: inr 140 target price: inr 179 buy
TRANSCRIPT

1
52 Week High/Low INR 171.6/40.8
Bloomberg code JKLC IN
Reuters code JKLC BO
Issued Equity
(shares in mn) 122.35
Mkt. Cap in mn
Mkt. Cap in mn USD
INR 16,391
$ 298.89
Avg. Daily Vol. (‘000) 330.48
Avg. Daily Vol. (mn) INR 47.2/$ 0.86
Shareholding Sep11 Jun12 Sep12
Promoters(%) 44.19 45.95 45.95
FII (%) 3.58 3.65 5.05
DII (%) 15.39 12.64 12.75
Others (%) 37.03 37.76 36.25
Pledge (% of
promoter
holding)
0.00 0.00 0.00
Performance% 1M 3M 12M
JKLC 11.38 30.94 260.37
Sensex 1.44 4.65 24.09
Analyst: Murugesa S +91-44-30007261
0
50
100
150
200
250
300
350
0
20
40
60
80
100
120
140
160
180
Jan-1
1
Mar-
11
May-1
1
Jul-
11
Sep-1
1
Nov-1
1
Jan-1
2
Mar-
12
May-1
2
Jul-
12
Sep-1
2
Nov-1
2
Jan-1
3
JKLC Relative Sensex (RHS)
Capacity expansion to drive growth
JKLC is undergoing Greenfield expansion of its installed capacity by setting up a 2.7 MTPA unit at
Durg, Chattisgarh. JKLC is also reviving its defunct unit of 1.5 MTPA capacity in Udaipur. The total
capital outlay for these projects is INR 16.5bn. The expanded capacity is expected to boost volumes
over the next couple of years. This will also help the company in achieving economies of scale and
result in better operating leverage. We expect the revenue to grow at a CAGR of 30% over FY 12-
FY15E on the back of volume growth at a CAGR of 14% over FY12-FY15E and realization growth at a
CAGR of 8% over the same period.
Higher utilization levels and realization levels to lead margin expansion
We expect JKLC to maintain a utilization rate of around 80% over the next two years due to a favorable
demand supply scenario in Northern & Western India. On the back of strong utilization and realization
growth we expect EBIDTA margins to increase by 600 bps to reach 26% in FY 15E.
Outlook & Valuation
We Initiate coverage of JKLC with a BUY rating and price target of INR 179 based on EV/EBIDTA
multiple of 4X FY15E. We believe this valuation is justified given the doubling of capacity by JKLC
coupled with strong demand for the commodity over the next two years. We expect JKLC to report an
EPS of INR 30.56 and INR 41.69 for FY14E and FY15E respectively. At the CMP of INR 140 the stock
trades at 5.34X and 3.20X to the FY14E and FY15E EBIDTA respectively and EV/Tonne of US$ 127.44
and 62.22 EV/tone discounting FY14-15E financials and year end capacity respectively. With revenue
growth of ~28% p.a. over FY12-FY15E and higher growth in EBIDTA (~49% p.a.), the target
EV/EBIDTA multiple of JKLC is relatively lower as compared to its Indian peers and we expect the stock
to be re-rated going forward.
Risks: A downturn in economy leading to a cut in consumer spending, delay in commissioning of the
new capacity.
Valuation Summary
Y/E March ( INR mn) FY12 FY 13E FY 14E FY15E
Revenue 17,181 22,240 25,743 36,176
EBIDTA 3,280 5,565 6870 10612
PAT 1,087 2792 3739 5100
EPS 8.9 22.8 30.6 41.7
EPS growth (%) 84 157 34 36.4
FCF / Share -9.1 -31.9 -30.8 53.8
PE 15.8 6.1 4.6 3.4
P/ BV 1.6 1.3 1.1 0.9
EV / EBIDTA 6.7 5.4 5.3 3.2
EV/ton (USD) 90.1 106.7 127.2 62.2
EV / Sales 1.4 1.3 1.3 0.8
Dividend Yield (%) 1 7 10 13
ROCE (%) 9 14 14 18
ROE (%) 9 21 25 28
Net Debt / Equity 0.9 1.3 1.5 1.1
Sensex Nifty 19,818 6002
17 January 2013 Initiating Coverage
Background: JK Lakshmi Cements is a north Indian Cement major, established in 1982. JKLC has clinker capacity in Sirohi, Rajasthan and gr inding
units in Rajasthan, Gujarat and Haryana. The current clinker capacity is 4.1 MTPA and cement capacity is 5.3 MTPA. The company expanded capacity at
10% CAGR over the past four years through de bottlenecking of clinker capacity and addition of split grinding units. JKLC der ives sales volume from the
northern and western regions. The company has 5.3% share of dispatches in the northern and western regions. JKLC is doubling its cement capacity by
4.2 MTPA by setting up a Greenfield plant in Durg, Chattisgarh and by reviving its defunct unit at Udaipur.
Price: INR 140 Target Price: INR 179 BUY
JK Lakshmi Cements (JKLC) Sector: Cement/midcap
2
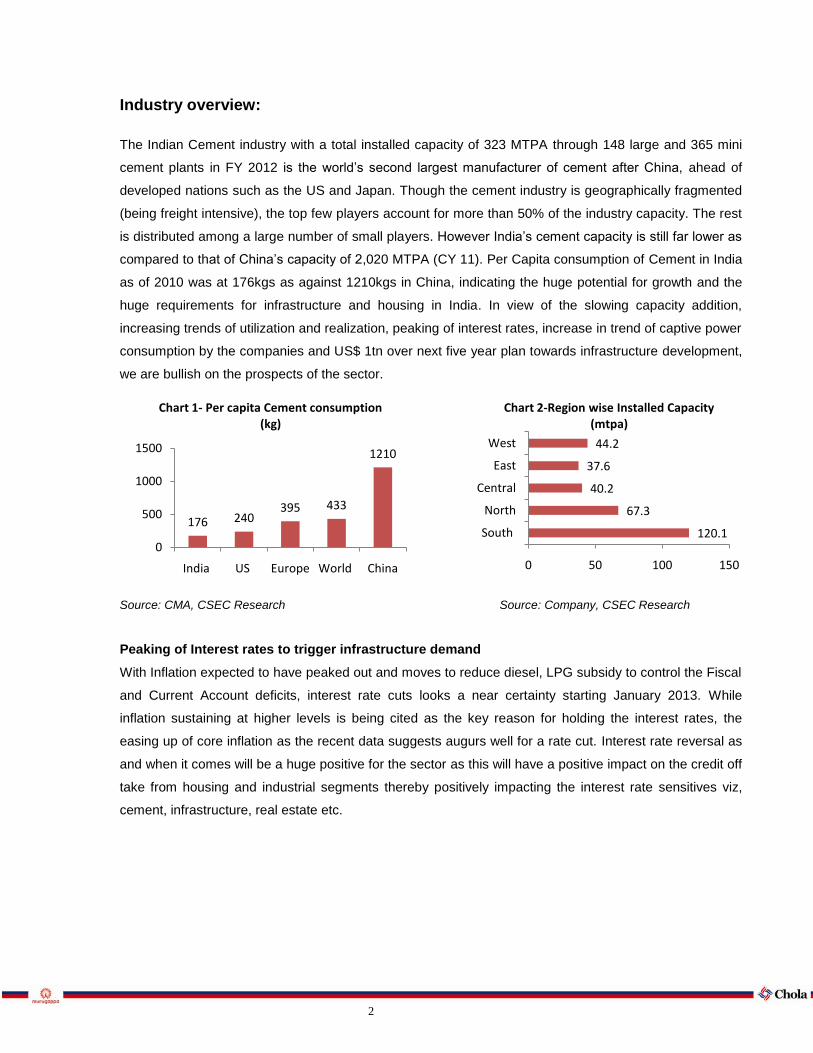
Industry overview:
The Indian Cement industry with a total installed capacity of 323 MTPA through 148 large and 365 mini
cement plants in FY 2012 is the world’s second largest manufacturer of cement after China, ahead of
developed nations such as the US and Japan. Though the cement industry is geographically fragmented
(being freight intensive), the top few players account for more than 50% of the industry capacity. The rest
is distributed among a large number of small players. However India’s cement capacity is still far lower as
compared to that of China’s capacity of 2,020 MTPA (CY 11). Per Capita consumption of Cement in India
as of 2010 was at 176kgs as against 1210kgs in China, indicating the huge potential for growth and the
huge requirements for infrastructure and housing in India. In view of the slowing capacity addition,
increasing trends of utilization and realization, peaking of interest rates, increase in trend of captive power
consumption by the companies and US$ 1tn over next five year plan towards infrastructure development,
we are bullish on the prospects of the sector.
Source: CMA, CSEC Research Source: Company, CSEC Research
Peaking of Interest rates to trigger infrastructure demand
With Inflation expected to have peaked out and moves to reduce diesel, LPG subsidy to control the Fiscal
and Current Account deficits, interest rate cuts looks a near certainty starting January 2013. While
inflation sustaining at higher levels is being cited as the key reason for holding the interest rates, the
easing up of core inflation as the recent data suggests augurs well for a rate cut. Interest rate reversal as
and when it comes will be a huge positive for the sector as this will have a positive impact on the credit off
take from housing and industrial segments thereby positively impacting the interest rate sensitives viz,
cement, infrastructure, real estate etc.
120.1
67.3
40.2
37.6
44.2
0 50 100 150
South
North
Central
East
West
Chart 2-Region wise Installed Capacity (mtpa)
176 240395 433
1210
0
500
1000
1500
India US Europe World China
Chart 1- Per capita Cement consumption (kg)

3
12th Five Year Plan –US$ 1tn investment to drive Cement demand
GoI in its draft 12th Five year plan has mentioned that it is looking to invest US$ 1tn in infrastructure
through direct and Public and Private Participation route. This coupled with softening of interest rates will
drive the next round of demand from the much delayed Investment and infrastructure investments. Within
the infrastructure the biggest share of demand comes from roads. With NHAI speeding up mechanism of
awarding the road projects in order to achieve the Ministry of Road Transport & Highways’ target of 8,800
km for FY13, higher by 10.6% y-o-y, we may see improvements in demand from road projects for the
current fiscal. As per the Central Road Research Institute (CRRI), India lags far behind developed nations
like USA and Germany where around 2/5th of roads are built of cement concrete whereas in India it is
only around 2%. National Highways have a total length of 76,818 km. The Government has been
planning to strengthen highways through various phases of the National Highways Development Project
(NHDP). Around 68% of total NHAI projects are incomplete and 77% of NHDP projects are incomplete.
The projects under implementation should provide a reasonable consumption boost. While infrastructure
related demand for cement recorded about 6% CAGR between 2007-12 (11th Five year plan), we expect
a stronger demand during the 12th five year plan.
Source: Ministry of Road Transport& Highways, NHAI, Source: Planning commission
Forthcoming elections to spur demand
Historically during election years there has always been an increase in demand for cement. In four out of
the last five general elections, the GDP multiplier has been higher than the long term industry multiplier of
1.2X. With India going to general elections in 2014, we expect an increase in demand in CY2013 as it
could be the last chance for the existing government to improve the state of infrastructure in the country.
Also many major cement consuming nations in MP, AP, Karnataka, Rajasthan, and Maharashtra are
going into elections over the next couple of years. The incumbent governments are expected to step up
infrastructure activities which will consequently drive the cement consumption.
0
2000
4000
6000
8000
10000
FY 08-10 FY 11 FY 12 FY 13E
Chart 3 -Road projects (kms) speeding up
53%
4%15%
5%
23%
Chart 4-Consumption pattern
Housing
Defence
Infrastructure
Roads
Irrigation

4
Easing of inflations and higher income levels will lead to housing growth:
The fundamental drivers of the industry remain intact. Inflation has been on the higher side for a couple of
years now and recent data suggest barring food items other components of the inflation have started
easing out. Cement demand has a negative correlation with inflation. We expect the inflation to ease out
from the current 7% and consequent increase in disposable incomes which will lead to an increase in
housing demand. We expect the housing sector to continue to be the major consumer of cement. As per
the working group on rural housing under the XII Plan, total rural housing shortage for 12th Plan is seen
at 43.67 million units which indicate the upside potential for the sector.
Slowing Capacity additions will lead to increase in utilizations
The total installed capacity in India has grown at a CAGR of 14% over the last five years to 323 MTPA in
FY12. However the installed capacity is expected to grow at a lower 5% over the next two years (FY14 &
FY15). With slowing addition and increase in demand we expect the utilization rates to be around 77% in
FY 15 against 73% in FY12. This in turn will positively affect the bottom lines of the cement companies.
GDP and Cement Consumption:
Average consumption growth of cement has been 1.2 X of GDP growths (CY 05-10). In the recent past
cement consumption to GDP has declined to 1.1X from the higher levels of 1.4X in FY 10; this was mainly
due to the extra thrust on infrastructure spending in FY 09 and FY 10 as part of an array of efforts to
revive the economy post the financial meltdown in FY 08. With drop in interest rate and some reform
measures business confidence is expected to revive and infrastructure spending would once again garner
attention and thus the industry multiplier is likely to increase to 1.2X in FY 14 and to 1.3X in FY15.
FY 06 FY 07 FY 08 FY 09 FY 10 FY 11
Cement consumption / GDP 1.2 1.1 1.1 1.3 1.4 1.1
Source: Bloomberg, CSEC Research

5
Porters Five Force Model:
Source: CSEC Research

6
Company Profile: JK Lakshmi Cement is a north Indian cement company established in 1982. The company is part of a
diversified JK Group having business ventures in various segments such as paper, tyres, sugar, agri
genetics and clinical research.
JK Lakshmi Cement Ltd has state-of-the-art plant at Jaykaypuram, dist. Sirohi, Rajasthan. With the
capacity expansion and further commissioning of split location grinding units at Motibhoyan, Kalol
(Gujarat) & Bajitpur, Jhajjar (Haryana), the combined capacity of the Company today stands at 5.30
MTPA
The company has also ventured into the high growth RMC segment to keep in touch with the global
construction trends & changing needs of customers. The company has introduced state-of-the-art Ready
Mix Concrete (RMC) with the brand name” JK Lakshmi Power Mix”. Currently, the company has 10 fully
operational plants in Western & Northern regions of the country and is further expanding in this area. ‘JK
Lakshmiplast’ the first premium branded Plaster of Paris (POP) in Northern India is another value added
product launch. The company's product is chosen for various important projects such as IGNP, Sardar
Sarovar Dam and also by major corporations like L&T, Reliance, Essar and Airport Authority of India.
JKLC with a market share of around 2.17% caters to the Northern (56%) and Western (44%) regions of
the country. Gujarat and Rajasthan are the top two markets for JKLC, contributing 60% of the total
volumes.
Source: Company, CSEC Research Source: Company, CSEC Research
24%
32%8%
36%
Chart 5 -JKLC Sales
Rajasthan North India
Maharastra Gujarat
90%
10%
Chart 6-JKLC Capacity
North West

7
Expansion of capacity
The company is setting up a Greenfield plant at Durg, Chattisgarh with a capacity of 2.7 MTPA at a
capital outlay of INR 15bn. It is expected to be operational by the beginning of FY15. Besides
clinkerisation facility at Durg, the Project will have two additional split location grinding units in different
states of Eastern India. This will enable the company to substantially cover Eastern Indian markets. JKLC
is also reviving its defunct unit with a capacity of 1.5 MTPA at Udaipur. This will increase the Company’s
cement capacity to about 10 MTPA from the current 5.3 MTPA.
A snapshot of the products offered by the company:
JK Lakshmi Cement
Cement 53 Blended
53 Grade OPC
43 Grade OPC
JK Lakshmi Plast
JK Lakshmi Power mix
Management Team
Shri Harishankar Singhania, Chairman
He is the Chairman of the J.K. Lakshmi Cements. Mr. Singhania has over 55 years of experience in
managing various industries including paper, cement, automotive tyres, synthetics, jute and hybrid seed
industries. He served as the President of the International Chamber of Commerce from 1993 to 1994. He
holds a Bachelor's Degree in Science from Calcutta University.
Shri Bharat Hari Singhania, Vice Chairman & Managing Director
Shri Singhania serves as Vice Chairman and Managing Director of JK Lakshmi Cement Ltd. He is an
industrialist with over 44 years of experience in managing various industries including cement, automotive
tyres, paper, jute, synthetics and high yielding hybrid seeds. He has been the President of the Indian
Chamber of Commerce and Chairman of the Indian Jute Mills Association. He is a commerce graduate.
Smt. Vinitha Singhania, Managing Director
Mrs. Vinita Singhania serves as Managing Director of JK Corp. Ltd. Mrs. Singhania serves as President of
Cement Manufacturers Association. She was awarded "Best Women Entrepreneur" by Kalyani
Foundation, Pune by "Meri Dilli" Newspaper Group and "Bharat Shiromani Award - 2006" by Shiromani
Institute. Mrs. Singhania is a Graduate in Arts.
Chart 7- SHARE HOLDING PATTERN
Source: BSE India, CSEC Research
45.95%
5.05%
12.75%
36.25%
Promoter FII DII Others

8
Investment Rationale
Volume expansion to drive revenues
JKLC is setting up a Greenfield plant with an installed capacity of 2.7 MTPA unit at Durg, Chattisgarh with
a capital outlay of INR 15bn. This is expected to be commissioned by the beginning of FY 15. Besides
clinkerisation facility at Durg, the Project will have two additional split location grinding units in different
states of Eastern India. This will enable the Company to substantially cover Eastern Indian markets. It
completed setting up a split grinding unit of 0.5 MTPA at Jhajjar, Surat in March 2012. JKLC is also
reviving its defunct unit of 1.5 MTPA capacity at Udaipur at a capital outlay of INR 1.50 bn. For this
purpose the company has issued 9% secured Non Convertible Redeemable Debentures of INR 0.5bn to
the erstwhile lenders of Udaipur Cement Works Ltd. The company’s total installed capacity will increase
to 10 MTPA post expansion as against the current 5.3 MTPA. The expanded capacity is expected to
provide volume boosts over the next couple of years. This will also help the company in achieving
economies of scale. We expect the revenue to grow at a CAGR of 30% over FY 12 to FY15E on the back
of volume growth at a CAGR of 14% over FY12-FY15E and realization growth at a CAGR of 8%
Higher utilization levels and realization levels to lead margin expansion
Cement capacity addition has slowed down after a relentless addition over the last decade. Cement
capacity addition in India is expected to grow at around 5%p.a over the next two years (FY 13E-15E).
This compares with 14%p.a capacity growth over the last five years and 10%p.a over the last decade.
The slow pace of capacity addition is expected to lag the incremental demand of around 9%p.a over
FY13E-15E which will help the company to achieve higher utilization levels. The stabilization of JKLC’s
Kiln I rehabilitation undertaken in FY 2010-11 helped the clinker production in FY 2011-12 to notch up a
growth of 8%. This coupled with Company’s improved sales performance vis-à-vis its competitors enabled
JKLC to achieve a volume growth of 14%. This compares favorably with the industry’s growth of 7% on all
India basis and 11% in the company’s marketing zone. The higher volume growth also enabled the
Company to achieve near 100% capacity utilization as against industry’s 75% and 80% by cement
companies in the company’s marketing zone. The higher capacity utilization has helped the company in
reducing the costs. Going forward, we expect the capacity utilization to be about 80%. The favorable
demand supply scenario, production discipline will lead to increase in pricing power of the companies. We
expect realization to grow at a CAGR of 8% p.a over FY12-15E. On the back of strong utilization and
realization growth we expect EBIDTA margins to increase by 600 bps to reach 26% in FY 15E.

9
Source: Company, CSEC Research Source: Company, CSEC Research
Key cost drivers well addressed
JKLC has secured a long term power supply from VS lignite. This long term agreement assures them of
21MW of power at a cost of INR 3.94/Kwh which is closer to their captive power production cost. Apart
from the existing power plant of 36MW it also has an upcoming power plant of 18MW and a 12MW green
power plant to utilize the waste heat of pre heater. This leaves the company with a surplus power
capacity of 20MW after considering their requirement of 67MW, which could be sold outside at
competitive rates. In a rising cost scenario, this self sufficiency in power requirements augurs well for the
company to increase its bottom line.
Source: Company, CSEC Research
Freight costs
Freight costs account for nearly 22% of the total costs and have seen almost a 25% CAGR increase over
the last seven years. Recently the Government has raised prices of diesel by INR 5 per litre, which will
lead to increase in operating costs by INR 60-75/MT for cement companies. There is also proposal in
front of the cabinet to increase diesel prices by INR 1 every month. JKLC has the advantage of having the
clinker units closer to its marketing zones. JKLC has a Rail-Road mix of 50:50 against the overall industry
0
1000
2000
3000
2012 2013E 2014E 2015E
Chart 8-EBIDTA
9488
83
76 75 77 79
100104
9691
100 98 100
70
75
80
85
90
95
100
105
110
Industry JKLC
80
79 79
78
77
78
79
80
81
FY 09 FY 10 FY 11 FY 12
Chart 9- Electricity Consumption-(Kwh/T of Cement

10
Rail-Road mix of 30:70. We are confident that the management will be able to pass on any further
increase in the power and freight costs
Better performing markets
JKLC caters mainly to the northern and western regions of the country with Gujarat and Rajasthan being
the major markets contributing 60% of their sales. The volume growth of 15.38% and 15.4% in Gujarat
and Rajasthan respectively for the last fiscal was almost double that of the all India growth of 7%. We
expect the demand in these areas to grow by 13% as against the all India growth of 9% on the back of
elections in these regions and the forth coming Delhi Mumbai Industrial Corridor
Tenure End Date State Election
Dec-2012 Gujarat FY 13
Dec-2013 Delhi FY 14
Dec-2013 Rajasthan FY 14
Dec-2014 Maharashtra FY 15
Source: Election Commission of India
Buy back announcement
The company has announced buyback plan of equity up to INR 975mn. The maximum buy back price is
set at INR 70. The buyback began previous fiscal on 26th March 2012 and will end on 6
th Feb 2013. JKLC
as on October 20, 2012 bought back and extinguished 4,688,858 equity shares. The equity share capital
of the company stands reduced from INR 61.19 Cr. to INR 58.85 Cr pursuant to buy back.
Major projects that could positively affect JKLC
JKLC focus markets lie in the same area as where the forth coming Delhi Mumbai Industrial Corridor and
Dedicated Freight Corridor projects are coming up. JKLC will benefit from the off take in cement because
of this project and from the industrial townships that would come along this corridor
Delhi-Mumbai Industrial Corridor (USD 90bn)
Delhi-Mumbai Industrial Corridor is a mega infrastructure project with an estimated cost of around USD
90bn. This will aim to cover a length of 1483 Km between Delhi and the financial capital of India. This is to
be executed with financial aids and technical aids from Japan. This ambitious project aims at developing
an Industrial Zone spanning across six states in India. It covers six states namely Delhi, Western Uttar
Pradesh, Southern Haryana, Eastern Rajasthan, Eastern Gujarat and Western Maharashtra. This will
benefit players is the Central, Western and Northern regions.

11
Dedicated Freight corridor
Under the Eleventh Five Year plan of India(2007–2012), Ministry of Railways is constructing a new
Dedicated Freight Corridor (DFC) covering about 2762 route km long two routes - the Eastern Corridor
from Ludhiana to Dankuni and the Western Corridor from Jawaharlal Nehru Port at Nhava Sheva in Navi
Mumbai to Tughlakabad, Delhi/Dadri along with interlinking of two corridors at Khurja. Upgrading of
transportation technology, increase in productivity and reduction in unit transportation cost are the focus
areas for the project. With the loan of INR 200bn from Japan, funding of the entire Western Dedicated
Freight Corridor from Delhi to Mumbai has been taken care of.
Strong Balance sheet
The company’s strong balance sheet with a low leverage augurs well for future expansion plans. Of the
total Capital expenditure of INR 16.50bn, the company will raise debts for INR 11.00bn and the balance
through internal accruals. For the purpose of reviving the defunct unit at Udaipur the company has issued
9% secured Non Convertible Redeemable Debentures of INR 50bn to the erstwhile lenders of Udaipur
Cement Works Ltd.
Source: Company, CSEC Research Source: Company, CSEC Research
1903.642318.63 2449.98 2549.98 2599.98
4249.98
0.00
1000.00
2000.00
3000.00
4000.00
5000.00
2009-10 2010-11 2011-12 2012-13 2013-14 2014-15
Chart 10-Fixed Assets ( Crores)
1.86
1.12 0.90.93 0.99
0.96
1.251.46
1.12
0.81
1.21.41.61.8
2
Chart -11 Net debt to equity

12
Financials & Valuations
The expanded capacity is expected to provide volume boosts over the next couple of years. This will also
help the company in achieving economies of scale. We expect the revenue to grow at a CAGR of 30%
over FY 12 to FY15E on the back of volume growth at a CAGR of 14% over FY12-FY15E and realization
growth at a CAGR of 8%
Chart 12- Revenue growth
Source: CSEC Research
Valuation
We Initiate coverage of JKLC with a BUY rating and price target of INR 179 based on EV/EBIDTA
multiple of 4X FY15E. We believe this valuation is justified given the doubling of capacity by JKLC
coupled with strong demand for the commodity over the next two years. We expect JKLC to report an
EPS of INR 30.56 and INR 41.69 for FY14E and FY15E respectively. At the CMP of INR 140 the stock
trades at 5.34X and 3.20X to the FY14E and FY15E EBIDTA respectively and EV/Tonne of US$ 127.44
and 62.22 EV/tone discounting FY14-15E financials and year end capacity respectively. With revenue
growth of ~28% p.a. over FY12-FY15E and higher growth in EBIDTA (~49% p.a.), the target EV/EBIDTA
multiple of JKLC is relatively lower as compared to its Indian peers and we expect the stock to be re-rated
going forward.
Chart 13: 1-year forward EV/EBDITA band chart Chart 14: 1-year forward PBV band chart
0
100
200
300
400
500
600
0
500
1000
1500
2000
2500
3000
3500
4000
2011 2012 2013E 2014E 2015E
Revenue
PAT
0
50
100
150
200
250
300
350
400
8x7x6x5x
_____JKLC
0
100
200
300
400
Jan
-07
May
-07
Sep
-07
Jan
-08
May
-08
Sep
-08
Jan
-09
May
-09
Sep
-09
Jan
-10
May
-10
Sep
-10
Jan
-11
May
-11
Sep
-11
Jan
-12
May
-12
Sep
-12
INR jklc2.9X
2.2X1.5X
0.8X

13
Chart 15: 1-year forward PE band chart
Key Challenges well addressed:
Gypsum supply
JKLC sources its gypsum supplies locally and sees no problem with the same going forward
Limestone reserves
The limestone reserves for the existing capacity as well as the new capacity at Chattisgarh will last for
another 30 years while the reserves at the forthcoming Udaipur plant will last for about 50 years.
Pet Coke
JKLC sources its pet coke for its power consumption from Reliance Industries Limited. The prices are
volatile but supply is secured
Key Risks to our recommendation:
Delay in Commissioning of New Capacity: It is expected to be commissioned in the beginning of FY15.
Any further delays in commissioning of the new capacity will adversely affect our expectations and
forecast
Slowdown in the economy:
A general slowdown in the economy will negatively affect our forecasts for the industry as well as the
company and consequently our recommendations.
0
50
100
150
200
250
300
350
Jan
-07
May
-07
Oct
-07
Feb
-08
Jun
-08
Oct
-08
Feb
-09
Jun
-09
Oct
-09
Feb
-10
Jun
-10
Oct
-10
Feb
-11
Jun
-11
Oct
-11
Feb
-12
Jun
-12
Oct
-12
INR
13X
11X
9X
5X
_____ JKLC

14
Income Statement (Abstract)
INR(million)
Particulars FY12 FY13E FY14E FY15E
Net Revenue 17,181 22,240 25,743 36,176
Growth (%) 30 29 16 40
Operating Exp. 13,901 16,675 18,872 25,564
EBIDTA 3,280 5,565 6,870 10,612
Growth (%) 72 70 23 54
Depreciation 1,297 1,323 1,274 2,124
Other Income 634 195 56 68
Interest 796 874 874 2029
Exceptional Items -390 20 20 20
Tax Paid 339 790 1,057 1,444
Tax Rate (%) 22 22 22 22
PAT (After MI) 1,087 2,792 3,739 5,100
Growth (%) 84 157 34 36
Balance Sheet (Abstract)
INR(million)
Particulars FY12 FY13E FY14E FY15E
Share Capital 610 610 610 610
Reserves & Surplus 11,140 12,608 11,414 17,468
Net worth 11,750 13,218 12,024 18,078
Current Liabilities 3,740 7,313 8,434 10,057 Non-Current Liabilities 10,661 16,571 21,975 19,250
Total Liabilities 26,153 37,105 45,436 47,387
Net Fixed Assets 16,233 22,310 29,435 27,310 Other Non-Current Assets 3773 4773 7026 4384
Cash 890 1,959 1,394 2,764 Other Current Assets 6,959 8,061 7,572 12,477
Total Assets 26153 37,105 45,436 47,387
Cash Flow statement (Abstract)
INR(million)
Particulars FY 12 FY 13E FY14E FY15E
Cash flow from operations 3,778 3,486 4,635 6,576 Cash flow from investing -3535 -7343 -8343 58 Cash flow from financing -247 4,619 3,143 -5,264
Free cash flow -1,113 -3,913 -3,764 6,576
Net change in cash 4 762 -5,65 1,369
Per Share Ratios
Particulars FY12 FY13E FY14E FY15E
Adjusted EPS (Rs.) 8.89 22.82 30.56 41.69
Cash EPS 30.88 28.50 37.88 53.75
BV/Share (Rs.) 90.93 108.05 122.81 147.77
FCF/Share(Rs.) -9.10 -31.98 -30.77 53.75
DPS (Rs.) 1.9 9.1 13.8 18.8
Key Ratios
Particulars FY12 FY13E FY14E FY15E
Dividend payout (%) 40 40 45 45
EBIDTA margin (%) 20 23 24 26
PBT Margin (%) 7 15 17 16
RoCE (%) 9 14 14 18
RoE (%) 9 21 25 28
Current Ratio 1.4 1.4 1.1 1.5
Debt/Equity 0.9 1.3 1.5 1.1
Inventory Days 72.0 23.6 27.3 25.3
Debtor Days 7.3 8.0 8.0 8.0
Creditor Days 104.2 95.0 95.0 95.0
Interest Cover Ratio 3.91 5.59 6.92 4.26
DuPont Analysis
Particulars FY12 FY13E FY14E FY15E
Net Profit Margin (%) 5.7 11.4 13.0 12.6
Asset Turnover 0.7 0.7 0.6 0.9
Leverage factor 2.2 2.5 2.8 2.6
RoE (%) 9.3 21.1 24.9 28.2
Valuation Ratios
Particulars FY12 FY13E FY14E FY15E
P/E 15.7 6.1 4.6 3.4
P/BV 1.5 1.3 1.1 0.9
EV/Sales 1.4 1.3 1.3 0.8
EV/EBIDTA 6.7 5.4 5.3 3.2
EV/ Ton (USD) 90.1 106.7 127.2 62.2
Div Yield (%) 1.4 6.5 9.8 13.4
Financials

Cholamandalam Securities Limited
Member: BSE,NSE,MSE
Regd. Office: Dare House,2 (Old) # 234) N.S.C Bose Road, Chennai – 600 001.
Website : www.cholawealthdirect.com
Email id – [email protected]
Chola Securities is a leading southern India based Stock broker. Our focus area of coverage within the Indian market is Mid and small caps with
a focus on companies from southern India.
Our Institutional Equities services are carried out in partnership with RCCR, a boutique Investment research and Corporate Advisory firm
founded by a team with extensive experience in the Asset management industry.
RESEARCH
Singaravelu K P Head of Research +91-44 - 4505 6003 [email protected]
Alagappan Ar Financial Services +91-44 - 3000 7363 [email protected]
Sathyanarayanan M Consumption +91-44 - 3000 7361 [email protected]
Murugesa S Engineering & Cement +91-44 - 3000 7360 [email protected]
Michel Charles C Technicals +91-44 - 3000 7353 [email protected]
Rajasekhar R IT & Auto Ancillary +91-44 - 3000 7266 [email protected]
Sreedevi K Associate +91-44 - 3000 7266 [email protected]
INSTITUTIONAL SALES
Venkat Chidambaram Head of FII Business & Corporate Finance +91-44 - 24473310 [email protected]
Lakshmanan T S P Chennai +91 - 9840019701 [email protected]
Santosh Kumar Sharma Mumbai +022 - 22617210 [email protected]
RETAIL SALES
Chetan Dilipkumar Daxini AHMEDABAD 079 - 64500318 / 19 [email protected]
Sathyanarayana N BANGLORE 080 - 41503340 / 44 [email protected]
Muthiah A N CHENNAI - HO 044 – 3000 7371 [email protected]
Baskaran S CHENNAI - Annanagar 044 - 26208911 / 14 [email protected]
Sridharan P S CHENNAI - Adyar 044 - 2452 2111 / 2333 [email protected]
Chandrasekar K COIMBATORE 0422 - 4292041 / 4204620 [email protected]
Maneesh Gupta DELHI 011 - 30461161 / 62 / 63 [email protected]
Murthy A S L N HYDERABAD 040 - 23316567 / 68 [email protected]
Shibarjun Mukherjee KOLKATA 033 - 44103638 / 39 [email protected]
Sheetal Bheda MUMBAI 022 - 22617210 / 7203 [email protected]
Gowthaman G MADURAI 0452 - 2601195 / 96 [email protected]
Deepak V Kshirsagar PUNE 020 - 30225432 / 33 /34 [email protected]
Gangadhar M VIZAG 0891 - 6642718 [email protected]
COMPLIANCE
Balaji H Compliance +91-44 - 3000 7370 [email protected]
DISCLAIMER:
This report is for private circulation and for the personal information of the authorized recipient only, and we are not soliciting any action based upon it. This report is not to be construed as an offer to sell or the solicitation of an offer to buy any security in any jurisdiction where such an offer or solicitation would be illegal. It does not provide individually tailor-made investment advice and has been prepared without regard to any specific investment objectives, financial situation, or any particular needs of any of the persons who receive it.
The research analyst who is primarily responsible for this report certifies that: (1) all of the views expressed in this report accurately reflect his or her personal opinions about any and all of the subject securities or issuers; and (2) no part of any of the research analyst’s compensation was, is, or will be directly or indirectly related to the specific recommendations or views expressed in this report. This report has been prepared on the basis of information that is already available in publicly accessible media or developed through analysis of Cholamandalam Securities Limited makes every effort to use reliable, comprehensive information, but we make no representation that it is accurate or complete.
The views expressed are those of the analyst and the Company may or may not subscribe to all the views expressed therein Cholamandalam Securities Limited reserves the right to make modifications and alterations to this statements as may be required from time to time without any prior approval. Cholamandalam Securities Limited, its affiliates, directors and employees may from time to time, effect or have effect an own account transaction in or deal as agent in or for the securities mentioned in this report. The recipient should take this into account before interpreting the report.
All investors may not find the securities discussed in this report to be suitable. Cholamandalam Securities Limited recommends that investors independently evaluate particular investments and strategies. Investors should seek the advice of a financial advisor with regard to the appropriateness of investing in any securities / investment strategies recommended in this report. The appropriateness of a particular investment or strategy will depend on an investor’s individual preference. Past performance is not necessary a guide to future performance. Estimates of future prospects are based on assumptions that may not be realized. Re-publication or redistribution in any form, in whole or in part, is prohibited.
No part of this material may be duplicated in any form and/or redistributed without Cholamandalam Securities Limited prior written consent.