sensing of lateral seismic earth pressures in geotechnical centrifuge ... · 1 sensing of lateral...
TRANSCRIPT

1
Sensing of Lateral Seismic Earth Pressures
in Geotechnical Centrifuge Models
Paper Title Line 2
S. Dashti, K. Gillis, M. Ghayoomi University of Colorado at Boulder
Y. Hashash University of Illinois at Urbana Champaign
SUMMARY:
A reliable measurement of dynamic earth pressures is critical in the physical modelling of structures embedded
in soil. Tekscan tactile pressure sensors are flexible, thin sheets containing a matrix of sensels, each capable of
measuring pressure. This flexible sensor is able to measure a 2–D stress distribution with minimal intrusion.
Although successful in static and 1-g shaking table tests, these sensors have previously not been reliable in
capturing the full amplitude content of dynamic signals. This is in part due to signal aliasing and the sensor’s
own frequency response. This paper describes the use of new sensors capable of sampling at up to 4,000 Hz. A
series of dynamic experiments were performed to characterize the frequency response of the sensors and
successfully recover the original pressure time histories. Based on the satisfactory results, a testing methodology
is proposed for the dynamic calibration of these sensors in centrifuge modelling.
Keywords: Centrifuge, Dynamic Pressure, Sensor, Lateral Earth Pressure, Physical Modelling
1. INTRODUCTION
Physical centrifuge modelling is an effective tool commonly used by geotechnical engineers to gain
insight into the underlying damage mechanisms under realistic confining pressures and to validate
numerical models. When investigating the seismic response of buried structures, retaining structures,
or basement walls, a reliable measure of dynamic earth pressures is necessary. Obtaining reliable
measurements with pressure cells has been challenging in the past due to soil arching effects, where
soil displaces differently near a relatively stiff pressure cell than it would naturally. Tekscan tactile
sensors are flexible, thin sheets containing a matrix of sensels (sensors), each capable of measuring
pressure at high sampling rates (as high as 20,000 Hz per sensel). Their flexibility is ideal for interface
with soil, as they deform with the surrounding soil with minimal intrusion. Increased sampling rates
are necessary to capture dynamic earth pressures in the high frequency environment of the centrifuge.
Although tactile pressure sensors have proven to be successful in measuring pressures in static and 1-g
shaking table tests, they have previously not been reliable in capturing the full amplitude content of a
dynamic signal. This is partially due to signal aliasing, which occurs when a signal is not accurately
represented due to a slow sampling rate. Typically, a signal needs to be sampled at least twice as fast
as the highest frequency, in order to avoid aliasing. For instance, when spinning the model to 70 g, the
frequencies are scaled by 70. For earthquake engineering applications we typically care about
frequencies of up to approximately 15 to 20 Hz in the prototype scale. This translates to 15 x 70 Hz
(=1050 Hz) in the model scale. To capture this range of frequency in the model scale without signal
aliasing, the sensors must sample at a minimum rate of approximately 2100 Hz.
A new type of tactile pressure sensor produced by Tekscan capable of sampling at up to 4,000 Hz was
employed to avoid problems associated with aliasing. However, unreliable dynamic measurements are
also due to the tactile sensor’s own frequency response. As a result, a series of dynamic experiments
were performed to characterize the frequency response of the sensors. Constant amplitude, sine-sweep
loads were applied to the sensor with a materials testing machine to characterize its frequency response
2
(in terms of amplitude modification). The identified pattern in their frequency response (i.e., filter) was
used to recover the input signal of interest (i.e., pressure time history). Then, a series of blind tests
were performed to validate the quality of the filter. These tests were followed by dynamic centrifuge
experiments with a range of input motions that contained energy at higher frequencies to further
validate the reliability of the filter.
This paper presents the testing methodology used to characterize the frequency response of Tekscan
tactile pressure sensors. The recovered Tekscan data and the reference signals are then compared and
the error in the recovered pressure measurements is quantified as a function of frequency. The testing
methodology also presents a guideline for the calibration of tactile pressure sensors prior to use in
future physical model studies.
2. TEKSCAN TACTILE PRESSURE SENSOR SYSTEM
The Tekscan system is comprised of a sensor, a “handle”, and the data acquisition board. Tekscan
VersaTek components were selected due to their high sampling rate capability. The “handle” is
clamped to the sensor and transmits data to the data acquisition board, which is then connected to a
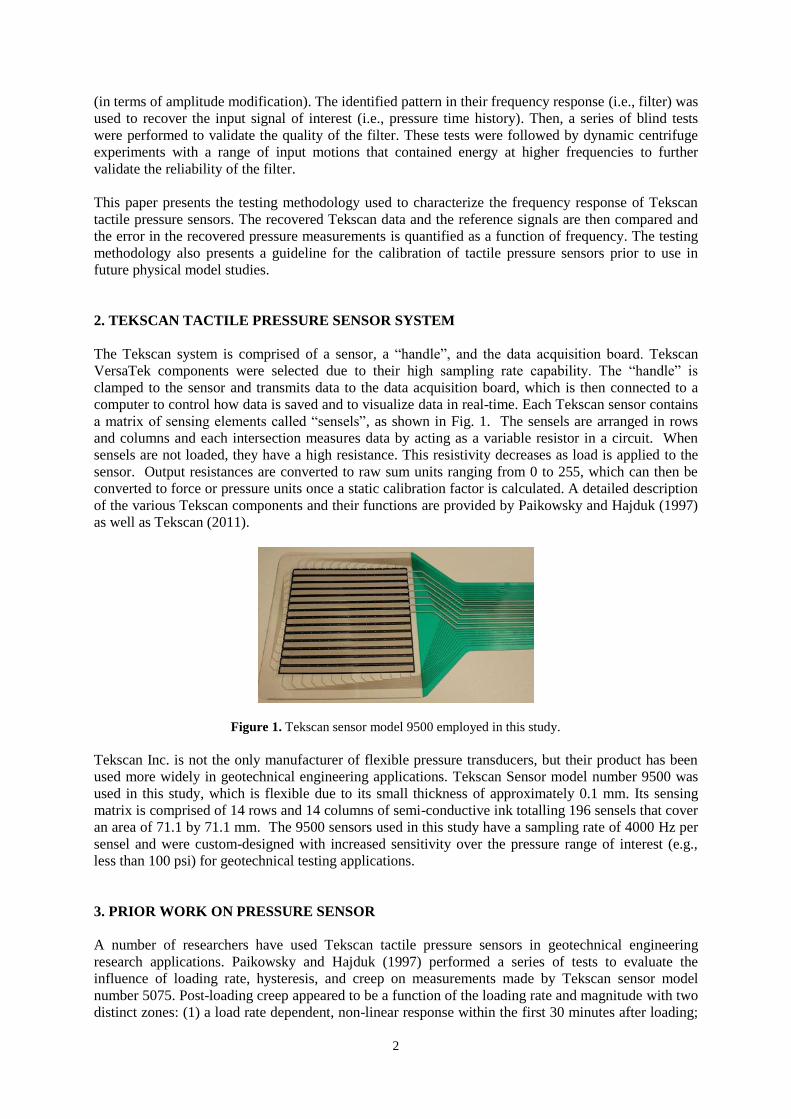
computer to control how data is saved and to visualize data in real-time. Each Tekscan sensor contains
a matrix of sensing elements called “sensels”, as shown in Fig. 1. The sensels are arranged in rows
and columns and each intersection measures data by acting as a variable resistor in a circuit. When
sensels are not loaded, they have a high resistance. This resistivity decreases as load is applied to the
sensor. Output resistances are converted to raw sum units ranging from 0 to 255, which can then be
converted to force or pressure units once a static calibration factor is calculated. A detailed description
of the various Tekscan components and their functions are provided by Paikowsky and Hajduk (1997)
as well as Tekscan (2011).
Figure 1. Tekscan sensor model 9500 employed in this study.
Tekscan Inc. is not the only manufacturer of flexible pressure transducers, but their product has been
used more widely in geotechnical engineering applications. Tekscan Sensor model number 9500 was
used in this study, which is flexible due to its small thickness of approximately 0.1 mm. Its sensing
matrix is comprised of 14 rows and 14 columns of semi-conductive ink totalling 196 sensels that cover
an area of 71.1 by 71.1 mm. The 9500 sensors used in this study have a sampling rate of 4000 Hz per
sensel and were custom-designed with increased sensitivity over the pressure range of interest (e.g.,
less than 100 psi) for geotechnical testing applications.
3. PRIOR WORK ON PRESSURE SENSOR
A number of researchers have used Tekscan tactile pressure sensors in geotechnical engineering
research applications. Paikowsky and Hajduk (1997) performed a series of tests to evaluate the
influence of loading rate, hysteresis, and creep on measurements made by Tekscan sensor model
number 5075. Post-loading creep appeared to be a function of the loading rate and magnitude with two
distinct zones: (1) a load rate dependent, non-linear response within the first 30 minutes after loading;
3
and (2) a second linear zone that did not depend on the loading rate. Hysteretic and loading rate effects
were studied by applying different constant loading and unloading rates to the sensor. A nonlinear
response was observed upon initially unloading the sensor followed by a linear unloading phase.
Springman et al. (2002) conducted a successful study of the distribution of soil stresses beneath a
circular footing that was pushed into the soil at a constant displacement rate under 50 g of spin
acceleration using Tekscan sensors. .Further, they investigated the dynamic, impact loading response
of these sensors to mimic rock falls on the roof of a protection structure at 1g. These tests
demonstrated the sensor’s ability to reliably measure a dynamic, quick, impulse event under 1g testing
conditions. The dynamic response of these sensors under higher levels of spin acceleration and higher
frequency contents, however, was not investigated.
Tessari et al. (2010) described the static calibration process of Tekscan sensors used at Rensselaer
Polytechnic Institute (RPI) in geotechnical centrifuge experiments. They calibrated the sensor by
placing it at the bottom of a centrifuge container filled with soil and spinning the model to specific
accelerations. In this way, they obtained two calibration points corresponding to the upper and lower
limits of the overburden stress expected for their tests. This method of static calibration closely models
the intended interface conditions of metal with soil. After statically calibrating the sensor, Tessari et al.
(2010) affixed the sensors to the side of the centrifuge container filled with soil and spun up the model;
a stress distribution increasing with depth was found to correspond closely to a theoretical distribution
with a Ko value of 0.38 under static conditions.
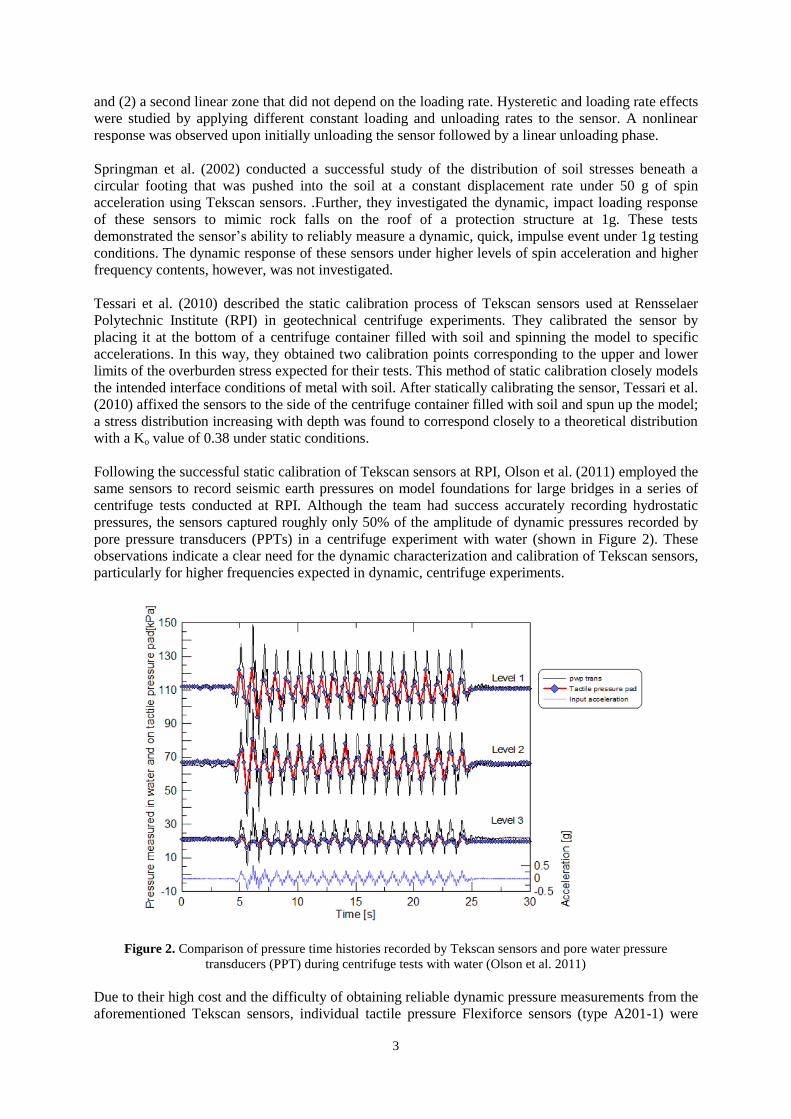
Following the successful static calibration of Tekscan sensors at RPI, Olson et al. (2011) employed the
same sensors to record seismic earth pressures on model foundations for large bridges in a series of
centrifuge tests conducted at RPI. Although the team had success accurately recording hydrostatic
pressures, the sensors captured roughly only 50% of the amplitude of dynamic pressures recorded by
pore pressure transducers (PPTs) in a centrifuge experiment with water (shown in Figure 2). These
observations indicate a clear need for the dynamic characterization and calibration of Tekscan sensors,
particularly for higher frequencies expected in dynamic, centrifuge experiments.
Figure 2. Comparison of pressure time histories recorded by Tekscan sensors and pore water pressure
transducers (PPT) during centrifuge tests with water (Olson et al. 2011)
Due to their high cost and the difficulty of obtaining reliable dynamic pressure measurements from the
aforementioned Tekscan sensors, individual tactile pressure Flexiforce sensors (type A201-1) were

4
instead used by Al Atik (2008) and Sitar et al. (2012) testing at UC Davis’ Center for Geotechnical
Modeling (CGM). These sensors have a limited sampling rate and similarly have their own dynamic
response. However, they are more economical and can be used as a secondary tool to measure pressure
time histories, in parallel with indirect measurements with strain gauges. The reliability of these
sensors for capturing high frequency dynamic pressures, however, is similarly not well-understood.
4. CHARACTERIZING SENSOR RESPONSE
The Tekscan sensor model used in this study (9500) had the capability to sample at 4000 Hz on each
sensel, thus eliminating problems associated with aliasing observed with older sensor models.
However, the inability of the sensor to capture the full amplitude response of dynamic loading
remained. The sensor behaves in a similar manner to a spring: when loaded in compression, the sensor
measures load that each sensel “feels”. If the spring is compressed and unloaded at a high frequency,
then the spring is unable to transfer the full magnitude of the load to the sensing elements before that
load is released. By characterizing how the sensor records load over a range of frequencies, a filter
may be developed to compensate for the loss of amplitude information at higher frequencies. In order
to characterize the dynamic response of the sensor, a testing method was developed to load the sensor
to relatively high frequencies using the Instron E10000 machine and centrifuge shake table at the
University of Colorado, Boulder.
4.1. Loading Machine Tests
Material testing machines are commonly used in Mechanical and Civil Engineering to test the tensile,
compressive, or cyclic fatigue properties of materials. An Instron model E10000 used in this study is
capable of applying either force or displacement controlled static and dynamic loads to a material. The
maximum frequency of its dynamic load depends on the load amplitude. For example, a sinusoidal
load with an amplitude of 20 pounds may be accurately achieved by the Instron machine for up to a
frequency of approximately 50 Hz. For higher frequency ranges, the Instron machine starts to produce
varying amplitudes up to approximately 120 Hz, beyond which the signal to noise ratio reduces
significantly. Centrifuge shake tables, however, can produce dynamic, broadband motions containing
frequency content up to approximately 400 Hz or higher. Fig. 4 and 7 show variations in the achieved
loading amplitudes at different frequencies obtained by the Instron machine.
Using the Instron machine, sine-sweep loads were applied to the Tekscan sensor. Both the Instron load
cell and the Tekscan software simultaneously recorded the applied forces. In earlier tests, the Tekscan
sensors appeared to have a strong component of noise near 60 Hz. Placing a grounding wire from the
Tekscan data acquisition system to the base platform of the Instron machine helped eliminate the
observed noise in its recordings.
In order to apply a sine-sweep loading sequence with the Instron machine, a test sequence was
developed in steps: 1) the sensor was loaded from 0 to 150 pounds in compression; 2) a load-
controlled, 20 pound-amplitude, sinusoidal load with a frequency of 1 Hz was applied for three cycles;
3) the frequency of the sinusoidal load was increased by increments of 1 Hz to reach 140 Hz; 4) the
sensor was unloaded from its offset load of 150 pounds. The testing setup is shown in Fig. 3.
It is recognized that the initial testing setup used in this study does not reflect the soil-metal interface
intended for the geotechnical centrifuge tests and that the interface is expected to play a major role in
the static calibration factor. The influence of different material-sensor interface conditions (e.g., sand
and metal) will be investigated in future static centrifuge tests.

5
Figure 3. Instron testing setup for the dynamic calibration of Tekscan sensors
4.1.1. Static Calibration
The static calibration of Tekscan sensors is a sensitive process. The Tekscan manual (Tekscan 2011)
recommends that the test material interface, contact pressure, temperature, and time duration of testing
be mimicked as closely as possible to the actual test conditions. Once these conditions are met, one
load point is sufficient to calibrate the sensors. Palmer et al. (2009) investigated the difference between
using one, two, and five point calibrations. Using a two-point calibration appeared to provide increased
accuracy over one-point calibration, but no difference was observed between two- and five-point
calibrations. Calibration is unique for each sensor even under static loading; therefore each sensor
requires individual calibration.
In this study, a preliminary static calibration factor for the Tekscan sensor was found using data from
the sine-sweep test. This calibration factor was applied to all tests carried out using the Instron
machine including the verification blind tests. The static calibration factor was calculated by dividing
the average load cell value by the average Tekscan value recorded in the test. A calibration value of
0.0149 was then multiplied by all Tekscan data points to obtain pressure.
4.1.2. Dynamic Calibration
Data recording by the load cell and Tekscan began at slightly different times, therefore the two
datasets needed to be aligned before calculating their transfer functions. Alignment was performed by
identifying the first prominent peak in each set. Fig. 4 shows the data from the load cell and Tekscan
after static calibration and alignment.
Figure 4. Comparing statically calibrated and aligned Tekscan data to Instron load cell data
0 20 40 60 80 100 120 140 160 1800
20
40
60
80
100
120
140
160
180
200
Time (s)
Forc
e (
Lb
s)
Load Cell
Tekscan Calibrated

6
For a sine-sweep load that had content up to approximately 120 Hz, the transfer function between the
Tekscan data and the Instron load cell data (reference) was calculated. An optimum single parameter
curve fit was then established for the transfer function. For this particular case, the best fit was defined
by the function:
[ ( )] (4.1)
where A is a constant, in this case estimated to be 0.1085, X is the frequency input, and Y is the
magnitude output of transfer function.
After identifying an appropriate transfer function between the two data sets, a digital filter was
developed to remediate the problem of amplitude attenuation at higher frequencies for the Tekscan
measurements. Fig. 5 shows the transfer function developed to relate Tekscan and Instron data sets.
Fig. 6 and 7 show the filtered and calibrated (recovered) Tekscan data measurements compared with
the reference load cell readings in frequency and time domains, respectively. The results show
reasonable agreement between the recovered Tekscan and Instron data. The error between the two
recordings in the frequency domain is presented in Fig. 8.
Figure 5. The transfer function relating Tekscan sensor measurements and the Instron load cell recordings
Figure 6. Comparison of the filtered (recovered) Tekscan data with the reference Instron recordings
0 20 40 60 80 100 1200.5
1
1.5
2
Frequency (Hz)
Gain
(d
B)
Frequency Data Points
Curve Fit
0 50 100 150 2000
50
100
150
200
Forc
e (
Lb
s)
Load Cell
Tekscan Calibrated
0 50 100 150 2000
50
100
150
200
Time (s)
Forc
e (
Lb
s)
Load Cell
Tekscan Recovered

7
Figure 7. Comparison of Fourier amplitude spectra of the recovered Tekscan data with Instron recordings
Figure 8. Error in the recovered Tekscan data compared to the reference, Instron recordings
5. VERIFICAITON TESTS
5.1. Blind Tests with Loading Machine
Three blind tests were performed to quantify the ability of the developed filter to accurately recover
the reference signal recorded by the Instron load cell, as detailed in Table 1. The first blind test was a
reverse sine-sweep that began with a frequency of 140 Hz and progressed toward 1 Hz. The second
and third blind tests involved an application of random frequencies and amplitude contents at 100 and
130 lbs of loading offset, respectively. A comparison of the load cell pressure measurements with the
recovered Tekscan data during Blind Tests 2 is shown in Figs. 9.
Table 1. Instron Blind Test sequence specifications
Blind Test Load Offset Signal Amplitude Frequency Content
1 100 lbs 20 lbs Reverse Sin Sweep: 140 to 0.5 Hz
2 100 lbs Random Random
3 130 lbs Random Random
Fig. 10 presents the error in the recovered Tekscan data compared to the reference, Instron recordings
in Blind Test 2. The error in Blind Test 2 was less than approximately 12% for the duration of the test
with an average value of just over 1%. Results for Blind Test 3 were similar to Blind Test 2, because
the same sequence of random frequency and amplitude content was applied at a slightly greater load
offset of 130 pounds.
0 50 100 150 200 250 3000
1
2
3
4
5
6
7
8
9
10x 10
4 Sine-Sweep
Frequency (Hz)
Fou
rier
Am
plit
ude
(lb
s-s
ec)
Tekscan - Calibrated
0 50 100 150 200 250 3000
1
2
3
4
5
6
7
8
9
10x 10
4 Sine-Sweep
Frequency (Hz)
Fou
rier
Am
plit
ude
(lb
s-s
ec)
Load Cell - Calibrated
0 20 40 60 80 100 1200
10
20
30
40
50
60
70
80
90
100Sine-Sweep
Frequency (Hz)
% E
rro
r B
etw
een
Me
asu
rem
en
ts

8
Figure 9. Fourier amplitude comparison between the recovered Tekscan and Instron load cell measurements in
Blind Test 2
Figure 10. Error in the recovered Tekscan data compared to the reference, Instron recordings
In Blind Test 2
5.2. Dynamic Centrifuge Tests
Following the initial validation tests with the Instron machine, the 400 G-ton centrifuge at the
University of Colorado, Boulder with its 1-D shake table were used to test the reliability of Tekscan
pressure sensors at higher frequency ranges not achieved by the Instron machine. Miniature pore
pressure transducers (PPT’s) were expected to measure high frequency dynamic pore water pressures
relatively accurately and were used as reference pressure sensors (Olson et al. 2011). PPT’s and
Tekscan pressure sensors were placed in a transparent Flexible Shear Beam Container (Ghayoomi et
al. 2012) filled with water to compare their measurements. A sequence of ground motions were
applied to the base of the container, ranging from sine-sweeps to random vibrations and broadband
earthquake motions. The testing configuration is shown in Figs. 11 and 12. Figures 13 and 14
compare the recovered Tekscan and PPT pore water pressure measurements during the application of a
representative sinusoidal motion and an earthquake motion, respectively, in both time and frequency
domains. The test results were generally satisfactory in terms of comparisons between the recovered
Tekscan measurements and those of PPTs. However, additional centrifuge experiments are underway
to better quantify the bias and reliability of Tekscan pressure sensors at higher frequency ranges in
parallel with static centrifuge tests to model the intended material interface under increased gravity.
0 50 100 150 200 250 3000
0.5
1
1.5
2
2.5
3
3.5
4
4.5
5x 10
4
Frequency (Hz)
Fou
rier
Am
plit
ude
(lb
s-s
ec)
Blind Test 2 - 100lb Offset
Load Cell - Calibrated
0 50 100 150 200 250 3000
0.5
1
1.5
2
2.5
3
3.5
4
4.5
5x 10
4 Blind Test 2 - 100lb Offset
Frequency (Hz)
Fou
rier
Am
plit
ude
(lb
s-s
ec)
Tekscan - Calibrated
0 5 10 15 20 250
2
4
6
8
10
12
14
16
18
20Blind Test 2 - 100 lb Offset
Time (s)
% E
rro
r B
etw
een
Me
asu
rem
en
ts

9
Figure 11. The schematic of dynamic centrifuge tests with water
Figure 12. Setup for the dynamic centrifuge test
Figure 13. Comparison of the recovered Tekscan and PPT measurements in centrifuge with a representative
sinusoidal input motion at 160 Hz in model scale (2 Hz in prototype scale) – measurements shown in the
prototype scale
6. CONCLUSIONS
The characteristics of a promising Tekscan tactile pressure sensor technology used to measure
dynamic earth pressures in geotechnical earthquake engineering applications was investigated. The
primary goal was to enhance the sensor’s reliability in measuring dynamic loading at higher
frequencies. Sine-sweep loads were applied to the sensor with an Instron loading machine to
characterize and calibrate its dynamic response. The transfer function relating the Tekscan sensor’s
measurements to those of the load cell was calculated, in order to develop a digital filter used to restore
0 1 2 3 4 5 6 7 8 9
3
4
5
6
7
8
9
10
11
12
13
14Sine-Sweep: 120-200 Hz, Prototype Scale, N = 77g
Time (s)
Pre
ssu
re (
psi)
Tekscan - Calibrated (psi)
PPT - Calibrated (psi)
0 1 2 3 4 5 6 7 8 90
50
100
150
200
250
300
350
400
Frequency (Hz)
Fou
rier
Am
plit
ude
Sine-Sweep: 120-200 Hz, Prototype Scale, N = 77g
Tekscan - Calibrated
PPT - Calibrated
PPTs Tekscan Sensor

10
amplitude degradations. To test the performance of the filter, blind tests were performed with the
Instron machine in addition to a series of dynamic centrifuge tests with water. It was shown that the
digital filter significantly enhanced the ability of Tekscan sensors to more reliably measure dynamic
pressures by better representing the amplitude content of the signal across a range of frequencies.
Although additional tests are under way to better quantify the reliability of these sensors, the proposed
testing methodology appears to be promising for dynamic centrifuge tests with high frequency ranges.
Figure 14. Comparison of recovered Tekscan and PPT measurements in centrifuge with a representative
earthquake input motion – measurements shown in the prototype scale
ACKNOWLEDGMENT
This material is based upon work supported by the National Science Foundation under Grant no. 1134968. The
authors would also like to acknowledge the contributions of Doug Majerus at Tekscan, Inc. in the planning of
dynamic Instron tests and his assistance in the development of a Tekscan sensor filter.
REFERENCES
Al Atik, L. F., 2008. Experimental and Analytical Evaluation of Seismic Earth Pressures on Cantilever
Retaining Structures. Ph. D. University of California, Berkeley.
Ashruf, C.M.A., 2002. Thin flexible pressure sensors, Sensor Review. 22:4, 322-327
Ghayoomi, M., Dashti, S., McCartney, J.S. (2012). Design and Construction of a Transparent Flexible-Shear-
Beam Container for Dynamic Geotechnical Centrifuge Testing. Proceedings of the 2nd International
Conference on Performance-Based Design Earthquake Geotechnical Engineering, Taormina, Italy
Nater P., Laue J., Springman S. (2001). Physical modeling of shallow foundations on homogeneous and layered
soils, XV International Conf. on Soil Mechanics and Geotechnical Engineering. Vol. 1: 755 - 760.
Olson, S.M., Hashash, Y., Polito, C., Phillips, C., Muszynski, M. (2011). Measuring Pressures in the
Geotechnical Centrifuge using Tactile Pressure Pads, 7th Annual NEES Centrifuge Research and Training
Workshop Rensselaer Polytechnic Institute. PowerPoint presentation.
Palmer, M.C., O’Rourke, T.D., Olson, N.A., Abdoun, T., Ha, D., O’Rourke, M.J. (2009). Tactile Pressure
Sensors for Soil-Structure Interaction Assessment. Journal of Geotechnical and Geoenvironmental
Engineering, ASCE Vol. November: 1638-1645
Paikowsky S.G., Hajduk E. L. (1997). Calibration and use of grid based tactile pressure sensors in granular
material, Geotechnical Testing Journal, Vol. 20: 218-241.
Paikowsky, S.G., Parmer, C.J., Rolwes, L.E., (2006). The Use of Tactile Sensor Technology for Measuring Soil
Stress Distribution, GeoCongress 2006–Geotechnical Engineering in the Information Technology Age.
Sitar, N., Mikola, R.G., Candia, G., (2012). Seismically Induced Lateral Earth Pressures on Retaining Structures
and Basement Walls, Geotechnical Engineering State of the Art and Practice Keynote Lectures from
GeoCongress 2012, Geotechnical Special Publication No. 226 ASCE
Springman S. M., Nater P., Chikatamarla R., Laue J. (2002). Use of flexible tactile pressure sensors in
geotechnical centrifuges, Proc. of the Int. Conference of Physical Modelling in Geotechnical Engineering,
113-118.
Tekscan, Inc. (2011). I-Scan & High-Speed I-Scan User Manual v. 6.2x, Tekscan Inc., Boston, Mass.
Tessari, A., Sasanakul, I., Abdoun, T. (2010). Advanced sensing in geotechnical centrifuge models. 7th
International Conference on Physical Modelling in Geotechnics, 395-400.
0 2 4 6 8 10 125
5.5
6
6.5
7
7.5
8
8.5
9
9.5
10
10.5Northridge, Prototype Scale, N = 77g
Time (s)
Pre
ssu
re (
psi)
Tekscan - Calibrated (psi)
PPT - Calibrated (psi)
0 1 2 3 4 5 6 7 8 90
50
100
150
200
250
300
350
400
Frequency (Hz)
Fou
rier
Am
plit
ude
Northridge, Prototype Scale, N = 77g
Tekscan - Calibrated
PPT - Calibrated