sensing remote volcanoes : feature articles · pdf filewhere kavachi should be,” said...
TRANSCRIPT
Home Images Global Maps Features News & Notes Search
In October 2001, a sleeping volcano in the remote South
Sandwich Islands began spewing ash and lava from itssummit. It was Mount Belinda’s first eruption inrecorded history. Less than 24 hours after the eruptionbegan, a research team based nearly 9,000 miles awayat the University of Hawaii was already estimating howmuch energy was pouring out of the volcano.
That the researchers were making calculations so soonafter the start of Mount Belinda’s eruption isremarkable, considering the volcano’s remote location.The South Sandwich Islands are situated between thesouthern tip of South America and mainland Antarctica,one of the most isolated areas of volcanic activity onEarth.
More than 1,500 potentially active volcanoes dot theEarth’s landscape, of which approximately 500 areactive at any given time. Although scientists keep watchover many of the Earth’s volcanoes using traditionalground observation methods, satellite-based remotesensing is quickly becoming a crucial tool forunderstanding where, when, and why the Earth’svolcanoes periodically boil over.
Satellite technology now makes it possible to monitorvolcanic activity in even the most isolated corners of theglobe, and to routinely observe changes in the Earth’ssurface that may signal an impending eruption. Inaddition, remote sensing data offer scientists the chanceto prevent catastrophic damage to life and property bydetermining how and where volcanic debris spreadsafter an eruption.
“Hot Spots” Around the Globe
Just 10 years ago, Mount Belinda’s eruption might nothave been detected for weeks or even months.“Normally, this remote volcano would have goneunmonitored,” said Rob Wright, research scientist at theHawaii Institute of Geophysics and Planetology (HIGP).“However, when our system detected hot spots onMontagu Island, we decided to take a closer look.Inspection of high-resolution satellite imageryconfirmed that the hot spots were indeed the result ofvolcanic activity.”
The “system” Wright refers to is the MODIS ThermalAlert System, known as MODVOLC, which now enablesscientists to detect volcanic activity anywhere in theworld within hours of its occurrence. MODVOLC usesdata acquired by the Moderate Resolution ImagingSpectroradiometer (MODIS) sensors, which fly aboardNASA’s Terra and Aqua satellites. “The algorithm we’vedeveloped scans each 1-kilometer pixel within everyMODIS image to see if it contains high-temperatureheat sources, or hot spots. These heat sources may beactive lava flows, lava domes, or lava lakes. Since
July 13, 2004
Sensing Remote Volcanoes : Feature Articles http://earthobservatory.nasa.gov/Features/monvoc/printall.php
1 of 8 3/18/13 1:08 PM
MODIS achieves complete global coverage every 48hours, this means that our system checks every squarekilometer of the globe for volcanic activity once everytwo days,” said Wright.
For each hot spot identified, MODVOLC records thedate and time at which it was observed, its geographiccoordinates, the position of the satellite and the Sun,and the spectral radiance (the amount of energy emittedby the Earth’s surface at various wavelengths in theelectromagnetic spectrum). Since active lava flows orgrowing lava domes emit vast amounts of energy, thesehot spots are relatively easy to detect in MODISimagery, even when they are smaller than MODIS’1-kilometer resolution. “The lava lake at Mount Erebusin Antarctica is only about 10 meters in diameter, butit’s clearly identifiable in MODIS images and, therefore,by our monitoring system,” said Wright.
One potential problem with a near-daily monitoringsystem like MODVOLC is the large volume of datagenerated. “If you want to study large regions at hightemporal resolution, you’ll have to download a hugeamount of MODIS data to get the job done,” saidWright. The problem was overcome, however, byoperating MODVOLC via NASA’s Goddard Space FlightCenter (GSFC) Earth Sciences (GES) DAAC. “Runningthe algorithm at the GES DAAC basically allows us torapidly compress large amounts of image data into ahandful of text files that include the details of only thepixels containing hot spots. As a result, we can monitorthe entire globe in near-real time,” said Wright.
The information that MODVOLC records at the GESDAAC is then sent electronically to HIGP, located at theUniversity of Hawaii on the island of Oahu, where theresults are displayed on the system’s web site. “If you goto the web site, you can see all of the hot spots detectedduring the previous 24-hour period,” said Wright. “Ittakes about 8 hours from the time MODIS images theerupting volcano to the time the eruption is reported onthe web site.”
The web site also allows users to click on any area of theglobe and “zoom in” on individual eruptions or makecomparisons between two erupting volcanoes. “You cancompare, for example, the behavior of the lava dome atSoufriere Hills Volcano on the island of Montserrat withthe behavior of the dome at Colima Volcano in Mexico,”said Wright.
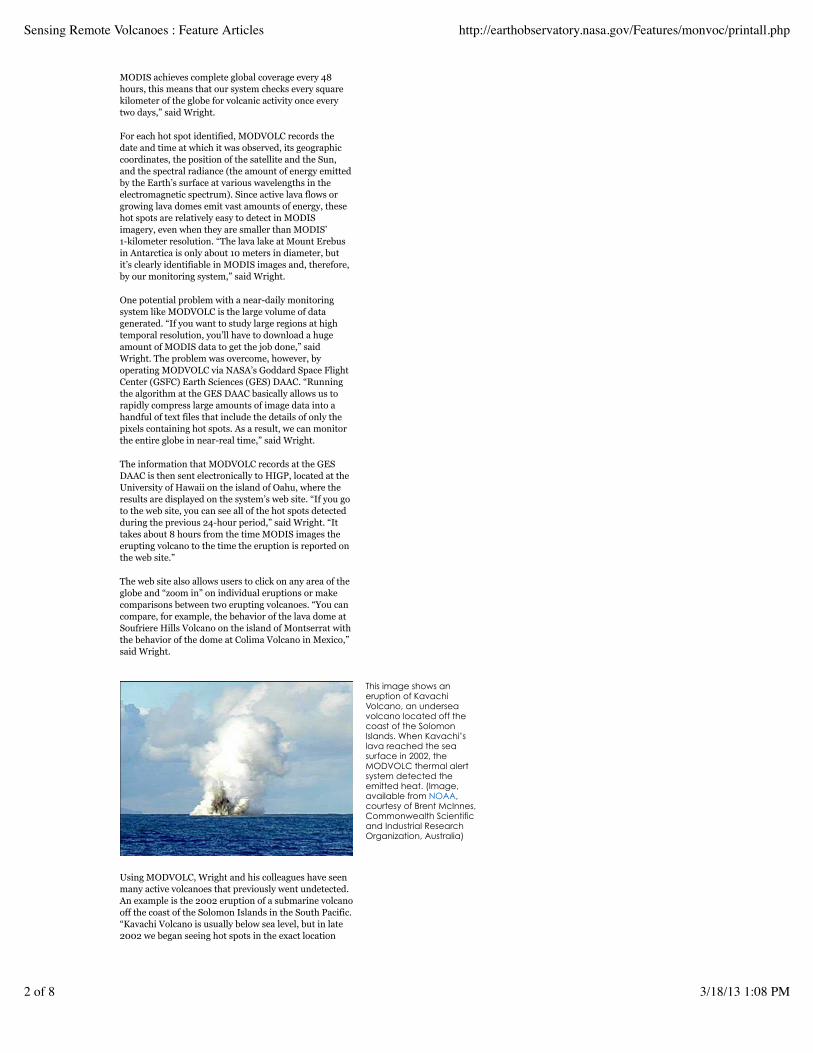
Using MODVOLC, Wright and his colleagues have seenmany active volcanoes that previously went undetected.An example is the 2002 eruption of a submarine volcanooff the coast of the Solomon Islands in the South Pacific.“Kavachi Volcano is usually below sea level, but in late2002 we began seeing hot spots in the exact location
This image shows aneruption of KavachiVolcano, an underseavolcano located off thecoast of the SolomonIslands. When Kavachi’slava reached the seasurface in 2002, theMODVOLC thermal alertsystem detected theemitted heat. (Image,available from NOAA,courtesy of Brent McInnes,Commonwealth Scientificand Industrial ResearchOrganization, Australia)
Sensing Remote Volcanoes : Feature Articles http://earthobservatory.nasa.gov/Features/monvoc/printall.php
2 of 8 3/18/13 1:08 PM
where Kavachi should be,” said Wright. “It turned outthat erupting lava caused the volcano to grow so that itssummit reached just above sea level, and when itpopped its head above the waves, our system detectedthe emitted heat.”
Wright’s team also detected the first recorded activity atAnatahan Volcano in the Mariana Islands in 2003. “Thisvolcano has no recorded eruption history and is locatedin an isolated part of the world. It’s not the sort ofvolcano you would choose to monitor,” said Wright.“However, we have in effect been monitoring it sinceSeptember, 2000.” In May 2003, an explosive eruptionat Anatahan began, accompanied by the growth of a lavadome. “MODVOLC detected the eruption andpinpointed exactly where on the island it was occurring,”Wright added.
Signs of an Impending Eruption
Signs of an Impending Eruption
Because of the near-daily global coverage, MODIS dataare ideal for quickly providing researchers withinformation about new eruptions. Other types ofsatellite data, such as Synthetic Aperture Radar (SAR),are better suited to looking at the geologic changes thatoften precede an eruption. Although these data don’t yetprovide the quick turnaround time required fordetecting new activity, they instead provide the spatialcoverage necessary for scientists to see how the groundsurface is deforming over a broad region.
Surface changes were key to understanding a majorvolcanic eruption in 2002. Mount Nyiragongo, locatedin the Democratic Republic of the Congo, is one ofAfrica’s most active volcanoes. During an eruptive phasein 1994, a lava lake formed in the volcano’s summitcrater. Lava lakes consist of large volumes of moltenlava contained within a vent, crater, or broaddepression. After its lava lake formed, Nyiragongocalmed down for about eight years. Then, on January 17,2002, a major eruption occurred—with little warning.
Lack of warning at Nyiragongo has grave implications:the city of Goma sits about 9 miles (15 kilometers) southof the volcano. “About 500,000 people live in Goma andits immediate vicinity,” said Michael Poland,geophysicist at Cascades Volcano Observatory inVancouver, Washington. “Nyiragongo has a reputationfor spawning pretty nasty lava flows. The potentialhazard to human life there is significant.”
Ground data are not easy to come by in the region ofNyiragongo. “It’s a dangerous place for field research,”said Poland. “There’s the Ebola virus and an ongoingcivil war. Top that off with an erupting volcano, and youhave a pretty volatile situation for a field researcher.”
Add to those dangers the region’s lack of technology,and it’s no surprise that Nyiragongo has littlemonitoring history. “Collecting and recovering data inthe Congo is made more difficult because there areproblems with equipment being stolen,” Poland added.“So in addition to putting monitoring equipment inplace, you have to hire three or four people to guard it. Itgets to be quite costly.”
Despite the lack of ground data, Poland learned of someanecdotal evidence of deformation from Congoleseresearchers. “The local townspeople typically wash theirclothes in Lake Kivu, which is located adjacent to Goma.One day, they noticed that the rocks they normally usedto dry their clothes on the shoreline were actually under
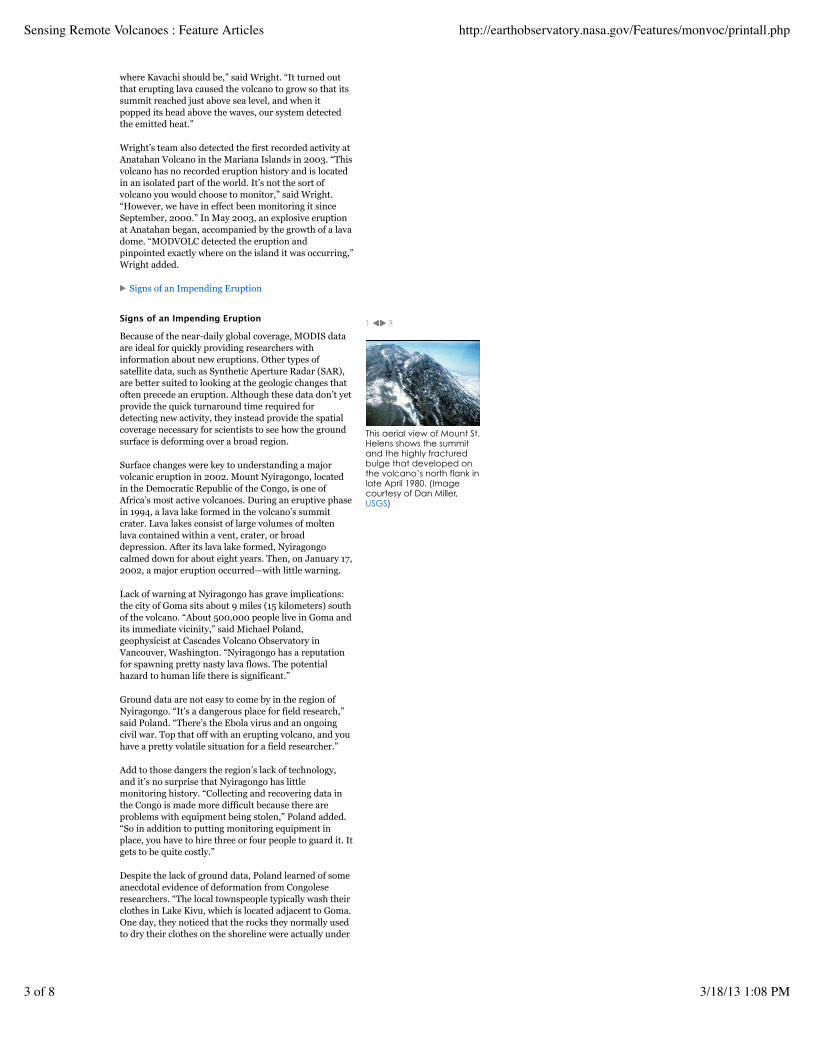
This aerial view of Mount St.Helens shows the summitand the highly fracturedbulge that developed onthe volcano’s north flank inlate April 1980. (Imagecourtesy of Dan Miller,USGS)
Sensing Remote Volcanoes : Feature Articles http://earthobservatory.nasa.gov/Features/monvoc/printall.php
3 of 8 3/18/13 1:08 PM
water, so the lake level had come up—indicatingsubsidence,” said Poland. Measurements of the lakelevel before and after the eruption later confirmed thisevidence.
Poland recognized the 2002 Nyiragongo event as anopportunity to use SAR satellite imagery to analyze howthe eruption deformed the ground on and around thevolcano. Ground deformation refers to surface changeson a volcano, such as subsidence (sinking), tilting, orbulge formation, due to the movement of magma belowthe surface. Deformation changes at a volcano, such asthose related to magnitude or location, may indicate thatan eruption is about to occur. An example of visibledeformation occurred in 1980 when a bulge appeared onthe north flank of Mount St. Helens prior to its May 18eruption. Scientists estimated that just before theeruption, the bulge was growing at a rate of 5 feet (1.5meters) per day.
To determine whether deformation preceded the
Nyiragongo eruption, Poland requested SAR data fromthe Alaska Satellite Facility Distributed Active ArchiveCenter (ASF DAAC). SAR interferometry, or InSAR, isone of the few methods available for remotely analyzingground deformation that accompanies or precedesvolcanic activity. The technique operates on the premisethat if the radar signal reflected back to the sensordiffers between two images of the same object, taken attwo different times, then the object has moved orchanged.
“It was obvious that an eruption at Nyiragongo hadoccurred, but the extent and cause of the activity wereunclear. Without InSAR, we wouldn’t have learnedmuch about this particular event,” said Poland. “Thesatellite imagery gave us some clues to what happenedin a location where surface-based measurements arescarce.”
Poland’s study showed that significant deformationacross the entire rift valley occurred at the time of theeruption. “Based on the data, we determined that all thedeformation happened somewhere between 3 daysbefore to about 15 days after the eruption,” he said.“This means there was no long-term deformationwarning, which is interesting because typically withvolcanoes, you see inflation or uplift that precedes theeruption by weeks, months, or even years.”
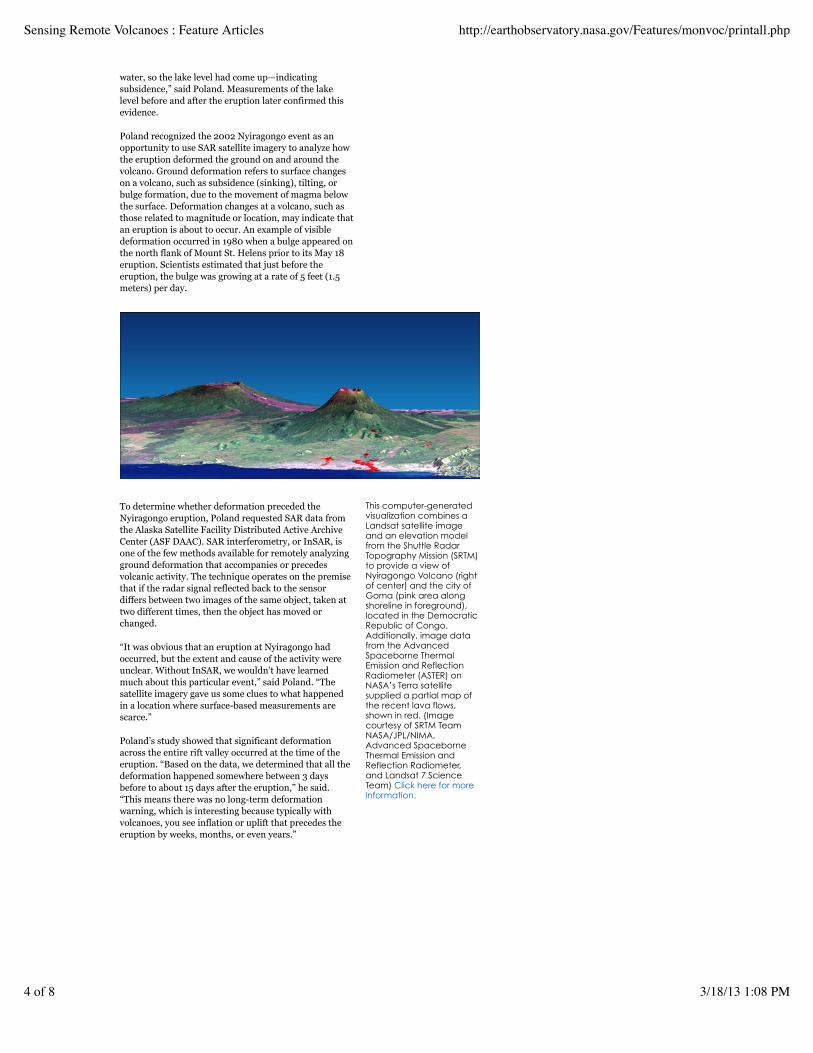
This computer-generatedvisualization combines aLandsat satellite imageand an elevation modelfrom the Shuttle RadarTopography Mission (SRTM)to provide a view ofNyiragongo Volcano (rightof center) and the city ofGoma (pink area alongshoreline in foreground),located in the DemocraticRepublic of Congo.Additionally, image datafrom the AdvancedSpaceborne ThermalEmission and ReflectionRadiometer (ASTER) onNASA’s Terra satellitesupplied a partial map ofthe recent lava flows,shown in red. (Imagecourtesy of SRTM TeamNASA/JPL/NIMA,Advanced SpaceborneThermal Emission andReflection Radiometer,and Landsat 7 ScienceTeam) Click here for moreinformation.
Sensing Remote Volcanoes : Feature Articles http://earthobservatory.nasa.gov/Features/monvoc/printall.php
4 of 8 3/18/13 1:08 PM
Poland explained that an earlier Nyiragongo eruption, in
1977, formed a fracture system that led partway down tothe city of Goma. “Then, during the 2002 eruption, thatfracture system was reactivated, and the flowing magmapropagated the fractures closer to the city. The lavaactually flowed right down Main Street—right throughthe business district,” he said.
According to Poland, seeing deformation across theentire rift zone suggests that the Nyiragongo eruptionwas no small event; it was a major tectonic episode. “Webelieve there must have been a large event that allowedmagma stored high in the volcano to drain into the oldfracture system and head downhill,” he said. “Theimplication is that you can have a lot of lava come out ina very bad place—like right above your city—with verylittle warning.”
Twice in the past 30 years, Nyiragongo’s lava flowedalong the fracture system on the south flank, and thisflow path leads right to Goma. “If we can start usingInSAR data to monitor deformation, we might be able tobetter assess the likelihood of eruption events beforethey happen,” Poland said.
Tracking Ash Clouds Sensing Remote Volcanoes
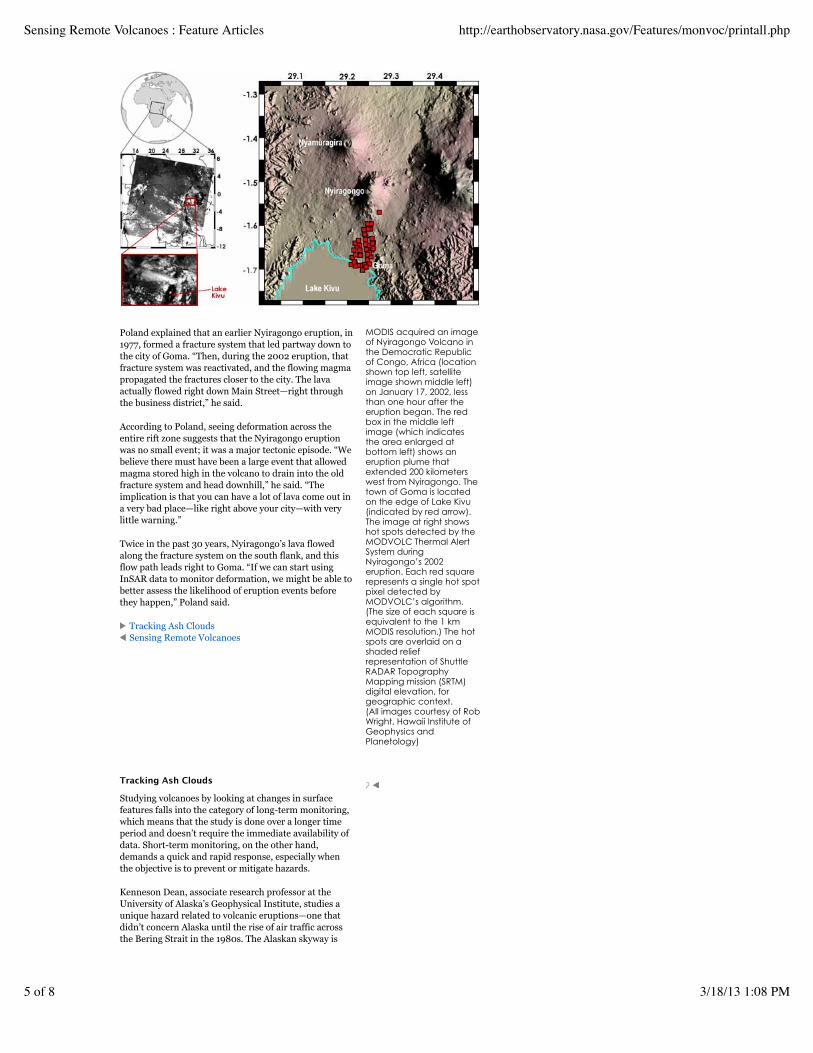
MODIS acquired an imageof Nyiragongo Volcano inthe Democratic Republicof Congo, Africa (locationshown top left, satelliteimage shown middle left)on January 17, 2002, lessthan one hour after theeruption began. The redbox in the middle leftimage (which indicatesthe area enlarged atbottom left) shows aneruption plume thatextended 200 kilometerswest from Nyiragongo. Thetown of Goma is locatedon the edge of Lake Kivu(indicated by red arrow).The image at right showshot spots detected by theMODVOLC Thermal AlertSystem duringNyiragongo’s 2002eruption. Each red squarerepresents a single hot spotpixel detected byMODVOLC’s algorithm.(The size of each square isequivalent to the 1 kmMODIS resolution.) The hotspots are overlaid on ashaded reliefrepresentation of ShuttleRADAR TopographyMapping mission (SRTM)digital elevation, forgeographic context.(All images courtesy of RobWright, Hawaii Institute ofGeophysics andPlanetology)
Tracking Ash Clouds
Studying volcanoes by looking at changes in surfacefeatures falls into the category of long-term monitoring,which means that the study is done over a longer timeperiod and doesn’t require the immediate availability ofdata. Short-term monitoring, on the other hand,demands a quick and rapid response, especially whenthe objective is to prevent or mitigate hazards.
Kenneson Dean, associate research professor at theUniversity of Alaska’s Geophysical Institute, studies aunique hazard related to volcanic eruptions—one thatdidn’t concern Alaska until the rise of air traffic acrossthe Bering Strait in the 1980s. The Alaskan skyway is
Sensing Remote Volcanoes : Feature Articles http://earthobservatory.nasa.gov/Features/monvoc/printall.php
5 of 8 3/18/13 1:08 PM
one of the busiest air traffic areas in the world and,according to Dean, sometimes resembles a Los Angelesfreeway. The skyway also runs along the northernboundary of the “Ring of Fire,” a zone of frequentearthquakes and volcanic eruptions that encircles thePacific.
“Large-body jets fly across this region carrying about2,000 passengers and $1 billion in cargo daily,” saidDean, who heads the satellite monitoring program at theAlaska Volcanoes Observatory (AVO) at the Universityof Alaska. “If a plane is flying towards an ash cloud, andthe cloud is moving towards the plane, they will crosspaths very quickly. Even if the cloud is not movingtowards the plane, an aircraft still needs plenty of timeto adjust its course and avoid the cloud.”
Jet engines operate at a temperature that melts volcanicash or glass, and this melted material can then cause theengines to slow and shut down. “The problem in thisarea is that the eruptions tend to be explosive. They ejectvolcanic material, gas, and ash well into the atmosphere,and many of these eruptions rise to 40,000 feet (about12,000 meters) in height, which is the height of jet airtraffic,” said Dean. “A lot of people and property are atrisk.”
The AVO uses satellite data for short-term monitoring,
which means that data are received, processed, andanalyzed just minutes after a satellite pass. “The regionwe monitor covers several thousand kilometers andincludes about 40 volcanoes in Alaska and about 60 inthe Kamchatka Peninsula, Russia,” Dean said. “We getthe data directly from the MODIS and Advanced VeryHigh Resolution Radiometer (AVHRR) sensors, and weanalyze those data routinely every morning andafternoon.”
In 1993, the University of Alaska’s Geophysical Institutereceived a NASA grant to purchase its own AVHRRreceiving station and, in 2001, a MODIS receivingstation. Prior to having its own station, AVO used aDomestic Communications Satellite station at theUniversity of Miami to collect the data and then sendthem electronically to Fairbanks for analysis. “Havingour own stations on site reduced monitoring time from 1hour to about 10 minutes,” said Dean. And minutes areimportant when you consider the hazard faced byaircraft that encounter ash clouds.
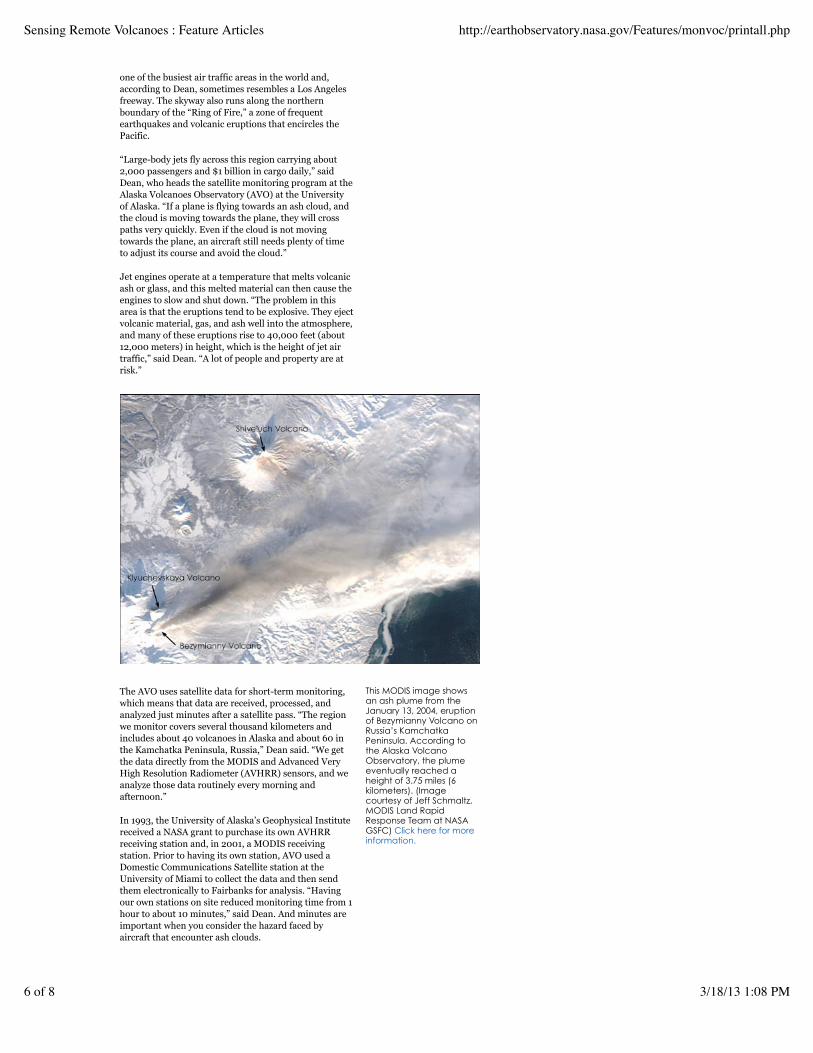
This MODIS image showsan ash plume from theJanuary 13, 2004, eruptionof Bezymianny Volcano onRussia’s KamchatkaPeninsula. According tothe Alaska VolcanoObservatory, the plumeeventually reached aheight of 3.75 miles (6kilometers). (Imagecourtesy of Jeff Schmaltz,MODIS Land RapidResponse Team at NASAGSFC) Click here for moreinformation.
Sensing Remote Volcanoes : Feature Articles http://earthobservatory.nasa.gov/Features/monvoc/printall.php
6 of 8 3/18/13 1:08 PM
In 1982, a British Airways Boeing 747 carrying 240passengers flew into an ash cloud near Indonesia’sGalunggung Volcano. All four of the aircraft’s enginesshut down, nearly forcing the aircraft to ditch in theIndian Ocean. In 1989, a KLM 747 encountered an ashcloud over Talkeetna, Alaska. Again, all four enginesfailed and the jet descended to within a few thousandfeet of the mountaintops before pilots were able torestart one of the plane’s engines and make anemergency landing in Anchorage.
Between 1980 and 1999, more than 100 jet airlinerssustained some damage after flying through volcanic ashclouds, according to the U.S. Geological Survey (USGS).“Aviation safety is one big reason we need to monitoractive volcanoes in Alaska,” said Dean. “Right now we’reseeing hot spots almost daily at Shiveluch, Kliuchevskoi,and Bezymianny Volcanoes. When an explosive eruptionoccurs, you need an information turnaround time that’sreally fine-tuned, so that aircraft pilots have time tomake decisions about whether to continue on theirroute, turn around, or change routes,” said Dean.“Available fuel becomes a critical issue, too.”
AVO’s short-term monitoring program is obviouslymaking a difference. “When an eruption occurs and thewarnings go out, the airline industry often contacts usdirectly,” said Dean. “We also follow Federal AviationAdministration reports, which reveal that aircraft aresometimes re-routed or even returned to their homeport if the situation is bad,” said Dean.
Not all eruptions are explosive, like those that tend tooccur in the Alaska region. Some volcanoes, such asthose in the Hawaiian Islands, are known for more quietflows of fluid lava. Although Hawaiian eruptions usuallydo not result in loss of life, they can have devastatingeffects on land and property.
Kilauea Volcano, on the island of Hawaii, is the mostactive volcano on Earth. During the past 1,000 years,more than 90 percent of the volcano’s surface has beencovered by lava flows. Between 1983 and 1991, lava flowsrepeatedly struck communities located on the east coastof Hawaii. In 1990, flows covered the village ofKalapana, destroying more than 180 homes, a visitorcenter in Hawaii Volcanoes National Park, and historicaland archaeological sites, according to the USGS.
“Hawaii volcanoes are known for long-term eruptions,wherein you have a small amount of gas emitted year inand year out for decades,” said Peter Mouginis-Mark,research scientist and current acting director at HIGP.Mouginis-Mark heads a HIGP-based program calledHawaii Synergy, a cooperative effort to provide disastermanagement organizations and federal hazard agencies
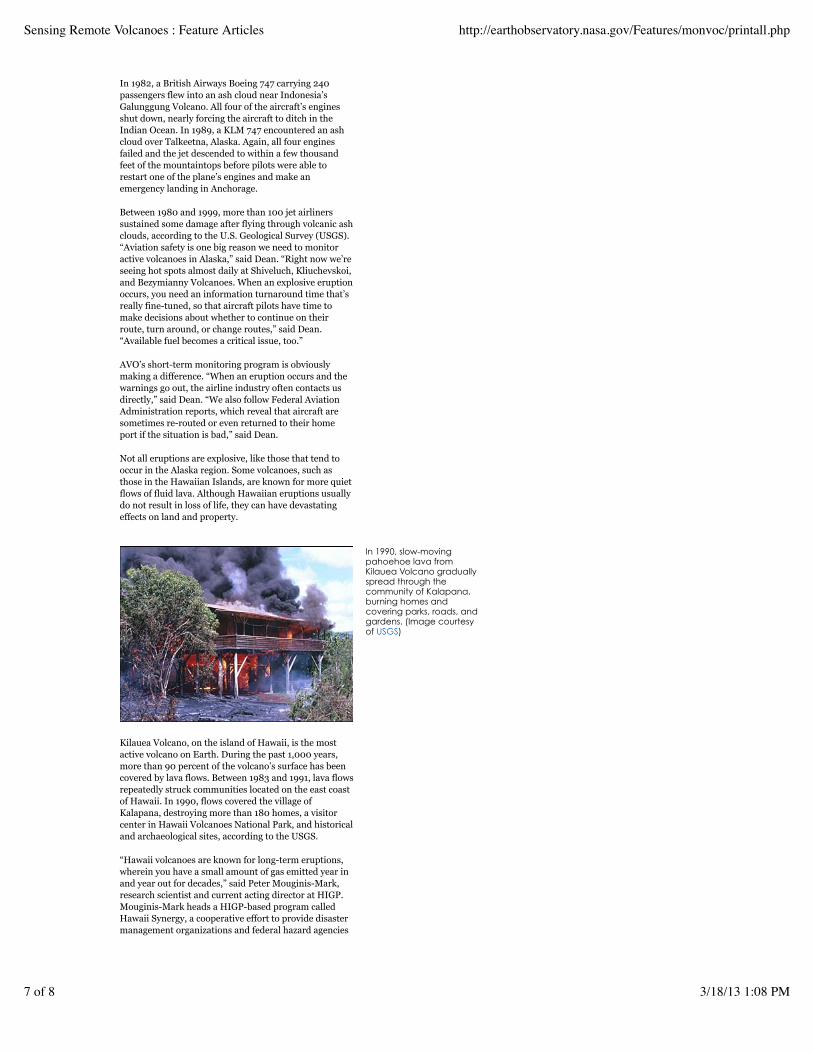
In 1990, slow-movingpahoehoe lava fromKilauea Volcano graduallyspread through thecommunity of Kalapana,burning homes andcovering parks, roads, andgardens. (Image courtesyof USGS)
Sensing Remote Volcanoes : Feature Articles http://earthobservatory.nasa.gov/Features/monvoc/printall.php
7 of 8 3/18/13 1:08 PM
Feeds Contact Us About the Earth Observatory Image Use Policy Privacy Policy & Important Notices
The Earth Observatory is part of the EOS Project Science Office located at NASA Goddard Space Flight Centerwebmaster: Paul Przyborski | NASA official: Warren Wiscombe
with access to current satellite data, including imageryfrom Landsat 7 and the Advanced Spaceborne ThermalEmission and Reflection Radiometer (ASTER), archivedat the Land Processes Distributed Active Archive Center(LP DAAC).
According to Mouginis-Mark, perhaps the greatestbenefit offered by satellite-monitoring technology willbe an enhanced understanding of exactly how volcanoeswork. “What’s important is the global perspective andthe way volcanoes work on different timescales,” he said.“Some volcanoes produce lava flows, and othervolcanoes explode so that you have to worry about bigeruption columns. We now have this remote capabilityto study volcanoes anywhere in the world.”
Although scientists will continue to use ground-
monitoring techniques to keep an eye on the Earth’svolcanoes, satellite data will increasingly allow scientiststo see “the big picture” and, as a result, better predictvolcanic activity.
“Satellite data are brilliant for understanding the levelsof eruption intensity and for monitoring the impact aneruption is having on the surrounding environment,”said Mouginis-Mark. “The ability to draw on ASTER orMODIS data and put together a one- to three-yearsequence of observations really lets us look at whetherthere are real changes going on in a volcano.”
“Compiling a global database of volcanic thermal unresthas allowed us to look at long-term trends,” said Wright.“We’re currently analyzing the entire MODVOLC dataset to identify patterns that help us better understandhow all the Earth’s volcanoes behave.”
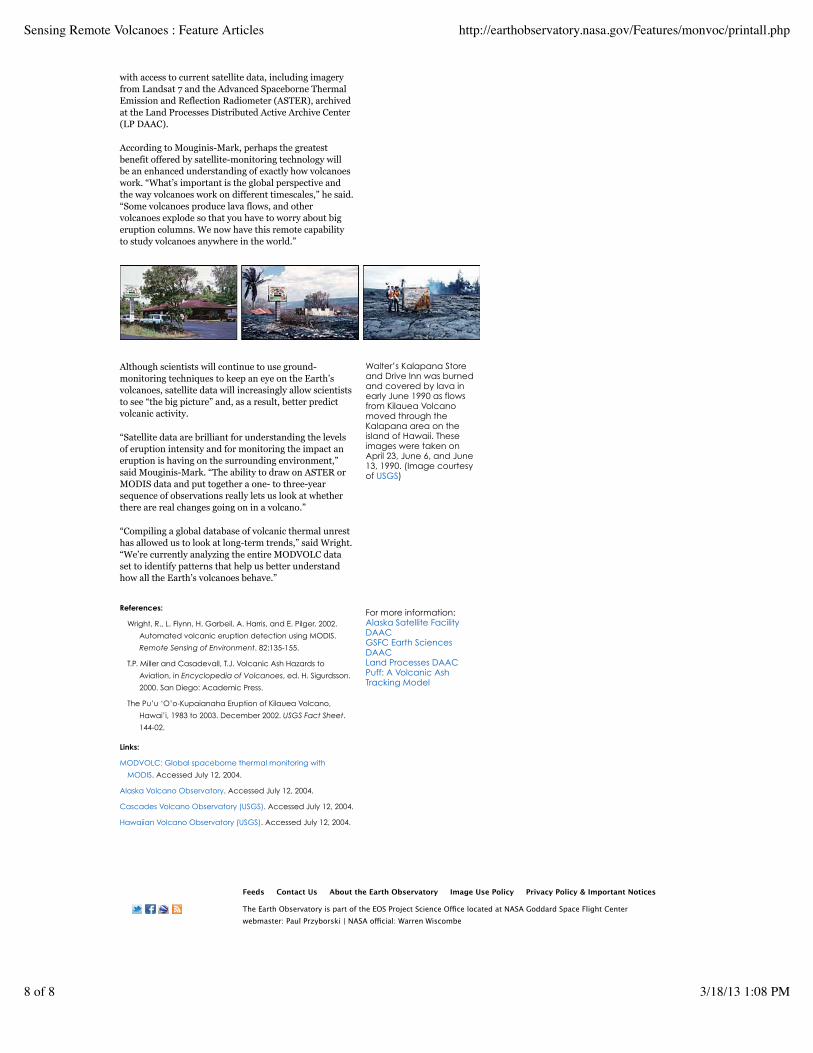
Walter’s Kalapana Storeand Drive Inn was burnedand covered by lava inearly June 1990 as flowsfrom Kilauea Volcanomoved through theKalapana area on theisland of Hawaii. Theseimages were taken onApril 23, June 6, and June13, 1990. (Image courtesyof USGS)
References:
Wright, R., L. Flynn, H. Garbeil, A. Harris, and E. Pilger. 2002.
Automated volcanic eruption detection using MODIS.
Remote Sensing of Environment. 82:135-155.
T.P. Miller and Casadevall, T.J. Volcanic Ash Hazards to
Aviation, in Encyclopedia of Volcanoes, ed. H. Sigurdsson.
2000. San Diego: Academic Press.
The Pu’u ‘O’o-Kupaianaha Eruption of Kilauea Volcano,
Hawai’i, 1983 to 2003. December 2002. USGS Fact Sheet.
144-02.
Links:
MODVOLC: Global spaceborne thermal monitoring with
MODIS. Accessed July 12, 2004.
Alaska Volcano Observatory. Accessed July 12, 2004.
Cascades Volcano Observatory (USGS). Accessed July 12, 2004.
Hawaiian Volcano Observatory (USGS). Accessed July 12, 2004.
For more information:Alaska Satellite FacilityDAACGSFC Earth SciencesDAACLand Processes DAACPuff: A Volcanic AshTracking Model
Sensing Remote Volcanoes : Feature Articles http://earthobservatory.nasa.gov/Features/monvoc/printall.php
8 of 8 3/18/13 1:08 PM