sensitivity analysis of fmea as possible ranking … · sensitivity analysis of fmea as possible...
TRANSCRIPT

U.P.B. Sci. Bull., Series D, Vol. 80, Iss. 3, 2018 ISSN 1454-2358
SENSITIVITY ANALYSIS OF FMEA AS POSSIBLE RANKING
METHOD IN RISK PRIORITIZATION
Gábor VÁNYI1, László POKORÁDI2
The Failure Mode and Effect Analysis (FMEA) has spread in wide range of
engineering. This means, today it is present in manufacturing and development of
engineering systems such as vehicles, health care or food industry, etc. Although,
the earliest focus was on the mechanical components, today electronic elements and
software components must be included, due to the increase of system complexity.
This change underlines the fact that complexity and size of these systems results in a
reduced transparency and meaning of similar Risk Priority Numbers (RPN).
Therefore an obvious and simple overview should support analysts in finding
critical points of an entire system. This kind of method should not require additional
and long term work packages, but should rely on raw values of FMEA. As a result,
this method will support the identification of sensitive parts within an entire system,
pointing out the meaning of critical content behind.
Keywords: FMEA, risk analysis, sensitivity analysis, risk prioritization.
1. Introduction
The Since the U.S. Military Forces standard document (MIL-P-1629)
described the procedures for performing a Failure Mode, Effects and Criticality
Analysis (FMECA) in 1949 [1]. The FMEA has been developed from this
standard, which is a qualitative analyzing tool with highly structured, systematic
technique in system modeling, facilitating reliability and risk evaluation [2]. This
analysis can be done on separated worksheets and component levels, performing
disciplinary risk modeling evaluation. However, the modeling and evaluation set
up in a large, multidisciplinary team which is led by one moderator – can have
unique scheduling (even in one project) and be individual because of human
factors. Incompatibility and interconnection problems between worksheets can
occur usually, due to the fact of different requirements, scheduling and
understanding of disciplines in modeling. For this reason, interfaces should be
declared between levels and disciplines. But how will the whole system look like
in hardware, software and mechanical designs is another point. For an easier
understanding, Carlson suggests the use of boundary diagram or block diagram
1 PhD student, Óbuda University, Doctoral School on Safety and Security Sciences, Hungary,
[email protected] 2 Professor, Óbuda University, Institute of Mechatronics and Vehicle Engineering, Hungary,

166 Gábor Ványi, László Pokorádi
[3] [4]. As a matter of fact usually these diagrams help starting discussions within
the core team, but structuring and interconnecting hardware and software
functions formulate a common analysis together. This still might not be an easy
task, due to the fact that interdisciplinary knowledge, hard questions in software
field – such as what should be presented for function and how can be a
malfunctioning effect on the whole system. These are all leading to time
consuming discussions and endless speculations with a demotivating atmosphere
together with a high probability of missed failures or even a function itself. It can
be reduced, if preconditions of disciplines are prepared, concerning a common
understanding of structuring and meaning of function [5].
Sensitivity analysis can be performed to examine different reactions of
the model by black box technique. The inputs must be known or determined, but
output will be calculated according to the definition of input attributes [6]. This
analysis can be performed to find sensitive or critical factors and elements of the
system. These are identified easier in the system and can be very objective. It is
also used in economy as well as in engineering. Well known events and effect of
known failures can be simulated, also examined of unknown stochastic events [7].
Two modelling approaches are possible [8]: Deterministic and
prognostic, while equations of the model are very accurate and enough to describe
it. It means no extra declaration of physical or chemical, etc. law or rule is needed.
Data driven or law driven, while the behavior of the model must be extended with
additional law or data set to describe it.
Rest of the examination simulated and evaluated by Monte Carlo
simulation. Pokorádi published a matrix-algebraic method for sensitivity analysis
[9]. This easy algorithmic calculation is used to investigate software failure and
shown by Pareto analysis [10]. There are two matrices, where one stands for
independent variables (matrix mmA ) another for system state depending
variables (matrix nmB ). The final outcome is a graph, which is generated by
a calculation of these two matrices determination and inversion as line vector.
These elements are transformed to a Pareto analysis, where probability of failures
are ranked one-by-one.
This article will briefly introduce a hierarchically modelled system, then
a risk assessment of multiple levels of FMEA focusing on seriousness. The other
aim of this paper is to develop a new sensitivity analysis of an entire system
FMEA.
The outline of this paper is the following: Paragraph 2 introduces multiple-
level evaluation of FMEA worksheets. Paragraph 3 presents the proposed
sensitivity analysis method of FMEA. Finally, the Authors summarize their work
in Chapter 4.

Sensitivity analysis of FMEA as possible ranking method in risk prioritization 167
2. Structuring FMEAs hierarchically
Building up FMEA worksheets in a hierarchical structure is not a new
idea, but the implementation is solved individually. The main meaning of
hierarchy is coming from the different levels of analysis - such as system, design
or process (as built on one to another) [11]. The ‘data connection’ builds up
through the logical connections of effect, function or cause content in the
background presented in Severity (S), Occurrence (O) and Detection (D) values.
For better understanding, example of a Wheel Speed Sensor (WSS) will be shown
by Figure 1. This sensor is a part of the Anti-Block System (ABS) in the vehicles.
The WSS detects the status of the given tire. It is build up by two main
components. The magnetic sensor provides periodical signal according to the
rotation speed of the cog-wheel-plate, which is fixed on each tire of the vehicle.
Fig. 1. Wheel speed sensor concept and measurement overview (source: [12])
1 – Magnetic sensor; 2 – Cogwheel plate
According to this example, two hierarchical levels are defined in the
product FMEA to analyze system and design. The first sheet is dedicated to the
effects, where failures are defined for the entire system. Each of these failures has
derived value S, which are fixed for the entire system. It means that lower levels
will use these failures and severity numbers together as a root cause of failure
belonging to the given function. The first level is the Effect Level (EL) analysis of
which is shown in Table 1.
This level does not contain fully evaluated risks, but a list of potential
failures in the whole systems is grouped here. Column of function and potential
failure are supporting a kind of grouping of potential effects with severity

168 Gábor Ványi, László Pokorádi
numbers, but column of cause are linked from potential failures one level below,
called System Level (SL). Table 1
Effect Level
No Function Pot.failure Pot. effect S Cause O Prev. / Det.
Action D
EL1
Determine
the wheel
speed
Signal has
not been
provided
Velocity
cannot be
determined
10 No signal
provided
EL2
Wrong value
of velocity
7 Periodic
signal differs
from
wheelspeed
EL3
Detecting if
wheel has
been
blocked
Blocking
wheel not
detected
Vehicle
became
instable
9 Status of
wheel has
been detected
as rolling
instead of
blocked
EL4
Blocking
wheel
detected
instead of
rolling
wheel
Wrong value
of blocking
status
8 Wheel
blocking has
not been
detected
EL5
8 Status of
wheel has
been detected
as blocking
instead of
rolling
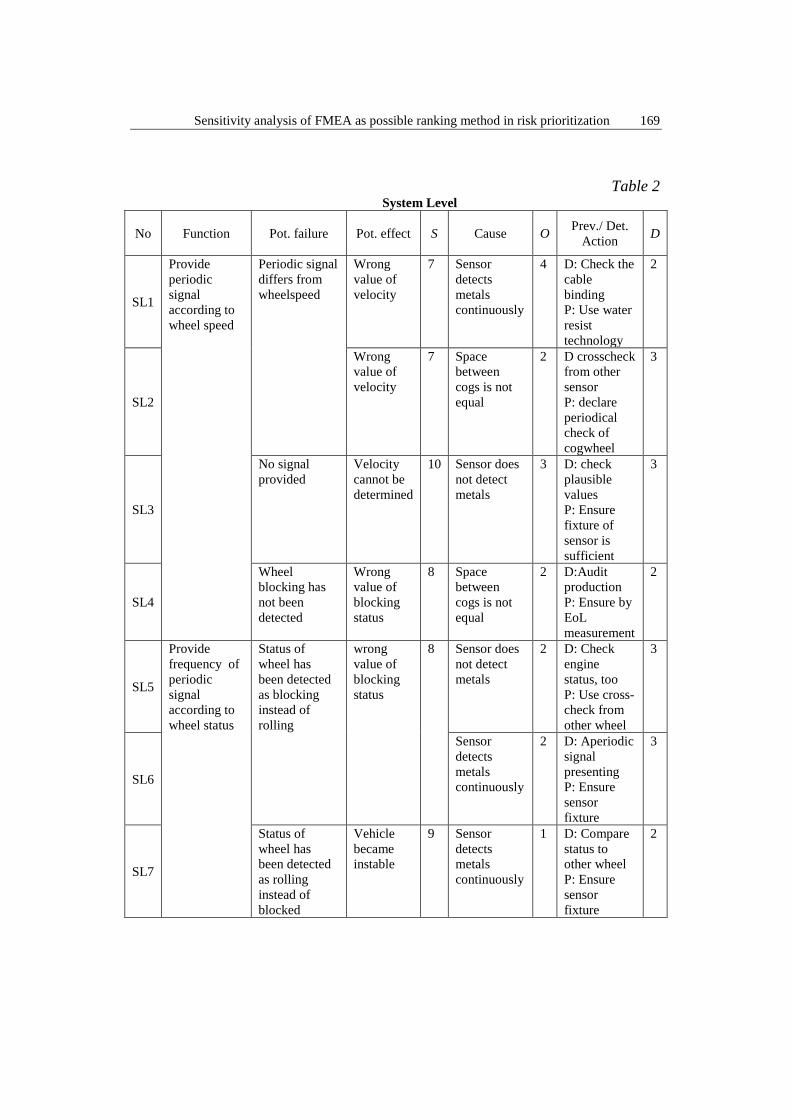
For the better understanding, let us have a look at the next level, which
starts analyzing functions on the system level. Therefore, it is called system
FMEA, shown in Table 2.
Concerning hierarchical connection of failure effects, the SL is used as a
source of failures in the entire analysis. All of these declared values guaranteed to
be fixed and presented with similar meaning on lower level of worksheets as well.
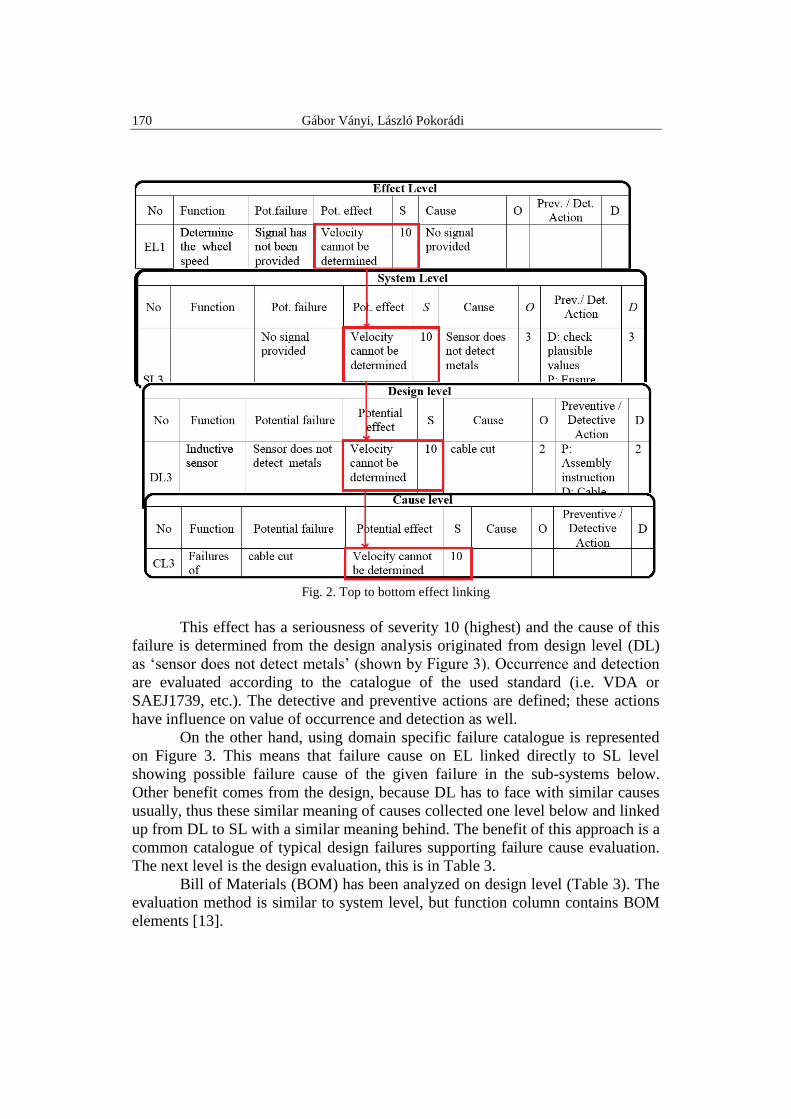
As it is shown by Figure 2, the highlighted ‘velocity cannot be
determined’ in the potential effect column can be found in both Table 1 and
Table 2. This effect has severity ranking of 10, which has been inherited all of the
lower levels from EL, via SL, DL down to CL.
It guarantees that each of these agreed failures have the same meaning of
risk ranking in the entire system. Concerning the system evaluation, it should be
read as follows: the function, which ‘provide periodic signal according to wheel
speed’ carries a chance of potential failure as ‘no signal provided’ which affects
that ‘velocity cannot be determined’ on the system.
Sensitivity analysis of FMEA as possible ranking method in risk prioritization 169
Table 2 System Level
No Function Pot. failure Pot. effect S Cause O Prev./ Det.
Action D
SL1
Provide
periodic
signal
according to
wheel speed
Periodic signal
differs from
wheelspeed
Wrong
value of
velocity
7 Sensor
detects
metals
continuously
4 D: Check the
cable
binding
P: Use water
resist
technology
2
SL2
Wrong
value of
velocity
7 Space
between
cogs is not
equal
2 D crosscheck
from other
sensor
P: declare
periodical
check of
cogwheel
3
SL3
No signal
provided
Velocity
cannot be
determined
10 Sensor does
not detect
metals
3 D: check
plausible
values
P: Ensure
fixture of
sensor is
sufficient
3
SL4
Wheel
blocking has
not been
detected
Wrong
value of
blocking
status
8 Space
between
cogs is not
equal
2 D:Audit
production
P: Ensure by
EoL
measurement
2
SL5
Provide
frequency of
periodic
signal
according to
wheel status
Status of
wheel has
been detected
as blocking
instead of
rolling
wrong
value of
blocking
status
8 Sensor does
not detect
metals
2 D: Check
engine
status, too
P: Use cross-
check from
other wheel
3
SL6
Sensor
detects
metals
continuously
2 D: Aperiodic
signal
presenting
P: Ensure
sensor
fixture
3
SL7
Status of
wheel has
been detected
as rolling
instead of
blocked
Vehicle
became
instable
9 Sensor
detects
metals
continuously
1 D: Compare
status to
other wheel
P: Ensure
sensor
fixture
2
170 Gábor Ványi, László Pokorádi
Fig. 2. Top to bottom effect linking
This effect has a seriousness of severity 10 (highest) and the cause of this
failure is determined from the design analysis originated from design level (DL)
as ‘sensor does not detect metals’ (shown by Figure 3). Occurrence and detection
are evaluated according to the catalogue of the used standard (i.e. VDA or
SAEJ1739, etc.). The detective and preventive actions are defined; these actions
have influence on value of occurrence and detection as well.
On the other hand, using domain specific failure catalogue is represented
on Figure 3. This means that failure cause on EL linked directly to SL level
showing possible failure cause of the given failure in the sub-systems below.
Other benefit comes from the design, because DL has to face with similar causes
usually, thus these similar meaning of causes collected one level below and linked
up from DL to SL with a similar meaning behind. The benefit of this approach is a
common catalogue of typical design failures supporting failure cause evaluation.
The next level is the design evaluation, this is in Table 3.
Bill of Materials (BOM) has been analyzed on design level (Table 3). The
evaluation method is similar to system level, but function column contains BOM
elements [13].

Sensitivity analysis of FMEA as possible ranking method in risk prioritization 171
Table 3
Design level
No Function Potential failure Potential
effect S Cause O
Preventive /
Detective
Action
D
DL1
Cogwheel Space between
cogs is not equal
Wrong
value of
blocking
status
8 Dust on
surface of cog
2 P: Add
notice
Assembly
instruction
D: Check
other
wheels
3
DL2
Space between
cogs are not
sufficient
Wrong
value of
blocking
status
8 Too wide
space between
cogs
1 P:
Production
instruction
D: Product
measure
2
DL3
Inductive
sensor
Sensor does not
detect metals
Velocity
cannot be
determined
10 cable cut 2 P:
Assembly
instruction
D: Cable
protection
2
DL4
Sensor detects
metals
continuously
Velocity
cannot be
determined
10 cable shorting 2 P:
Assembly
instruction
D: Cable
protection
2
Table 4
Cause level
No Function Potential failure Potential effect S Cause O
Preventive /
Detective
Action
D
CL1 Failures
of cog
wheel
Dust on surface
of cog
Wrong value of
blocking status
8
CL2 Too wide space
between cogs
Wrong value of
blocking status
8
CL3 Failures
of
inductive
sensor
cable cut Velocity cannot
be determined
10
CL4 cable shorting Velocity cannot
be determined
10
Components can be evaluated in separated sheets in parallel, this will
make easier to follow changes and introduction of new materials. This level is
usually used for electronic hardware, mechanic components and base software
(driver interface to HW) elements and functions. Software functions with

172 Gábor Ványi, László Pokorádi
calculations, actuations and high level functions are usually evaluated on system
level, because these software elements are connecting to an interface to actuate.
Fig. 3. Bottom to up cause linking
Finally, the lowest level defined as cause (shown in Table 4). This is the
lowest part of the FMEA, advantageous to design it for a kind of catalogue of
different disciplines. The failures and effects are linked from higher level as well.
Table 4 shows possible failures of mechanical design, but also can be made for
hardware or software. In case of software errors, development process,
development toolchain and systematic failures of designers might be considered
besides testing issues.
3. Sensitivity analysis of FMEA
Different reasons, such as time pressure or lack of field experiences
generate the need of an objective overview of real risks in the background of the
system. Generally used as first line risk estimation to order all of RPN numbers in
the entire FMEA to a corresponding function. This might show where the highest
values are indicating risks. Though, S=10 x O=10 x D=10 = RPN=1000 indicates
highly critical risks in the system, but similar RPNs with different S, O, D values

Sensitivity analysis of FMEA as possible ranking method in risk prioritization 173
for exapmle 10x4x2 or 8x10x1 both result RPN of 80 will not be distinguished that
easy. Therefore, real meaning of similar RPNs should be derived and indicated in
a common overview. Authors set up a sensitivity model and two representation
modes, which compare the individual S, O, D and RPN values to the entire
system. Results summarized on diagrams to have a better overview.
Collecting all evaluated values from the entire FMEA worksheets is the
first step. This study has a ‘No.’ column to identify each fully evaluated line.
The first calculated value is the Ki which is calculated as the following:
=
=n
ii
ii
RPN
RPNK
1
(1)
The second step is calculating sensitivity relations of S, O and D in the
system:
DOSxKxK iixi ,,where, = (2)
The calculated values, Ki, KSi, KOi and KDi are also presented by Table 5.
Table 5
Collection of evaluated RPNs and severity values i Si Oi Di RPNi Ki KSi KOi KDi
SL1 7 4 2 56 0.1172 0.8201 0.4686 0.2343
SL2 7 2 3 42 0.0879 0.6151 0.1757 0.2636
SL3 10 3 3 90 0.1883 1.8828 0.5649 0.5649
SL4 8 2 2 32 0.0669 0.5356 0.1339 0.1339
SL5 8 2 3 48 0.1004 0.8033 0.2008 0.3013
SL6 8 2 3 48 0.1004 0.8033 0.2008 0.3013
SL7 9 1 2 18 0.0377 0.3389 0.0377 0.0753
DL1 8 2 3 48 0.1004 0.8033 0.2008 0.3013
DL2 8 1 2 16 0.0335 0.2678 0.0335 0.0669
DL3 10 2 2 40 0.0837 0.8368 0.1674 0.1674
DL4 10 2 2 40 0.0837 0.8368 0.1674 0.1674
The calculations are ready, so results can be plotted in two different ways
of understanding. The first graph shown on Figure 4, this will support test
managers finding critical points in the entire system. This graph shows severity,
because it cannot be modified without any agreement of the project team and the
customer. If the risk testing were applied in this analysis the distribution of
additional weight would be shown graphically. There is a line shown on the graph
as well, using threshold for a better understanding of the level of criticality.

174 Gábor Ványi, László Pokorádi
Fig. 4. Severity distribution (Si and KSi)
Experiments have shown that certain threshold should be defined to
highlight critical points in the entire system. Authors experienced that threshold of
0,75 for this purpose is the most reasonable choice to be used.
Fig. 5. Distribution of RPN and Kxi sensitivity parameters, ordered to Ksi

Sensitivity analysis of FMEA as possible ranking method in risk prioritization 175
On the other hand, the ranking of risks compared to former RPNs and the
new Kx weighting factor. Experiences show that RPNs and weight of individual
parameters have different meaning in the background. If only RPNs were used for
risk priority decision, the order of critical object would be SL3, SL1, SL5, SL6,
DL1, SL2, DL3, DL4, SL4, SL7, DL2.
But if order changed to KSi the order is changed to the following: SL3,
DL3, DL4, SL1, SL5, SL6, DL1, SL2, SL4, SL7 and DL2. It means that SL3 is
not changed, but DL3, DL4 became more in focus besides SL3.
4. Discussion
This means that SL3 express that velocity cannot be determined. It might
have higher risk than blocking wheel. This result highlights the leading cause of
death on road facilities: improperly chosen speed. Due to the fact that even if the
Vehicle Stability Program (ESP) has to calculate with inaccurate value of false
tire speed – it will cause more problems for the vehicle stability. Just think about
the ground reason of rolling over of trailer or even the truck.
Concerning the used methodology it will support system analysts and test
managers in activity planning. This means, critical functions will be found easier
and performance of system will become more comparable by these graphs.
5. Conclusion
In this paper we have proposed a new sensitivity investigation mode of
FMEA. This method considers that severities have been defined by the customer.
This method has been shown by case study of risk analysis of WSS. The authors
have proposed scientific research including study of quality management method
in the automotive industry. The sensitivity analysis together with FMEA
analytical purposes enables engineers to create risk analysis even on software
systems in finding security risks or other risks of information flow not only with
surveys but with a thematically modeling of entire system together with
multidisciplinary fields [14]. If a development team extended this method
applying risk based testing, the regression tests could be identified. This method
can be extended also with an additional weighting factor besides the RPN, which
will provide a list of ‘must be tested’ functions similarly to risk based testing.
Acknowledgment
This work has been supported by the EFOP-3.6.2-16-2017-00016 project,
which is gratefully acknowledged.

176 Gábor Ványi, László Pokorádi
R E F E R E N C E S
[1]. Military Standard, MIL-STD 1629A: Procedures for performing a failure mode, effects and
criticality analysis, Department of Defense, Washington DC, 1977
[2]. M. Rausand and A. Hoylan, System Reliability Theory: Models, Statistical Methods, and
Applications, Wiley, New Jersey, 2004
[3]. C. Carlson, Why is it important to make the FMEA scope visible? 2014. November
http://www.weibull.com/hotwire/issue165/fmeacorner165.htm (17.05.2017)
[4]. J.C. García-Ojeda, B. Bertok, F. Friedler, A. Argoti and L. T. Fan, A Preliminary Study of
the Application of the P-graph Methodology for Organization-based Multiagent System
Designs: Assessment, Acta Polytechnica Hungarica, vol 12, no. 2. 2015. pp103-122
[5]. G. Vanyi, Improving the effectiveness of FMEA analysis in automotive − a case study Acta
Universitatis Sapientiae, Informatica, vol. 8, no. 1, 2016, pp. 82−95
[6]. A. Saltelli, M. Ratto, T. Andres, F. Campolongo, J. Cariboni, D. Gatelli, M. Saisana, and S.
Tarantola, Global Sensitivity Analysis. The Primer, John Wiley and Sons, 2008
[7]. A. Der Kiureghian, and O. Ditlevsen, Aleatory or epistemic? Does it matter?, Structural
Safety. 31 (2): 105–112. doi:10.1016/j.strusafe.2008.06.020.
[8]. M. Ratto, A. Saltelli, T. Andres, F. ampolongo, J. Cariboni, D. Gatelli, M. Saisana and S.
Tarantola, Global Sensitivity Analysis The Primer, Wiley, 2008
[9]. L. Pokorádi, Sensitivity Analysis of Reliability of Systems with Complex Interconnections,
Journal of Loss Prevention in the Process Industries, vol.32, 2014, pp. 436-442
[10]. L. Pokorádi and G. Ványi, Gépjármű fékrendszer szoftverfejlesztésének Hibafa elemzése,
IFFK 2016, MMA Budapest, 2016, pp. 206-209
[11]. C. Ispas, C. Mohora and V.M. Ghinea, Factors of risk in e-business, U.P.B. Sci. Bull.,
Series D, vol. 68, no. 4., 2006
[12]. Z. Varga and F. Szauter, Járműmechatronika, Széchenyi István Egyetem, Győr, 2011
[13]. Z.Yuan, Y.Chen, N.Tang An Integrated Method For Hardware FMEA of New Electronic
Products, Prognostics and System Health Management Conference (PHM-Chengdu), 978-
1-5090-2778-1/16/$31.00 IEEE, 2016.
[14]. Z. Nesic, L. Ljubic, M. Radojicic and J.V. Vasovic, Analysis of the information flow within
the information system of car parks, Acta Polytechnica Hungarica, vol 12, no. 3. 2015. pp.
73-86