sensitivity of pca for traffic anomaly detection · sensitivity of pca for traffic anomaly...
TRANSCRIPT

Sensitivity of PCA for Traffic Anomaly Detection
Haakon RingbergDepartment of Computer Science
Princeton University
Augustin SouleThomson Research
Jennifer RexfordDepartment of Computer Science
Princeton University
Christophe DiotThomson Research
ABSTRACTDetecting anomalous traffic is a crucial part of managingIP networks. In recent years, network-wide anomaly de-tection based on Principal Component Analysis (PCA) hasemerged as a powerful method for detecting a wide vari-ety of anomalies. We show that tuning PCA to operateeffectively in practice is difficult and requires more robusttechniques than have been presented thus far. We analyzea week of network-wide traffic measurements from two IPbackbones (Abilene and Geant) across three different trafficaggregations (ingress routers, OD flows, and input links),and conduct a detailed inspection of the feature time se-ries for each suspected anomaly. Our study identifies andevaluates four main challenges of using PCA to detect traf-fic anomalies: (i) the false positive rate is very sensitive tosmall differences in the number of principal components inthe normal subspace, (ii) the effectiveness of PCA is sensi-tive to the level of aggregation of the traffic measurements,(iii) a large anomaly may inadvertently pollute the normalsubspace, (iv) correctly identifying which flow triggered theanomaly detector is an inherently challenging problem.
Categories and Subject DescriptorsC.2.3 [Computer-Communication Networks]: NetworkOperations; C.4 [Performance of Systems]: ModelingTechniques
General TermsMeasurement, Performance, Reliability
KeywordsNetwork Traffic Analysis, Principal Component Analysis,Traffic Engineering
Permission to make digital or hard copies of all or part of this work forpersonal or classroom use is granted without fee provided that copies arenot made or distributed for profit or commercial advantage and that copiesbear this notice and the full citation on the first page. To copy otherwise, torepublish, to post on servers or to redistribute to lists, requires prior specificpermission and/or a fee.SIGMETRICS’07,June 12–16, 2007, San Diego, California, USA.Copyright 2007 ACM 978-1-59593-639-4/07/0006 ...$5.00.
1. INTRODUCTIONTraffic anomalies, such as flash crowds, denial-of-service
attacks, port scans, and the spreading of worms, can havedetrimental effects on Internet services. Detecting and diag-nosing these anomalies is critical to network operators, whomust take corrective action to alleviate congestion, block at-tacks, and warn affected users. Sifting through an immenseamount of measurement data to identify the anomalous traf-fic is an onerous task, best left to automated analysis. Onthe surface, anomaly detection seems straightforward: picka statistical definition of an anomaly, feed the measurementdata into a statistical-analysis technique, and classify thestatistical outliers as anomalies. Unfortunately, anomaly de-tection is much more complicated than it seems. There aremany ways to represent the traffic and pinpoint anomalies,each with its own set of assumptions, limitations, and tun-able parameters that significantly affect the results. Thispaper focuses on that problem.
Principal Component Analysis [7] (PCA) is perhaps thebest-known statistical-analysis technique for detecting net-work traffic anomalies. PCA is a dimensionality-reductiontechnique that returns a compact representation of a multi-dimensional dataset by reducing the data to a lower dimen-sional subspace. Recent papers in networking literature haveapplied PCA to the problem of traffic anomaly detectionwith promising initial results [14, 12, 10, 13]. Our researchshows that a great deal of manual tuning is necessary toachieve such results, however, because PCA is very sensitiveto its parameters and the proposed techniques for tuningthem are inadequate. In this paper, we identify and evalu-ate four main challenges of using PCA for traffic anomalydetection:
The false-positive rate is very sensitive to the di-
mensionality of the normal subspace: PCA’s effective-ness as a traffic anomaly detector is very sensitive to its twomain tunable parameters—the dimensionality of the normalsubspace (the topk parameter) and the detection threshold.Previous research has required a great deal of manual tun-ing of these parameters. We show that the false-positive ratecan vary by a factor of three or more within a small range oftopk values. The detection threshold, on the other hand, hasa more predictable impact, and provides operators with anintuitive knob to strike a balance between the false-positiverate and the total number of detections.
The effectiveness of PCA is sensitive to the way
the traffic measurements are aggregated: The largevolume of IP flow traces must be aggregated before PCA isapplied. We evaluate three different ways of aggregating the

data—by input link, by ingress router, and by OD pairs—and find that the choice has a significant impact on PCA’seffectiveness. Choosing a representation that aggregates thedata too much leads to highly smooth data that hides all butthe most blatant anomalies, whereas aggregating too littleoften yields flows with wildly varying relative sizes and thuscauses PCA to be overly sensitive to variations among thesmall flows. In addition, some representations of the traffic,such as OD flows, are only appropriate for very long traces,limiting the applicability of PCA.
Large anomalies can contaminate the normal sub-
space: Sufficiently large anomalies can inadvertently pol-lute PCA’s normal subspace, thereby skewing the definitionof normalcy and increasing the false-positive rate as a re-sult. We support this contention with real measurements ofa short-lived but drastic network event in the Geant networkthat goes largely undetected by PCA because of this phe-nomenon. This argues for preprocessing measurement datato detect, and filter, large anomalies before applying PCA.
Pinpointing the anomalous flows is inherently dif-
ficult: The problem of identifying which ingress router, forexample, was responsible for a PCA detection is fundamen-tally hard. Unfortunately, there is no direct mapping be-tween PCA’s dimensionality-reduced subspace and the orig-inal spatial location of the anomaly. We show that the pre-viously employed heuristic for associating a given PCA de-tection with specific location (e.g., an ingress router) relieson an assumption that does not hold in general, and has theside-effect of associating a large fraction of the detectionswith a very small set of locations.
In order to demonstrate these four points, we analyzeone week of IP flow data for both the Geant and Abilenebackbones, including a detailed examination of the featuretime series for each detected anomaly to identify false pos-itives. Comparing the results for Geant and Abilene allowsus to conclude that the appropriate setting of PCA’s tun-able parameters varies from one network to another. Still,our comparison between Geant and Abilene illustrates that(i) the relative properties of traffic aggregations, in terms offalse-positive rate and total number of detections, (ii) thedifficulty of identifying which anomalous flow caused a PCAdetection, and (iii) the contamination of PCA’s normal sub-space, appear to hold across networks.
The remainder of the paper is organized as follows. InSection 2 we present a brief overview of how to apply PCAto detect anomalous traffic. Next, Section 3 describes oursoftware for aggregating the measurement data, applyingPCA, and validating the resulting anomalies. Then, we eval-uate the sensitivity of PCA to the topk parameter and thedetection threshold for the two networks and three trafficaggregations in Section 4. In Section 5 we introduce twolimitations intrinsic to PCA, viz. contamination of the nor-mal subspace, and identification of the flows responsible fortriggering the detection of an anomaly. We present relatedresearch in Section 6 and conclude in Section 7.
2. PCA FOR TRAFFIC ANOMALIESPCA is a dimensionality-reduction technique that has been
applied to many kinds of data. In fact, PCA is the optimal
such linear transform—that is, for any choice for the num-ber of dimensions, PCA returns the subspace that retainsthe highest variance [7]. In this section, we describe how to
use PCA to construct a model of “normal” traffic, and todetect and identify the statistical outliers.
2.1 Model ConstructionNetwork-wide anomaly detection draws on measurement
data from multiple locations and time periods. We definea traffic matrix as a timeseries of n measurement vectors~v1, . . . , ~vn, where each time-step i has m measurements (i.e.,|~vi| = m). We intentionally leave the precise meaning of thecell vi,j unspecified, since the choice may vary from one rep-resentation of the data to another. For example, vi,j couldbe the number of bytes or packets observed at time-step iat location j, or could be something more complex, such asthe entropy of the distribution of source IP addresses in thetraffic seen at location j during time interval i. Throughoutthe paper, we refer to the m columns of the traffic matrixas ’flows’, so we can talk about the matrix without regardfor how we choose to aggregate the data. When we need torefer to ’IP flows’, we use that term explicitly.
When applied to a matrix, PCA returns a set of orthonor-mal vectors (called the principal components) such that forall k ≤ m, the k-subspace defined by these vectors capturesthe highest variance in the original matrix. Adhering to pre-vious terminology, we refer to the subspace defined by thesefirst k principal components as the “normal subspace”; werefer to k itself as the topk parameter. The basic under-lying assumption of traffic anomaly detection is that thek-subspace corresponds to the primary regular trends (e.g.,diurnal, weekly) of the traffic matrix. Previous work [14]has shown that traffic timeseries have low intrinsic dimen-sionality, which means that k can be a small number. Insection 4.1 we investigate PCA’s sensitivity to this parame-ter in the context of traffic anomaly detection.
Once the “normal” operation of the network has beengleaned from the traffic traces, one may assume that whatis left is either statistical anomalies or mere noise. Thatis, when the normal subspace has been removed, one is leftwith a (n − k)-subspace that can then either be treated aswholly anomalous or be further split into a ℓ-subspace thatis anomalous and a (n − k − ℓ)-subspace of noise. Thesetwo or three subspaces are then the simplified model thatis retained of the entire traffic trace. In constructing thismodel of the traffic, the m flows of the m× n traffic matrixcan be thought of as random variables, of which there are nobservations each. As such, it does not make sense to con-sider cases where m > n, i.e., one cannot draw statisticallysound conclusions when one has fewer observations than onehas variables1. We will therefore require that the numberof time-steps n must be greater than or equal to the car-dinality of the chosen traffic aggregation m, which we willdemonstrate in section 3.3 to be a problem for certain trafficaggregations.
2.2 Detection and IdentificationClassification of a new measurement vector ~v, represent-
ing a given moment in time, occurs in relation to the modelconstructed in the previous step. ~v is projected onto therelevant subspaces in the model, which decomposes the vec-tor into a linear combination of its normal and anomalousconstituents. ~v is then classified as normal or anomalousdepending on whether it is primarily expressed by the nor-
1Recent theoretical work [3] attempts to overcome this lim-itation in certain circumstances.

Network Nodes Sampling Time Agg AnonAbilene 11 1% 5 min 11 bitsGeant 23 0.1% 15 min 0 bits
Table 1: Networks studied
mal or anomalous subspaces. The threshold that determineshow statistically significant a given event (spike) must be forit to be flagged as anomalous is another parameter that canbe tuned, and we investigate its impact in section 4.2.
Finally, if ~v is classified as anomalous, we must determineprecisely which set of columns C ⊆ [1, m] (i.e., flows) of thetraffic matrix were primarily responsible for the detection.Knowing that an anomaly occurred at a particular time istypically not sufficient—knowing where it happened oftenmatters as well. For example, the network operator mayneed to know which ingress routers were the entry point forthe anomalous traffic. It is important to realize that thisflow identification step is separate from PCA, and differentheuristics may be employed here. It is a necessary step in thecontext of network traffic anomaly detection, however, andwe will therefore evaluate the detector that is the combina-tion of the above PCA technique and the heuristic employedby the line of work that followed Lakhina et al. [12, 10, 13,15, 16]. We will further discuss this heuristic in section 5.2.
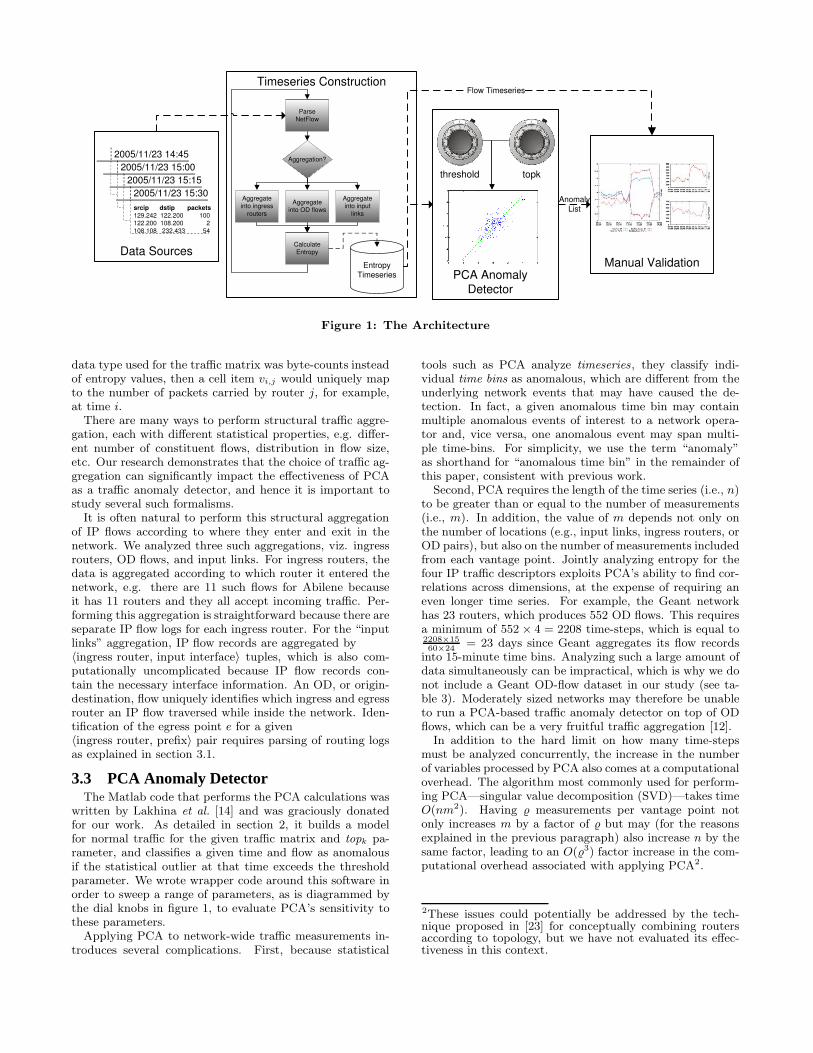
3. METHODOLOGYWe designed and implemented the architecture shown in
figure 1 to evaluate PCA’s effectiveness as a traffic anomalydetector. The diagram is organized into four sub-components,each of which will be individually explained in the followingsubsections. Specifically, section 3.1 will detail the data thatwere collected; section 3.2 explains how the data were pre-processed and aggregated according to either ingress routers,OD flows, or input links; section 3.3 deals with our inter-face with the PCA anomaly detector written by Lakhina et
al. [12]; and section 3.4 describes how we labeled the de-tected anomalies as false positives or true positives.
3.1 Data SourcesFor this work we studied both the Abilene [1] and Geant [6]
networks. Their respective properties are summarized in ta-ble 1. Abilene is an 11-node research backbone that connectsInternet2 universities and research labs across the continen-tal United States. Abilene does not, however, provide tran-sit services to the Internet at large; instead, its participantsmust maintain separate connections to the commodity Inter-net [2]. Geant is a 23-node network that connects nationalresearch and education networks representing 30 Europeancountries; unlike Abilene, Geant does provide Internet con-nectivity to its participants.
Both the Abilene and Geant networks collect flow statis-tics using Juniper’s J-Flow tool [8]. Abilene samples 1 out ofevery 100 packets for inclusion in the flow statistics whereasGeant samples packets at 1 out of 1000. In Abilene, pack-ets are aggregated into five-minute time-bins compared toa fifteen-minute time window for Geant. Finally, Abileneanonymizes the last eleven bits of the IP address stored inthe flow records to preclude a reader from identifying thesource or destination host.
In order to aggregate the collected IP flows into OD-flows, we also need to parse the routing data from eachnetwork. Abilene deploys Zebra BGP monitors that recordall BGP messages they receive. This means that for any〈ingress,prefix〉 pair, it is sufficient to parse the BGP logsin order to identify the egress point of the IP flow. Geanthas one Zebra BGP monitor embedded in an iBGP meshthat logs a single BGP record for all routers, which gives usa set of egress points for a given prefix. Subsequently wemust parse the Geant IS-IS logs to produce a minimum-cost path from each ingress router to all egress routers,which, in conjunction with the set of egress routers for agiven prefix, uniquely identifies the egress point for a given〈ingress,prefix〉 pair.
For both networks, we studied a full week of data betweenNovember 21st and 27th of 2005, corresponding to 2016 dat-apoints for each flow in Abilene (e.g. 7 days × 24 hours × 60
5
bins per hour) and 672 for Geant.
3.2 Timeseries ConstructionIn the following subsection we will elaborate on how the
data was further preprocessed and transformed into entropytimeseries before being analyzed by the PCA anomaly de-tector itself.
3.2.1 Entropy TimeseriesPrevious work [13] has demonstrated that entropy time-
series of the four main IP header features (source IP, desti-nation IP, source port, and destination port) is a rich datatype to analyze for traffic anomaly detection. That is, forevery measurement vector ~vi at time i there are four mea-surements vi,j , . . . , vi,j+3 for every ingress router (for exam-ple). vi,j will be the entropy of the distribution of source IPaddresses for this router, vi,j+1 will be the entropy of thedistribution of destination IP addresses for this router, etc.
H(X) = −
nX
i=1
Pr[X = xi] log2(Pr[X = xi]) (1)
Entropy is studied because it provides a computationallyefficient metric for estimating the dispersion or concentra-tion in a distribution, and a wide variety of anomalies willimpact the distribution of one of the discussed IP features.The entropy of a random variable X is defined in equation 1,where Pr[X = xi] is the probability of event xi ∈ X occur-ring. In our context, the events are observations of a givenIP feature. For example, the probability of seeing port 80is defined to be number of packets using port 80 divided bythe total number of packets in the given time interval. Asudden flash crowd to a webserver, for example, will cause aspecific destination IP (the webserver) and destination port(port 80) to become much more prevalent than in previoustime-steps, which will cause a decrease in the destination IPand destination port entropy timeseries, respectively, andhence allow us to detect it. A more complete explanationof the benefits of using entropy for traffic anomaly detectioncan be found in [13].
3.2.2 Traffic AggregationIn addition to studying two networks, we also studied sev-
eral traffic aggregations. That is, IP flow traces must be fur-ther aggregated so that statistical methods such as PCA candetect correlations and periodic trends in the data. If the
Flow TimeseriesTimeseries Construction
Data Sources
2005/11/23 14:45
2005/11/23 15:00
2005/11/23 15:15
2005/11/23 15:30
srcip dstip packets
129.242 122.200 100
122.200 108.200 2
108.108 232.433 54
EntropyTimeseries PCA Anomaly
Detector
Manual Validation
AnomalyList
Aggregation?
Parse
NetFlow
Aggregate into input
links
Calculate
Entropy
Aggregate into OD flows
Aggregate into ingress
routers
threshold topk
Figure 1: The Architecture
data type used for the traffic matrix was byte-counts insteadof entropy values, then a cell item vi,j would uniquely mapto the number of packets carried by router j, for example,at time i.
There are many ways to perform structural traffic aggre-gation, each with different statistical properties, e.g. differ-ent number of constituent flows, distribution in flow size,etc. Our research demonstrates that the choice of traffic ag-gregation can significantly impact the effectiveness of PCAas a traffic anomaly detector, and hence it is important tostudy several such formalisms.
It is often natural to perform this structural aggregationof IP flows according to where they enter and exit in thenetwork. We analyzed three such aggregations, viz. ingressrouters, OD flows, and input links. For ingress routers, thedata is aggregated according to which router it entered thenetwork, e.g. there are 11 such flows for Abilene becauseit has 11 routers and they all accept incoming traffic. Per-forming this aggregation is straightforward because there areseparate IP flow logs for each ingress router. For the “inputlinks” aggregation, IP flow records are aggregated by〈ingress router, input interface〉 tuples, which is also com-putationally uncomplicated because IP flow records con-tain the necessary interface information. An OD, or origin-destination, flow uniquely identifies which ingress and egressrouter an IP flow traversed while inside the network. Iden-tification of the egress point e for a given〈ingress router, prefix〉 pair requires parsing of routing logsas explained in section 3.1.
3.3 PCA Anomaly DetectorThe Matlab code that performs the PCA calculations was
written by Lakhina et al. [14] and was graciously donatedfor our work. As detailed in section 2, it builds a modelfor normal traffic for the given traffic matrix and topk pa-rameter, and classifies a given time and flow as anomalousif the statistical outlier at that time exceeds the thresholdparameter. We wrote wrapper code around this software inorder to sweep a range of parameters, as is diagrammed bythe dial knobs in figure 1, to evaluate PCA’s sensitivity tothese parameters.
Applying PCA to network-wide traffic measurements in-troduces several complications. First, because statistical
tools such as PCA analyze timeseries, they classify indi-vidual time bins as anomalous, which are different from theunderlying network events that may have caused the de-tection. In fact, a given anomalous time bin may containmultiple anomalous events of interest to a network opera-tor and, vice versa, one anomalous event may span multi-ple time-bins. For simplicity, we use the term “anomaly”as shorthand for “anomalous time bin” in the remainder ofthis paper, consistent with previous work.
Second, PCA requires the length of the time series (i.e., n)to be greater than or equal to the number of measurements(i.e., m). In addition, the value of m depends not only onthe number of locations (e.g., input links, ingress routers, orOD pairs), but also on the number of measurements includedfrom each vantage point. Jointly analyzing entropy for thefour IP traffic descriptors exploits PCA’s ability to find cor-relations across dimensions, at the expense of requiring aneven longer time series. For example, the Geant networkhas 23 routers, which produces 552 OD flows. This requiresa minimum of 552 × 4 = 2208 time-steps, which is equal to2208×15
60×24= 23 days since Geant aggregates its flow records
into 15-minute time bins. Analyzing such a large amount ofdata simultaneously can be impractical, which is why we donot include a Geant OD-flow dataset in our study (see ta-ble 3). Moderately sized networks may therefore be unableto run a PCA-based traffic anomaly detector on top of ODflows, which can be a very fruitful traffic aggregation [12].
In addition to the hard limit on how many time-stepsmust be analyzed concurrently, the increase in the numberof variables processed by PCA also comes at a computationaloverhead. The algorithm most commonly used for perform-ing PCA—singular value decomposition (SVD)—takes timeO(nm2). Having ̺ measurements per vantage point notonly increases m by a factor of ̺ but may (for the reasonsexplained in the previous paragraph) also increase n by thesame factor, leading to an O(̺3) factor increase in the com-putational overhead associated with applying PCA2.
2These issues could potentially be addressed by the tech-nique proposed in [23] for conceptually combining routersaccording to topology, but we have not evaluated its effec-tiveness in this context.
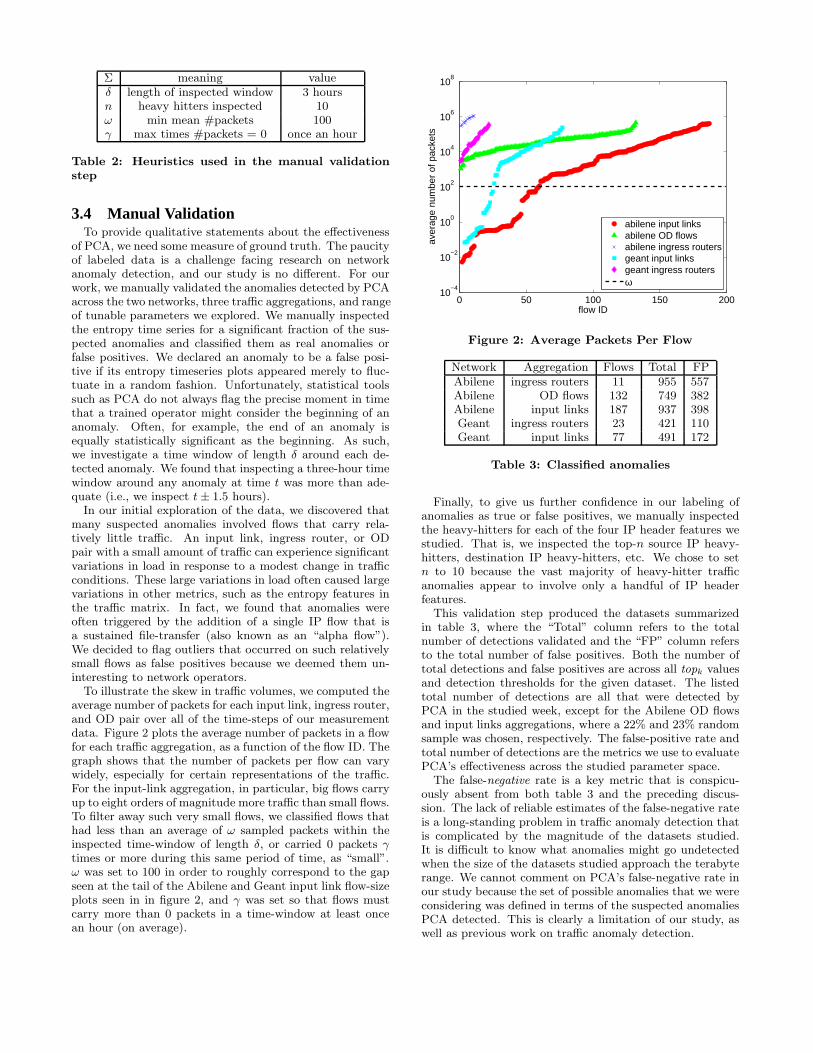
Σ meaning valueδ length of inspected window 3 hoursn heavy hitters inspected 10ω min mean #packets 100γ max times #packets = 0 once an hour
Table 2: Heuristics used in the manual validation
step
3.4 Manual ValidationTo provide qualitative statements about the effectiveness
of PCA, we need some measure of ground truth. The paucityof labeled data is a challenge facing research on networkanomaly detection, and our study is no different. For ourwork, we manually validated the anomalies detected by PCAacross the two networks, three traffic aggregations, and rangeof tunable parameters we explored. We manually inspectedthe entropy time series for a significant fraction of the sus-pected anomalies and classified them as real anomalies orfalse positives. We declared an anomaly to be a false posi-tive if its entropy timeseries plots appeared merely to fluc-tuate in a random fashion. Unfortunately, statistical toolssuch as PCA do not always flag the precise moment in timethat a trained operator might consider the beginning of ananomaly. Often, for example, the end of an anomaly isequally statistically significant as the beginning. As such,we investigate a time window of length δ around each de-tected anomaly. We found that inspecting a three-hour timewindow around any anomaly at time t was more than ade-quate (i.e., we inspect t ± 1.5 hours).
In our initial exploration of the data, we discovered thatmany suspected anomalies involved flows that carry rela-tively little traffic. An input link, ingress router, or ODpair with a small amount of traffic can experience significantvariations in load in response to a modest change in trafficconditions. These large variations in load often caused largevariations in other metrics, such as the entropy features inthe traffic matrix. In fact, we found that anomalies wereoften triggered by the addition of a single IP flow that isa sustained file-transfer (also known as an “alpha flow”).We decided to flag outliers that occurred on such relativelysmall flows as false positives because we deemed them un-interesting to network operators.
To illustrate the skew in traffic volumes, we computed theaverage number of packets for each input link, ingress router,and OD pair over all of the time-steps of our measurementdata. Figure 2 plots the average number of packets in a flowfor each traffic aggregation, as a function of the flow ID. Thegraph shows that the number of packets per flow can varywidely, especially for certain representations of the traffic.For the input-link aggregation, in particular, big flows carryup to eight orders of magnitude more traffic than small flows.To filter away such very small flows, we classified flows thathad less than an average of ω sampled packets within theinspected time-window of length δ, or carried 0 packets γtimes or more during this same period of time, as “small”.ω was set to 100 in order to roughly correspond to the gapseen at the tail of the Abilene and Geant input link flow-sizeplots seen in in figure 2, and γ was set so that flows mustcarry more than 0 packets in a time-window at least oncean hour (on average).
0 50 100 150 20010
−4
10−2
100
102
104
106
108
flow ID
aver
age
num
ber
of p
acke
ts
abilene input linksabilene OD flowsabilene ingress routersgeant input linksgeant ingress routersω
Figure 2: Average Packets Per Flow
Network Aggregation Flows Total FPAbilene ingress routers 11 955 557Abilene OD flows 132 749 382Abilene input links 187 937 398Geant ingress routers 23 421 110Geant input links 77 491 172
Table 3: Classified anomalies
Finally, to give us further confidence in our labeling ofanomalies as true or false positives, we manually inspectedthe heavy-hitters for each of the four IP header features westudied. That is, we inspected the top-n source IP heavy-hitters, destination IP heavy-hitters, etc. We chose to setn to 10 because the vast majority of heavy-hitter trafficanomalies appear to involve only a handful of IP headerfeatures.
This validation step produced the datasets summarizedin table 3, where the “Total” column refers to the totalnumber of detections validated and the “FP” column refersto the total number of false positives. Both the number oftotal detections and false positives are across all topk valuesand detection thresholds for the given dataset. The listedtotal number of detections are all that were detected byPCA in the studied week, except for the Abilene OD flowsand input links aggregations, where a 22% and 23% randomsample was chosen, respectively. The false-positive rate andtotal number of detections are the metrics we use to evaluatePCA’s effectiveness across the studied parameter space.
The false-negative rate is a key metric that is conspicu-ously absent from both table 3 and the preceding discus-sion. The lack of reliable estimates of the false-negative rateis a long-standing problem in traffic anomaly detection thatis complicated by the magnitude of the datasets studied.It is difficult to know what anomalies might go undetectedwhen the size of the datasets studied approach the terabyterange. We cannot comment on PCA’s false-negative rate inour study because the set of possible anomalies that we wereconsidering was defined in terms of the suspected anomaliesPCA detected. This is clearly a limitation of our study, aswell as previous work on traffic anomaly detection.

4. TUNABLE PARAMETERSThe following section will evaluate PCA’s sensitivity to
its two key parameters, viz. the number of dimensions thatconstitute its normal subspace in section 4.1 and the detec-tion threshold in section 4.2.
4.1 Size of Normal SubspaceThe number of principal components included in the nor-
mal subspace—the topk parameter—is the most importantparameter to be tuned when using PCA as a traffic anomalydetector. Past literature has made four important claims inthis context: (i) traffic traces have low intrinsic dimension-ality, which means that topk can be small, (ii) these first fewprincipal components capture the vast majority of the vari-ance in the data, (iii) the same principal components are alsohighly periodic and thus capture the diurnal trends soughtto be included in the normal subspace, and (iv) identify-ing the separation between normal and anomalous principalcomponents can be done by retaining the first k principalcomponents such that the projection of the traffic data doesnot contain a 3σ deviation from the mean [14, 12]. Thefollowing sub-sections show, in order, that the second claimdoes not hold across all networks and traffic aggregations,that the effectiveness of PCA is very sensitive to the topk
parameter, and that the previously proposed techniques fordetermining topk are inadequate.
4.1.1 Decoupling Size from Captured VarianceEach of our datasets support the previous finding that
traffic traces have low intrinsic dimensionality, as can beseen from figure 3(a). The figure contains scree plots foreach of the datasets used in our study. A scree plot is aplot of percent variance captured by a given principal com-ponent. We can conclude that traffic traces have low in-trinsic dimensionality because the corresponding scree plotshave very early knees relative to the original dimensional-ity of the datasets (seen in table 3). This is an importantobservation because it means that only a small fraction ofall principal components need to be included in the normalsubspace to capture the periodic trends that these first fewprincipal components have been shown to exhibit [14].
However, our results do not support the earlier contentionthat the first few principal components necessarily capturethe vast majority of variability in the traffic matrix, which isdemonstrated by figure 3(b), which is the CDF of 3(a) in log-scale. While the plots in figure 3(a) have knees somewherein the range [2, 6], it is much more difficult to argue thatsetting topk to a value in this range would correspond toa vast fraction of variance in figure 3(b). For example, ifan Abilene network operator wanted to capture 90% of thevariance for the input-link aggregation, he would need a topk
value that was an order of magnitude larger than previouslyreported in the literature (at least 95). If, on the other hand,he set topk to match up with the knee seen in figure 3(a),he would capture less than half of the total variance.
The purpose of this section is not merely to debunk anearlier coupling of low intrinsic dimensionality and percentvariance captured, but also to highlight that this distinctionis an important one. One should not determine the topk
variable based on percent variance captured (i.e., plot 3(b))because different networks have different natural levels ofvariability, and the normal subspace should capture period-
icity as opposed to a certain fraction of variance. For ex-
2 4 6 8 100
20
40
60
abilene input links
# pc
% v
aria
nce
2 4 6 8 100
20
40
60
abilene OD flows
# pc
% v
aria
nce
2 4 6 8 100
20
40
60
abilene ingress routers
# pc
% v
aria
nce
2 4 6 8 100
20
40
60
geant input links
# pc
% v
aria
nce
2 4 6 8 100
20
40
60
geant ingress routers
# pc
% v
aria
nce
(a) scree plots
100
101
102
103
30
40
50
60
70
80
90
100
# principal components
cum
ulat
ive
perc
ent v
aria
nce
capt
ured
abilene input linksabilene OD flowsabilene ingress routersgeant input linksgeant ingress routers
(b) CDF of scree plots
Figure 3: Intrinsic Dimensionality
ample, a research backbone for universities such as Abilenewill likely have a more variable matrix than a tier-1 networkbecause Abilene is (i) smaller, (ii) is used as an experimen-tal network, and (iii) only a very limited set of source hostsgain access to the network. The same heterogeneity is exhib-ited across different traffic aggregations also, where a morehighly aggregated traffic aggregation such as ingress routerswill have more stable statistical properties than input links,which may have lots of small flows that are highly variable.It is therefore important to highlight that the topk param-eter should not be determined based on cumulative percentvariance captured.
4.1.2 Sensitivity AnalysisPCA is very sensitive to the topk parameter: We
noted previously that the scree plots for our datasets eachappeared to have knees in the range [2, 6]. While that rangemight appear small, our results indicate that PCA is verysensitive to the number of principal components even withinsuch a limited range. As can be seen from figure 4(a), withinthe [2, 6] range, the false-positive rate for Geant ingress

2 3 4 5 6 7 8 9 100
5
10
15
20
25
30
35
# principal components
perc
ent f
alse
pos
itive
s
geant (threshold = 90%)
ingress routersinput links
(a) Geant false-positive rate
2 3 4 5 6 7 8 9 1060
80
100
120
140
160
180
# principal components
tota
l det
ectio
ns
geant (threshold = 90%)
ingress routersinput links
(b) Geant total detections
2 3 4 5 6 7 8 9 1010
20
30
40
50
60
70
# principal components
perc
ent f
alse
pos
itive
s
abilene (threshold = 90%)
ingress routersOD flowsinput links
(c) Abilene false-positive rate
2 3 4 5 6 7 8 9 10200
400
600
800
1000
1200
1400
1600
1800
2000
2200
# principal components
tota
l det
ectio
ns
abilene (threshold = 90%)
ingress routersOD flowsinput links
(d) Abilene total detections
Figure 4: Impact of topk on false-positive rate and
total detections
routers varies between 3.1% and 15.8%. If one ventures be-yond this range, the performance degradation can be evenmore rapid. In the same figure we can see that the false-positive rate when going from 6 to 8 principal componentsfor Geant input links increases from 9.2% to 31.6%. It istherefore extremely important that the topk parameter becarefully tuned. For the remainder of this paper, we willdefine the ’appropriate’ topk value as the one that we con-sider achieves the best trade-off between the false-positiverate and the total number of detections.
The appropriate topk value varies across networks
and traffic aggregations: Figure 4 also shows that theappropriate number of principal components to incorporateinto the normal subspace varies across networks and trafficaggregations. For example, the appropriate choice of prin-cipal components is probably 2 for Abilene ingress routers,3 for Geant ingress routers, and 5 for Abilene OD-flows. Itis interesting to note that the relative order of these threedatasets in terms of topk value is identical to their rela-tive ordering in terms of original dimensionality (see: totalnumber of flows in table 3). We hypothesize that this phe-nomenon will hold in general, and further research mightprovide rule-of-thumb guidelines that map〈original dimensionality, scree knee〉 tuples to a topk value.Guidelines are not sound methodology, however, and PCA’ssensitivity to the topk parameter necessitates a robust method-ology.
Comparison of traffic aggregations: Finally, figure 4shows that the choice of traffic aggregation has a strongimpact on PCA’s performance. Choosing the right traf-fic aggregation is tricky: too much aggregation will lead tosmooth and predictable flow curves whereas too little aggre-gation yields a very heavy-tailed flow-size distribution (seefigure 2) and hence some highly variable small flows whosespikes are not of interest to network operators. In particular,for both Abilene in figure 4(d) and Geant in figure 4(b), it isclear that the ingress router aggregation consistently detectsfewer anomalies than OD flows and input links. The reasonfor this is that at the level of ingress routers, the data is soaggregated and the flows are so large that most anomaliesare effectively drowned. This also means that the anomaliesthat are flagged by PCA when using this aggregation-leveltend to be large and obvious. Hence, at its appropriatetopk value (e.g. 3 for Geant and 2 for Abilene), the ingressrouters aggregation has the lowest false-positive rate of thethree traffic aggregations studied for both networks.
On the other end of our aggregation spectrum, input links’false-positive rate suffers as a result of a large fraction ofsmall flows. Abilene input links is particularly bad in fig-ure 4(c) in that its false-positive rate never goes below 40%.It holds across both networks that, at their respective ap-propriate topk values, the input links aggregation has thehighest false-positive rate of the three formalisms. We be-lieve this can be largely contributed to an excess of smallflows whose natural variance cause alarms to be raised bythe PCA traffic anomaly detector.
For the Abilene network (figures 4(c) and 4(d)), it seemsclear that OD-flows is the traffic aggregation that achievesthe best overall trade-off between total detections and false-positive rate. Our findings support earlier papers [14] thathave demonstrated that OD-flows is a fruitful traffic aggre-gation for detecting network anomalies. For this same rea-son, it is doubly frustrating that we are prevented from try-

11/21 11/22 11/23 11/24 11/25 11/26 11/27 11/28−5
−4
−3
−2
−1
0
1
2
3
4
2005
geant ingress routers
PC3−projection
(a) Geant ingress routers
11/21 11/22 11/23 11/24 11/25 11/26 11/27 11/28−20
−10
0
10
20
30
40
50
2005
abilene OD flows
PC2−projection
(b) Abilene OD flows
2 3 4 5 6 7 8 9 100
2
4
6
8
10
12
14
16
18
# principal components
perc
ent v
aria
nce
capt
ured
abilene OD flows (threshold = 90%)
scree plotHumphrey−Ilgen variant
(c) Abilene OD flows
Figure 5: Determining the topk parameter
ing the OD-flow aggregation for the Geant network due tothe reasons explained in section 3.3.
4.1.3 Evaluating Top-K Selection TechniquesWe’ve demonstrated that (i) PCA is very sensitive to the
topk parameter, and (ii) that its appropriate value variesfrom one setting to the next. For PCA’s effective operationas a traffic anomaly detector, it is therefore essential thatthere are automated techniques for determining the propersetting of the topk parameter. Unfortunately, current re-search does not provide any reliable such techniques. Twotechniques that have been used include (i) determining topk
by visually inspecting the scree plot — a method referred toas Cattell’s Scree Test [5] in the statistics literature, and (ii)
retaining the first k principal components that do not con-tain a 3σ deviation from the mean when the traffic matrixis projected upon them.
We’ve evaluated the effectiveness of the 3σ heuristic infigures 5(a) and 5(b). Each figure shows the result of pro-jecting the respective traffic matrices onto the first principalcomponent that results in a 3σ deviation from the mean(the ±3σ deviation is represented by the upper and lowerdashed horizontal lines). That is, there is a 3σ deviation forthese principal components because the solid lines exceedthe boundary of the dashed lines. Specifically, figure 5(a)shows such a deviation for the third principal component,which means that the 3σ heuristic suggests retaining twoprincipal components in the Geant ingress routers normalsubspace. Our results in figure 4(a) indicate that this wouldlead to a false positive rate that is three times as high asideal. Likewise, figure 5(b) shows that the same heuristicsuggests keeping only a single principal component for theAbilene OD flow normal subspace. While we are not includ-ing the result here, the 3σ heuristic also suggests keepingzero principal components for the Abilene ingress routersnormal subspace, which is not possible. It is therefore clearthat this heuristic is not robust. On the other hand, how-ever, one can legitimately question whether principal com-ponents with such large spikes can capture normalcy; wewill address this question in section 5.1.
In figure 5(c) we have evaluated the effectiveness of Cat-tell’s Scree Test. The knee of the scree plot appears to beat k = 3 but we determined previously that a topk value ofk = 5 seems to achieve the best results. In general, Cattell’sScree Test is within one or two principal components, butthere appears to be no predictable pattern to the deviation.
Humphrey-Ilgen parallel analysis [17] is an automated sta-tistical technique for determining the number of principalcomponents to keep. The method determines the numberof principal components to retain by the intersection pointof two curves representing the cumulative eigenvalues of thetraffic matrix and an equivalently-sized random matrix. Theintuition behind this method is to only include principalcomponents that contribute more variance than a randomvector would (i.e., those before the intersection point). Forour purposes, a more effective metric is to compare wherethe respective scree plots intersect. Figure 5(c) plots thescree plots for a traffic matrix from our study in additionto an equivalently-sized random matrix. It should not besurprising that the scree plot for the random matrix (i.e.,“Humphrey-Ilgen variant”) is nearly horizontal, given thatevery principal component of a random matrix is expectedto capture the same variance. The scree plot for the trafficmatrix appears to have a knee at k = 2 but Humphrey-Ilgenretains far more principal components than this (i.e., the twocurves do not intersect anywhere in plotted interval).
We are therefore left with no reliable technique for tuningthe topk parameter3. Cattell’s Scree Test performs the bestin that it is often within one or two principal components ofthe operating point that minimizes the false-positive rate,but we’ve demonstrated that PCA’s false-positive rate canbe very sensitive even within such a small range. While ourresults indicate that there does appear to be small rangesof topk values that perform better than others, there are
3We also evaluated Kaiser’s Criterion [9], which is anotherautomated technique for determining topk, but omit the re-sult because it performed even poorer than Humphrey-Ilgen

fundamental problems with even the concept of the topk pa-rameter that limit the potential success of any such schemefor determining which principal components to include inthe normal subspace. We will discuss this intrinsic limita-tion in section 5.1.
4.2 The Detection ThresholdThe threshold parameter specifies how statistically signifi-
cant a given outlier must be for a PCA-based traffic anomalydetector to report it. Therefore the total number of detec-tions will always decrease monotonically as a function of thethreshold. The false-positive rate, while generally decreas-ing as a function of the threshold, need not always decrease.The reason for this is that one may cease to detect true pos-itives (that are less statistically significant) before ceasingto detect false positives, as can be observed in figure 6(c).
Figure 6 provides further support for the conclusion thatthe relative properties of traffic aggregation formalisms ap-pear to hold across networks. That is, for a given topk
value but across all thresholds and both networks, the inputlinks aggregation generally detects more potential anoma-lies than OD-flows, which detects more potential anomaliesthan ingress routers (see figures 6(b) and 6(d)). We believethis to be the case because the input links aggregation tendsto produce less multiplexed data than OD-flows, which inturn produces less multiplexed than the ingress router ag-gregation. For both Abilene in figure 6(c) and Geant infigure 6(a), one can conclude that the input links aggrega-tion has a higher false-positive rate than each of the others.Finally, figures 6(c) and 6(d) reinforce the perception thatOD flows is probably the aggregation that achieves the bestbalance between false-positive rate and total number of de-tections.
Our results indicate that the threshold provides operatorswith an intuitive knob to trade off the false-positive rate andtotal number of detections.
5. INTRINSIC LIMITATIONS OF PCAIn this section, we highlight two key limitations of PCA
that limit its effectiveness as a traffic anomaly detector. Sec-tion 5.1 illustrates how a sufficiently large anomaly may in-advertently pollute PCA’s definition of normal traffic, andsection 5.2 examines the difficulty of identifying the set offlows responsible for a statistical anomaly.
5.1 Contamination of the Normal SubspaceUsing PCA to detect traffic anomalies relies on the as-
sumption that the top few principal components representthe normal traffic, and the anomalies lie in the remainingcomponents. However, in some cases, a sufficiently largeanomaly may introduce so much variance in the traffic ma-trix that it is included in one of the first few principal compo-nents, thereby contaminating PCA’s definition of normality.Our analysis in the previous section intentionally avoidedtime periods with dramatic network events to avoid undulydegrading PCA’s false-positive rates4. Therefore, to demon-strate the effects of polluting the normal subspace, we an-alyze a separate (unlabeled) trace for the Geant networkbetween November 12-20, 2005. Since we have not classifiedall of the detected anomalies during this period, we cannot
4However, figure 5(b) shows that even moderately sizedevents can contaminate the very first principal component
0.9 0.92 0.94 0.96 0.98 10
0.5
1
1.5
2
2.5
3
3.5
4
4.5
5
detection threshold
perc
ent f
alse
pos
itive
s
geant
ingress routers (topk=3)input links (topk=2)
(a) Geant false-positive rate
0.9 0.92 0.94 0.96 0.98 10
20
40
60
80
100
120
140
160
detection threshold
tota
l det
ectio
ns
geant
ingress routers (topk=3)input links (topk=2)
(b) Geant total detections
0.9 0.92 0.94 0.96 0.98 10
5
10
15
20
25
30
35
40
45
detection threshold
perc
ent f
alse
pos
itive
s
abilene
ingress routers (topk=2)OD flows (topk=5)input links (topk=2)
(c) Abilene false-positive rate
0.9 0.92 0.94 0.96 0.98 10
500
1000
1500
detection threshold
tota
l det
ectio
ns
abilene
ingress routers (topk=2)OD flows (topk=5)input links (topk=2)
(d) Abilene total detections
Figure 6: Impact of detection threshold on false-
positive rate and total detections

06:00 12:00 18:00 00:000
0.5
1
1.5
2
2.5
3x 10
6
November 15th 2005
# pa
cket
s
(a) Geant network-wide traffic
06:00 12:00 18:00 00:001
2
3
4
5
6
7
8
November 15th 2005
cum
ulat
ive
# de
tect
ions
(b) Geant ingress routers
06:00 12:00 18:00 00:000
5
10
15
20
25
30
35
40
November 15th 2005
cum
ulat
ive
# de
tect
ions
(c) Geant input links
Figure 7: A large outage is included in PCA’s model of normalcy and hence goes largely undetected by PCA
produce false-positive rates for this trace, though we expectthe erroneous definition of “normal” traffic would increasethe false-positive rate.
Figure 7(a) plots the aggregate traffic on the Geant net-work for eighteen hours on November 15, 2005. The plotshows several clear outages that caused a significant dropin the aggregate traffic; in fact, only two routers carriedany traffic at all during these fifteen-minute windows. Fig-ures 7(b) and 7(c) plot the cumulative detections by PCAover this 18-hour period for the ingress-router and input-linkaggregations, respectively. While figure 7(b) has three spikesin the number of detections that coincide with spikes seenin 7(a), the spikes in 7(b) correspond to only a small frac-tion of the total number of ingress routers. Although Geanthas 23 ingress routers, only eight detections are made dur-ing the entire 18-hour period. The input-link aggregation infigure 7(c) fares even worse in that the only visible spike iscorrelated with the first drastic network event seen in fig-ure 7(a). In addition, the spike in figure 7(c) correspondsto less than 13% of all links, whereas the outage at thatmoment caused 75 out of 77 input links to carry 0 packets.
When a large network event contaminates the normal sub-space, PCA may not detect the anomaly, and its inclusionin the normal subspace may yield false positives or falsenegatives for other traffic. Our results suggest that it is im-portant to preprocess the data to identify and remove largeanomalies before constructing the normal subspace. [11] pre-sented a potential technique for identifying when such largeoutliers are included in the normal subspace, but no tech-niques have been evaluated for subsequently smoothing thenormal subspace (to our knowledge). Even if smoothingtechniques could be identified (e.g. exponential weightedmoving average, EWMA), their applicability could poten-tially be limited to the large-scale anomalies seen in fig-ure 7(a). Medium-sized anomalies would be more problem-atic, as they might easily evade a coarse-grained filteringscheme and still unwittingly pollute the normal subspace.
5.2 Identifying the Anomalous FlowsPCA detects anomalous time bins, not anomalous flows.
That is, PCA reports an anomaly when a measurement vec-tor ~vi is expressed primarily by the anomalous subspace.However, PCA provides no direct mapping between thesesubspaces and the original flows, which makes it difficult toidentify the flow(s) responsible for the anomaly. Previousstudies have applied a heuristic [12, 10, 13] that associates
an anomaly with the r flows with the largest contribution to~vi, such that the r flows are big enough to account for thespike in the anomalous subspace. Unfortunately there is noa priori reason for why the r flows with the highest entropyvalue at time i must necessarily correspond to the flows thatcaused PCA to detect an anomaly. In fact, this heuristic canunduly trigger alarms in some flows much more frequentlythan others.
To illustrate this “heavy hitter” phenomenon, figure 8plots the CDF of the percentage of the anomalies that areattributed to the various flows, where we ranked the flows inorder of how many anomalies the heuristic associates withthem. For example, in figure 8(a), a single ingress router isassociated with 70% of all PCA alarms on the Geant net-work. Each of the other aggregations show similar types ofskewed flow-identification distributions. For example, 29%of OD-flows in the Abilene network did not contribute toa single alarm during the studied week. Although we donot necessarily expect a uniform distribution, the skew inthe five graphs is a natural consequence of a heuristic thatranks flows in order of their entropy values.
Mapping an anomalous time bin to one or more respon-sible flows is inherently challenging, since PCA operates onaggregated measurement data and remaps the data to an-other subspace. Moreover, the inaccuracies of the previouslyemployed heuristic very likely increased the false-positiverates reported in our study. That is, the PCA techniqueitself may have identified a legitimate anomalous time-bin,but it was identified as a false-positive because the heuristicassociated this anomaly with an incorrect flow. We there-fore believe that creating more effective heuristics is a veryimportant avenue for future work. For example, it may bebetter to identify the r flows that exhibit the greatest vari-
ance along the anomalous subspace around the time of de-tection. While still only a heuristic, with associated short-comings, this approach may more closely capture the notionof a sudden anomalous event. The difficulty of identify-ing the anomalous flows is a fundamental problem of PCA,which begs the question of whether other anomaly-detectiontechniques (i.e., that operate on the raw data, rather thanan aggregated and transformed variant of the data) are moreappropriate for applications where network operators needto pinpoint the location(s) of an anomaly.

0 5 10 15 200
10
20
30
40
50
60
70
80
90
100topk = 3 and threshold = 90%
flow ID
cum
ulat
ive
perc
ent d
etec
tions
(a) Geant ingress routers
0 10 20 30 40 50 60 700
10
20
30
40
50
60
70
80
90
100topk = 4 and threshold = 90%
flow ID
cum
ulat
ive
perc
ent d
etec
tions
(b) Geant input links
0 2 4 6 8 100
10
20
30
40
50
60
70
80
90
100topk = 2 and threshold = 90%
flow ID
cum
ulat
ive
perc
ent d
etec
tions
(c) Abilene ingress routers
0 20 40 60 80 100 1200
10
20
30
40
50
60
70
80
90
100topk = 4 and threshold = 90%
flow ID
cum
ulat
ive
perc
ent d
etec
tions
(d) Abilene OD flows
0 50 100 1500
10
20
30
40
50
60
70
80
90
100topk = 4 and threshold = 90%
flow ID
cum
ulat
ive
perc
ent d
etec
tions
(e) Abilene input links
Figure 8: The heavy-hitter flow phenomenon
6. RELATED WORKLakhina et al. popularized using PCA for traffic anomaly
detection in [14, 12, 10, 13]. The work showed that traffictraces have low intrinsic dimensionality, that PCA can de-tect network-wide anomalies when analyzing the OD flowsaggregation, and can detect a wide variety of types of anoma-lies when analyzing entropy timeseries of IP header features.PCA has also recently been combined with sketches [15]and distributed monitors [16] to provide more efficient traf-fic anomaly detection. This entire body of work used thesame dataset, however, for which Lakhina’s PCA code washighly optimized.
In [22], PCA was one of many algorithms evaluated in ageneral system that aimed to infer network-level anomaliesfrom available data aggregates. PCA has also been used tocorrelate BGP updates with underlying network events suchas link failures, resets, etc [21]. Other statistical methodsthat have been used for traffic anomaly detection includeKalman filters [19], wavelets [4], among others. Other in-herent limitations of PCA have also been discussed in thestatistics literature [18, 20].
7. CONCLUSIONPrevious work has shown that PCA can detect real anoma-
lies, but our work demonstrates that the challenges to us-ing PCA as a traffic anomaly detector have been under-stated and current methods for tuning PCA are inadequate.Lakhina et al. were able to achieve such promising earlyresults because of their great familiarity with both the tech-nique and the data. Subsequent PCA work in this lineage
used the same software, heuristics, and labeled data, whichunderstandably yielded equally strong results by utilizingalready highly optimized parameter-settings for the givencircumstance.
Starting with new data sets and exploring a range of pa-rameter settings, we show that selecting the appropriatevalue for topk is surprisingly difficult; small changes in topk
in either direction can have a significant influence on thefalse-positive rate. In addition, existing techniques for se-lecting topk are inadequate. In fact, we’ve shown that topk isa flawed concept in and of itself because the first few prin-cipal components need not capture a vast majority of thevariance in a traffic trace, nor are they necessarily periodic.The normal subspace may in fact become polluted by largeanomalies, which degrades the effectiveness of PCA. We alsodemonstrated that identifying the flow that caused a PCAdetection is a fundamentally hard problem. We showed thatthe previously employed heuristic could fail in many circum-stances, and may have the inadvertent side-effect of associ-ating the majority of detections with a small set of flows.
Our study suggests that using PCA for traffic anomalydetection is much more difficult than it appears. BeforePCA can be used for automated, unsupervised detectionof anomalous traffic, we need more effective techniques fordetermining the dimensionality of the normal subspace, pre-venting its contamination, and identifying flows responsiblefor a given PCA detection. In our ongoing work, we are alsoinvestigating other statistical techniques that may be ableto detect and identify anomalous traffic in a more robustmanner.
8. ACKNOWLEDGMENTSThe authors would like to thank Mark Crovella and Anukool
Lakhina for invaluable advice and feedback on applying PCAto traffic anomaly detection. The first author would fur-ther like to thank advisor Kai Li for continued support,and David Gardner for providing housing in Paris wherethe work was performed.
9. REFERENCES[1] Abilene Backbone Network.
abilene.internet2.edu/.
[2] Abilene Participation Agreement.abilene.internet2.edu/community/connectors/
AbileneConnectionAgreement2006.pdf.
[3] Bair, E., Hastie, T., Paul, D., and Tibshirani,
R. Prediction by supervised principal components.Journal of the American Statistical Association 101,473 (2006), 119–137.
[4] Barford, P., Kline, J., Plonka, D., and Ron, A.
A signal analysis of network traffic anomalies. In ACM
Internet Measurement Workshop (Marseille, France,2002), pp. 71–82.
[5] Cattell, R. B. The scree test for the number offactors. Multivariate Behavior Research 1 (1966),245–276.
[6] Geant Network. www.geant.net/.
[7] Hotelling, H. Analysis of a complex of statisticalvariables into principal components. J. Educ. Psy.
(1933), 417–441.
[8] Juniper J-Flow. www.juniper.net/techpubs/software/erx/junose61/swconfig-routing-vol1/
html/ip-jflow-stats-config2.html.
[9] Kaiser, H. F. The varimax criterion for analyticrotation in factor analysis. Psychometrika 23 (1958),187–200.
[10] Lakhina, A., Crovella, M., and Diot, C.
Characterization of network-wide anomalies in trafficflows. In ACM Internet Measurement Conference
(Taormina, Sicily, Italy, 2004), pp. 201–206.
[11] Lakhina, A., Crovella, M., and Diot, C.
Characterization of network-wide anomalies in trafficflows. Tech. Rep. BUCS-TR-2004-020, BostonUniversity Department of Computer Science, May2004.
[12] Lakhina, A., Crovella, M., and Diot, C.
Diagnosing network-wide traffic anomalies. In ACM
SIGCOMM (Portland, Oregon, USA, 2004),pp. 219–230.
[13] Lakhina, A., Crovella, M., and Diot, C. Mininganomalies using traffic feature distributions. In ACM
SIGCOMM (Philadelphia, Pennsylvania, USA, 2005),pp. 217–228.
[14] Lakhina, A., Papagiannaki, K., Crovella, M.,
Diot, C., Kolaczyk, E. D., and Taft, N.
Structural analysis of network traffic flows. In ACM
SIGMETRICS (New York, NY, USA, 2004),pp. 61–72.
[15] Li, X., Bian, F., Crovella, M., Diot, C.,
Govindan, R., Iannaccone, G., and Lakhina, A.
Detection and identification of network anomaliesusing sketch subspaces. In ACM Internet Measurement
Conference (Rio de Janeiro, Brazil, October 2006).
[16] Li, X., Bian, F., Zang, H., Diot, C., Govindan,
R., Hong, W., and Iannaccone, G. MIND: Adistributed multi-dimensional indexing system fornetwork diagnosis. In IEEE INFOCOM (Barcelona,Spain, April 2006).
[17] Montanelli, R.G. Jr., and Humphreys, L. G.
Latent roots of random data correlation matrices withsquared multiple correlations on the diagonal: Amonte carlo study. Psychometrika 41, 3 (1976),341–348.
[18] Schoelkopf, B., Smola, A., and Mueller, K.
Nonlinear component analysis as a kernel eigenvalueproblem. Neural Computation 10, 5 (1998), 1299–1319.
[19] Soule, A., Salamatian, K., and Taft, N.
Combining filtering and statistical methods foranomaly detection. In ACM Internet Measurement
Conference (Berkeley, California, USA, October 2005).
[20] Tipping, M. E., and Bishop, C. M. Mixtures ofprobabilistic principal component analysers. Neural
Computation 11, 2 (1999), 443–482.
[21] Xu, K., Chandrashekar, J., and Zhang, Z.-L. Afirst step toward understanding inter-domain routingdynamics. In ACM MineNet Workshop (Philadelphia,Pennsylvania, USA, 2005), pp. 207–212.
[22] Zhang, Y., Ge, Z., Greenberg, A., and Roughan,
M. Network anomography. In ACM Internet
Measurement Conference (Berkeley, California, USA,October 2005).
[23] Zhang, Y., Roughan, M., Duffield, N., and
Greenberg, A. Fast accurate computation oflarge-scale IP traffic matrices from link loads. In ACM
SIGMETRICS (San Diego, CA, USA, 2003),pp. 206–217.