sensor-web operations explorer (sox) for earth science air quality
TRANSCRIPT

1
Electronics system-integration technology conference ESTC2008, 1-4 Sept. 2008, Greenwich, London, UK
Sensor-web Operations Explorer (SOX) for
Integrated Air Quality Campaign12
Meemong Lee, Richard Weidner, Kevin Bowman, Adrian Sandu, Kumaresh Singh
1 1-4244-1488-1/08/$25.00 ©2008 IEEE. 2 ESTC paper #1088, Version 1, Updated 2008:4:24
[email protected], [email protected], [email protected]
Jet Propulsion Laboratory California Institute of Technology
4800 Oak Grove, Pasadena, CA 91109
[email protected], [email protected],
Department of Computer Science Virginia Polytechnic Institute and State University
Blacksburg, VA 24060
Abstract— Characterizing the atmospheric state and its
impact on air quality requires observations of trace gases,
aerosols, clouds, and physical parameters across temporal
and spatial scales that range from minutes to days and
from meters to more than10,000 kilometers. Constellations
of spacecraft, integrated air-borne campaigns, and
distributed sensor networks have been actively pursued to
achieve the needed multi-dimensional observation
coverage. Formulation of multi-platform integrated air
quality campaigns requires a rapid concept design
exploration capability that enables comprehensive
evaluation of a large number of candidate observation
scenarios. This paper describes Sensor-web Operations
Explorer (SOX) system developed under the contract with
the NASA Earth Science Technology Office (ESTO). The
SOX system provides a web-based exploration service that
allows a scientist to experiment collaborative observation
scenarios involving various platform types and instrument
types. The SOX system integrates a wide range of legacy
software tools employing the state-of-the-art software and
hardware technologies.
TABLE OF CONTENTS
1. INTRODUCTION .............................................................. 1
2. CONCEPT DESIGN FRAMEWORK .................................... 5
3. OSSE FRAMEWORK ....................................................... 7
4. SYSTEM ARCHITECTURE ................................................ 9
5. SUMMARY .................................................................... 11
REFERENCES ................................................................... 13
ACKNOWLEDGEMENT ...................................................... 13
BIOGRAPHY ..................................................................... 13
1. INTRODUCTION
Air pollution is a chemical, physical (e.g., particulate
matter size), or biological agent that modifies the natural
characteristics of the atmosphere in an unwanted way.
Gases such as carbon dioxide, methane, and fluorocarbons
(which contribute to global warming) and emissions from
fossil fuel burning have been identified as pollutants.
Understanding the chemical state and its impact on air
quality requires observations of multiple trace gases as well
as aerosols and their properties. In addition to the
chemistry that relates these gases and aerosols,
meteorological processes (such as convection and
transport) affect the vertical and horizontal distribution of
these gases and aerosols [1].
In order to accurately monitor the air quality, an
intelligent-observation strategy must be developed that can
achieve the necessary temporal, spatial, and spectral
coverage and resolution. Each observational asset provides
its own unique strengths and weaknesses in providing the
data necessary to assess the chemical state. Satellite
observations provide global coverage of multiple trace
gases. However, these observations may be limited in
vertical resolution and frequency of observation. As
depicted in Figure 1, aircraft and sonde observations can
complement the satellite data and provide additional
measurement details, but they are limited in their spatial
and temporal coverage compared to satellite observations
[2].
Figure 1 also illustrates the mathematical models involved
in establishing the relationship between atmospheric states
and measurements. The forward modeling establishes the
forward transformation of an atmospheric state to
measurement data while the inverse modeling establishes
the inverse transformation of the measurement data to
atmospheric state. The forward transformation process can
be simulated utilizing the models of observation systems

2
Figure 1. Sensor-Web Observation Scenario Design and Data Assimilation
and scenarios. The inverse transformation process can be
applied to the simulated measurements for evaluation of
the measurement quality with respect to retrieval methods
and data assimilation processes. The measurement quality
requirement can be decomposed into platform and
instrument performance requirements and operation-
scenario requirements.
The goal of the Sensor-web Operations Explorer (SOX) is
to implement a virtual multi-platform, multi-sensor
observation infrastructure that enables integrated air
quality campaigns. The goal is decomposed into four main
topics; Sensor-web Integrated Planner (SWIP), Sensor-
Web Architecture Model (SWAM), Measurement
Simulation and Distribution Service (MSDS), and Science
Performance Metric Evaluator (SPME) as shown in Figure
2. SWIP is for observation scenario design-space
formulation and population in terms of configuring
platforms and instruments. SMAM is for observation
system design-space formulation and population in terms
of parametric representation of the performance range of
the platforms and instruments. MSDS is for mission
simulation and mission data product synthesis utilizing the
platform and instrument performance parameters defined
by SWAM and operation scenarios defined by SWIP.
Finally, SPME is for analyzing the sensitivity of the
observation system and scenario design with respect to the
individual campaign and the integrated campaign.
A two-stage approach has been devised to coordinate the
multi-disciplinary activities involved in the four topic areas
as shown in Figure 3. The first stage is to develop a
mission design concept framework integrating the
observation scenario design and observation system
configuration activities. Section 2 discusses the mission
design concept framework with respect to quantitative
trade-space formulation and flexible population. The
second stage is to develop an air-quality OSSE framework
integrating the measurement simulation and retrieval
analysis activities. Section 3 discusses the OSSE
framework with respect to rapid evaluation of
measurement quality and science impact of the populated
design concepts.
The above two frameworks have been implemented
employing state-of-the-art information technologies.
Section 4 discusses the SOX system with respect to
software and hardware system architectures. A SOX web
site has been created to provide platform independent
services to atmospheric scientists (http://sox.jpl.nasa.gov).
Section 5 discusses the on-line services with respect to
exploration request submission and exploration result
dissemination. The Earth atmospheric scientists at JPL are
utilizing the SOX capabilities for evaluating future mission
concepts. Section 6 discusses the use case with respect to
operational processes and relevance to NASA-wide Earth

3
atmospheric science.

4
Figure 2. SOX System Modules
Figure 3. SOX System Modules—Functional Relationship
5
2. CONCEPT DESIGN FRAMEWORK
An important part of the design of complex systems is the
evaluation of the large number of potential alternative
designs. Due to the number and complexity of design
parameters, this design space is potentially huge and very
complex. Automating part of the design exploration task
can be an invaluable help in finding the optimal or near-
optimal settings of design parameters. The choice of the
most appropriate exploration strategy depends on the
nature of the parameters, such as their role in the model,
the dimensionality and structure of the design space
including the number and location of local optima. [3]
The SOX concept design framework provides parametric
representations of the atmospheric science missions that
can be used for automated design space exploration. The
automated design of space exploration is performed by
simulating measurements from potential design concepts
and evaluating the science return from those simulated
measurements. In order to simulate measurements with
fidelity sufficient for science return evaluation, the
measurement process must be accurately modeled
(including the atmospheric state, sampling strategy, and
observation system response).
Atmospheric Phenomena Representation: Understanding
the chemical state and its impact on air quality requires
observations of multiple trace gases as well as aerosols and
their properties. In addition to the chemistry that relates
these gases and aerosols, meteorological processes (such as
convection and transport) affect the vertical and horizontal
distribution of these gases and aerosols. Also, the surface
reflectance properties impact the visible- and ultraviolet-
wavelength range measurements.
In order to represent the natural phenomena relevant to the
measurement simulation, the natural phenomena data are
organized for surface and atmosphere as shown in Figure
4. The surface is divided into land and ocean surfaces. For
the land surface, the seasonal variation of the direct
reflectance spectrum is modeled [4]. For the ocean surface,
the direct and diffused reflectance spectra are modeled
including the chlorophyll density and wind speed variation
[5]. The phenomena model for the atmosphere is divided
into physical parameters, aerosols, and trace gases.
Observation Scenario Design Space: An observation
scenario describes when, where, and how the measurement
should be acquired. The measurement requirements can be
decomposed into platform configuration and instrument
configuration. The platform configuration includes orbit
parameters and scan-platform settings, while the
instrument configuration includes sampling frequency and
condition. The design-space formulation process addresses
creation of a parametric representation of the observation
scenarios and specification of the exploration range of the
scenario design parameters. The design-space population
process addresses expansion of the exploration range into
design specifications that can be evaluated.
Based on the platform geometry and sampling conditions,
the atmospheric path of the sample is traced. The
atmospheric state vectors are formulated for each
phenomena category as shown in Figure 4. The state
vectors are organized with respect to the atmospheric
layers (i.e., altitude). The physical parameters include
temperature, pressure, and humidity. The trace gases
include chemical composition of atmosphere including
ozone, methane, nitrogen oxides, and carbon oxides. For
ultraviolet and visible wavelength-range observation, the
aerosol and surface reflectance properties are also
represented. The aerosol is represented with five aerosol
types (black carbon, sea salt, dust, haze, and organic
material), and the integrated optical depth and single-
scatter albedo are derived.
Observation System Design Space: Science measurement
requirements drive the observation system performance
requirements. In order to quantitatively validate
observation system requirements, a set of parameters for
representing the performance range of platforms and
instruments that are directly relevant to measurement
quality has been defined. The platform performance-range
parameters include pointing accuracy and stability. The
instrument performance-range parameters are divided into
three types of properties (imager, spectrometer, and
radiometer), defining geometric projection (i.e., field-of-
view, point spread function), spectral transformation (i.e.,
line shape, line width, linearity), and intensity detection
(i.e., efficiency and signal-to-noise ratio (SNR)).
From the implementation perspective, an instrument
system is composed of optics, detector, and electronics
subsystems. The design trade space can be formulated by
mapping the performance requirement parameters to
implementation-specific design parameters. Figure 5
illustrates the mapping between the requirement
parameters and instrument subsystem design space. The
platform altitude and orbit affect optics design .and
thermal design. The instrument SNR and spectral range
requirements drive the focal array design, and the spectral
linearity requirement drives mechanical design. The inter-
subsystem dependencies define the design trade space. For
example, focal array, thermal structure, and mechanical
structure are tightly coupled in providing the required SNR
performance. The concept design framework enables a

6
science-driven performance range specification providing a
validated design trade space for the observation-system
developers.
Figure 4. Typical Atmospheric State Representation

7
Figure 5. Instrument Design-Trade Relationships
3. OSSE FRAMEWORK
The SOX OSSE framework integrates forward modeling
and inverse modeling methods to provide a process for
measurement simulation and science-return evaluation.
The retrieval analysis process is referred to as “inverse
modeling,” while the observation simulation is referred to
as “forward modeling” depicting the reversal of the input
and output relationship between the observation process
and the retrieval analysis. The measurement simulation
process takes the atmospheric state described in previous
section as an input. The forward modeling process
transforms the atmospheric state into measurement data by
emulating the atmospheric phenomena and measurement
device. The inverse modeling process estimates the density
profile of a selected chemical component (e.g., ozone) from
the measurement data.
Forward Modeling: For each atmospheric state, there is a
corresponding measurement, determined by the physics of
the measurement, which is referred to as forward function.
A forward model is an approximate representation of the
forward function, which is constructed based on how the
measuring device works and how the information is
extracted from the measurements. The two major forward-
modeling components are: 1) radiative transfer function
(which defines the monochromatic radiance emerging
from an atmospheric path); and 2) instrument performance
(which defines signal detection sensitivity, distortion, and
noise).
The SOX OSSE framework utilizes Line By Line
Radiative Transfer Model (LBLRTM) and Linearized
Discrete Ordinate Radiative Transfer model (LIDORT)
software implementations for computing radiance spectra
of the samples for which location and observation time are
identified during the observation-scenario design. The
computed radiance spectra represent phenomena input to
the candidate instrument designs for which performance
parameters are prescribed during the observation system
design.
The measurement data are simulated based on the
performance parameter setting of each instrument case.
Figure 6 illustrates the simulation process of spectrometer
and radiometer properties. First, a bandpass filtering is
applied to extract the specified spectral range from the
input radiance spectrum. Second, a convolution kernel is
formulated based on the line shape and line width
specification. The convolution kernel is applied to the
bandpass filtered spectrum while observing the specified
linearity variation. Third, after the convolved signal
radiance is converted to photon counts, the SNR property
is simulated by scaling the signal strength and adding the
system noise. Finally, the noisy signal is quantized within
the specified digital number range.

8
Figure 6. Point Spectrometer Simulation Process
Inverse Modeling: The retrieval analysis may be applied to
any subset of the atmospheric state. The SOX system
focuses on retrieving the trace gases that are relevant to air
quality such as O3, CO, NO2, and SO2. The trace-gas
density is estimated by applying the inverse averaging
kernel to the measurement. The evaluation process
involves the following three steps: 1) add simulated noise
to the measurement, the atmospheric state profile, and the
Jacobean radiance; 2) perform a linear retrieval that
computes the averaging kernel, retrieval gain, and vertical
resolution; and 3) calculate the retrieval-error statistics and
distribution with respect to the measurement requirement
parameters explored.
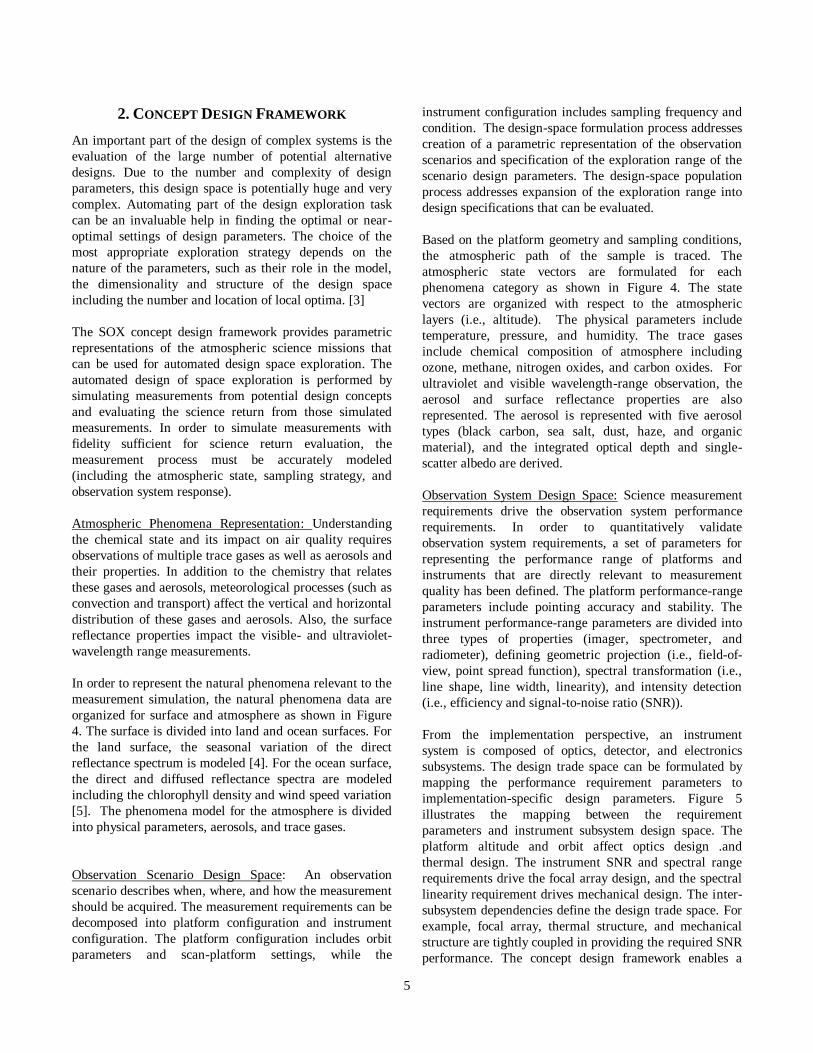
The retrieval accuracy is used to formulate a statistical
distribution of the sensitivity of the design parameters such
as sampling frequency, spectral resolution, and SNR. The
sensitivity analysis provides a quantified design impact on
science-return, thus allowing science-driven requirement
formulation. Figure 7 illustrates a retrieval analysis result
with respect to vertical resolution, bias, and error as the
measurement quality varies in terms of spectral resolution
and SNR. The statistics were obtained from 8 days of low
Earth orbit observation in 30-minute intervals.
9
Figure 7 Instrument Performance Range and Retrieval Analysis Result Statistics
(Display tool: ATSV – advanced trade space visualizer developed by M. Yukish)
4. SYSTEM ARCHITECTURE
The software modules of SOX are divided into four areas:
graphical-user interface, parallel-execution script,
program-execution interface, and application program.
The user interface modules include interactive design
tools, visualization tools, and web pages. The software
development utilizes the C# programming language and
Microsoft’s .Net framework. The web application
development utilizes .Net ASP (active server pages) with
asynchronous Java script and XML (AJAX) extensions.
The parallel execution scripts perform a task-level load-
balancing where each node executes the same process on
different datasets.
The program interface modules are responsible for
providing a streamlined process by performing command-
line parsing, file I/O, and database interfaces for
application programs. The application programs perform
the core computation steps including modeling and
simulation, retrieval analysis, and phenomena model
translation. Each software module has been evaluated with
respect to functionality, operability, and computational
efficiency.
Software System Architecture: The four topic areas of
SOX, SWIP, SWAM, MSDS, and SPME provide unique
user interfaces, data services, and legacy tools in order to
stream line the entire chain of air quality campaign
exploration process. Figure 8 describes the software focus
of each topic area in terms of generic capabilities and
specific application services. The generic capabilities
address development of abstraction methods, extensible
descriptors, interface protocols, etc. The specific
application services address seamless integration of legacy
tools, external models, and user platform environment.
The implementation details of the two types of capabilities
are described below.
SWIP provides platform-unique observation scenario
design tools. Currently, two types of space-borne
observation-scenario design tools are in operation, GEO
for geo-stationary and LEO for low-Earth orbiters. The
design tools are implemented on a Windows platform
utilizing .net framework and high-end graphics tools so
that the sampling strategy can be interactively validated
prior to generating the final sample list. The interactive
validation capabilities allow a scientist to verify Sun
incidence angle, surface coverage, sampling frequency,
and other measurement quality sensitive factors. The
observation-scenario design tools for air-borne and in-situ
platform types are under development.
SWAM provides two types of model integrators, a platform
model integrator and an instrument model integrator. The
instrument model integrator provides generic instrument
subsystem classes for imager, spectrometer, and radiometer
and an instrument class. A virtual instrument system can
be dynamically configured integrating the three instrument
subsystem classes. The platform model integrator provides
generic platform subsystem classes for attitude control,
navigation, and command and data handler. A virtual
platform can be dynamically configured integrating the
platform subsystems.

10
MSDS provides two types of simulators, an input signal-
radiance spectrum simulator and a measured radiance
spectrum simulator. The input-signal radiance spectrum
simulator implements XML-based atmospheric state
composition and command line interfaces (CLI) to the
legacy forward model software modules. The on-line
simulation services are operated by three software modules,
a request manager, resource manager, and an execution
manager. The request manager logs exploration requests
and translates the requests to command lines. The resource
manager monitors the availability of the computational
resources and informs the execution manager as a resource
is available. The execution manager dispatches the
command lines to the available resource.
SPME integrates atmospheric science analysis tools for
retrieval analysis, retrieval sensitivity analysis, data
assimilation, and prediction accuracy analysis. The
integration process provides micro-windowing of
measurement data for integrated campaign synthesis,
dynamically configurable instrument performance
sensitivity analysis, and interactive multi-parameter space
visualization. In order to track the progressive nature of
the data-assimilation process, animation product
generation tools are also provided.
Figure 8. SOX System Software Architecture
11
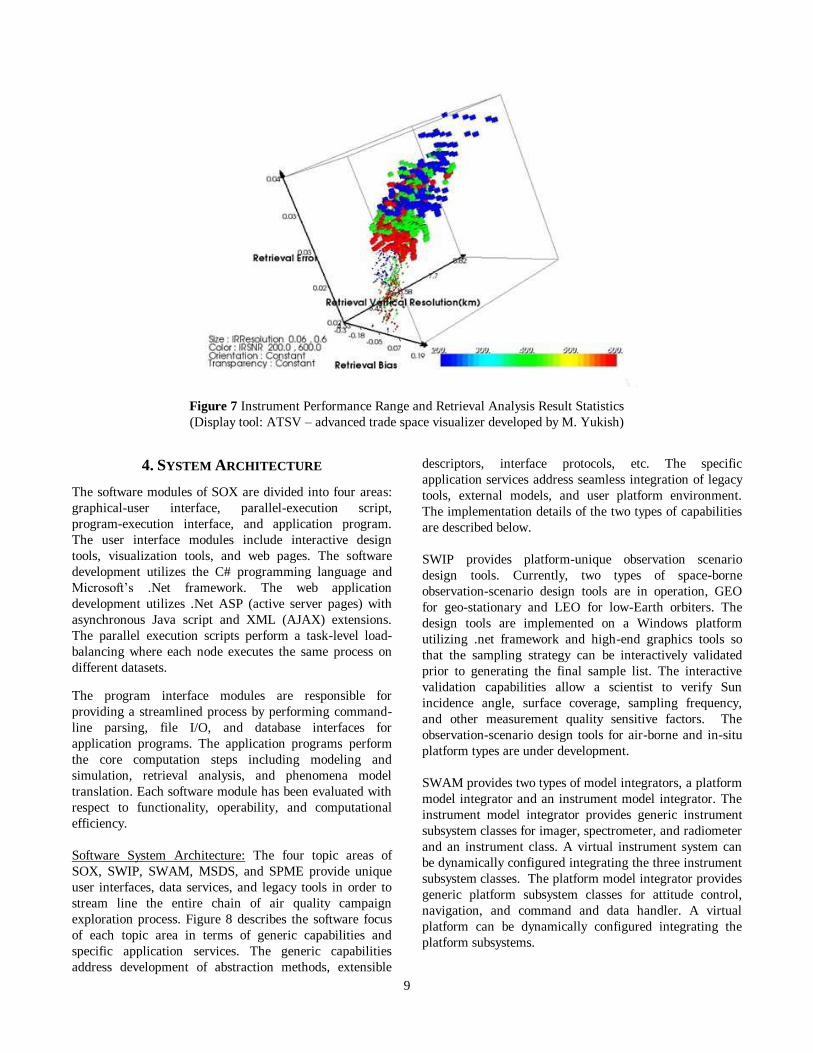
Hardware System Architecture: The SOX implements a
scalable hardware architecture where the scalable unit is
designed to handle the heterogeneous nature of the concept
design exploration process. The heterogeneous nature
includes on-line service, database management, batch job
computation, and interactive visualization. The SOX unit
system is composed of two types of servers, a user and data
server and a computation server, as shown in Figure 9.
The user and data server system is composed of a web
server and a database server. The web server is used for
hosting and administering the SOX web site. The database
server is used for managing experiment requests and
execution status. The computation server includes a
shared memory system and a distributed system. The
shared-memory system is used for tightly coupled parallel
software while the distributed-memory system is used for
generalized multi-tasking. The two types of servers share a
network system and a memory system.
The SOX system can be populated by as many unit systems
as required since there is no communication between the
unit systems. Also, the component processor of the SOX
unit system may be different from unit to unit allowing the
SOX system to evolve freely as the processor technology
progresses. The cost-effective expansion and maintenance
of the SOX system are achieved by employing a scalable
unit architecture with uniform functionality while each
unit can be implemented integrating the state-of-the-art
component systems.
.
Figure 9. SOX System Hardware Architecture
5. SUMMARY
Processes governing the distribution and evolution of trace
gases and aerosols have a profound impact on air quality
and climate. Trace gases and aerosols cannot only affect
air quality, but they may also impact regional and global
climate through longer-lived greenhouse gases, e.g., ozone,
CO2, and CH4 Aerosols can have a net cooling or heating
effect depending on their type and vertical distribution.
The quantification of these processes requires an integrated
approach that combines observations from satellites,
aircraft, sondes, and surface measurements with chemistry
and transport models acting on both regional and global
scales. In addition to remote sensing, advances in global
chemistry and transport models along with 4-D variational
assimilation techniques provide powerful tools for the
development of sensor webs that could, in principle, be
deployed at operational time scales to provide up-to-date
information on air pollution useful for decision support as
well as enhanced scientific return.
The SOX system is an integrated software infrastructure
that combines these observations with models and data-
assimilation tools, that permit a focused analysis of the
chemical state, and that can adapt to meteorological and

12
chemical “events” over daily time scales. Figure 10
illustrates the four-step process for performing an
integrated campaign using the on-line SOX service. Steps
1 and 2 are supported by the concept design framework
while steps 3 and 4 are supported by the OSSE framework.
The exploration process needs to be iterated for maturation
of a complex sensor web operation scenario design.
The integrated campaign plan describes the assets used in
a sensor web along with the assimilation and modeling
technologies that combine these assets. These plans have
been developed based on the experience provided from
previous integrated campaigns sponsored by both NASA
and NOAA. These approaches, which have been limited
primarily to regional atmospheric chemistry, are being
extended to global atmospheric chemistry challenges.
Based on the experience from the NASA INTEX-B
campaign, we are developing an integrated campaign plan
that will focus on a hypothetical sensor web for
understanding long-range transport of pollution from Asia
to North America. This campaign took place from March
through May 2006 and used a variety of satellites along
with the NASA DC-8 aircraft. Initially, we will use actual
flight plans from the DC-8 and TES satellite overpasses to
determine in simulation the impact of these assets on
transpacific flux calculations of ozone into North America.
After baselining from these observations, we will consider
whether the DC-8 deployment can be optimized based on
the 4D-variational adjoint calculations of GEOS-Chem.
This analysis will then be extended to multiple aircraft
measurements
Figure 10 Space-borne Observation Experiment Process
13
REFERENCES
[1] M. Luo and R. Beer, “Simulated Observation of
Tropospheric Ozone and CO with the Tropospheric
Emission Spectrometer (TES) Satellite Instrument,” J.
Geophys. Res., 107, D15, 2002. [page range? And/or
10.1029/2001JD000804]
[2] C.D. Rodgers, Vol. 2, Inverse Methods for Atmospheric
Sounding: Theory and Practice, World Scientific
Publishing, Series on Atmospheric, Oceanic and
Planetary Physics, Singapore, 2000.
[3] J. Jannek, R. Esser, “Higher-Order Modeling and
Automated Design-Space Exploration”. Proceedings
High-Performance Computing (HPC) 2003, Adrian
Tentner (ed), January, 2002
[4] MODIS land surface reflectance _______________
[need reference]
[5] Sea surface reflectance modeling _______________
[need reference]
[6] S.A. Clough, M.W. Shephard, E.J. Mlawer, J.S.
Delamere, M.J. Iacono, K. Cady-Pereira, S.
Boukabara, and P.D. Brown: “Atmospheric Radiative
Transfer Modeling: a Summary of the AER Codes,”
JQSRT, 91:233–244, 2005.
[7] M. Lee, A. Eldering, C. Miller, and Z. Qu, “Earth
Science Mission Concept Design System,” presented
at 2007 IEEE Aerospace Conference, Big Sky, MT,
2007.
[8] T. Chai, G. R. Carmichael, A. Sandu, Y. Tang, and
D.N. Daescu: “Chemical Data Assimilation of
Transport and Chemical Evolution over the Pacific
(TRACE-P) Aircraft Measurements,” Journal of
Geophysical Research, Vol. 111, D02301,
DOI:10.1029/2005JD005883, 2006.
[9] M. Lee and R. J. Weidner, “Virtual Mission Systems
for Multi-disciplinary Engineering Design,” presented
at AIAA SpaceOps-2005, Long Beach, CA, 2005.
ACKNOWLEDGEMENT
The research described in this paper was carried out at the
Jet Propulsion Laboratory, California Institute of
Technology, under a contract with the Advanced
Information System Technology (AIST) program under the
Earth Science Technology Office (ESTO) of the National
Aeronautics and Space Administration (NASA).
BIOGRAPHY
Meemong Lee is a principal
engineer at the Jet Propulsion
Laboratory in the areas of
modeling and simulation Her
current research activities include
model-based collaborative
engineering frameworks, sensor-
web operation design architecture,
and simulation-based measurement
requirement formulation. She is also responsible for
mission simulation system development for NASA’s Juno
project. She has a bachelor’s degree in electronics
engineering from Sogang University in South Korea, a
master’s degree in computer science from Oklahoma State
University, and a doctoral degree in electrical engineering
from Oklahoma State University.
Richard J. Weidner is a principal
technologist at the Jet Propulsion
Laboratory in the areas of multi-
disciplinary technology development.
He led the mission simulation and
instrument modeling group at JPL
during 1998–2006. He has invented
numerous real-time distributed
mission simulation systems including include SIMP-
SASED for Mars Pathfinder’s panorama imaging camera,
Micro-Helm for Mars Odyssey, and MSVN-Cassini for
Cassini-Saturn Orbit Insertion. He is currently developing
multi-dimensional phenomena models for Juno mission
simulation and Earth atmospheric mission simulation .He
has a bachelor’s degree, a master’s degree, and doctoral
degree in Electrical Engineering from Oklahoma State
University.
Kevin W. Bowman received a B.
E.E. degree in electrical enginee
ring from Auburn University, Au
burn, AL, a Diplome de Specializ
ation en Traitement et Transmiss
ion des Informations from the Ec
ole Superieure d’Electricite (SU
PELEC), Metz, France, and an M.S. and a Ph.D. in electri
cal engineering at the Georgia Institute of Technology, At
lanta, in 1991, 1992, 1993, and 1997, respectively. He has
been a Member of the Technical Staff at the Jet Propulsio
n Laboratory, Pasadena, CA, since 1997. His primary rese
arch interests are in the area of atmospheric remote sensin
g and tropospheric chemistry including inverse modeling a
nd data assimilation from satellite observations, estimatio
n, and error analysis of trace gas profiles, and calibration
algorithms for infrared Fourier transform spectrometers.

14
Adrian Sandu has obtained the B.S.
/M.S. in Electrical Engineering from the Bucharest P
olytechnic Institute in 1990, the M.S. in Computer Sci
ence and the Ph.D. in Applied Mathematics from the
University of Iowa in 1997. His research interests are
in the area of computational science and engineering
. Sandu is currently an Associate Professor of Compu
ter Science at Virginia Tech and directs the Computat
ional Science Laboratory.
Kumaresh Singh has graduated from the Indian
Institute of Technology, Kharagpur in 2005 with
an Integrated Masters Degree in Mathematics and
Computing. He is currently a PhD candidate in the
Department of Computer Science at Virginia
Tech. Kumaresh joined Computational Science
Laboratory, Virginia Tech in Fall 2005 as a
Graduate Research Assistant.