sensors 2015 open access sensors - pdfs.semanticscholar.org · sensors 2015, 15, 18334-18359;...
TRANSCRIPT

Sensors 2015, 15, 18334-18359; doi:10.3390/s150818334
sensors ISSN 1424-8220
www.mdpi.com/journal/sensors
Article
Feasibility of Using Synthetic Aperture Radar to Aid UAV Navigation
Davide O. Nitti 1, Fabio Bovenga 2,*, Maria T. Chiaradia 3, Mario Greco 4 and Gianpaolo Pinelli 4
1 Geophysical Applications Processing s.r.l., Via Amendola 173, 70126 Bari, Italy;
E-Mail: [email protected] 2 National Research Council of Italy, ISSIA institute, Via Amendola 173, 70126 Bari, Italy 3 Dipartimento di Fisica “M. Merlin”, Politecnico di Bari, Via Amendola 173, 70126 Bari, Italy;
E-Mail: [email protected] 4 IDS—Ingegneria Dei Sistemi S.p.A., Via Enrica Calabresi 24, 56121 Pisa, Italy;
E-Mails: [email protected] (M.G.); [email protected] (G.P.)
* Author to whom correspondence should be addressed; E-Mail: [email protected];
Tel.: +39-80-592-9425; Fax: +39-80-592-9460.
Academic Editor: Felipe Gonzalez Toro
Received: 4 May 2015 / Accepted: 17 July 2015 / Published: 28 July 2015
Abstract: This study explores the potential of Synthetic Aperture Radar (SAR) to aid
Unmanned Aerial Vehicle (UAV) navigation when Inertial Navigation System (INS)
measurements are not accurate enough to eliminate drifts from a planned trajectory. This
problem can affect medium-altitude long-endurance (MALE) UAV class, which permits heavy
and wide payloads (as required by SAR) and flights for thousands of kilometres accumulating
large drifts. The basic idea is to infer position and attitude of an aerial platform by inspecting
both amplitude and phase of SAR images acquired onboard. For the amplitude-based
approach, the system navigation corrections are obtained by matching the actual coordinates of
ground landmarks with those automatically extracted from the SAR image. When the use of
SAR amplitude is unfeasible, the phase content can be exploited through SAR interferometry
by using a reference Digital Terrain Model (DTM). A feasibility analysis was carried out to
derive system requirements by exploring both radiometric and geometric parameters of the
acquisition setting. We showed that MALE UAV, specific commercial navigation sensors and
SAR systems, typical landmark position accuracy and classes, and available DTMs lead to
estimated UAV coordinates with errors bounded within ±12 m, thus making feasible the
proposed SAR-based backup system.
OPEN ACCESS

Sensors 2015, 15 18335
Keywords: UAV; navigation; Geo-referencing; SAR; interferometry; ATR; feasibility
1. Introduction
This study is devoted to explore the potentials of synthetic aperture radar (SAR) and Interferometric
SAR (InSAR) to aid unmanned aerial vehicle (UAV) navigation. Over the past decades, UAVs have
been increasingly used for a wide range of both civilian and military applications, such as
reconnaissance, surveillance and security, terrain mapping and geophysical exploration. The feasible
use of a UAV for a certain application relies on the accuracy and robustness of the navigation system.
The navigation of a UAV is controlled by the inertial navigation system (INS), which exploits different
sensors such as inertial measurement unit (IMU), radar altimeter (RALT) and global positioning
system (GPS) receiver. These sensors allow the UAV to measure the status vectors of the aircraft
(position, velocity, acceleration, Euler attitude angle and rates) needed to infer the actual trajectory
with enhanced accuracy. Thus, the INS defines the commands needed to change the status vectors in
order to guide the aircraft along the mission reference trajectory, or can be used to provide geo-referenced
products acquired onboard for ground control point free applications [1].
The INS performance and (consequently) the navigation accuracy depend on the performance of
such sensors and, in particular, on the IMU. It is made of three gyroscopes and three accelerometers,
which are used to calculate attitude, absolute acceleration and velocity of the aircraft [2]. One of the
main drawbacks of IMU is the rapid growth of systematic errors as bias and drift, which have to be
compensated by using the absolute positions measured by the GPS [3]. However, due to the low power
of the ranging signals, the received GPS signal is easily corrupted or completely obscured by either
intentional (e.g., jamming) or unintentional interferences. Moreover, along the UAV trajectory the
GPS signal can be also absent. When GPS data are not reliable or absent, the correction of the aircraft
trajectory through the IMU is consequently unfeasible.
This problem can affect in particular medium-altitude long-endurance (MALE) UAV, which has to
fly for thousands of kilometers before reaching its target. Cumulative drift (up to hundreds of meters)
during a long endurance flight can lead the UAV to miss the planned target with catastrophic
consequences on the mission [4]. Thus, future guidance systems for UAV autonomous missions have
challenging requirements for high reliability and integrity. To fully meet these new requirements, the
following capacities need to be radically improved: enhanced tolerance to GPS denial/jamming, higher
IMU performance, and reduced INS drift.
The aim of this work is to assess the feasibility of using SAR to aid a standard navigation system
when IMU measurements are not accurate enough to eliminate drifts from a planned trajectory.
Examples of SAR systems mounted onboard UAVs already exist (e.g., [5,6]) but not devoted to aid the
platform navigation. The basic idea is to infer position and attitude of an aerial platform by inspecting
both amplitude and phase of SAR images provided by a SAR system onboard the platform. SAR data
provide information on the electromagnetic microwave backscatter characteristics of the Earth surface
with day/night and all-weather capability, thanks to the active nature of radar sensors [7]. Moreover,
the SAR imaging is able to illuminate a wide area on the ground (up to several square kilometers) from

Sensors 2015, 15 18336
a long distance (up to tens of kilometers) by ensuring high spatial resolution (meters or less depending
on the bandwidth). These characteristics are advantageous with respect to other sensors (e.g., optical)
and make suitable the proposed backup navigation system.
In case of the amplitude-based approach, the system navigation correction can be based on a
comparison between processed SAR images and a terrain landmark Data Base (DB), which contains
the geographic coordinates of expected (during the UAV mission) ground landmarks (i.e., conspicuous
objects on land that unequivocally mark a locality). Let us assume that the scene acquired by the SAR
onboard the platform is populated by terrain landmarks (e.g., roads, buildings), which is quite likely in
several operating scenarios (e.g., rural, industrial, suburban). The image coordinates (range/cross-range) of
the expected landmarks can be automatically extracted by an Automatic Target detection and
Recognition (ATR) algorithm for SAR images [8]. Then, the coordinates of an image landmark have to
be correlated with the geographic coordinates of the corresponding landmark in the mission DB. Once
a match is found, a mathematical relation between range/cross-range landmark coordinates and
landmark geographic coordinates can be found and exploited to retrieve aircraft position. The whole
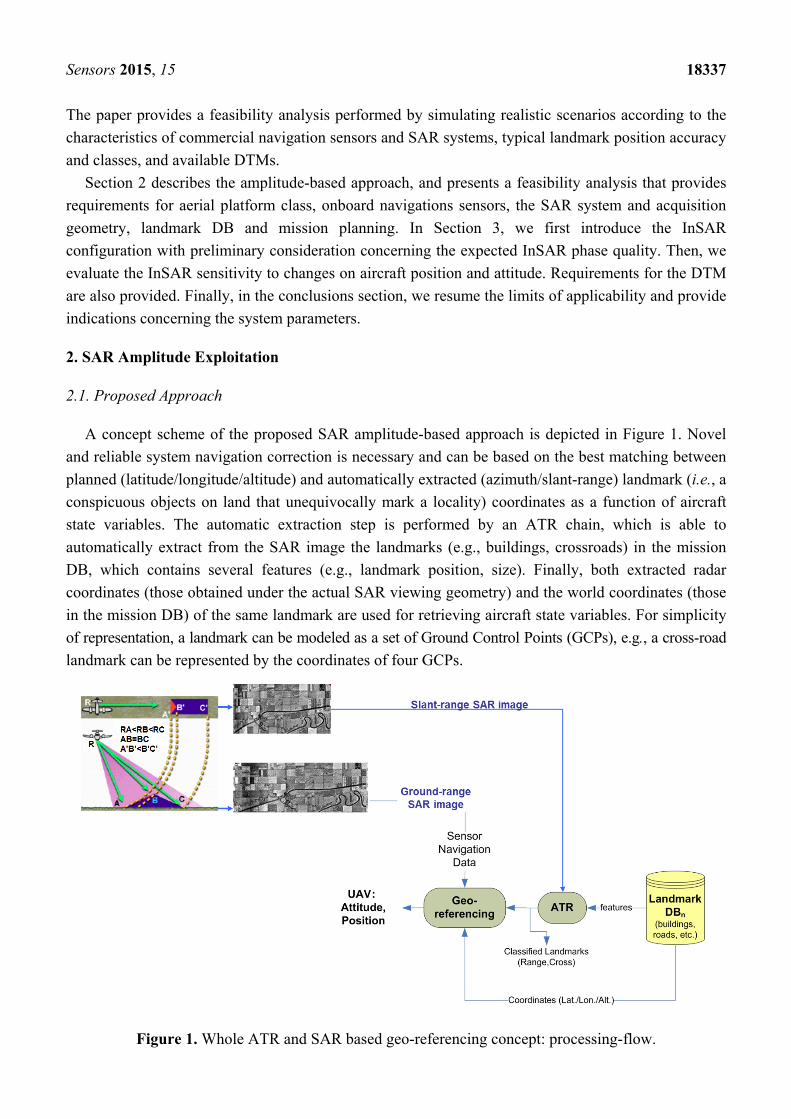
ATR and SAR based geo-referencing block is depicted in the processing flow in Figure 1. The onboard
SAR acquires an image under a certain viewing geometry; terrain landmarks in the focused image are
extracted by an ATR processing chain that is fed by a landmark DB; mission planned landmarks are
recognized by the ATR chain; the ATR block provides the coordinates of each landmark both in the
SAR coordinate system and in the DB inertial coordinate system; local and inertial coordinates of each
landmark, as well the initial aircraft attitude/position measurements (from the INS) are exploited by the
geo-referencing algorithm; the final output is the position of the aircraft in the inertial coordinate system.
When the use of SAR amplitude is unfeasible, the phase content of the SAR image is exploited
through a real time InSAR system mounted onboard the platform. By synthetically coupling SAR
images acquired by different positions [9], the InSAR system provides information about the radiation
path delay between two acquisitions, which includes the topography, and any difference occurred
between the two passes on the ground surface as well as in the atmospheric refractivity profile. The
InSAR phase derived by using a single-pass interferometry system avoids contributions from both
ground deformation and atmosphere, and is related only to the aircraft position and to the topography.
Therefore, by using both approximated position and attitude values of the platform, and a reference
DTM, it is possible to generate a synthetic InSAR phase model to be compared with respect to (w.r.t.)
that derived by processing the InSAR images. The geometrical transformation needed to match these
two terrain models depends on the difference between the actual values of position and attitude, and
those derived by the instruments available onboard. Hence, this matching provides a feedback to be
used for adjusting position and attitude when a lack of GPS signal leads to unreliable IMU data.
The goal of the paper is to propose an advance in the integration of radar imaging into UAV
navigation systems and to prove the technological feasibility of the proposed integrated system.
Nowadays, medium-altitude long-endurance (MALE) UAV class [10] permits heavy (in the order of
hundreds of kilograms) and wide (in the order of few square meters) payloads to be carried onboard,
during a long mission (in the order of few thousands of kilometers), thus making feasible the use of
SAR systems, which are more demanding than other sensors in terms of weight and space (the InSAR
configuration in particular). Some examples of MALE UAVs are Predator B, Global Hawk and Gray
Eagle, which are already equipped with SAR systems and can be also equipped with InSAR systems.
Sensors 2015, 15 18337
The paper provides a feasibility analysis performed by simulating realistic scenarios according to the
characteristics of commercial navigation sensors and SAR systems, typical landmark position accuracy
and classes, and available DTMs.
Section 2 describes the amplitude-based approach, and presents a feasibility analysis that provides
requirements for aerial platform class, onboard navigations sensors, the SAR system and acquisition
geometry, landmark DB and mission planning. In Section 3, we first introduce the InSAR
configuration with preliminary consideration concerning the expected InSAR phase quality. Then, we
evaluate the InSAR sensitivity to changes on aircraft position and attitude. Requirements for the DTM
are also provided. Finally, in the conclusions section, we resume the limits of applicability and provide
indications concerning the system parameters.
2. SAR Amplitude Exploitation
2.1. Proposed Approach
A concept scheme of the proposed SAR amplitude-based approach is depicted in Figure 1. Novel
and reliable system navigation correction is necessary and can be based on the best matching between
planned (latitude/longitude/altitude) and automatically extracted (azimuth/slant-range) landmark (i.e., a
conspicuous objects on land that unequivocally mark a locality) coordinates as a function of aircraft
state variables. The automatic extraction step is performed by an ATR chain, which is able to
automatically extract from the SAR image the landmarks (e.g., buildings, crossroads) in the mission
DB, which contains several features (e.g., landmark position, size). Finally, both extracted radar
coordinates (those obtained under the actual SAR viewing geometry) and the world coordinates (those
in the mission DB) of the same landmark are used for retrieving aircraft state variables. For simplicity
of representation, a landmark can be modeled as a set of Ground Control Points (GCPs), e.g., a cross-road
landmark can be represented by the coordinates of four GCPs.
Figure 1. Whole ATR and SAR based geo-referencing concept: processing-flow.

Sensors 2015, 15 18338
As a GPS denial occurs, the backup system triggers the SAR sensor for the next Way Point (WP)
and controls the radar beam steering onto the expected terrain landmark previously stored in the
onboard DB. The beam steering must ensure enough time on the landmark to gather the echo returns
needed to focus the raw data image. It is worth noting that the proposed approach and the feasibility
analysis here presented are more focused on the UAV platform, SAR system and navigation sensors
than on the image processing chain (SAR data autofocusing [5,6], ATR chain), which is beyond the
scope of this paper.
2.2. Basic Concepts and Geo-Referencing Procedure
The whole (SAR amplitude-based) geo-referencing procedure is depicted in the processing-flow in
Figure 1. It can be noted that viewing geometry and SAR geometrical distortions have to be considered
in order to derive a meaningful geo-referencing algorithm based on the recognition of landmarks in
SAR images. A basic viewing geometry of an SAR is shown in Figure 2a [8]: a platform flying with a
given velocity at altitude h carries a side-looking radar antenna that illuminates the Earth’s surface
with pulses of electromagnetic radiation. The direction of travel of the platform is known as the
azimuth direction, while the distance from the radar track is measured in the slant range direction.
The ground range and its dependence on the angle θ is also depicted. Note that in Figure 2b we
assumed the flat Earth approximation, which can be considered valid for the airborne case, even for
long-range systems [11]. Before presenting the proposed procedure, we introduce some quantities that
will be used in the following. A complete list can be found in Table 1.
Inertial system of coordinates: classically, it is the Cartesian system of coordinates. In the geodetic
literature, an inertial system is an Earth-Centred-Earth-Fixed (ECEF) frame where the origin is at the
Earth’s centre of mass, the (xecef, yecef) plane coincides with the equatorial plane, and the (xecef, zecef)
plane contains the first meridian) [12].
Local flat Earth: position of a point [ ], ,t
H H H Hx y z=p can be computed from a geodetic
latitude-longitude-altitude frame or an ECEF frame by assuming that the flat Earth zH-axis is normal to
the Earth only at the initial geodetic coordinates [13]. For our application, the flat Earth model can be
assumed if h << RE = 6370 km, where RE is the Earth radius and h is the SAR (or aircraft) altitude [11].
As a consequence, the coordinates for a specific ellipsoid planet can be easily computed resorting to
commercial software tool, such as in [14]. A pictorial view of ECEF and flat Earth (H) frame can be
found in Figure 2b.
Euler angles: angles that are used to define the orientation of a rigid body within an inertial system of coordinates [15] (see Figure 3). Such angles hereinafter will be also referred as attitude ( ), ,ψ θ ϕ .
Now, let us define a coordinate transformation of a point Hp from an inertial (H) frame to a new
coordinate system (C) [15,16]:
( ), ,C CC C H H Hγ ψ θ ϕ= +p t R p (1)
where every quantity is defined in Table 1. This transformation has some interesting properties [15]: if the ground was planar ( 0Hz = ), the transformation would be affine; ( ), ,C
H ψ θ φR can be factorized into
the product of three orthonormal-rotation-matrices; a parallel pair in the H domain remains parallel in

Sensors 2015, 15 18339
C; the transformation either stretches or shrinks a vector; typical SAR distortions (i.e., foreshortening,
layover, shadow in Figure 1 and in Figure 2a) are correctly modelled [16,17].
Equation (1) can be inverted as follows:
( ), ,H HH H C C Cγ ψ θ ϕ= +p t R p (2)
where every quantity is defined in Table 1. The main geometrical properties considered here are:
invariance to rotation of an SAR image with respect to its corresponding geographical map; invariance
to scale factor (stretch or shrink); invariance to translation; invariance to slant range, foreshortening
and layover distortions for 0θ ≠ (Figure 2b). To perform the feasibility analysis of the SAR
amplitude-based geo-referencing approach, we propose a procedure relying on a well-established and
simple coordinate transformation of a point from an inertial frame (H) to a new coordinate system (C),
hereinafter the radar frame [16]. Equation (1) allows us to transform three-coordinates of the local flat
Earth (H) frame into three-coordinates of the system (C). However, our goal is to transform a
3-coordinate system into a new two-coordinate system, where every point is a pixel of the scene
imaged by the SAR. As a consequence, for the third coordinate the following condition holds:
0Cz = (3)
Note that, Cz can be still computed as a function of the focal length for an optical image, but it cannot be generally derived for a SAR image if ( ), ,ψ θ ϕ , Ct and C
Hγ are unknown.
By exploiting Equations (1) and (2), the following relation for the aircraft position (or equivalently
the SAR position) estimation can be written:
( ), ,HH H C Cψ θ ϕ= −t p R p (4)
where it HCγ was set equal to one. The previous equation clearly states that SAR position ( ( )SAR
H H=t p ) can be found if and only if: SAR attitude ( ), ,ψ θ ϕ is “correctly” measured or estimated; coordinates of
a point landmark ( ( )GCPH H=p p ) are known (from a DB) in the inertial coordinate system H; the same
landmark point is imaged by the SAR and its coordinates in the non-inertial coordinate system C, i.e., ( )GCP
C C=p p , are correctly extracted by the ATR processing chain.
Thus, SAR position can be computed by re-writing Equation (4) as follows:
( )( ) ( ) ( ), ,SAR GCP H GCPH H C Cψ θ ϕ= −p p R p (5)
An SAR sensor essentially measures the slant-range between the sensor position ( )SARHp and a GCP,
e.g.,: [ ]( ) 0, cos ,0tn
H n nR θ=p , point A in Figure 2a located at the near range Rn and corresponding to a
SAR attitude (ψ = 0°, θ = θn, φ = 0°). Thus, if the GCP is in the landmark DB (i.e., ( )nHp is known) and
is correctly extracted from the SAR image by the ATR chain (i.e., ( )nCp is known), then the SAR sensor
position ( )SARHp can be retrieved by using Equation (5). Note also that (ψ, θn, φ) have to be estimated or
measured in order to exploit Equation (5).
It is worth noting that this section does not aim to provide an SAR-amplitude based geo-referencing
procedure, but only a simplified mathematical approach to perform a feasibility analysis.
Sensors 2015, 15 18340
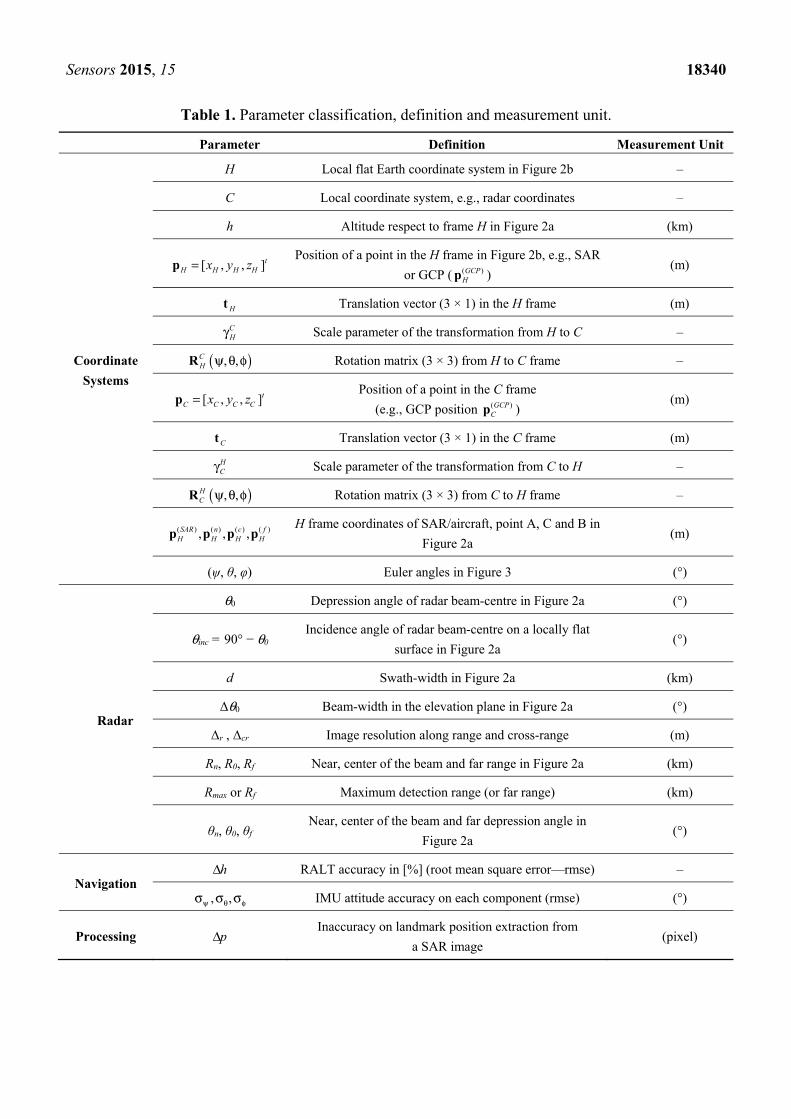
Table 1. Parameter classification, definition and measurement unit.
Parameter Definition Measurement Unit
Coordinate
Systems
H Local flat Earth coordinate system in Figure 2b –
C Local coordinate system, e.g., radar coordinates –
h Altitude respect to frame H in Figure 2a (km)
[ , , ]tH H H Hx y z=p
Position of a point in the H frame in Figure 2b, e.g., SAR
or GCP ( ( )GCPHp )
(m)
Ht Translation vector (3 × 1) in the H frame (m)
CHγ Scale parameter of the transformation from H to C –
( ), ,CH ψ θ φR Rotation matrix (3 × 3) from H to C frame –
[ , , ]tC C C Cx y z=p
Position of a point in the C frame
(e.g., GCP position ( )GCPCp )
(m)
Ct Translation vector (3 × 1) in the C frame (m)
HCγ Scale parameter of the transformation from C to H –
( ), ,HC ψ θ φR Rotation matrix (3 × 3) from C to H frame –
( ) ( ) ( ) ( ), , ,SAR n c fH H H Hp p p p
H frame coordinates of SAR/aircraft, point A, C and B in
Figure 2a (m)
(ψ, θ, φ) Euler angles in Figure 3 (°)
Radar
θ0 Depression angle of radar beam-centre in Figure 2a (°)
θinc = 90° − θ0 Incidence angle of radar beam-centre on a locally flat
surface in Figure 2a (°)
d Swath-width in Figure 2a (km)
Δθ0 Beam-width in the elevation plane in Figure 2a (°)
Δr , Δcr Image resolution along range and cross-range (m)
Rn, R0, Rf Near, center of the beam and far range in Figure 2a (km)
Rmax or Rf Maximum detection range (or far range) (km)
θn, θ0, θf Near, center of the beam and far depression angle in
Figure 2a (°)
Navigation hΔ RALT accuracy in [%] (root mean square error—rmse) –
, ,ψ θ φσ σ σ IMU attitude accuracy on each component (rmse) (°)
Processing pΔ Inaccuracy on landmark position extraction from
a SAR image (pixel)

Sensors 2015, 15 18341
(a) (b)
Figure 2. (a) Airborne side looking SAR geometry; (b) Basic flat-Earth geometry.
(a) (b) (c)
Figure 3. (a) Euler angles (ψ, θ, φ): (a) ψ defines the first rotation about the z-axis (note
that the angle ψ in the figure is negative); (b) θ defines the second rotation about the
x1-axis (note that θ is negative); (c) φ defines the third rotation about the z2-axis (note that
φ is positive).
2.3. Feasibility Analysis
As already stated in Section 1, the feasibility analysis refers in particular to MALE UAV class [10],
which permits heavy and wide payloads to be carried onboard, and can be affected by a dramatic
cumulative drift during long mission when GPS data are not reliable. Some examples of MALE UAVs
are Predator B, Global Hawk and Gray Eagle, which are actually equipped with SAR system and can
be also equipped with InSAR system (more details in Section 3). Several competing system parameters
have to be considered in the feasibility analysis as detailed in the following.
X band choice is mainly driven by both the limited payload offered by X-band SAR/InSAR systems
and by the wavelength robustness to “rain fading” [17].
Concerning the polarisation, a single channel leads to a small and light SAR system that can fit onboard
a UAV. Moreover, in the case of single polarisation, well-suited statistical distribution for terrain modelling
can be employed by a fast and high-performance ATR chain. Finally, backscattering in VV polarization is
higher than in HH polarisation for incidence angle greater than 50° and X band [17].
Sensors 2015, 15 18342
SAR image resolution has to be chosen as a trade-off among competing requirements.
Range/cross-range resolution of about 1 m is suitable for recognizing terrain landmarks, i.e., large targets
such as buildings, cross-roads, whose shorter linear dimension is at least 10–20 times the suggested
resolution [18]. On the contrary, pixel resolution higher than 1m would be unnecessary and increase ATR
computational load.
Stripmap imaging mode allows us a shorter observation/integration time (as opposed to spotlight
mode), lower computational complexity, and easier autofocusing [19]; moreover, it also requires a
mechanical antenna steering mechanism simpler and lighter than other imaging modes [18].
Requirements on SAR acquisition geometry (i.e., altitude h and attitude (ψ, θ, φ)), IMU attitude
measurement, SAR swath-width, landmark characteristics, ATR accuracy, and operative scenarios,
were derived through Montecarlo simulations according to the procedure described in Section 2.1.
In particular, the simulated scenarios assume good position accuracy on landmark coordinates
derived by ATR chain, while exploring the various parameters in Section 2.2 to achieve the “best”
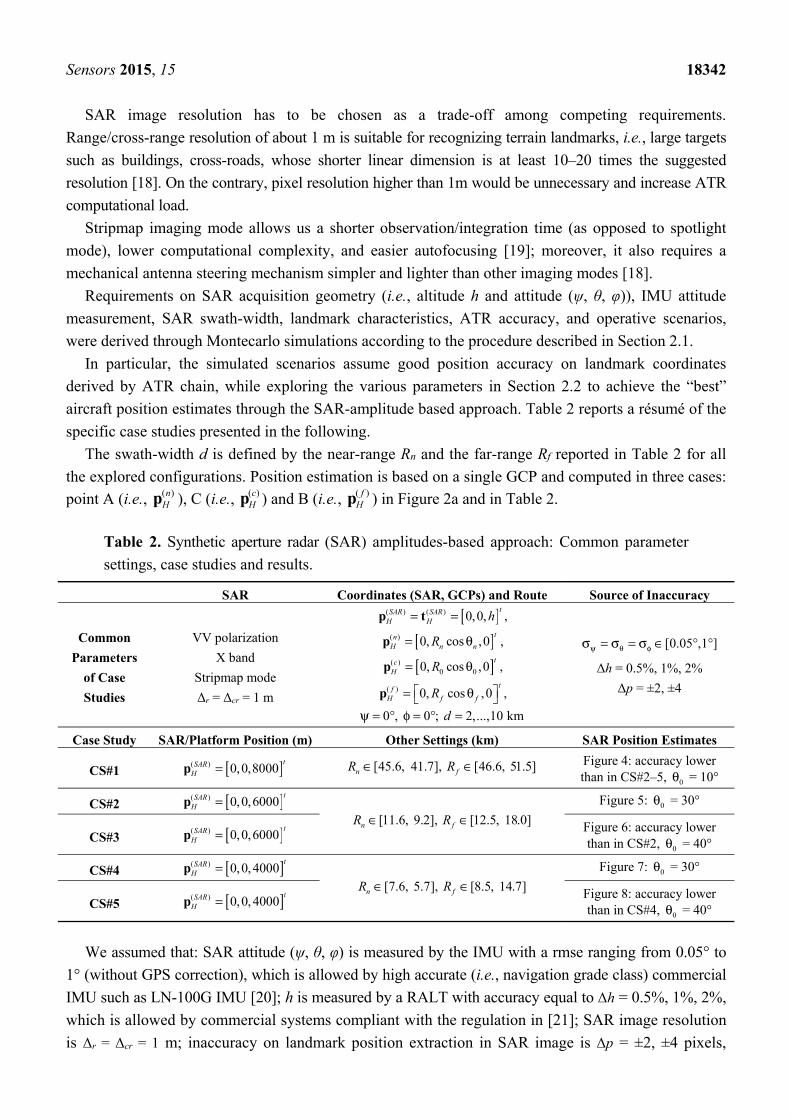
aircraft position estimates through the SAR-amplitude based approach. Table 2 reports a résumé of the
specific case studies presented in the following.
The swath-width d is defined by the near-range Rn and the far-range Rf reported in Table 2 for all
the explored configurations. Position estimation is based on a single GCP and computed in three cases:
point A (i.e., ( )nHp ), C (i.e., ( )c
Hp ) and B (i.e., ( )fHp ) in Figure 2a and in Table 2.
Table 2. Synthetic aperture radar (SAR) amplitudes-based approach: Common parameter
settings, case studies and results.
SAR Coordinates (SAR, GCPs) and Route Source of Inaccuracy
Common
Parameters
of Case
Studies
VV polarization
X band
Stripmap mode
Δr = Δcr = 1 m
[ ]( ) ( ) 0,0,tSAR SAR
H H h= =p t ,
[ ]( ) 0, cos ,0tn
H n nR= θp ,
[ ]( )0 00, cos ,0
tcH R= θp ,
( ) 0, cos ,0tf
H f fR = θ p ,
0 , 0 ; 2,...,10 kmdψ = ° φ = ° =
[0.05 ,1 ]ψ θ φσ = σ = σ ∈ ° °
Δh = 0.5%, 1%, 2%
Δp = ±2, ±4
Case Study SAR/Platform Position (m) Other Settings (km) SAR Position Estimates
CS#1 [ ]( ) 0,0,8000tSAR
H =p [45.6, 41.7], [46.6, 51.5]n fR R∈ ∈ Figure 4: accuracy lower than in CS#2–5, 0θ = 10°
CS#2 [ ]( ) 0,0,6000tSAR
H =p [11.6, 9.2], [12.5, 18.0]n fR R∈ ∈
Figure 5: 0θ = 30°
CS#3 [ ]( ) 0,0,6000tSAR
H =p Figure 6: accuracy lower than in CS#2, 0θ = 40°
CS#4 [ ]( ) 0,0, 4000tSAR
H =p [7.6, 5.7], [8.5, 14.7]n fR R∈ ∈
Figure 7: 0θ = 30°
CS#5 [ ]( ) 0,0, 4000tSAR
H =p Figure 8: accuracy lower than in CS#4, 0θ = 40°
We assumed that: SAR attitude (ψ, θ, φ) is measured by the IMU with a rmse ranging from 0.05° to
1° (without GPS correction), which is allowed by high accurate (i.e., navigation grade class) commercial
IMU such as LN-100G IMU [20]; h is measured by a RALT with accuracy equal to Δh = 0.5%, 1%, 2%,
which is allowed by commercial systems compliant with the regulation in [21]; SAR image resolution
is Δr = Δcr = 1 m; inaccuracy on landmark position extraction in SAR image is Δp = ±2, ±4 pixels,

Sensors 2015, 15 18343
which is compatible with the performance of the ATR algorithms [5,8]. Finally, without loss of
generality, we refer to the simplified geometry in Figure 2a defined by the following relations:
[ ]( ) ( ) ( ) ( ) ( ), , 0,0,t tSAR SAR SAR SAR SAR
H H H H Hx y z h = = = p t , ψ = 0°, φ = 0°.
The first case study (CS#1 in Table 2) corresponds to a high altitude flight (i.e., h = 8 km), which is
allowed by a MALE UAV class [10]. Figure 4 depicts UAV/SAR position estimates under the “best” configuration (i.e., θ0 = 10°, °=== 05.0φθψ σσσ , Δh = 0.5%, Δp = ±2), with error bars proportional
to the error standard deviation (std): no significant bias can be noted, but the std, which is very stable
w.r.t. the swath-width, is too large on the 1st and 3rd component ( ( ) ( ),SAR SARH Hx y ). Even by increasing θ0
(from 10° to 40°), suitable results cannot be achieved. Note that if the IMU rmse was
σψ = σθ = σϕ = 0.5° , the std of each component of ( )SARHp would be about 10 times greater than in
Figure 4 (where IMU rmse = 0.05°). Analogously, if RALT accuracy was Δh = 1% and 2%, the std of
both the 2nd and 3rd component of the estimated SAR position would be about 1.25 and 2.5 times
greater than in Figure 4 (where Δh = 0.5%). On the contrary, inaccuracy on landmark position
in the image (derived by the ATR chain) has no appreciable impact on SAR position estimates
(e.g., Δp = ±2, ±4).
Thus, to reach suitable estimates, we decreased the SAR altitude to h = 6000 m (case study CS#2 in
Table 2). The results from the “best” configuration are shown in Figure 5. It can be seen that all the
estimated components of ( )SARHp have no bias and their variability is always bounded within ±20 m.
Fairly worse results are achieved by exploiting ( )cHp as landmark, because of the higher uncertainty on the
corresponding depression angle θc. Moreover, the estimates of ( )SARHp based on ( )n
Hp are generally better
than those based on ( )fHp , because the impact of IMU inaccuracy is stronger on θf than on θn (θf < θn).
Figure 4. SAR position estimates (CS#1 in Table 2) based on a single GCP ( ( )nHp , ( )c
Hp , ( )fHp ):
[ ]( ) 0,0,8000tSAR
H =p m, θ0 = 10°, σψ = σθ = σϕ = 0.05° , Δh = 0.5%, Δp = ±2. Error (on each
SAR position component) mean value curve as a function of swath-width (d); error bars
show the error standard deviation along the curve.

Sensors 2015, 15 18344
Figure 5. SAR position estimates (CS#2 in Table 2) based on a single GCP ( ( )nHp , ( )c
Hp , ( )fHp ):
[ ]( ) 0,0,6000tSAR
H =p m, = 30°, σψ = σθ = σϕ = 0.05° , Δh = 0.5%, Δp = ±2.
Figure 6. SAR position estimates (CS#3 in Table 2) based on a single GCP ( ( )nHp , ( )c
Hp , ( )fHp ):
[ ]( ) 0,0,6000tSAR
H =p m, θ0 = 40°, σψ = σθ = σϕ = 0.05° , Δh = 0.5%, Δp = ±2.
Figure 7. SAR position estimates (CS#4 in Table 2) based on a single GCP ( ( )nHp , ( )c
Hp , ( )fHp ):
[ ]( ) 0,0,4000tSAR
H =p m, θ0 = 30°, σψ = σθ = σϕ = 0.05° , Δh = 0.5%, Δp = ±2.
Figure 8. SAR position estimates (CS#5 in Table 2) based on a single GCP ( ( )nHp , ( )c
Hp , ( )fHp ):
[ ]( ) 0,0,4000tSAR
H =p m, θ0 = 40°, σψ = σθ = σϕ = 0.05° , Δh = 0.5%, Δp = ±2.
0θ

Sensors 2015, 15 18345
We also considered a case study (CS#3 in Table 2) with greater SAR depression angle (θ0 = 40°),
while keeping platform h as in CS#2. Figure 6 show CS#3 results, which keep on satisfying the
constraint on position accuracy. Note that the accuracy on ( )SARHx is improved compared with CS#2, but
it is worse on ( )SARHy , because of the wider Δθ0 for θ0 = 40° than for θ0 = 30° (i.e., CS#2) needed to
illuminate the same swath-width. For depression angles higher than 40°, the accuracy on the estimates
further worsens: such a trend can be also observed by comparing Figure 5 and 6.
As a limiting case, we reduced the UAV altitude down to h = 4000 m (CS#4 in Table 2). Figure 7
shows position estimates under the “best” configuration (θ0 = 30°): the estimated ( )SARHp components
show negligible bias and their variability is even lower than in the previous case studies, i.e., ±15 m.
Note that, for swath-width greater than 7000 m, only ( )SARHx exceeds the previous boundary.
We also considered a further case study (CS#5 in Table 2) with a depression angle θ0 = 40° greater
than in CS#4. All the estimates shown in Figure 8 are rigorously bounded within ±15 m and SAR
position estimates are generally very similar to those achieved in CS#4. Only the inaccuracy on ( )SARHy
slightly increases, because of the wider Δθ0 for θ0 = 40° than for θ0 = 30°. Again, for depression angles
higher than 40°, the accuracy on the estimates further worsens.
A UAV altitude lower than 4000 m cannot be taken into account because it would have severe
consequences on both SAR system requirements and SAR data processing. In fact, in order to keep
constant the values of both θ0 and swath-width, the lower the altitude, the wider Δθ0, thus leading to
considerably increasing the required transmitted power. Moreover, a wide Δθ0 means large resolution
changes across the ground swath [8], which negatively impact the performance of the ATR algorithm:
features that are clearly distinguishable at far range can become nearly invisible at near range.
In conclusion, feasible parameter settings are those relative to CS#2 and CS#4 configurations,
which provide estimated UAV coordinates with errors bounded within ±18 m and ±12 m, respectively.
In Table 3, a résumé of the suggested requirements, i.e., a first trade-off, is listed. Note that the
suggested range of SAR swath-width d (i.e., few kilometres) allows us to be confident about the
presence of the desired landmarks within the illuminated area, even if the SAR system (due to
uncertainty on attitude and position) points at the wrong direction. It is worth noting that SAR
requirements in Table 3 can be easily fulfilled by commercial systems, e.g., Pico-SAR radar produced
by Selex-ES [22]; MALE UAV [10] such as Predator B, Global Hawk and Gray Eagle, which easily
carry a Pico-SAR radar; navigation grade class IMU such as LN-100G IMU [20]; any RALT
compliant with the regulation in [21].

Sensors 2015, 15 18346
Table 3. Platform, viewing geometry, navigation sensor requirements and corresponding
reference system which allows a feasible SAR position retrieval: first trade-off.
First Setting (CS#2) Second Setting (CS#4)
Aircraft altitude (km) 6 4
Depression angle θ0 (°) 30 30
Swath-width d (km) few units few units
Elevation beam-width Δθ0 (°) ≥11.5 ≥16.6
Image resolution (m) ∼1
SAR band X
SAR polarization VV
Rn (km); R0 (km); Rf (km) 10.3−9.2; 12; 14.6−18.0 6.5−5.7; 8; 10.8−14.7
Maximum detection range Rf (km) ≥14.6 ≥10.8
Δh (%) 0.5 (or fairly worse) 0.5 (or fairly worse)
σψ,σθ ,σϕ (°) 0.05 0.05
Estimated UAV based on ( )cHp
(bias ± std) (m) 0 ± 15, 0 ± 11, 0 ± 18
(Figure 5) 0 ± 12.5, 0 ± 7.5, 0 ± 12
(Figure 7)
Reference systems
MALE UAV, e.g.,: Predator B, Global Hawk, Gray Eagle
Pico-SAR
Any RALT compliant with the regulation in [21]
Navigation grade class IMU, e.g.,: LN-100G IMU
2.4. Landmark DB and Mission Planning
In order to retrieve SAR position, the proposed algorithm has to exploit landmark points. In the
previous section, it is assumed that landmark coordinates in the mission DB are ideal, i.e., without
errors. Such an assumption is quite unlikely, and, consequently, we also evaluated the impact of
landmark coordinate inaccuracy on the estimated UAV position. According to the previous analysis,
preliminary requirements were derived for the landmark DB reference domain, typology, and
accuracy. Concerning the reference domain, an inertial system of coordinates (H) can be adopted, e.g.,
Earth-cantered frame or local map coordinate system. Concerning the landmark typology, planar
landmarks (e.g., crossroad, roundabout, railway crossing) are strongly suggested because they are very
recurrent in several operating scenarios, can be precisely extracted, and do not introduce any vertical
distortion due to elevation with respect to the ground surface [8]. Small 3D-landmarks can be also
exploited but in the limits of the visibility problems due to the shadow areas occurring close to high
structures. According to this, a mission planning should avoid scenarios densely populated by
buildings, while preferring suburban or rural areas.
Concerning landmark DB accuracy, we exploited the procedure in Section 2.2 and the most
promising two settings in Section 2.3. Table 4 presents the platform geo-referencing accuracy derived
under two different error settings: a “moderate” DB accuracy with RMSE equal to [3, 3, 3]t in (m) on
landmark coordinates of ( )cHp , and a “low” DB accuracy with RMSE equal to [3, 3, 10]t in (m). Results
show a limited increase in the final std values with respect to the ideal results in Section 2.2.
The DB accuracy assumed above is quite reasonable, because the coordinates of interest refer to
centroid and corners of small landmarks, and can be derived by exploiting a Geographic Information

Sensors 2015, 15 18347
System (GIS) archive (or similar) [23]. The mapping standards employed by the United States
Geological Survey (USGS) specifies that [24]: 90% of all measurable horizontal (or vertical) points
must be within ±1.01 m at a scale of 1:1200, within ±2.02 m at a scale of 1:2400, and so on. Finally,
the errors related to the geo-referencing could be modelled as a rigid translation of a landmark with
respect to its ideal position, with RMSE smaller than 10 m.
Table 4. Platform position retrieval (bias ± standard deviation of each coordinate) as a
function of the settings in Table 1 and Data Base (DB) accuracy on landmark coordinates
of ( )cHp .
Landmark DB Accuracy CS#2 CS#4
“Moderate” (rmse [3, 3, 3]t in (m))
0 ± 14.8 m, 0 ± 10.2 m, 0 ± 17.8 m 0 ± 12.4 m, 0 ± 05.8 m, 0 ± 12.1 m
“Low” (rmse [3, 3, 10]t in (m))
0 ± 14.6 m, 0 ± 10.2 m, 0 ± 20.2 m 0 ± 12.4 m, 0 ± 05.8 m, 0 ± 15.3 m
3. InSAR Phase Exploitation
When the use of SAR amplitude is unfeasible because of unreliable surveyed scenario, the InSAR
phase can be exploited as derived by a single pass interferometer mounted onboard the platform. The
proposed approach is sketched in Figure 9 and basically consists in comparing the real InSAR phase
with a synthetic one derived by using both approximated position and attitude values of the and a
reference DTM. The matching block provides a feedback to be used for adjusting position and attitude
values derived by the instruments available onboard.
3.1. InSAR Setting
According to the acquisition geometry sketched in Figure 10, the phase difference (Φ) between two
slightly displaced SAR observations S1 and S2 is related to the difference in time delay from a given
pixel to each antenna of the SAR Interferometer. In the hypothesis of bistatic acquisitions (real
interferometer), the InSAR phase is not affected by neither atmosphere, nor ground deformation. It
depends only on the geometrical distance and can be expressed in terms of: the reference phase (Φref),
which accounts for the difference between the slant range geometry and the reference elevation model
(ellipsoidal or flat); while the topographic phase (Φh) is related to the elevation h w.r.t. the reference
elevation model [25]:
//,
2 ( )( ) ( ) ( )ref h
pa
h pp p p L
h
πλ
Φ = Φ + Φ ≈ ⋅ −
(6)
where λ is the SAR wavelength, L//,p is the component parallel to the master slant direction of the
geometrical distance between the two acquisitions (or baseline, L), and ha is the so-called height of
ambiguity. This last is defined as:
( )1,
,
S p p p
ap
R senh
L
λ θ α
⊥
−= (7)

Sensors 2015, 15 18348
where RS1,p and θpref are, respectively, the range distance and the look angle relative to the master (S1)
view computed w.r.t. the reference elevation at the pixel p; L⊥,p is the component of the baseline
orthogonal to the slant direction of the master computed at pixel p; αp is the terrain slope. ha defines the
InSAR height sensitivity, depends on the SAR system specifications, and drives the performance of the
InSAR processing for height computation. In particular, the smaller the value of the height of
ambiguity, the smaller the detectable height difference.
Figure 9. Flow chart of the InSAR based navigation system.
Figure 10. (a) InSAR acquisition geometry; (b) UAV position (X, Y, Z) and attitude (roll,
pitch, yaw) in the basic SAR geometry.
Since, ha is inversely proportional to the effective baseline L⊥, high baseline values are
recommended for accurate topography mapping. Basically, the aircraft size and shape limit the

Sensors 2015, 15 18349
baseline values and consequently ha. The baseline component L⊥ depends also on both the look angle
and the orientation angle β (see Figure 10), which can be optimized in order to maximize L⊥. In the
following, we assume a vertical baseline (β = 90°), which guarantees a symmetric weight distribution
across the aircraft fuselage. An inclination angle β equal to the mean look angle (β = in Figure 10)
maximizes the orthogonal component of the baseline L⊥ leading to increase the height sensitivity up to
5% for low incident angle.
The following analysis was carried out assuming, as in the case of amplitude-based procedure, a
MALE UAV class [10], which can carry on a maximum payload of 150 × 130 cm2 and reach a
maximum flight altitude of 8000 m.
3.2. Analysis with Respect to InSAR Phase Integrity
The reliability of the InSAR processing depends on the quality of the InSAR phase, which is related
to the correlation between the two acquisitions. Changes of the terrain conditions between the two
acquisitions, system noise, and approximations in the processing lead to correlation loss. The image
correlation can be assessed in terms of the InSAR coherence γ [9], which is a normalized correlation
coefficient varying from 0 (full decorrelation) to 1 (full correlation). The coherence is directly related
to the signal to noise ratio of the interferogram and can be partitioned according to different sources of
decorrelation. In particular, the geometric decorrelation, δgeo, is due to the difference between the
incidence angles of the two acquisitions. This geometrical difference causes a spectral shift between
the signal spectral bands, which is proportional to the effective geometrical baseline [26]. When the
spectral shift equals the signal bandwidth the SAR images are totally uncorrelated and the baseline has
a value known as critical baseline.
The volume decorrelation, δvol, is due to the penetration of the radar waves into the soil or
vegetation and depends on both radar wavelength and scattering medium (bare soil, urban structures,
vegetation or forest) [27]. The volume scattering can be neglected in case of low penetration (bare soil)
or high extinction rate (forested area) as for X band or higher. In the following we assume to refer to
an X band system thus allowing us to neglect the volume decorrelation. This choice is also able to
guarantee better height sensitivity, as from Equation (2).
A further important source of errors comes from the fact that the InSAR phase field is obtained by
extracting the phase term of the complex interferogram leading to an ambiguity of 2π in the real phase
measurement. The Phase Unwrapping (PU) consists in deriving the correct map of the multiples of 2π
to be added to the “wrapped” phase in order to infer the absolute phase field correlated to the ground
topography images [28]. This processing step is critical in terms of both computational needs and
reliability. SAR systems at high spatial resolution, smooth terrains, and proper baselines can help in
performing a reliable PU. In particular, the height of ambiguity, which depends on the baseline value
according to Equation (7), provides also the sensitivity to the wrapping of the InSAR phase. Thus,
large baseline values improve the accuracy on height estimations, but also lead to a wide range of
terrain slopes affected by aliasing. According to the geometric and radiometric system parameters, the
critical slope angle αC can be defined so that if the terrain slope α is in the interval [θ − αC, θ + αC],
then the InSAR phase is affected by aliasing and PU fails.

Sensors 2015, 15 18350
Therefore, height of ambiguity, geometrical decorrelation and critical angle are useful indicators of
the expected performances of the interferometer. The first one provides the InSAR sensitivity to the
height variation. The second impacts on the InSAR phase noise (usually estimated through the
coherence) which causes artifacts in the phase unwrapping, thus decreasing the accuracy of the final
measurement. The latter provides a direct indication on the areas where phase unwrapping could fail.
We explored these three figures to derive reliable radiometric and geometric parameters for the
InSAR configuration. In particular, high baselines are required for increasing the InSAR sensitivity to
the height; however, at the same time, they increase the geometrical decorrelation as well as the
probability of phase aliasing to occur, thus making PU more problematic. High carrier frequencies, or
equivalently short wavelengths, increase the geometrical decorrelation but in general ensure less
penetration, thus limiting the effect of volumetric decorrelation.
Moreover, by increasing the bandwidth, or equivalently the spatial resolution, the geometrical
decorrelation (and consequently the critical angle αC) decreases as well, thus leading to improved
performances of the interferometer.
Figure 11 shows the behavior of δgeo, ha and αC with respect to different values of vertical baseline
and incident angle. We simulated a bistatic InSAR system with: baseline L = [0.3, 0.4, 0.6, 0.9, 1.3] m,
orientation angle β = 90° (i.e., vertical orientation see Figure 10a), aircraft elevation of 8 km, look
angles ranging from 10° up to 80°. Moreover, we assumed a SAR sensor with high spatial resolution,
B = 150 MHz, working at X band. Figure 11a shows the trends for δgeo. In this case, the performance
improves (δgeo decreases) by increasing the look angle and by decreasing the baseline L. In general, the
geometrical decorrelation is very limited (<0.006) for every configuration. In case of bistatic
acquisitions (no temporal decorrelation) and short wavelengths (no volume decorrelation), the InSAR
coherence is expected to be quite high except for the noise related to both processing (autofocusing
and co-registration) and electronic devices. Figure 11b shows the trends for ha. For a fixed incidence
angle, the InSAR height sensitivity increases (or equivalently ha decreases) as the baseline L increases.
Moreover, the sensitivity decreases by increasing the look angle. In general, the sensitivity can be quite
limited and, for some configurations, ha is really too high (>1000 m) to guarantee reliable
performances (<1/100 rad). Figure 11c shows the trends for αC. In this case, the performance improves
(αC decreases) by decreasing the baseline L and it is not monotonic with the look angle. However, the
values of αC are always less than 1°, leading to very limited range of terrain slopes forbidden due to
phase aliasing. Thus, the major problem in conventional SAR interferometry (i.e., the reconstruction
of absolute phase values starting from the InSAR wrapped principal phase fields, alias PU) is
strongly reduced.
From this preliminary investigation we can conclude that the explored configurations are not
problematic in terms of both geometrical decorrelation and phase unwrapping. Thus, the height
sensitivity should drive the selection of requirements for both radiometric and geometric parameters.
In particular, high baseline values should be preferred. In the present case, the baseline value is limited
by the aircraft size and shape (also considering possible external aerodynamics appendices).

Sensors 2015, 15 18351
Figure 11. (a) Height of ambiguity ha, (b) geometric decorrelation δgeo, and (c) critical
angle αC vs. look angle for B = 150 MHz, λ = 3 cm , platform altitude H = 8 km, vertical
baseline L = [0.3, 0.4, 0.6, 0.9, 1.3] m (from blue to purple), baseline orientation angle
β = 90° (vertical orientation see Figure 2).
3.3. Analysis with Respect to Altitude and Position Changes
In the previous section, we assessed the feasibility of the proposed approach (sketched in Figure 9)
with respect to the quality of the InSAR phase field. The same assessment is required with respect to
the InSAR sensitivity to changes on aircraft position and attitude, which are the parameters to be
estimated. To this aim, we refer to the SAR looking geometry sketched in Figure 10b (body frame, or
b-frame), where: the azimuth direction defines the X coordinate, the Y axis is opposite to the ground
range direction (assuming right looking systems), the Z axis is coincident with the local zenith
direction, the roll error angle is measured in the YZ plane from the Z axis towards the Y axis, the yaw
error angle is measured counter-clockwise in the XY plane from the X axis, the pitch error angle is
defined in the XZ plane from the nadir direction towards the X axis.
We developed a geometrical model that, referring to a point target on the ground with topographic
height h, relates changes on aircraft attitude/position to changes on both InSAR phase and target SAR
coordinates (slant range, azimuth). According to this model, we investigated the effects that errors in
the UAV attitude/position have on both the InSAR phase and the slant range/azimuth misalignments.
The same parameters of the previous analysis were assumed (H = 8 km; λ = 3 cm). Incidence angle
values between 15° and 60° were explored in order to limit the height of ambiguity. As we will see, the
influence of the topographic height on the sensitivity analysis is very poor and it is almost negligible
for high incidence angles (θ ≈ 60°).
The sensitivity of the InSAR phase to roll errors does not vary appreciably with the platform height,
while it increases with the incidence angle, and, as expected, is heavily affected by the baseline length,.
Plots (a) and (b) in Figure 12 show, respectively for incident angles at near (θ = 15°) and far range
(θ = 60°), the residual InSAR phase cycles evaluated for roll errors between −3° to 3°, by assuming
baseline L = 1.3 m and topographic heights ranging from −100 m to 1 km. With regard to the
sensitivity on the position of the selected target, the analysis is restricted to the slant range, since a roll
error cannot introduce a misalignment along the azimuth direction. Roll errors even up to 3°
(in absolute value) lead to slant range variations less than 1 m. Hence, the slant range sensitivity is
very poor in this case.

Sensors 2015, 15 18352
Figure 12. Subplots (a,b) show residual InSAR phase cycles evaluated for roll errors
between −3° and 3°, and incident angles at near range (a) and far range (b). Subplots (c–f)
show the misalignments in slant range and azimuth evaluated for yaw (c,d) and pitch errors
(e,f) between −3° and 3°, assuming topographic heights ranging from −100 m to 1 km, and
an incident angle at mid-range (θinc = 30°). For all the plots, the topographic height ranges
from −100 m to 1 km.

Sensors 2015, 15 18353
Concerning errors on the yaw angle, the analytical model predicts a poor sensitivity of the InSAR
phase and a high sensitivity of the azimuth misalignment, which increases with both incident angle and
aircraft altitude. In particular, a yaw error of just 1° may lead to azimuth shifts close to 200 m (see
Figure 12d), with incidence angles close to 60°. The slant range sensitivity is almost independent from
the aircraft altitude and it slightly increases with the incidence angle, while a yaw error of 1° never
produces a slant range variation exceeding 2 m (see Figure 12c) for all the explored configurations.
Moreover, an intrinsic uncertainty on the sign of the yaw error affects the estimation based on slant
range misalignment.
As for the yaw angle, sensitivity of InSAR phase to errors on pitch angle is generally very poor.
Also the slant range misalignment is very low in particular for pitch errors not exceeding 1° (see
Figure 12e). On the contrary, azimuth misalignments are important, regardless the platform height and
the incidence angle. 1° pitch error may lead to azimuth misalignments higher than 200 m, as shown in
Figure 12f. Errors on the along-track coordinate (i.e., X coordinate) do not affect the InSAR phase or
the Zero-Doppler distance between the target and the sensor after SAR focusing. They only lead to a
corresponding azimuth misalignment in the focused image.
Let us consider now an error only on the UAV position, i.e., on the Y coordinate (ground range in
Figure 10a). The residual InSAR phase can be computed analytically through geometrical modeling.
The sensitivity of the InSAR phase is high for low orbits and at mid-range, and it increases
significantly with the baseline length (Equation (6)). In general for a platform altitude of
8 km the InSAR phase sensitivity is quite limited (see Figure 13a). Concerning sensitivity of the target
position to Y errors, the analysis is restricted to the slant range, since an error on the Y position cannot
introduce a misalignment along the azimuth direction. Slant range sensitivity significantly increases
with the incidence angle (see plots (c) and (d) in Figure 13 derived at near and fare range,
respectively), while the effect of the platform altitude is negligible. Errors in slant range up to 200 m
can occur.
The last parameter to investigate is the Z position of the UAV platform. In this case, the sensitivity
of the InSAR phase is high for low orbits and at far range (see Figure 13b), and again it increases
significantly with the baseline length. In this case, the analysis of the sensitivity on the position of a
selected target to Z errors is also restricted to the slant range, since an error on the Z position cannot
introduce a misalignment along the azimuth direction. Slant range sensitivity is in general considerable
and increases at near range (see plots (e) and (f) in Figure 13), while the effect of the platform altitude
is negligible, as for the Y parameter.

Sensors 2015, 15 18354
Figure 13. Subplots (a) and (b) show residual InSAR phase cycles evaluated for Y errors
(a) and Z errors (b) ranging from −200 to 200 m, and incident angles at mid-range and far
range respectively. Subplots (c–f) show the variation of the target position along slant rage
(meters) evaluated for Y errors (c,d) and Z errors (e,f) ranging from −200 to 200 m, and for
incident angle at near range (c,e) and far range (d,f). For all the plots, the topographic
height ranges from −100 m to 1km.

Sensors 2015, 15 18355
3.4. Analysis with Respect to DTM Characteristics
The performances of the InSAR-based geo-referencing procedure depend on the Matching
algorithm, which, in turn, depends on the InSAR height sensitivity, the spatial variability of the terrain
profile and the specifications of the reference DTM available onboard. The implementation of a
specific matching algorithm is beyond the scope of this paper, but a possible processing scheme can
designed based on SIFT technique [29] and, in general, strong spatial variability is required in order to
improve the correlation performance. Thus, it is expected that the InSAR-based geo-referencing
procedure would be reliable on hilly or mountainous areas, and when using the configuration with the
highest baseline value (1.3 m in our simulated scenario), which ensures the best InSAR sensitivity to
the terrain elevation.
Both spacing of the grid points and accuracy of the elevation values determine the quality of a
DTM. For our purposes, a reliable DTM spacing should be comparable to the spatial resolution of the
InSAR products. This, in general, is worse than the resolution of the original SAR images because of
the multi-viewing required to decrease the phase noise. The number of looks adopted in this smoothing
procedure can be set to the minimum value, which provides a multi-looked resolution cell comparable
to the horizontal geolocation accuracy. Assuming the most favorable InSAR configuration of
L = 1.3 m, and an InSAR coherence of 0.9, a reliable value for the number of looks is about four, both
in range and azimuth.
The impact of the DTM spacing on the InSAR-based geo-referenced procedure was evaluated by
using the difference between the simulated InSAR phase fields derived by using DTM with different
postings. A statistical analysis was performed by computing the std of the InSAR phase errors. Assuming
the most favorable configuration of L = 1.3 m, and a multi-look value of 4 × 4, the DTM spacing does
not exceed 10 m. This result meets the specifications of the Level 3 DTM standard defined by the
National Imagery and Mapping Agency (NIMA) [30] as: spatial resolution of 12 m, absolute vertical
accuracy less than 10m, relative vertical accuracy less than 2 m.
The requirement on the DTM height accuracy can be derived by considering as reliable a value at
least comparable to the InSAR height sensitivity. Assuming the most favorable configuration of
L = 1.3 m, and an InSAR coherence of 0.9, the height sensitivity is in general lower than 10 ÷ 13 m,
depending on the look angle. Therefore, a DTM of Level 3 for the NIMA standard again meets the
requirements for the height accuracy.
Finally, the TanDEM-X mission is generating a DEM fulfilling these requirements [31] and
covering the whole Earth surface, so that reliable input data to the InSAR-based geo-referencing
procedure will be soon available globally.
4. Conclusions
The goal of the paper is to propose an advanced integration of SAR imaging into UAV navigation
systems and to prove the technological feasibility of such integrated system. We address the problem
of drifts in planned trajectory due to inaccurate INS measurements occurring when a GPS signal is
absent or corrupted by either intentional or unintentional interferences. This problem can affect in
particular the MALE UAV class during a long endurance flight. However, the same UAV class

Sensors 2015, 15 18356
permits to carry out onboard heavy and wide payloads, thus making feasible the use of SAR/InSAR
technology. SAR sensors are valuable for a UAV navigation backup system thanks to the day/night
and all-weather imaging, and to the wide area illuminated from a long distance by ensuring high
spatial resolution.
A feasibility analysis was aimed at deriving requirements for the geo-referencing procedure
performed on a UAV platform and based on the SAR amplitude (if terrain landmarks are available)
and on the SAR Interferometry (if terrain landmarks are not available).
Simple and well-established approaches were presented to derive a feasibility analysis concerning
both the amplitude-based and the InSAR-based procedures, and considering different competitors:
SAR system, image acquisition geometry, navigation instruments, UAV platform, landmarks and DTMs.
Results detailed in Section 2.4, 2.5 and 3 finally show that both SAR amplitude- and InSAR-based
approaches here proposed are technologically feasible by resorting to a certain class of UAV platform,
IMU, RALT, both SAR and InSAR systems, typical landmark position accuracy and class (e.g.,
buildings and road network in a suburban/rural scenario), and DTM accuracy. The requirements
derived from the feasibility analysis can be fulfilled by commercial systems e.g., Pico-SAR radar
produced by Selex-ES [22]; MALE UAV [10] such as Predator B, Global Hawk and Gray Eagle,
which easily carry a Pico-SAR radar; navigation grade class IMU such as LN-100G IMU [20], and any
RALT compliant with the regulation in [21]. Moreover, the size of these UAVs permits hosting SAR
interferometric system with baseline values is able to provide reliable performances in terms of both
phase noise and sensitivity. We also proved that a DTM of Level 3 for the NIMA standard meets the
requirements for both DTM spacing and height accuracy. Moreover, a global DTM of such quality will
be soon available thanks to the TanDEM-X mission.
Concerning the amplitude-based approach, feasible parameter settings are those relative to CS#2
and CS#4 configurations in Table 3, which provide estimated aircraft coordinates with errors bounded
within about ±15 m. It can be clearly stated that the parameter settings or requirements (here derived)
are more focused on aerial platform, SAR systems and navigation sensors than on the image
processing chain (SAR data Autofocusing, ATR chain), which is out of the scope of this paper but
already exploited also for UAVs (e.g., [5,6]).
Concerning the InSAR-based approach, the analysis showed that the phase variation does not seem
to be a useful figure to correct position and attitude. On the contrary, the exploration of SAR
coordinates variation due to changes in position and attitude of the aircraft appears feasible. This result
suggests that, for the matching algorithm, it seems promising to explore the difference in range and
azimuth location between the real and simulated InSAR phase profiles, instead of looking at the phase
differences. A possible approach can be based on SIFT technique [29].
Future work will be devoted to develop an ad hoc and performing ATR chain (for the amplitude-based
approach) and a matching algorithm (for the InSAR-based approach), as well as to process real data.
Acknowledgments
The authors acknowledge the support of the SARINA project A-0932-RT-GC, which is coordinated by
the European Defence Agency (EDA) and partially funded by 10 contributing Members (Cyprus, France,
Sensors 2015, 15 18357
Germany, Greece, Hungary, Italy, Norway, Poland, Slovakia, Slovenia and Spain) in the framework of the
Joint Investment Programme on Innovative Concepts and Emerging Technologies (JIP-ICET).
Author Contributions
All authors contributed to the literature survey and result analysis. Nitti, Bovenga and Chiaradia
worked mainly on the SAR interferometry based approach, while Greco and Pinelli on the landmark
based approach.
Conflicts of Interest
The authors declare no conflict of interest.
References
1. Chiang, K.; Tsai, M.; Chu, C. The Development of an UAV Borne Direct Georeferenced
Photogrammetric Platform for Ground Control Point Free Applications. Sensors 2012, 12,
9161–9180.
2. McLean, D. Automatic Flight Control Systems; Prentice Hall: New York, NY, USA, 1990.
3. Hasan, A.M.; Samsudin, K., Ramli, A.R.; Azmir, R.S.; Ismaeel, S.A. A Review of Navigation
Systems (Integration and Algorithms). Aust. J. Basic Appl. Sci. 2009, 3, 943–959.
4. Greco, M.; Querry, S.; Pinelli, G.; Kulpa, K.; Samczynski, P.; Gromek, D.; Gromek, A.;
Malanowski, M.; Querry, B.; Bonsignore, A. SAR-based Augmented Integrity Navigation
Architecture: SARINA project results presentation. In Proceedings of 13th IEEE International
Radar Symposium (IRS), Warsaw, Poland, 23–25 May 2012; pp. 225–229.
5. González-Partida, J.; Almorox-González, P.; Burgos-Garcia, M.; Dorta-Naranjo, B. SAR System
for UAV Operation with Motion Error Compensation beyond the Resolution Cell. Sensors 2008,
8, 3384–3405.
6. Aguasca, A.; Acevo-Herrera, R.; Broquetas, A.; Mallorqui, J.; Fabregas, X. ARBRES: Light-Weight
CW/FM SAR Sensors for Small UAVs. Sensors 2013, 13, 3204–3216.
7. Curlander, J.C.; McDonough, R.N. Synthetic Aperture Radar: Systems and Signal Processing;
J. Wiley & Sons, Inc.: New York, NY, USA, 1991.
8. Oliver, C.; Quegan, S. Understanding Synthetic Aperture Radar Images; SciTech Publishing, Inc.:
Raleigh, NC, USA, 2004.
9. Rosen, P.A.; Hensley S.; Joughin, I.; Li, F.K.; Madsen, S.N.; Rodriguez, E.; Goldstein, R.M.
Synthetic Aperture Radar Interferometry. IEEE Proc. 2000, 88, 333–382.
10. Weibel, R.E.; Hansman, R.J. Safety Considerations for Operation of Different Classes of UAVs in
the NAS. In Proceedings of the AIAA 3rd “Unmanned Unlimited” Technical Conference,
Workshop and Exhibit, Chicago, IL, USA, 20–23 September 2004.
11. Barton, D.K. Radar Equations for Clutter and Jamming. In Radar Equations for Modern Radar;
Artech House, Inc.: Norwood, MA, USA, 2013; pp. 55–107.

Sensors 2015, 15 18358
12. World Geodetic System 1984: Its Definition and Relationships with Local Geodetic Systems.
Technical Report TR8350.2; National Imagery and Mapping Agency (NIMA): St. Louis, MO,
USA, 2000.
13. Etkin, B.; Reid, L.D. The Stability Derivatives. In Dynamics of Atmospheric Flight, Stability and
Control, 3rd ed.; John Wiley & Sons: New York, NY, USA, 1972; pp. 129–160.
14. Matlab. Available online: http://it.mathworks.com/help/aerotbx/ug/lla2flat.html (accessed on
27 March 2015).
15. Siciliano, B.; Sciavicco, L.; Villani, L.; Oriolo, G. Kinematics. In Robotics—Modelling, Planning
and Control, 2nd ed.; Springer-Verlag: London, UK, 2009; pp. 39–103.
16. Glasbey, C.A.; Mardia, K.V. A penalized approach to image warping. J. R. Stat. Soc. Ser. B Stat.
Methodol. 2001, 63, 465−492.
17. Richards, J.A. Remote Sensing with Imaging Radar; Springer-Verlag GmbH: Berlin/Heidelberg,
Germany, 2009.
18. Hopper, G.S. Forward-looking Infrared Systems. In The Infrared & Electro-Optical Systems
Handbook, Passive Electro-Optical Systems; Campana S.B., Ed.; SPIE—International Society for
Optical Engine: Bellingham, WA, USA, 1993; Volume 5, pp. 105–158.
19. Carrara, W.G.; Goodman, R.S.; Majewski, R.M. Spotlight Synthetic Aperture Radar; Artech
House Inc.: Norwood, MA, USA, 1995.
20. Northrop Grumman LN-100G Inertial Measurement Unit datasheet. Available online:
http://www.northropgrumman.com/Capabilities/LN100GInertialNavigationSystem/Documents/ln100
g.pdf (accessed on 20 July 2015).
21. Air Data Computer. Technical Report TSO-C106, Department of Transportation, Federal
Aviation Administration, January 1988, Washington DC, USA. Available online:
http://rgl.faa.gov/Regulatory_and_Guidance_Library/rgTSO.nsf/0/fdc3133eed60bdb986256dc600
696543/$FILE/C106.pdf (accessed on 20 July 2015).
22. PicoSAR. Available online: http://www.selex-es.com/it/-/picosar-1 (accessed on 27 March 2015).
23. ESGS GIS. Available online: http://egsc.usgs.gov/isb//pubs/gis_poster/ (accessed on 27 March 2015).
24. Digital Terrain Elevation Data (DTED): Performance Specification. Technical Report
MIL-PRF-89020B, National Imagery and Mapping Agency (NIMA), May 2000, St. Louis, USA.
Available online: https://dds.cr.usgs.gov/srtm/version2_1/Documentation/MIL-PDF-89020B.pdf
(accessed on 20 July 2015).
25. Hanssen, R.F. Radar Interferometry: Data Interpretation and Error Analysis; Kluwer Academic
Publishers: Dordrecht, The Netherlands, 2001.
26. Gatelli, F.; Monti Guarnieri, A.; Parizzi, F.; Pasquali, P.; Prati, C.; Rocca, F. The wavenumber
shift in SAR interferometry. IEEE Trans. Geosci. Remote Sens. 1994, 32, 855–865.
27. Dall, J. InSAR Elevation Bias Caused by Penetration into Uniform Volumes. IEEE Trans. Geosci.
Remote Sens. 2007, 45, 2319–2324.
28. Ghiglia, D.C.; Pritt, M.D. Two Differential Phase Unwrapping: Theory, Algorithms and Software;
J. Wiley & Sons, Inc.: New York, NY, USA, 1998.

Sensors 2015, 15 18359
29. Lingua, A.; Marenchino, D.; Nex, F. Performance Analysis of the SIFT Operator for Automatic
Feature Extraction and Matching in Photogrammetric Applications. Sensors 2009, 9, 3745–3766.
30. Heady, B.; Kroenung, G.; Rodarmel, C. High resolution elevation data (HRE) specification
overview. In Proceedings of ASPRS/MAPPS Conference, San Antonio, TX, USA, 16–19
November 2009.
31. Rizzoli, P.; Bräutigam, B.; Kraus, T.; Martone, M.; Krieger, G. Relative height error analysis of
TanDEM-X elevation data. ISPRS J. Photogramm. Remote Sens. 2012, 73, 30–38.
© 2015 by the authors; licensee MDPI, Basel, Switzerland. This article is an open access article
distributed under the terms and conditions of the Creative Commons Attribution license
(http://creativecommons.org/licenses/by/4.0/).