sensors
DESCRIPTION
SenoresTRANSCRIPT

Sensors 2013, 13, 2530-2551; doi:10.3390/s130202530
sensors ISSN 1424-8220
www.mdpi.com/journal/sensors Article
Heart Sound Biometric System Based on Marginal Spectrum Analysis
Zhidong Zhao 1,*, Qinqin Shen 2 and Fangqin Ren 2
1 College of Electronics and Information, HangZhou DianZi University, Hangzhou 310018, China 2 College of Communication Engineering, HangZhou DianZi University, Hangzhou 310018, China;
E-Mails: [email protected] (Q.S.); [email protected] (F.R.)
* Author to whom correspondence should be addressed; E-Mail: [email protected]; Tel.: +86-571-8691-9082.
Received: 14 November 2012; in revised form: 28 January 2013 / Accepted: 4 February 2013 / Published: 18 February 2013
Abstract: This work presents a heart sound biometric system based on marginal spectrum analysis, which is a new feature extraction technique for identification purposes. This heart sound identification system is comprised of signal acquisition, pre-processing, feature extraction, training, and identification. Experiments on the selection of the optimal values for the system parameters are conducted. The results indicate that the new spectrum coefficients result in a significant increase in the recognition rate of 94.40% compared with that of the traditional Fourier spectrum (84.32%) based on a database of 280 heart sounds from 40 participants.
Keywords: heart sound identification system; EEMD; HHT; feature extraction; marginal spectrum
1. Introduction
With the rapid development of transportation, communication, and network technology in modern society, the scope of human activities is broadening, while the difficulty and importance of identification becomes increasingly prominent. Traditional identification methods are generally divided into two kinds: (1) items that people remember, such as user names, passwords, etc. and (2) items that people own, such as keys, identification cards, etc. The two types both have limitations in that they may be easily forgotten, lost, or imitated. Traditional identification techniques cannot meet
OPEN ACCESS

Sensors 2013, 13 2531
the higher security demands of a highly modernized society. Biological recognition technology refers to individual identification based on unique physiological or behavioral characteristics of the human body. Compared with traditional patterns such as password-based or ID card identification, biometrics technology has a high level of safety and reliability, thus making this technology an important international research field of significance in different application areas.
As shown in Figure 1, physiological biometrics features commonly include fingerprints, face, hand geometry, eyes (retina and iris), palm prints, ear, tooth, wrist/hand blood-vessel texture, DNA, etc. Meanwhile, behavioral biometrics include signature, voice, walking gait, intensity of hitting the keyboard, etc. [1,2]. Each biometric technology has its advantages and disadvantages. Jain conducted a simple comparison of different biometrics technologies, and the results are shown in Table 1, where three degrees are used to measure the performance of various biometric features: H stands for high, M for medium, and L for low.
Figure 1. Various biometric features.
Table 1. Comparison of various biometric technologies’ performance.
Biometrics Universality Distinctiveness Permanence Collectabilit
y Feasibility Acceptability Circumvention
Hand vein M M M M M M L
Walking gait M L L H L H M
Odor H H H L L M L
Ear M M H M M H M
Finger geometry M M M H M M M
Fingerprint M H H M H M M
Face H L M H L H H
Retina H H M L H L L
Iris H H H M H L L
Palm print M H H M H M M
Voice M L L M L H H
Signature L L L H L H H
DNA H H H L H L L
Sensors 2013, 13 2532
Commercial biometric methods currently include the face, iris, fingerprint, voice, etc. These technologies have achieved initial applications, but are faced with many challenges in practical large-scale applications. The most prominent challenge is the issue of biometric security [3]. A fingerprint recognition system was once fooled successfully with fake fingers made of gelatin [4,5]. Moreover, the accuracy of an iris recognition system is also degraded when a printed iris image or a false iris is etched onto contact lenses. Voices could be imitated conveniently, and faces can be easily extracted from the user’s photo [6].
Heart sound is the reflection of the mechanical movement of the heart and cardiovascular system. This feature contains physiological and pathological information about the heart and various parts of the body. Compared with previous conventional biometrics features, heart sounds have unique advantages: (1) high security because an individual’s heart sounds cannot be faked; (2) easy to process because the heart sound is a one-dimensional signal with frequency components that exist mainly in the low-frequency range, thus making the signal processing simple; (3) high universality because every person has a beating heart. The unique physiological characteristics of heart sounds make them a promising identification technology [7].
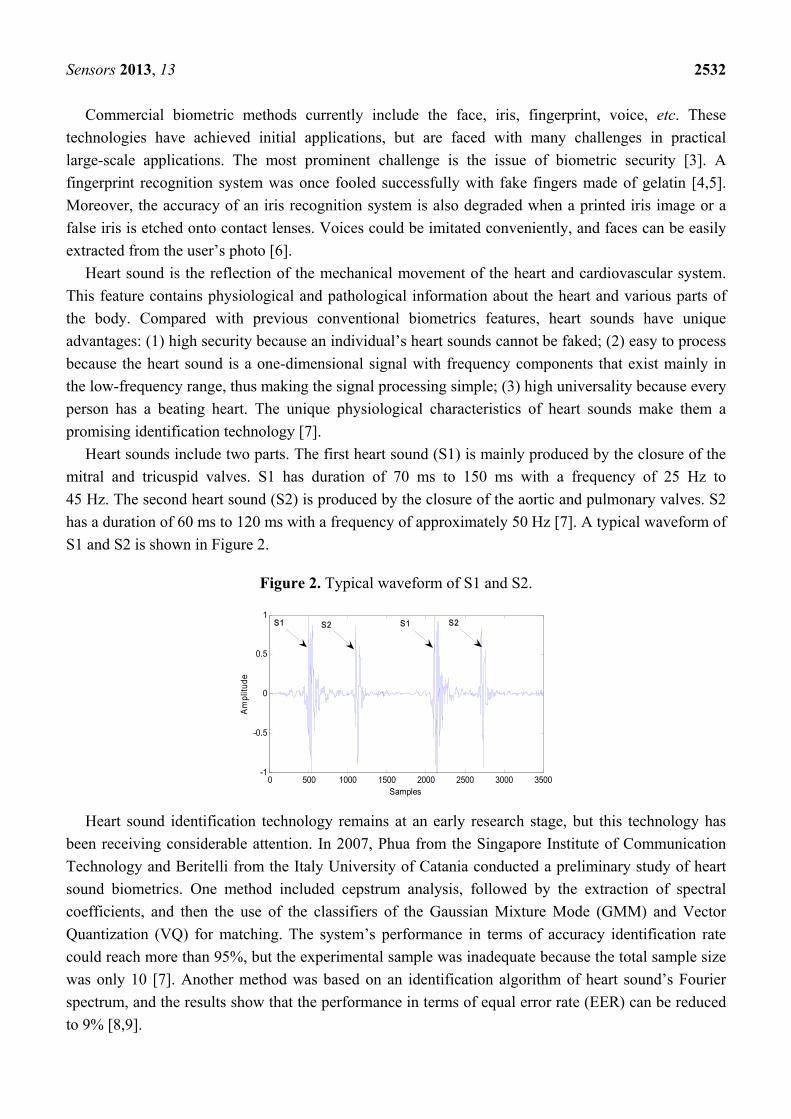
Heart sounds include two parts. The first heart sound (S1) is mainly produced by the closure of the mitral and tricuspid valves. S1 has duration of 70 ms to 150 ms with a frequency of 25 Hz to 45 Hz. The second heart sound (S2) is produced by the closure of the aortic and pulmonary valves. S2 has a duration of 60 ms to 120 ms with a frequency of approximately 50 Hz [7]. A typical waveform of S1 and S2 is shown in Figure 2.
Figure 2. Typical waveform of S1 and S2.
Heart sound identification technology remains at an early research stage, but this technology has been receiving considerable attention. In 2007, Phua from the Singapore Institute of Communication Technology and Beritelli from the Italy University of Catania conducted a preliminary study of heart sound biometrics. One method included cepstrum analysis, followed by the extraction of spectral coefficients, and then the use of the classifiers of the Gaussian Mixture Mode (GMM) and Vector Quantization (VQ) for matching. The system’s performance in terms of accuracy identification rate could reach more than 95%, but the experimental sample was inadequate because the total sample size was only 10 [7]. Another method was based on an identification algorithm of heart sound’s Fourier spectrum, and the results show that the performance in terms of equal error rate (EER) can be reduced to 9% [8,9].
0 500 1000 1500 2000 2500 3000 3500-1
-0.5
0
0.5
1
Samples
Am
plitu
de
S1 S2 S1 S2

Sensors 2013, 13 2533
A large number of studies have recently been developed on this field. In Jasper and Othman’s work, wavelet transform (WT) was used to analyze the signal in the time-frequency domain, and then the Shannon energy envelogram was selected as the feature set. Performance was found to be acceptable based on a database of 10 people [10], but as in [7], the sample size was inadequate. Bendary et al. [11] extracted three features: auto-correlation, cross-correlation, and cepstrum. The features were used as the feature set. Meanwhile, of the two classifiers used, i.e., mean square error (MSE) and K-nearest neighbor (KNN), KNN was proven to perform better than MSE.
Tao et al. used the signals’ cycle-power-frequency drawing and improved the D-S information fusion method to realize identity recognition based on heart sounds [12]. Guo et al. used a feature set of linear prediction cepstrum coefficient (LPCC), the hidden Markov model (HMM), and wavelet neural network (WNN) to acquire the heart sound classification information and to realize identity recognition [13]. Cheng et al. presented a synthetic model of heart sounds and then used the heart sounds’ linear band frequency cepstrum (HS-LBFC) as a specified configuration with similarity distance to achieve recognition and verification [14]. The three methods are theoretically feasible but involve feature or model integration that can result in a more complicated implementation of the identification system.
The primary studies on this novel biometric method are summarized in Table 2. Given that no standard database exists and because of the use of different performance metrics, the various performances cannot be compared.
Table 2. Primary studies on heart sound biometrics.
Author Year Database Size Feature Set Classification Identification Mode Phua et al. 2007 10 people LBFC MFCC VQ GMM Recognition
Beritelli et al. 2007 20 people STFT Euclidean distance Verification Jasper et al. 2010 10 people Envelogram Euclidean distance Recognition
Bendary et al. 2010 40 people Auto-correlation, Cross-correlation
Cepstrum MSE KNN Recognition
Tao et al. 2010 5 to 100 people Cycle Power Frequency
- Verification Recognition
Guo et al. 2010 80 people LPCC HMM WNN Recognition
Cheng et al. 2012 12 people HS-LBFC similarity distance Verification Recognition
Heart sound biometrics remains at the preliminary research stage with numerous unresolved issues: poor robustness under a noisy environment; the impact of heart diseases on identification accuracy; and non-comprehensive test samples. Meanwhile, accuracy improvement has not yet been explored, given that the auscultation changes in the location of this new biometric technology were mostly borrowed from other biometrics technologies such as speaker identification.
Heart sound are typical non-stationary signals, but traditional signal processing methods such as Fast Fourier Transform (FFT), Short-Time Fourier Transform (STFT), WT, etc. cannot easily process heart sounds. Thus, Norden Huang proposed a novel signal processing algorithm called the Hilbert-

Sensors 2013, 13 2534
Huang transform (HHT) [15], which has been widely used in the frequency analysis of non-stationary signals and has been proven to be a powerful tool for non-stationary signal processing.
In this paper, a method for the extraction of a novel feature, the marginal spectrum used in identification based on heart sounds, is presented. HHT consists of two main parts: Empirical Mode Decomposition (EMD), which can be replaced by Ensemble Empirical Mode Decomposition (EEMD), and Hilbert transform (HT). The basic procedure when using HHT to extract a non-stationary signal’s spectrum is as follows: first, the given signal is decomposed into several intrinsic mode functions (IMFs) by EEMD. HT is then applied to each IMF to obtain the corresponding Hilbert spectrum. That is, each IMF is expressed in the time-frequency domain, and then all the IMF’s Hilbert spectrum will be aggregated to derive the original signal’s Hilbert spectrum. Finally, the signal’s marginal spectrum is derived in the feature extraction stage.
The remainder of this paper is organized as follows: Section 2 presents the theory of EMD, EEMD, and marginal spectrum. Section 3 describes the heart sound identification system, especially the extraction steps, in detail. The optimal system parameters are illustrated in Section 4 by experiments. Finally, Section 5 summarizes our conclusions.
2. Basic Theory of HHT and Its Marginal Spectrum
2.1. EMD
Most non-stationary signals may contain more than one oscillation mode, which is why the HT of the original signal cannot produce an accurate instantaneous frequency of non-stationary signal. Empirical mode decomposition can adaptively decompose signal into a finite and often a series of small number of IMFs, which satisfy the following two conditions:
(1) In the whole signal, the number of extrema and zero-crossings must be equal to or less than one.
(2) At any point in the signal, the mean value of the envelope defined by the local maxima and that defined by the local minima must be zero.
These two conditions guarantee the well-behaved HT. The IMFs represent the oscillatory modes embedded in signal. Applying HT to each IMF, the instantaneous frequency and amplitude of each IMF can be obtained which constitute the time-frequency-energy distribution of signal, called as Hilbert spectrum. Hilbert spectrum provides higher resolution and concentration in time-frequency plane and avoids the false high frequency and energy dispersion existed in Fourier spectrum.
To obtain meaningful instantaneous frequency, the signal must be decomposed into a number of different IMFs by sifting process, which can be separated into the following steps:
(1) All the local extrema are identified, and then all of the local maxima are connected by a cubic spline line as the upper envelope.
(2) Similar to step1, all the minima are connected by a cubic spline line as the lower envelope. (3) The mean of the upper and lower envelopes is defined as m1, which is removed from the
original signal x(t) to obtain h1:
1 1( )h x t m= − (1)

Sensors 2013, 13 2535
h1 should be an IMF because the construction of h1 satisfies all the above IMFs’ conditions. However, in the case of a dramatic change in the original signal, the cubic spline line often generates new extrema or moves the pre-existing extrema. Moreover, the cubic spline line still has some problems at both ends of the signal, and the boundary effect reduces the accuracy of the IMFs’ construction process. Thus, we need to repeat the above steps to obtain an exact IMF, that is,
(4) When h1 does not meet IMF’s conditions, step (1) to (3) are repeated to obtain the mean envelope m11, and then h11 = h1 − m11 are used to determine whether the IMFs’ conditions are met. This process can be repeated up to k times to obtain h1k as an IMF. Designated as c1 = h1k, c1 denotes the first IMF component of the signal.
(5) c1 is subtracted from the original signal, and the difference is the residue component r1:
1 1( )r x t c= − (2)
where r1 is taken as the new original signal, and the second IMF component c2 can be obtained by using the above process. Thus, the above process is repeated n times to obtain n IMF components of the signal:
1 2 2
2 3 3
1
.
.
.
n n n
r c rr c r
r c r−
− =⎧⎪ − =⎪⎪⎨⎪⎪
− =⎪⎩
(3)
Eventually, the stopping rule is: (1) the component cn or the residue component rn is less than a predetermined threshold or (2) the residue component rn becomes a monotonic function, such that a new IMF cannot be obtained from it. Finally, the signal can be expressed as the sum of n IMFs and the residual component:
1( )
n
i ni
x t c r=
= +∑ (4)
where c1, c2,…, cn represent the signal characteristics in the different time scales. These IMFs contain the signal of different frequency components from high to low, and each IMF includes a frequency band range that adaptively changes with a specific signal, which is one of the advantages of EMD. EMD does not use any pre-determined filter or function, which is a data driven method.
2.2. EEMD
Although EMD has numerous advantages in terms of the analysis of non-stationary signals, most signals are not always symmetrically distributed on the timeline, which may result in a condition wherein one IMF includes large-scale differences in signal components or wherein similar components exist in different IMFs. This condition is called as the mode aliasing phenomenon, which greatly affects signal analysis. To solve the mode mixing problem, a new method called EEMD was proposed by Huang in 2009 [16]. By using the Gaussian white noise’s characteristics of regular distribution in

Sensors 2013, 13 2536
the frequency domain, this method adds Gaussian white noise into the analyzed signal to make such signal continuous at different scales to avoid mode mixing.
The principle of EEMD is very simple. All the processed signals can be decomposed into two parts: signal and noise. Each signal is independently observed to contain different noises. To provide a regular and relevant distribution size, white Gaussian noise is added to the signal. The additional noise will reduce the signal-to-noise ratio (SNR) and can help eliminate the aliasing mode. When the Gaussian white noise of regular distribution is added to the signal, different scales of the signal are automatically decomposed into the appropriate scales associated with the Gaussian white noise. Finally, the decomposition results are averaged to eliminate the added noise. The steps are shown as follows:
A mean of zero standard deviation of a constant Gaussian white noise w(t) is added to the processed signal x(t) to obtain an new signal X(t), that is, X(t) = x(t) + w(t). EMD is applied to X(t) to obtain each IMF component cj and the residual component rn:
1( )
n
j nj
X t c r=
= +∑ (5)
Different white noises wi(t) are added to the processed signal to obtain Xi(t) = x(t) + wi(t). The above steps are repeated to obtain the IMF’s component:
1
( )n
i ij ini
X t c r=
= +∑ (6)
According to the principle that an unrelated random sequence’s statistic mean is zero, the corresponding IMF’s mean value is believed to eliminate the impact of the added Gaussian white noise, and the final IMFs is:
1
1 N
j iji
c cN =
= ∑ (7)
where N denotes the total ensemble number. EEMD takes advantage of the statistical properties of noise and the decomposition principle of
EMD, thus making it a suitable binary filter for arbitrary data. Model aliasing can also be solved effectively by adding white noise.
In addition, EEMD decreases the amount of the noise based on the statistical law of the following formula [16]:
ˆNεε = (8)
where N is the overall number, ε is the magnitude of the noise; and ε̂ is the error between the processed signal and the final IMFs, which are summed to obtain signal. In other words, in the case of constant noise amplitude, a greater overall number N yields a more accurate final result of decomposition. However, if the amplitude is extremely small and the SNR is extremely high, the noise would not affect the extremas’ selection, thus losing the role of supplementary scales.

S
wAsa
T
Efa
Sensors 201
Supposin
where the siAfter being simulation sare shown in
Figure(c) IM
The similThe mode al
Figure 4(EEMD. Thefrequency cadaptive, wh
3, 13
ng the simul
(
a
w t
m
=
=ignal point decompose
signal is pron the Figure
e 3. (a) SimMFs of the si
lar componeliasing phen(a) is a care signal is omponent. hich guaran
lation signal
sin(20.2
)0.215
0,1,2,3
tt
t
π= × ×−⎧
= ⎨ +⎩=is 1,000, aned by EMDocessed by ue 3(c).
mulation signimulation si
(b)
ents are evidnomenon is rdiac cycle sequently The decom
ntees the inh
l’s expressi
) 10 ( )2 0.015
0.015
t w tm
m
+ ×− ×
+ × −
nd samplingD, the IMFsusing EEMD
nal; (b) IMFignal obtain
dent in diffeeffectivelyof a heart decompose
mposition baherent chara
on is:
)* ( ), 0.2 0, 0.215
t nm
t
δ −+
− +
g frequencys are shownD. The prev
Fs of the simned by using
(a)
erent IMFs ieliminatedsound sign
ed into the asic functioacteristic of
( ...,0.03
0.03
nm t
m
= −× < <
+ × <
y fs is 2,000n in Figure vious two IM
mulation sigg EEMD.
n Figure 3(bby using E
nal. Each Ihighest fre
on that is dsignal and
2, 1,0,1,2,0.215 0.0
0.23 0.t
− −< +
< +
0 Hz. Figure3(b). We s
MFs and the
gnal obtaine
(c)
b) but are noEEMD. IMF is showequency co
directly obtaavoids the d
,...)03.03
mm
××
e 3(a) showselect N as e residue co
ed by using
ot present in
wn in Figuomponent toained from diffusion an
253
(9
ws this signa100 and th
omponent r(
g EMD;
n Figure 3(c
ure 4(b,c) bo the lowethe signal
nd leakage o
37
9)
al. he (t)
c).
by est is of

Sensors 2013, 13 2538
signal energy. This feature is a significant improvement of EEMD compared with traditional signal processes. For the Fourier transform, the decomposition basic function is a fixed frequency and amplitude harmonic wave function, where each harmonic wave function characterizes the energy at a specific frequency.
Figure 4. (a) Cardiac cycle of a heart sound signal; (b) First five IMF components of (a)’s signal; (c) Last four IMF components of (a)’s signal.
(a)
(b) (c)
For the wavelet and wavelet packet analyses basis functions are determined in advance and do not change with different signals. Obviously, different decomposition basic functions are needed for the optimal decomposition of different signals. The best results cannot be guaranteed with pre-determined basic functions.
EEMD’s adaptability can characterize the properties of the signal, thus ensuring the accuracy of decomposition. Moreover, each IMF component shows a clear physical meaning, which enables the derivation of instantaneous frequency after HT. Signal frequency can be expressed precisely, which is why EEMD is suitable for non-stationary signal processing.
0 100 200 300 400 500 600 700 800-1
-0.8
-0.6
-0.4
-0.2
0
0.2
0.4
0.6
0.8
1
Time(ms)
0 100 200 300 400 500 600 700 800-1
0
1
0 100 200 300 400 500 600 700 800-0.5
0
0.5
0 100 200 300 400 500 600 700 800-0.5
0
0.5
0 100 200 300 400 500 600 700 800-0.1
0
0.1
0 100 200 300 400 500 600 700 800-0.1
0
0.1
Time(ms)
0 100 200 300 400 500 600 700 800-0.05
0
0.05
0 100 200 300 400 500 600 700 800-0.01
0
0.01
0 100 200 300 400 500 600 700 800-5
0
5x 10⁻³
0 100 200 300 400 500 600 700 800-6
-4
-2x 10⁻³
Time(ms)
Sensors 2013, 13 2539
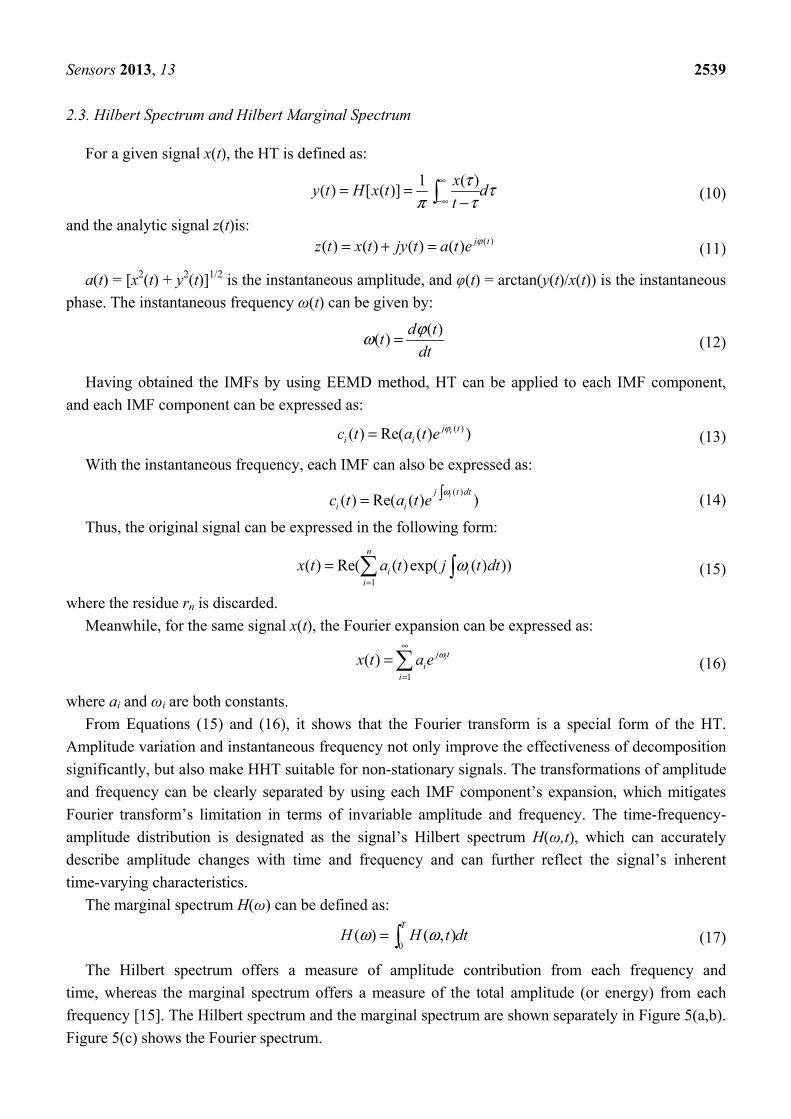
2.3. Hilbert Spectrum and Hilbert Marginal Spectrum
For a given signal x(t), the HT is defined as:
1 ( )( ) [ ( )] xy t H x t dt
τ τπ τ
∞
−∞= =
−∫ (10)
and the analytic signal z(t)is: ( )( ) ( ) ( ) ( ) j tz t x t jy t a t e ϕ= + = (11)
a(t) = [x2(t) + y2(t)]1/2 is the instantaneous amplitude, and φ(t) = arctan(y(t)/x(t)) is the instantaneous phase. The instantaneous frequency ω(t) can be given by:
( )( ) d ttdtϕω = (12)
Having obtained the IMFs by using EEMD method, HT can be applied to each IMF component, and each IMF component can be expressed as:
( )( ) Re( ( ) )ij ti ic t a t e ϕ= (13)
With the instantaneous frequency, each IMF can also be expressed as: ( )
( ) Re( ( ) )ij t dti ic t a t e
ω∫= (14)
Thus, the original signal can be expressed in the following form:
1( ) Re( ( )exp( ( ) ))
n
i ii
x t a t j t dtω=
= ∑ ∫ (15)
where the residue rn is discarded. Meanwhile, for the same signal x(t), the Fourier expansion can be expressed as:
1
( ) ij ti
i
x t a e ω∞
=
=∑ (16)
where ai and ωi are both constants. From Equations (15) and (16), it shows that the Fourier transform is a special form of the HT.
Amplitude variation and instantaneous frequency not only improve the effectiveness of decomposition significantly, but also make HHT suitable for non-stationary signals. The transformations of amplitude and frequency can be clearly separated by using each IMF component’s expansion, which mitigates Fourier transform’s limitation in terms of invariable amplitude and frequency. The time-frequency-amplitude distribution is designated as the signal’s Hilbert spectrum H(ω,t), which can accurately describe amplitude changes with time and frequency and can further reflect the signal’s inherent time-varying characteristics.
The marginal spectrum H(ω) can be defined as:
0( ) ( , )
TH H t dtω ω= ∫ (17)
The Hilbert spectrum offers a measure of amplitude contribution from each frequency and time, whereas the marginal spectrum offers a measure of the total amplitude (or energy) from each frequency [15]. The Hilbert spectrum and the marginal spectrum are shown separately in Figure 5(a,b). Figure 5(c) shows the Fourier spectrum.
Sensors 2013, 13 2540
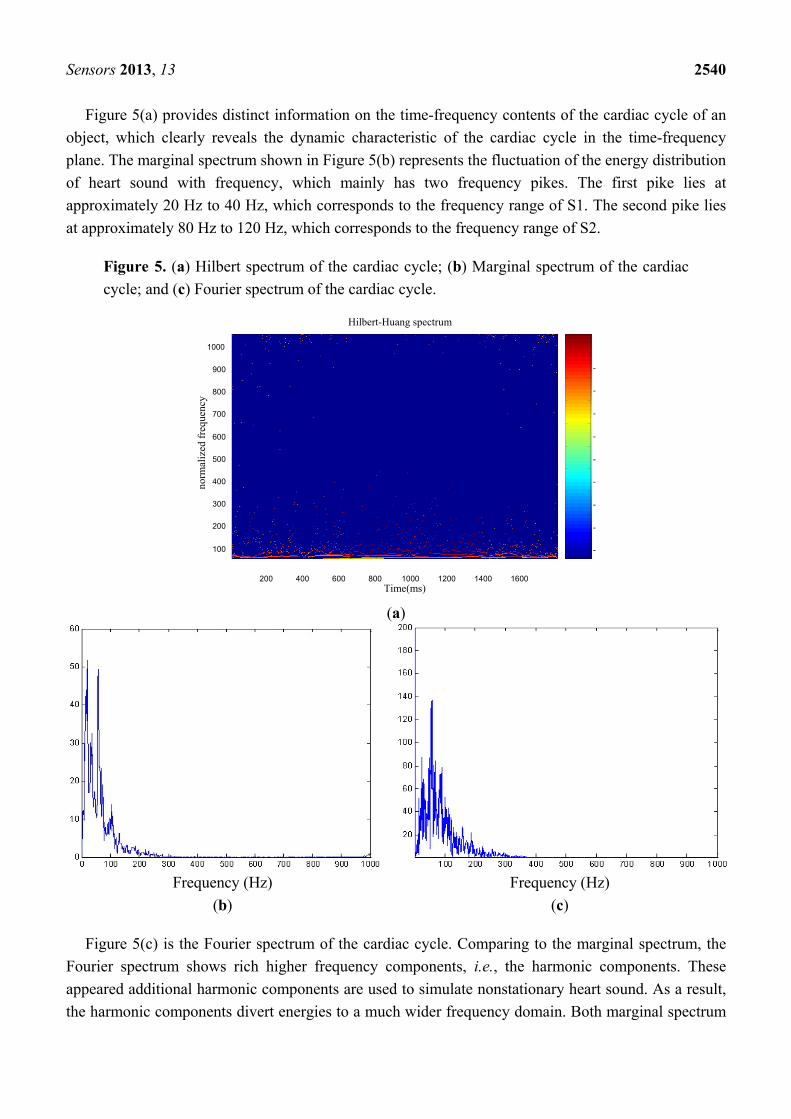
Figure 5(a) provides distinct information on the time-frequency contents of the cardiac cycle of an object, which clearly reveals the dynamic characteristic of the cardiac cycle in the time-frequency plane. The marginal spectrum shown in Figure 5(b) represents the fluctuation of the energy distribution of heart sound with frequency, which mainly has two frequency pikes. The first pike lies at approximately 20 Hz to 40 Hz, which corresponds to the frequency range of S1. The second pike lies at approximately 80 Hz to 120 Hz, which corresponds to the frequency range of S2.
Figure 5. (a) Hilbert spectrum of the cardiac cycle; (b) Marginal spectrum of the cardiac cycle; and (c) Fourier spectrum of the cardiac cycle.
(a)
Frequency (Hz) (b)
Frequency (Hz) (c)
Figure 5(c) is the Fourier spectrum of the cardiac cycle. Comparing to the marginal spectrum, the Fourier spectrum shows rich higher frequency components, i.e., the harmonic components. These appeared additional harmonic components are used to simulate nonstationary heart sound. As a result, the harmonic components divert energies to a much wider frequency domain. Both marginal spectrum
Time(ms)200 400 600 800 1000 1200 1400 1600
100
200
300
400
500
600
700
800
900
1000
-
-
-
-
-
-
-
-
-
norm
aliz
ed fr
eque
ncy
Hilbert-Huang spectrum
Sensors 2013, 13 2541
and Fourier spectrum reflect signal energy changing with frequency, but the Fourier spectrum does not provide reasonable physical explanations since the data is not stationary.
Based on the accuracy of signal decomposition and on the advantages of HHT, the marginal spectrum is used in this paper and is compared with the Fourier spectrum in the experiments in Section 4, which will prove that the marginal spectrum can be an effective representation of a heart sound’s personality trait.
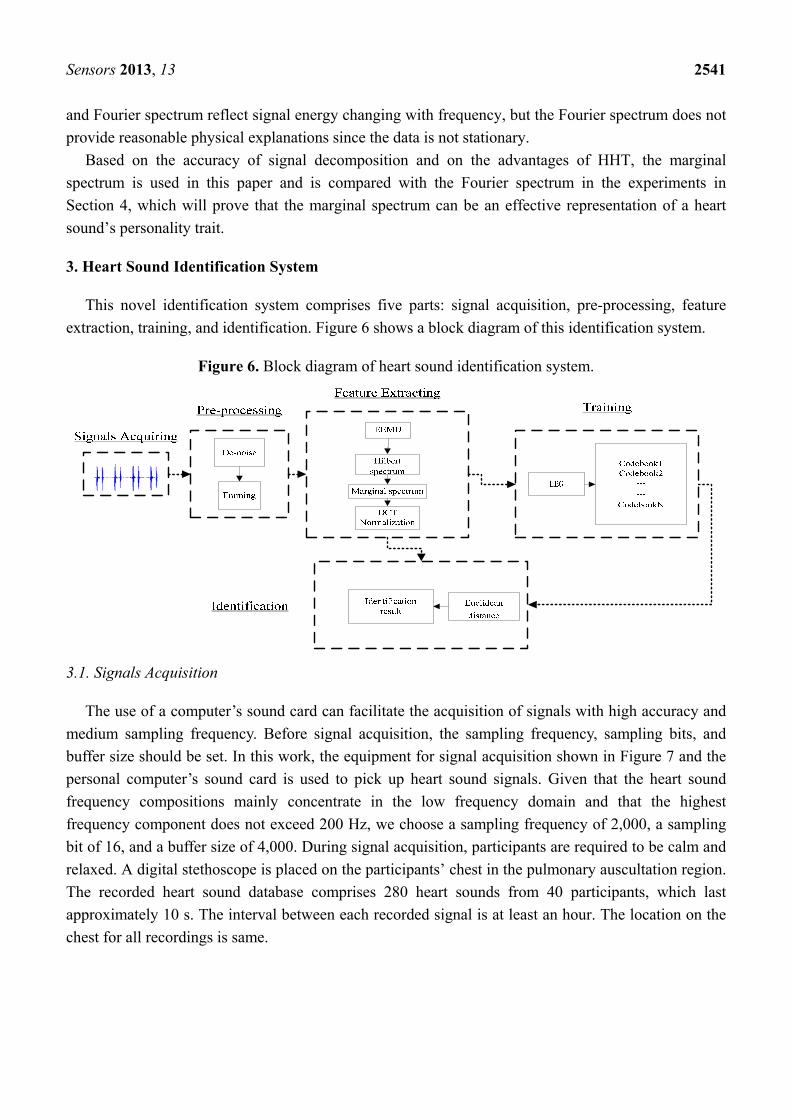
3. Heart Sound Identification System
This novel identification system comprises five parts: signal acquisition, pre-processing, feature extraction, training, and identification. Figure 6 shows a block diagram of this identification system.
Figure 6. Block diagram of heart sound identification system.
3.1. Signals Acquisition
The use of a computer’s sound card can facilitate the acquisition of signals with high accuracy and medium sampling frequency. Before signal acquisition, the sampling frequency, sampling bits, and buffer size should be set. In this work, the equipment for signal acquisition shown in Figure 7 and the personal computer’s sound card is used to pick up heart sound signals. Given that the heart sound frequency compositions mainly concentrate in the low frequency domain and that the highest frequency component does not exceed 200 Hz, we choose a sampling frequency of 2,000, a sampling bit of 16, and a buffer size of 4,000. During signal acquisition, participants are required to be calm and relaxed. A digital stethoscope is placed on the participants’ chest in the pulmonary auscultation region. The recorded heart sound database comprises 280 heart sounds from 40 participants, which last approximately 10 s. The interval between each recorded signal is at least an hour. The location on the chest for all recordings is same.

Sensors 2013, 13 2542
Figure 7. Equipment for signal acquisition.
3.2. Pre-Processing
3.2.1. De-Noising
Given the influence of the acquisition environment and of the electronic stethoscope, the collected heart sound signals contain various kinds of noises, which is still affected by interferences such as body movement, lung sounds and other surrounding sounds. If these noises are not removed, the accuracy of the features will be seriously affected and ultimately influence the identification system’s performance. Given that heart sounds are non-stationary, the discrete WT (DWT) was utilized to solve this problem.
The specific de-noising steps are: (1) the fifth-order Daubechies wavelet is selected as the mother wavelet to decompose the heart sound signal into six scales; (2) the WT coefficients at the third, fourth, fifth, and sixth scales are retained based on an energy-based threshold [17], whereas the coefficients related to other scales are set to zero; and (3) the signal is reconstructed by using inverse DWT (IDWT). A de-noised heart sound signal along with its corresponding raw signal is depicted in Figure 8.
Figure 8. Raw heart sound signal and the corresponding de-noised signal.
0 1000 2000 3000-1
-0.8
-0.6
-0.4
-0.2
0
0.2
0.4
0.6
0.8
1
去去去去去去0 1000 2000 3000
-1
-0.8
-0.6
-0.4
-0.2
0
0.2
0.4
0.6
0.8
1
去去去去去去

Sensors 2013, 13 2543
3.2.2. Framing
Given the non-stationary nature of heart sounds, signals must be divided into short segments called frames. Obviously, the subsequent feature extraction is based on each frame. The length of this segment is called frame length, and the distance from the beginning of a frame to the beginning of the subsequent one is called frame shift. Numerous windows can be applied to decompose signals into frames. The duration of the window is equal to the frame length. In the experiment phase, we will discuss whether different types of windows as well as different frame lengths and frame shifts would affect the system’s performance.
3.3. Feature Extracting
In this work, the marginal spectrum is extracted as the feature. Figure 9 shows the flow chart of the feature extraction procedure.
Figure 9. Block diagram of feature extraction process.
0 100 200 300 400 500 600 700 800-1
0
1
0 100 200 300 400 500 600 700 800-0.5
0
0.5
0 100 200 300 400 500 600 700 800-0.5
0
0.5
0 100 200 300 400 500 600 700 800-0.1
0
0.1
0 100 200 300 400 500 600 700 800-0.1
0
0.1
Time(ms)
0 100 200 300 400 500 600 700 800 900 10000
5
10
15
20
25
Frequency(Hz)
0 10 20 30 40 50 60 70 80 90 100-0.4
-0.2
0
0.2
0.4
0.6
0.8
1
time
norm
alized
freq
uenc
y
Hilbert-Huang spectrum
500 1000 1500
200
400
600
800
1000 ( , )H tω ( )H ωIMFs
( )c n
(1) EEMD is applied to each frame signal x(n) to obtain the IMFs of the signal. Then, two parameters: the number of the ensemble N and the ratio between the added noise’s standard deviation and the heart sound r are derived. Two experiments will be conducted to select an optimal set for N and r.
(2) Hilbert spectrum H(ω,t) of each frame will be determined by applying HT to each IMF, which represents the amplitude and the instantaneous frequency in a three-dimensional plot with respect to time and reveals clearly the physiological properties of heart sound in time-frequency plane.
(3) Three-domain Hilbert spectrum H(ω,t) of each frame signal is integral in the time domain to obtain the Marginal spectrum H(ω). The performance will be compared with that of the Fourier spectrum, which has the same physical meaning.
(4) Dimension compression and amplitude normalization: the spectrum coefficients c(n) are followed by the Discrete Cosine Transform (DCT). The dimension is reduced to an appropriate dimension for the subsequent training and identification phase. In the experiment phase, the effects of different dimensions and of amplitude normalization will be used to normalize the spectrum coefficient amplitudes to a range between 0 and 1 by dividing the absolute maximum value of these coefficients.
Sensors 2013, 13 2544
3.4. Training
VQ is a conventional and successful classifier in pattern recognition [18]. Compared with other identification models (such as GMM), VQ model‘s advantage lies in the simplicity of the design and little calculation time, which is very suitable for quick recognition. So in this work, VQ is used as a classifier in the heart sound identification system. The basic idea behind VQ is to compress a large number of feature vectors into a small set of code vectors. Given a vector source with known statistical properties, a distortion measure, and a given number of code-vectors, a codebook and partition need to be identified to achieve the smallest average distortion. Assuming the smallest average distortion is given by:
11
1 ( , )minT
ii j m
m Mj
D d x BT ≤ ≤=
⎡ ⎤= ⎣ ⎦∑ (18)
where xj(j = 1,2,…,T) is the feature vector arising from the user who will be identified. Bi m is the
codebook formatted in the training phase, and it presents the i-th codebook of m-th codeword. For d(xj, Bi
m), the Euclidean distance can be used for measurement. In the identification stage, each user’s D is calculated by using Equation (18), and the final recognition result is the smallest D that corresponds to the person.
In these experiments, the VQ codebook is trained with the Linde-Buzo-Gray algorithm [19] iteratively to minimize the quantization error, and the Euclidean distance is used to measure the quantization error. LBG algorithm bypasses the need for multi-dimensional integration. In this work, we use LBG-VQ algorithm for the proposed heart sound based identification. We will determine the optimal choice of the number of mixture components for the VQ later.
4. Experiments Results and Analysis
In this system, the recognition method can be classified as one-to-many comparisons. That is, all the users’ templates in the database must be searched for a match when an individual is recognized. The decision criterion is the minimum Euclidean distance described above. Three signal recordings of each participant are used in this phase to test the system’s performance. The results of these experiments will be described based on the correct recognition rate (CRR):
100n
n
CCRRT
= × (19)
where Cn is the number of correct recognitions, and Tn is the total number of testing samples. That is, CRR is our system’s performance metric.
There are 40 participants and 7 heart sound recordings for each participant. Each recording lasts approximately 10 s. Four recordings of each person are selected randomly to build the model in the training phase. The rests are randomly used for identification in the testing phase. Heart sound biometric system based on marginal spectrum analysis and VQ presented in Section 3 is used. Preliminary experiments are conducted to evaluate the performance of different parameter setting: EEMD parameters, number of VQ codebook, Window type, frame length and frame shift, DCT dimension compression degree and different feature sets.

S
4
dh2fn
oathf
wthinfcufin
Sensors 201
4.1. Window
In this sediscussed. Aheart sound20 ms to 25 frames, the pnon-overlap
First, the of 64 ms, Vapplying thehe Hammin
following co
Figure(b) Pe
Next, thewindow typhe optimal ncreased fro
frame lengthconsidered ausually abouframe lengthn Figure 10
50
60
70
80
90
100
CRR(%)
3, 13
w Type, Fram
ection, the According tds because o
ms. In [7], performanc property arwindow typ
VQ-32, feate Hammingng windowonclusion ca
e 10. (a) rformance o
e CRR of oe and a framparametersom 64 ms th of 256 msa quasi-statiut 20–25 msh of 256 ms0(b) indicat
64 1
70.8375
fra
me Length a
effects of to [7], a staof their quwhen frame is optimalre not needepe is changure dimens
g window, tw is superio
an be drawn
Table3.
WRectHamHa
Performanof the system
(a)
our system me shift of : VQ-32, feo 512 ms. ts is the optiionary signas. Finally, t is verified.
te that when
128 256
5.50
94.16
ame length(ms)
and Frame
different wandard speeuasi-periodice shift is eql. In this syed to determ
ged on the bsion of 100the CRR is or to the Hn: window t
. CRR when
Window Typtangular windmming windanning windo
nce of them when usi
is evaluatedf a quarter feature dimenthe conclusimal choice.al for a lonthe influenc. Frame shifn the frame
512
6
87.50
Shift
window typech frame lec nature. Tqual to the fstem, the si
mine whetheasis of a fix, N of 20 athe highest
Hanning wintype does no
n using diffe
pe dow
dow ow
e system ing differen
d based on frame lengthnsion of 10ion of the lo. If conditioger time tha
ce of frame ft was incree shift is a
pes, frame length of 20hus, the fra
frame lengthgnal lengther the tool rexed the framand r of 0.2t. However,ndow by onot significan
erent windo
CRR (93.394.192.5
when usinnt frame shif
different frh. Note that
00, N of 20 onger segmons remain can speech sshift based ased from 3quarter fram
50556065707580859095100
91
CRR(%)
lengths, an0 ms to 25 ame lengthh, that is, no
hs are appropemains suit
me length of2. As show, this influenly 1.66% ntly affect s
ow types.
(%) 33 16 50
ng differenfts.
(b)
frame lengtht, the other and r of 0.2ent is conficonstant, thsignal, the fon a Hamm
32 ms to 25me length,
32 64
1.6694.16
frame
d frames sms is inap
h should beo overlap expriate, suchable. f 256 ms an
wn in the Taence is mini
in terms osystem perfo
nt frame le
)
hs with fixeparameters
2. The framrmed in Fig
he heart souframe lengthming windo6 ms. The rthe best pe
128
6
87.50
shift(ms)
254
hifts will bpropriate fo
e longer thaxists betweeh that tests o
nd frame shiable 3, wheimal becaus
of CRR. Thormance.
engths;
ed Hammins also choos
me length wagure 10(a). Aund is usuallh of whichw type and
results showerformance
256
83.33
45
be or an en on
ift en se he
ng se as A ly is a
wn is

Sensors 2013, 13 2546
achieved. This conclusion differs from that of [7], where the best results are achieved with the non-overlap property. Moreover, this finding proves that non-overlapping of a few frames is not optimal in cases with insufficient signal length. The result does not conflict with that of [7], which conforms to different parameters.
4.2. Performance under Different EEMD Parameters
To use EEMD for the calculation of the marginal spectrum, two parameters must be predetermined: the number of the ensemble N and the ratio between the added noise’s standard deviation and that of the heart sound r.
Experiment was performed to select an optical set for the accurate extraction of spectrum features as the new feature set. Note that, a frame length of 256 ms with frame shift of 64 ms, VQ-32, Hamming window type and feature dimension of 100 have been used. We will discuss the choice of these parameters later. In order to determine to the optimal N and r value, N was chosen from 10 to 30 by 5 steps, r varied from 0.1 to 0.3. The results of CRR based on two parameters are shown in Figure 11.
Figure 11. Performance of the heart sound identification system based on EEMD’s N and r.
As shown in Figure 11, when r is 0.2 and N is 20, the heart sound identification system achieves the best result of 94.16%. However, when the value of r is fixed, a greater N does not necessarily result in better performance. When N reaches a certain value 20, the precision of decomposition is at its maximum, and increasing N would no longer improve decomposition accuracy. Because EEMD improves the uniform distribution of signals, too much white noise is useless when signals have reached the uniform distribution.
Similar to the previous analysis about r, if the noise is extremely small, it may not cause the change of extrema, thus losing the role of supplementary scales and ultimately affecting the results of feature extraction. If the added noise is extremely large, the added noise will affect the SNR and confuse the decomposition results. So r was fixed 0.2 as a middle value with N = 20, which was the optimal choice for this system.
10 15 20 25 300.7
0.75
0.8
0.85
0.9
0.95
number of N
CR
R
r=0.3r=0.15r=0.2r=0.25r=0.1

S
4
trsothctysdrCd
4
clepccrC
Sensors 201
4.3. DCT Di
Spectrumransform co
smaller enerobvious disthis section
compressionype, frame
system has dimension israw spectrumCRR is onlydistortion ra
Figurewith fHamm
4.4. Number
In this seconstant 20 ength of 25
parameters codebook ocoefficients require morConsidering
3, 13
imension Co
m coefficienoefficients. rgy contribtortion of th, spectrum n degree onlength of 2achieved ths compressem. Accordiy 79.16%. Wate. When th
e 12. Perfoframe lengt
ming window
r of VQ Cod
ection, we and 0.2, re
56 ms, and flater. As sh
of 32 (VQ-cannot be
re storage g the factors
CRR(%)
ompression
nts are transDimension
bution coeffhe original
coefficientn the CRR a256 ms, framhe best CRed to be extingly, systeWith decreahe dimensio
formance bth of 256 w.
debooks
determine spectively. frame shift hown in Fi32). When accurately space, and
s above, VQ
60
70
80
90
100
40
79.
Degree
formed by un compressificient whilspectrum c
ts are comat an originame shift of
RR of 94.16tremely smaem performasing comp
on increased
ased on thms, frame
the optimalNote that, Hof 64 ms haigure 13, th
the codebapproximat
d the compQ-32 is selec
0 60
16
85.8
demension
using DCT,ion could ble retainingcoefficients
mpressed froal dimensio64 ms, N o
6% with 10all, the proc
mance will bpression degd up to 100,
he differentshift of 6
l number oHamming wave also beehis VQ-bas
book numbeted. Meanwputational cted as the f
0 80
83 88.33
of spectrum
, and the enbe easily reg the bigge
but also acom 40 to 1on of 256 baf 20 and r o
00 spectrumcessed coeffbe degradedgree, the CRthe CRR ca
t DCT dim4 ms, N o
of codebookwindow typen chosen. Wsed system er is extrem
while, if thecomplexity
final training
100
3
94.16
m coefficien
nergy can bealized throer ones. DCchieves dim120 to test ased on VQof 0.2. As s
m coefficienfficients cand. At 40 spRR increasean no longe
mension comof 20, r of
ks for VQ wpe, feature dWe will disreaches its
mely small number is
y will also g model in t
120
94.16
nts
e concentraugh the rem
CT not onlymension com
the influenQ-32, Hammshown in Fint dimension no longer pectrum coees because
er increase.
mpression f 0.2, VQ-3
when N andimension oscuss the chs best perfo, the origingreat, morincrease s
the followin
254
ated on a fewmoval of thy avoids th
mpression. Ince of DC
ming windowigure 12, thn. When threpresent thefficient, thof the lowe
degree 32 and
nd r are kepof 100, framhoice of thesormance atnal spectrumre codebooksignificantlyng section.
47
w he he In
CT w
his he he he er
pt me se a
m ks y.

S
d1p
r
4
Dfo
Sensors 201
FigurelengthHamm
Furthermdegree and 100, 120 andparameters a
Figuredimen
DCT dimresult accord
4.5. Margina
In this woDuring the feature dimeoptimal valu
3, 13
e 13. Perfoh of 256 msming window
more, anotheNumber ofd number oare shown in
e 14. Perfonsion and co
mension comd with the a
al Spectrum
ork, the maextraction oension of 1ues discusse
CRR(%)
CR
R10
0%
ormance of s, frame shiw.
er experimef VQ codebof VQ codebn Figure 14
rmance of odebooks.
mpression dabove experi
m and Fouri
arginal and Fof the marg00, frame l
ed above. R
60
70
80
90
100
4
80.
0 1070
75
80
85
90
95
100
f the systemift of 64 ms
ent is madebook, DCT book is cho
4.
the heart so
degree-100 iments sepa
ier Spectrum
Fourier speginal spectrlength of 2esults are sh
4 8
00
87.5
nu
0 20 3nu
m based ons, N of 20,
e to validadimension
osen as 4, 8,
ound identi
and VQ-3arately.
m
ctra, whichrum, N of 256 ms, andhown in Tab
16
5090.00
umber of VQ
30 40mber of codeb
n the numbr of 0.2, fe
ate the opticompressio
, 16, 32, 64
fication sys
2 is the op
h have the sa20, r of 0.2d frame shifble 4.
32
0
94.16
codebook
50 60books
er of codebfeature dime
mal DCT don degree i
4. The result
stem based
ptimal choic
ame physic2, VQ-32, Hft of 64 ms
64
94.16
70 80
d1=40d2=60d3=80d4=10d5=12
books withension of 1
dimension is chosen asts of CRR b
on differen
ce for this
al feature seHamming ws have been
0000020
254
h frame 00 and
compressios 40, 60, 80based on tw
nt DCT
system. Th
ets, are usedwindow typn used as th
48
on 0,
wo
he
d. e,
he

Sensors 2013, 13 2549
Table 4. The CRR using different feature set.
Different feature set CRR(%) Marginal spectrum 94.16 Fourier spectrum 84.93
Table 4 shows that the improvement in the CRR when the marginal spectrum is used as the feature set. A CRR increase of up to approximately 10% can be achieved. The improvement can be attributed to the marginal spectrum’s better characterization of non-stationary heart sound compared with the Fourier spectrum, as demonstrated in Section 2.
4.6. Performance using Different Database
Identification performance with respect to another database is discussed in this section. An open heart sounds database HSCT-11 collected by the University of Catania Italy is adopted to evaluate the performance of heart sounds biometric systems, which is a collection of heart sounds to be used for research purpose in the field of heart-sounds biometry and freely available at the address. It contains heart sounds acquired from 206 people, i.e., 157 male and 49 female [20,21]. Eighty people (65 male and 15 female) are selected randomly in our experiments. N of 20, r of 0.2, VQ-32, Hamming window type, feature dimension of 100, frame length of 256 ms, and frame shift of 64 ms have been used as the optimal values discussed above. The performance of the biometrics system is expressed in terms of CRR, which achieves 92%. It is clear that the results are also very encouraging across the larger database.
5. Conclusions
This paper proposed a new biometric method based on heart sounds by using a novel feature set, the marginal spectrum versus a normal feature of the Fourier spectrum. In the experimental phase, the optimal value of two parameters in EEMD method is first determined, and then the number of VQ codebooks is set. The DCT dimension compression degree was also considered. Finally, the effects of window type, frame length, and frames shift were tested. After parameters were set to the optimal values: N of 20, r of 0.2 in the EEMD method, VQ-32, Hamming window type, feature dimension of 100, frame length of 256 ms, and frame shift of 64 ms, the feature set of marginal spectrum was compared with that of the Fourier spectrum. The marginal spectrum, which is suitable for non-stationary signal processing, achieved a CRR of 94.16% in our identification system, whereas the CRR was 84.93% for the Fourier spectrum in the same experimental environment. The marginal spectrum was found to be a better feature set than the Fourier spectrum in the heart sound biometric system.
This approach may achieve improvements in identification performance compared with systems proposed in the related literature, and the marginal spectrum can undeniably be used as a novel feature set in heart sound biometric systems, and the experiment sample is far larger than that in other studies [7–10].
Future work would be directed towards the use of different classification schemes such as the GMM to build a different identification system that can prove this novel feature’s applicability and
Sensors 2013, 13 2550
superiority. Meanwhile, other factors that affect the result such as different de-noising methods, etc., must be considered.
The results indicated that heart sounds could be considered a promising biometric technology. Although the proposed system was found to achieve good performance under the experimental conditions, numerous factors have to be considered in practical applications, such as signal stability and a large signal database ccontaining a large number of peoples with varying age, conditions, emotion and diversified heart disease. Thus, future work will also have to concentrate on the two aforementioned aspects to improve this novel biometric method.
Acknowledgments
This paper is partly supported by National Natural Science Foundation of China (Grant No. 61102133) and the Key Project of science technology department of Zhejiang province (Grant No. 2010C11065). We also thank the anonymous reviewers for their helpful comments. We appreciate all the people that helped in the acquisition of the heart sounds and the HSCT-11 database provided by University of Catania.
References
1. Jain, A.K.; Ross, A.; Prabhakar, S. An introduction to biometric recognition. IEEE Trans. Circ. Syst. Video Technol. 2004, 14, 4–20.
2. Jain, A.K.; Ross, A.; Prabhakar, S. A Tool for Information Security. IEEE Trans. Inf. Forensics Secur. 2006, 1, 125–143.
3. Xiao, Q. Biometrics-technology, application, challenge, and computational intelligence solutions. IEEE Comput. Intell. Mag. 2007, 2, 5–25.
4. Matsumoto, T.; Matsumoto, H.; Yamada, K. Impact of artificialgummy fingers on fingerprint systems. Proc. SPIE 2002, 4677, 275–289.
5. Galbally, H.J.; Fierrez, A. On the vulnerability of fingerprint verification systems to fake fingerprints attacks. In Proceedings of 40th Annual IEEE International Carnahan Conferences Security Technology, Lexington, KY, USA, October 2006; pp. 130–136.
6. Nixon, K.A.; Aimale, V.; Rowe, K.R. Spoof detection schemes. Handbook of Biometrics; Springer: New York, NY, USA, 2008; pp. 403–423.
7. Phua, K.; Chen, J.; Tran, H.D.; Shue, L. Heart sound as a biometric. Pattern Recognit. 2008, 41, 906–919.
8. Beritelli, F.; Serrano, S. Biometric identification based on frequency analysis of cardiac sounds. IEEE Trans. Inf. Forensics Secur. 2007, 2, 596–604.
9. Beritelli, F. A multiband approach to human identity verification based on phonocardiogram signal analysis. In Proceedings of BSYM ’08 Biometrics Symposium, Tampa, FL, USA, 23–25 September 2008; pp. 71–76.
10. Jasper, J.; Othman, R. Feature extraction for human identification based on envelogram signal analysis of cardiac sounds in time-frequency domain. In Proceedings of 2010 International Conference on Electronics and Information Engineering (ICEIE 2010), Kyoto, Japan, 1–3 August 2010; pp. 228–233.

Sensors 2013, 13 2551
11. Bendary, E. HSAS: Heart sound authentication system. In Proceedings of 2010 Second World Congress on Nature and Biologically Inspired Computing, Kitakyushu, Fukuoka, Japan, 15–17 December 2010; pp. 351–356.
12. Tao, Y.-W.; Sun, X.; Zhang, H.-X.; Wu, W. A biometric identification system based on heart sound signal. In Proceedings of The 3rd Conference on Human System Interactions (HSI), Rzeszow, Poland, 13–15 May 2010; pp. 67–75.
13. Guo, X.-M.; Duan, Y.; Zhong, L. Study of human identity recognition based on HMM and WNN. Appl. Res. Comput. 2010, 27, 4561–4564.
14. Cheng, X.; Ma, Y.; Liu, C.; Zhang, X.; Guo, Y. Research on heart sound identification technology. Sci. China Inf. Sci. 2012, 55, 281–292.
15. Huang, N.E.; Shen, Z.; Long, S.R.; Wu, M.C.; Shih, H.H.; Zheng, Q.; Ye, N.-C.; Tung, C.C.; Liu, H.H. The empirical mode composition and the Hilbert spectrum for nonlinear and non-stationary time series analysis. Proc. Roy. Soc. Lond. A 1998, 454, 903–905.
16. Wu, Z.H.; Huang, N.E. Ensemble empirical mode decomposition: A noise assisted data analysis method. Adv. Adapt. Data Anal. 2009, 1, doi:10.1142/S1793536909000047.
17. Fatemian, S.Z. A Wavelet-Based Approach to Electrocardiogram (ECG) and Phonocardiogram (PCG) Subject Recognition. Master Theses, The Edward S. Rogers Sr. Department of Electrical & Computer Engineering, University of Toronto, Toronto, Canada, 2009; pp. 66–72.
18. He, J.; Liu, L.; Palm, G. A discriminative training algorithm for VQ-Based speaker identification. IEEE Trans. Speech Audio Proc. 1999, 7, 353–356.
19. Lindo, Y.; Buzo, A.; Gray, R.M. An algorithm for vector quantizer design. IEEE. Trans. Commun. 1980, 28, 84–95.
20. Spadaccini, A.; Beritelli, F. Performance Evaluation of Heart Sounds Biometric Systems on An Open Dataset. Available online: http://www.diit.unict.it/users/spadaccini/ (accessed on 6 January 2013).
21. HSCT-11 Database. Available online: http://www.diit.unict.it/hsct11/ (accessed on 6 January 2013).
© 2013 by the authors; licensee MDPI, Basel, Switzerland. This article is an open access article distributed under the terms and conditions of the Creative Commons Attribution license (http://creativecommons.org/licenses/by/3.0/).