sensors & transducers journal, vol. 115, issue 4, april 2010, pp. 135-150 sensors...
TRANSCRIPT
Sensors & Transducers Journal, Vol. 115, Issue 4, April 2010, pp. 135-150
135
SSSeeennnsssooorrrsss &&& TTTrrraaannnsssddduuuccceeerrrsss
ISSN 1726-5479© 2010 by IFSA
http://www.sensorsportal.com
Silicon Die Self-alignment on a Wafer: Stable and Unstable Modes
1Jean BERTHIER, 2Kenneth BRAKKE, 3François GROSSI, 3Loïc SANCHEZ,
3Léa DI CIOCCIO 1 CEA-LETI-Minatec, Department of Biotechnology, 17 avenue des Martyrs, 38954, Grenoble, France
Tel.: +33 4 3878 3551 2 Mathematics Department, Susquehanna University, Selinsgrove, PA 17870-1164, USA
3 CEA-LETI-Minatec, Department of Nanotechnology, 17 avenue des Martyrs, 38954, Grenoble, France
Tel.: +33 4 3878 3762 E-mail: [email protected], [email protected]
Received: 15 October 2009 /Accepted: 20 April 2010 /Published: 27 April 2010 Abstract: 3D integration is the key to advanced microelectronic systems. Die-to-wafer assembly is a necessary step to reach full integration. Self-assembly methods are promising due to their parallel aspect which overcomes the main difficulties of the current techniques. The aim of this work is the understanding of the mechanisms of self-alignment with an evaporating droplet technique and the investigation the stable and unstable modes. Using the Surface Evolver software, we analyze the causes for misalignments of the system and their evolution. Copyright © 2010 IFSA. Keywords: Self-alignment, Misalignment, Silicon die, Surface energy minimization 1. Introduction Integration of components on a wafer is needed to obtain fast and reliable packaging [1]. Self-assembly methods are promising due to their parallel aspect which overcomes the main difficulties of the current techniques. It is expected that such methods could yield a higher assembly throughput rate and a higher alignment precision than conventional methods like robotics [2, 3]. In this work we focus on the self-alignment of dies using droplets deposited on specific hydrophilic locations on the wafer. Capillary forces are used to align the die and evaporation of the liquid droplet eventually leads to

Sensors & Transducers Journal, Vol. 115, Issue 4, April 2010, pp. 135-150
136
contact and direct bonding of the die on the substrate [4-8]. This technique theoretically allows for self-alignment and assembly without any intermediate layer (Fig. 1). The bonding strength is high enough so that the assembly can handle post processing, such as thinning down or through-via etching for interconnects.
(c)
5x5 mm² aligned and bonded dies on Si substrate
(b)
5 mm
(a)
(c) Accomplishingself-alignment
(b) Rough positionning(a) Dispensing a droplet
Fig. 1. Principle of die self-alignment: (a) sketch of the droplet and the die; (b) sketch of the die before and after evaporation; (c) view of aligned dies on a wafer [9].
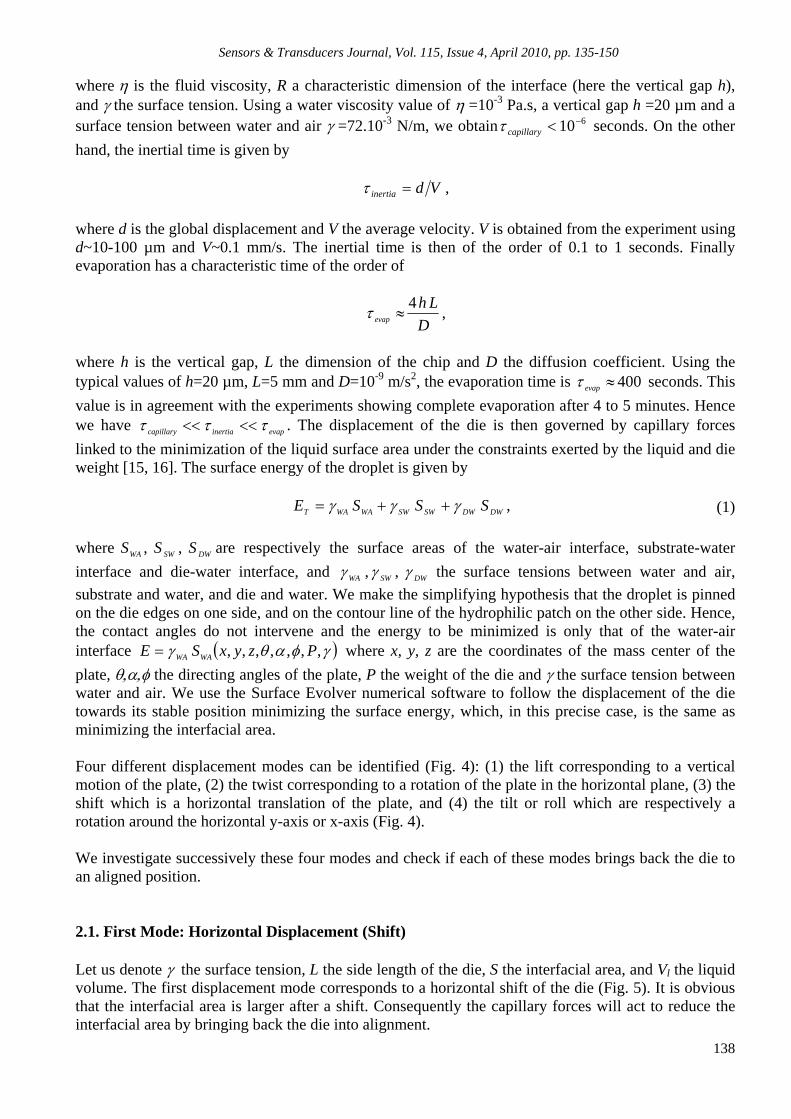
In a first step, the die is gently dropped on a water droplet sitting on a square hydrophilic patch patterned on the wafer surface. At this point, three physical phenomena govern the die motion: (i) water-air interfacial forces that are expected to bring the die in an aligned position above its planned final location on the wafer, (ii) evaporation of the water that progressively moves the die towards the wafer surface, (iii) gravitational forces linked to the weight of the die and the liquid. Experiments have been conducted with an experimental setup composed of dies on top of water droplets deposited with the help of a syringe on delimited regions of a substrate (Fig. 1). The die is a square plate of 5 mm x 5 mm, its thickness is 725 µm, and its weight is less than 45 mg. The silicon surface of the die is super hydrophilic, with a water contact angle of the order of 2-3°. The substrate binding zone has the same size and is hydrophilically treated and surrounded by hydrophobic regions (Fig. 2). Note that the dimensional tolerance of die and patch conditions the alignment precision. Fabrication efforts are conducted to reach a dimensional tolerance less than 1 µm for the die as well as for the patch on the wafer. However in the numerical model, an ideal case is examined and the dimensional tolerance is set to zero. The first experimental results have shown that good angular alignment is achieved, but a slight translational misalignment of the order of 10 to 20 µm can occur (Fig. 3). In previous publications [10, 11], the possible reasons for misalignments have been experimentally investigated. We analyze here the self-alignment mechanism of the die on the wafer with the help of numerical simulation.
Sensors & Transducers Journal, Vol. 115, Issue 4, April 2010, pp. 135-150
137
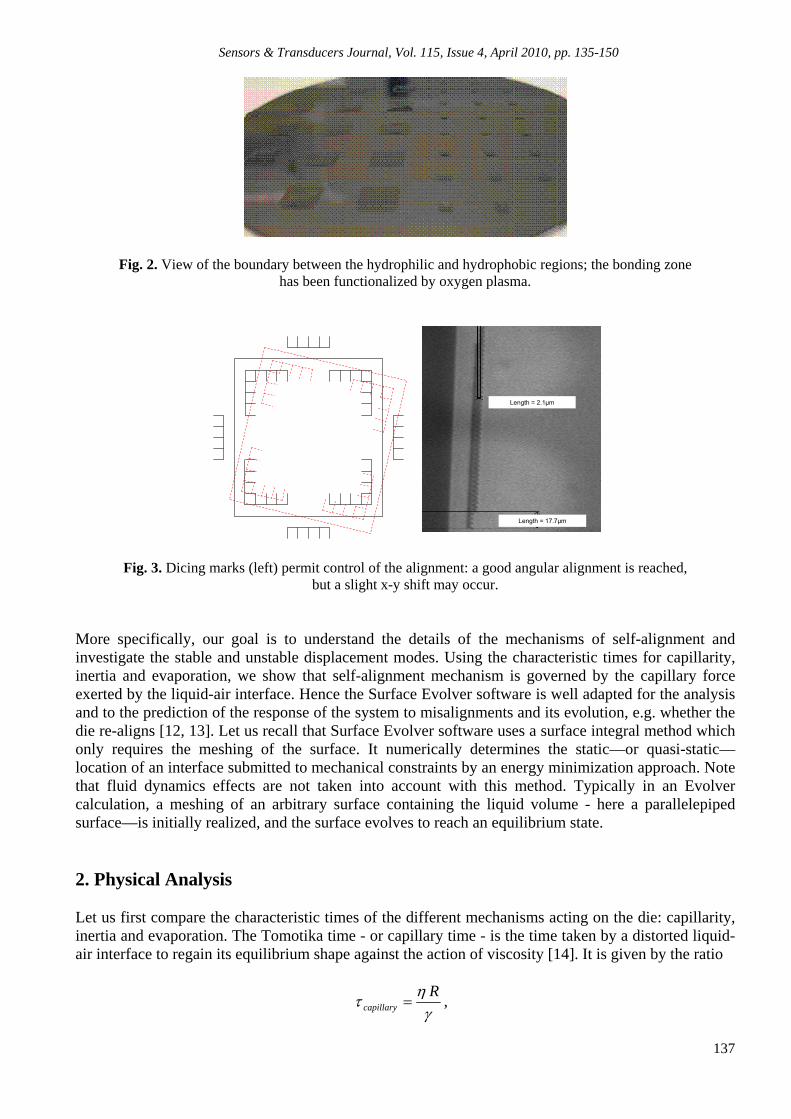
Fig. 2. View of the boundary between the hydrophilic and hydrophobic regions; the bonding zone has been functionalized by oxygen plasma.
Length = 2.1µm
Length = 17.7µm
Fig. 3. Dicing marks (left) permit control of the alignment: a good angular alignment is reached, but a slight x-y shift may occur.
More specifically, our goal is to understand the details of the mechanisms of self-alignment and investigate the stable and unstable displacement modes. Using the characteristic times for capillarity, inertia and evaporation, we show that self-alignment mechanism is governed by the capillary force exerted by the liquid-air interface. Hence the Surface Evolver software is well adapted for the analysis and to the prediction of the response of the system to misalignments and its evolution, e.g. whether the die re-aligns [12, 13]. Let us recall that Surface Evolver software uses a surface integral method which only requires the meshing of the surface. It numerically determines the static—or quasi-static—location of an interface submitted to mechanical constraints by an energy minimization approach. Note that fluid dynamics effects are not taken into account with this method. Typically in an Evolver calculation, a meshing of an arbitrary surface containing the liquid volume - here a parallelepiped surface—is initially realized, and the surface evolves to reach an equilibrium state. 2. Physical Analysis Let us first compare the characteristic times of the different mechanisms acting on the die: capillarity, inertia and evaporation. The Tomotika time - or capillary time - is the time taken by a distorted liquid-air interface to regain its equilibrium shape against the action of viscosity [14]. It is given by the ratio
R
capillary ,
Sensors & Transducers Journal, Vol. 115, Issue 4, April 2010, pp. 135-150
138
where is the fluid viscosity, R a characteristic dimension of the interface (here the vertical gap h), and the surface tension. Using a water viscosity value of =10-3 Pa.s, a vertical gap h =20 µm and a surface tension between water and air =72.10-3 N/m, we obtain 610capillary seconds. On the other
hand, the inertial time is given by
Vdinertia ,
where d is the global displacement and V the average velocity. V is obtained from the experiment using d~10-100 µm and V~0.1 mm/s. The inertial time is then of the order of 0.1 to 1 seconds. Finally evaporation has a characteristic time of the order of
D
Lhevap
4 ,
where h is the vertical gap, L the dimension of the chip and D the diffusion coefficient. Using the typical values of h=20 µm, L=5 mm and D=10-9 m/s2, the evaporation time is 400evap seconds. This
value is in agreement with the experiments showing complete evaporation after 4 to 5 minutes. Hence we have evapinertiacapillary . The displacement of the die is then governed by capillary forces
linked to the minimization of the liquid surface area under the constraints exerted by the liquid and die weight [15, 16]. The surface energy of the droplet is given by
DWDWSWSWWAWAT SSSE , (1) where DWSWWA SSS ,, are respectively the surface areas of the water-air interface, substrate-water
interface and die-water interface, and DWSWWA ,, the surface tensions between water and air,
substrate and water, and die and water. We make the simplifying hypothesis that the droplet is pinned on the die edges on one side, and on the contour line of the hydrophilic patch on the other side. Hence, the contact angles do not intervene and the energy to be minimized is only that of the water-air interface ,,,,,,, PzyxSE WAWA where x, y, z are the coordinates of the mass center of the
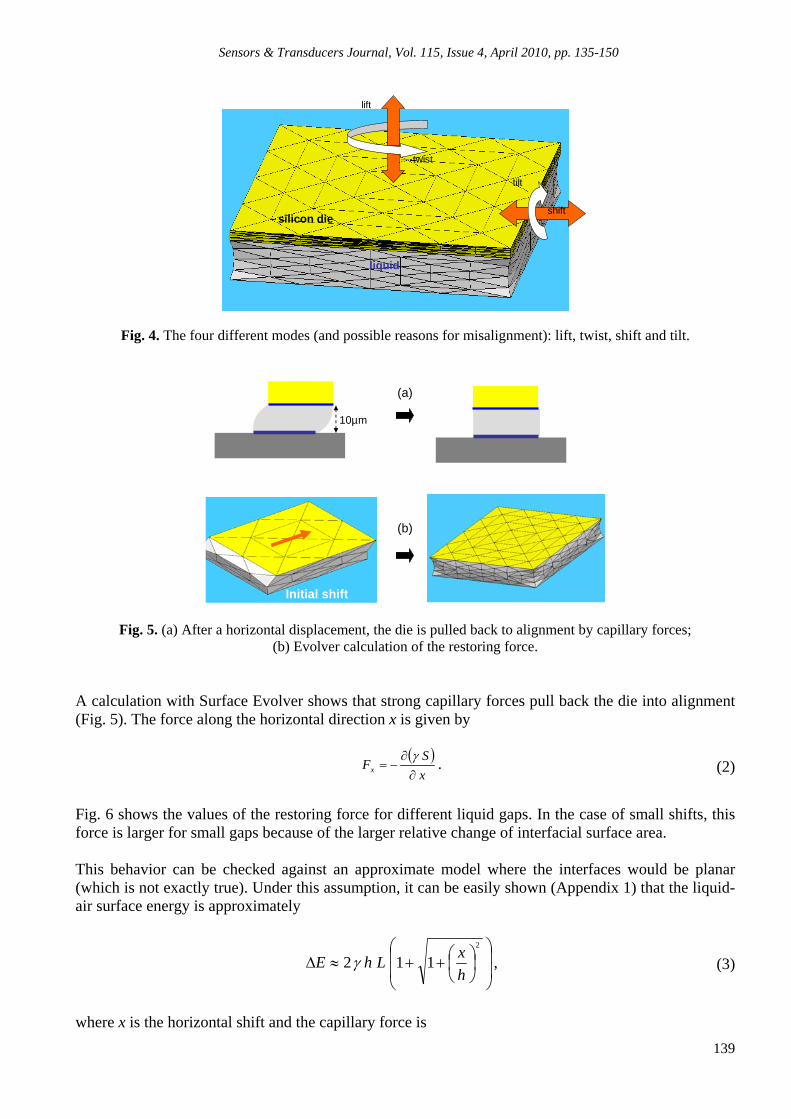
plate, the directing angles of the plate, P the weight of the die and the surface tension between water and air. We use the Surface Evolver numerical software to follow the displacement of the die towards its stable position minimizing the surface energy, which, in this precise case, is the same as minimizing the interfacial area. Four different displacement modes can be identified (Fig. 4): (1) the lift corresponding to a vertical motion of the plate, (2) the twist corresponding to a rotation of the plate in the horizontal plane, (3) the shift which is a horizontal translation of the plate, and (4) the tilt or roll which are respectively a rotation around the horizontal y-axis or x-axis (Fig. 4). We investigate successively these four modes and check if each of these modes brings back the die to an aligned position. 2.1. First Mode: Horizontal Displacement (Shift) Let us denote the surface tension, L the side length of the die, S the interfacial area, and Vl the liquid volume. The first displacement mode corresponds to a horizontal shift of the die (Fig. 5). It is obvious that the interfacial area is larger after a shift. Consequently the capillary forces will act to reduce the interfacial area by bringing back the die into alignment.
Sensors & Transducers Journal, Vol. 115, Issue 4, April 2010, pp. 135-150
139
lift
twist
shift
tilt
silicon die
liquid
Fig. 4. The four different modes (and possible reasons for misalignment): lift, twist, shift and tilt.
10µm
(a)
(b)
Initial shift
Fig. 5. (a) After a horizontal displacement, the die is pulled back to alignment by capillary forces; (b) Evolver calculation of the restoring force.
A calculation with Surface Evolver shows that strong capillary forces pull back the die into alignment (Fig. 5). The force along the horizontal direction x is given by
x
SFx
. (2)
Fig. 6 shows the values of the restoring force for different liquid gaps. In the case of small shifts, this force is larger for small gaps because of the larger relative change of interfacial surface area. This behavior can be checked against an approximate model where the interfaces would be planar (which is not exactly true). Under this assumption, it can be easily shown (Appendix 1) that the liquid-air surface energy is approximately
2
112h
xLhE , (3)
where x is the horizontal shift and the capillary force is
Sensors & Transducers Journal, Vol. 115, Issue 4, April 2010, pp. 135-150
140
2
1
12
x
hLFx .
(4)
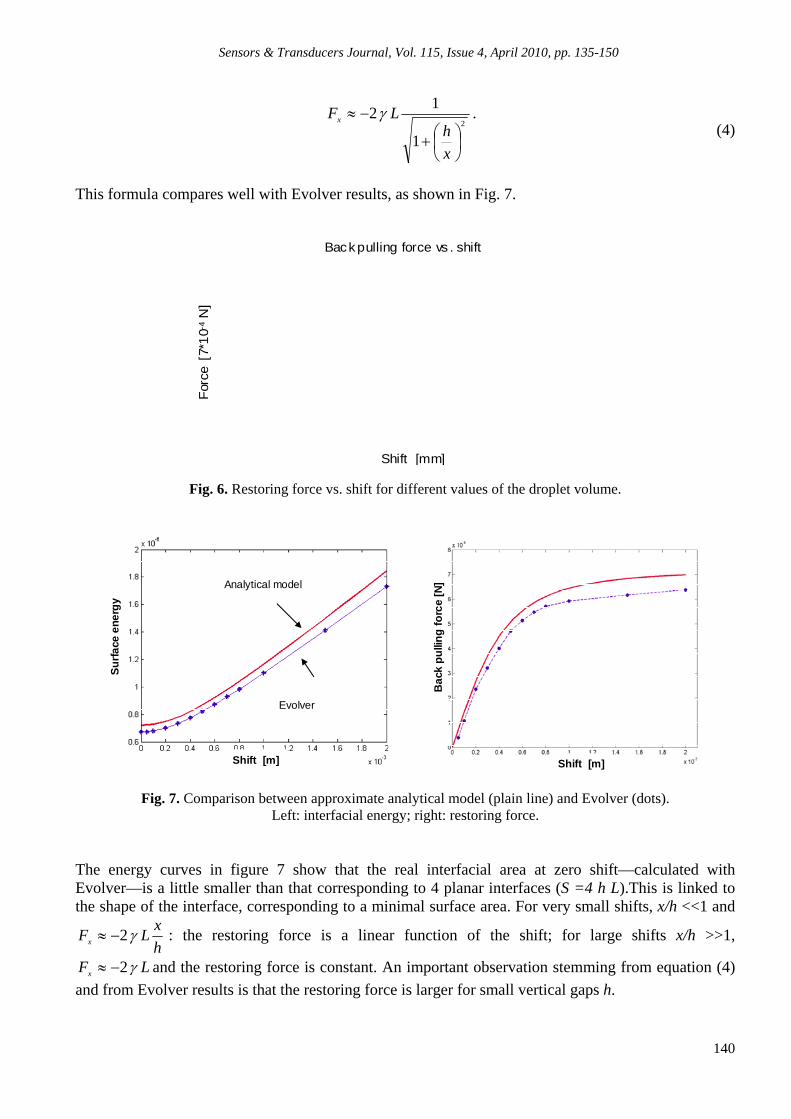
This formula compares well with Evolver results, as shown in Fig. 7.
Back pulling force vs . shift
Shift [mm]
For
ce [
7*1
0-4
N]
Fig. 6. Restoring force vs. shift for different values of the droplet volume.
Su
rfa
ce e
ne
rgy
Shift [m] Shift [m]
Ba
ck p
ulli
ng
forc
e [N
]Analytical model
Evolver
Fig. 7. Comparison between approximate analytical model (plain line) and Evolver (dots). Left: interfacial energy; right: restoring force.
The energy curves in figure 7 show that the real interfacial area at zero shift—calculated with Evolver—is a little smaller than that corresponding to 4 planar interfaces (S =4 h L).This is linked to the shape of the interface, corresponding to a minimal surface area. For very small shifts, x/h <<1 and
h
xLFx 2 : the restoring force is a linear function of the shift; for large shifts x/h >>1,
LFx 2 and the restoring force is constant. An important observation stemming from equation (4)
and from Evolver results is that the restoring force is larger for small vertical gaps h.
Sensors & Transducers Journal, Vol. 115, Issue 4, April 2010, pp. 135-150
141
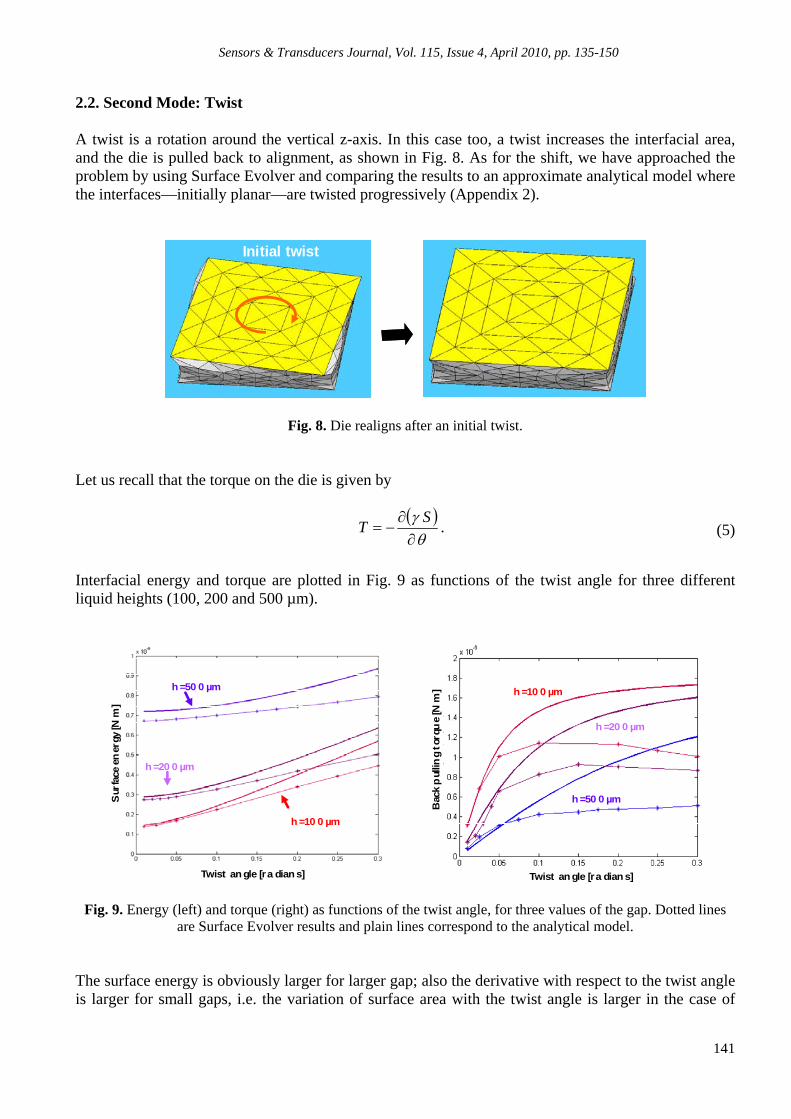
2.2. Second Mode: Twist A twist is a rotation around the vertical z-axis. In this case too, a twist increases the interfacial area, and the die is pulled back to alignment, as shown in Fig. 8. As for the shift, we have approached the problem by using Surface Evolver and comparing the results to an approximate analytical model where the interfaces—initially planar—are twisted progressively (Appendix 2).
Initial twist
Fig. 8. Die realigns after an initial twist. Let us recall that the torque on the die is given by
ST . (5)
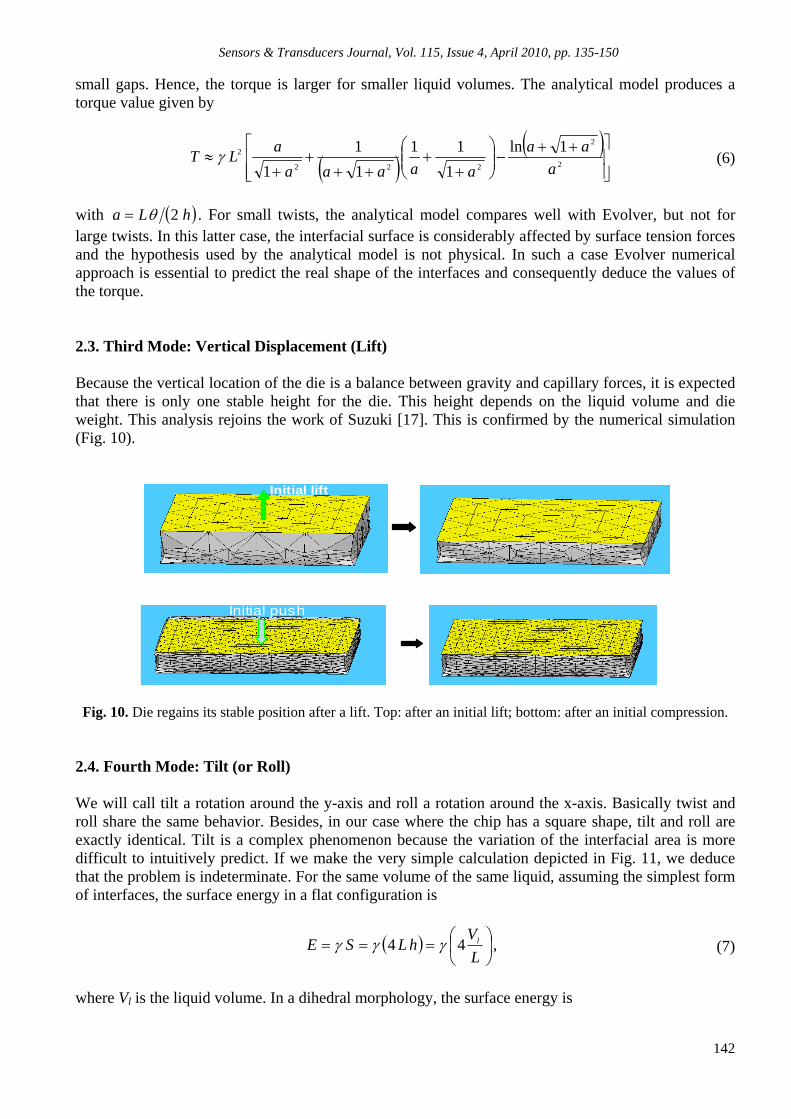
Interfacial energy and torque are plotted in Fig. 9 as functions of the twist angle for three different liquid heights (100, 200 and 500 µm).
h =50 0 µm
h =20 0 µm
h =10 0 µm
Sur
face
en
ergy
[N m
]
Twist an gle [ra dian s]
h =50 0 µm
h =20 0 µm
h =10 0 µm
Bac
k p
ullin
gto
rqu
e [N
m]
Twist an gle [ra dian s]
Fig. 9. Energy (left) and torque (right) as functions of the twist angle, for three values of the gap. Dotted lines are Surface Evolver results and plain lines correspond to the analytical model.
The surface energy is obviously larger for larger gap; also the derivative with respect to the twist angle is larger for small gaps, i.e. the variation of surface area with the twist angle is larger in the case of
Sensors & Transducers Journal, Vol. 115, Issue 4, April 2010, pp. 135-150
142
small gaps. Hence, the torque is larger for smaller liquid volumes. The analytical model produces a torque value given by
2
2
222
2 1ln
1
11
1
1
1 a
aa
aaaaa
aLT (6)
with hLa 2 . For small twists, the analytical model compares well with Evolver, but not for large twists. In this latter case, the interfacial surface is considerably affected by surface tension forces and the hypothesis used by the analytical model is not physical. In such a case Evolver numerical approach is essential to predict the real shape of the interfaces and consequently deduce the values of the torque. 2.3. Third Mode: Vertical Displacement (Lift) Because the vertical location of the die is a balance between gravity and capillary forces, it is expected that there is only one stable height for the die. This height depends on the liquid volume and die weight. This analysis rejoins the work of Suzuki [17]. This is confirmed by the numerical simulation (Fig. 10).
Initial lift
Initial push
Fig. 10. Die regains its stable position after a lift. Top: after an initial lift; bottom: after an initial compression. 2.4. Fourth Mode: Tilt (or Roll) We will call tilt a rotation around the y-axis and roll a rotation around the x-axis. Basically twist and roll share the same behavior. Besides, in our case where the chip has a square shape, tilt and roll are exactly identical. Tilt is a complex phenomenon because the variation of the interfacial area is more difficult to intuitively predict. If we make the very simple calculation depicted in Fig. 11, we deduce that the problem is indeterminate. For the same volume of the same liquid, assuming the simplest form of interfaces, the surface energy in a flat configuration is
L
VhLSE l44 , (7)
where Vl is the liquid volume. In a dihedral morphology, the surface energy is
Sensors & Transducers Journal, Vol. 115, Issue 4, April 2010, pp. 135-150
143
L
VL
LSE l4
22 2
2
. (8)
Hence, it is the distortion of the interfaces that can make the difference and pinpoint the stable position. It is a second order problem. This remark leads to serious complications: on a numerical standpoint, the meshing of the surface should be sufficiently fine to produce a precise value of the energy. In return, the computation time is long. From a physical standpoint, the role of the parameters - like the weight of the die, or the surface tension of the liquid - is difficult to predict.
L
L
h
L
L
(a)(b)
Fig. 11. Two morphologies of the liquid having the same surface energy.
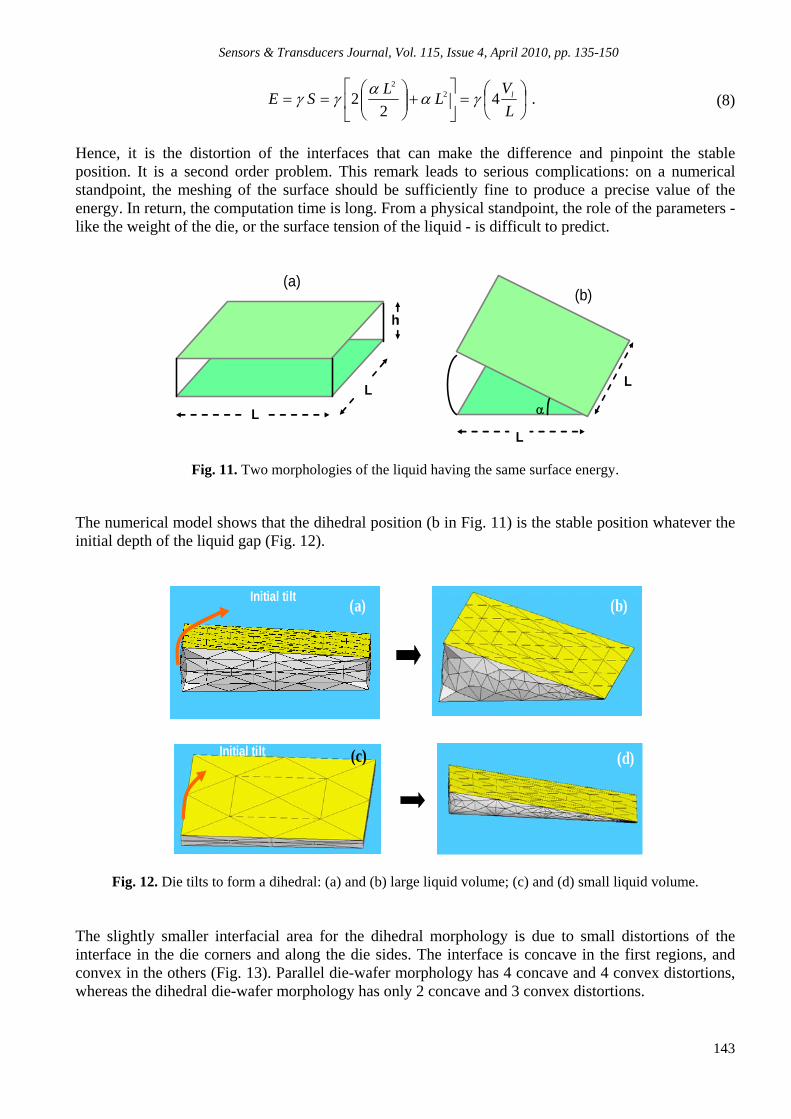
The numerical model shows that the dihedral position (b in Fig. 11) is the stable position whatever the initial depth of the liquid gap (Fig. 12).
(a) (b)
(c) (d)
Initial tilt
Initial tilt
Fig. 12. Die tilts to form a dihedral: (a) and (b) large liquid volume; (c) and (d) small liquid volume. The slightly smaller interfacial area for the dihedral morphology is due to small distortions of the interface in the die corners and along the die sides. The interface is concave in the first regions, and convex in the others (Fig. 13). Parallel die-wafer morphology has 4 concave and 4 convex distortions, whereas the dihedral die-wafer morphology has only 2 concave and 3 convex distortions.

Sensors & Transducers Journal, Vol. 115, Issue 4, April 2010, pp. 135-150
144
concave region
bulging out regionconcave region
Slightly bulging outregion
Fig. 13. Bulging out/in shape of the interface in the two cases: left, parallel plates; right, corner.
2.5. Coupled Modes From the previous analysis, it is expected that only coupled modes including roll and tilt will be unstable. This can be verified with Surface Evolver (Fig. 14). This software calculates an equilibrium state and does not compute a dynamic motion. However, the iteration speed indicates a relative facility or difficulty of displacement. For a tilt and roll initial displacement (Fig. 14.a), there is first a slow motion of the plate that accelerates until one corner and then an edge of the chip contacts the substrate. After that, the motion is slow to form a complete dihedral. In the case of an initial tilt and twist (Fig. 14.b), the twist vanishes quickly (it is a stable mode) but the tilt slowly increases. Finally, for an initial shift and twist—which are two stable modes—the shift vanishes first, then the twist (Fig. 14.c).
Initial push
Contact in one angle dihedral formationslow fast very slow
(a)
(b)
(c)
Fig. 14. Coupled modes: (a): tilt and roll; (b) tilt and twist; (c) shift and twist. The only unstable coupling must include a tilt and/or roll; the other modes are automatically corrected by the capillary forces.
3. Discussion and Conclusions Of all the four modes, only the tilt (roll) is slightly unstable. However, this latter mode does not disrupt necessarily the die alignment. First, if the dihedral is well formed, as shown in Fig. 13, the evaporation will bring the die in perfect alignment. Second, the tilt-motion mode is slow if the die weight is small; evaporation might proceed before the dihedral is completely formed. This point is still under investigation.
Sensors & Transducers Journal, Vol. 115, Issue 4, April 2010, pp. 135-150
145
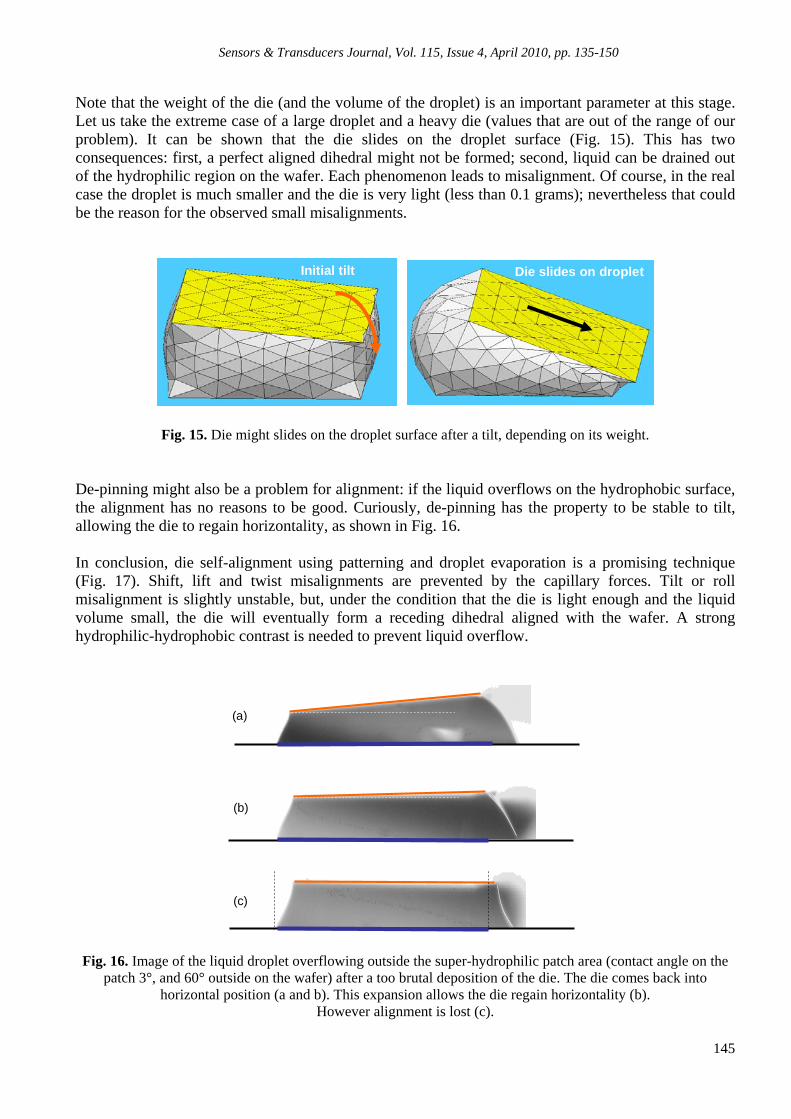
Note that the weight of the die (and the volume of the droplet) is an important parameter at this stage. Let us take the extreme case of a large droplet and a heavy die (values that are out of the range of our problem). It can be shown that the die slides on the droplet surface (Fig. 15). This has two consequences: first, a perfect aligned dihedral might not be formed; second, liquid can be drained out of the hydrophilic region on the wafer. Each phenomenon leads to misalignment. Of course, in the real case the droplet is much smaller and the die is very light (less than 0.1 grams); nevertheless that could be the reason for the observed small misalignments.
Initial tilt Die slides on droplet
Fig. 15. Die might slides on the droplet surface after a tilt, depending on its weight.
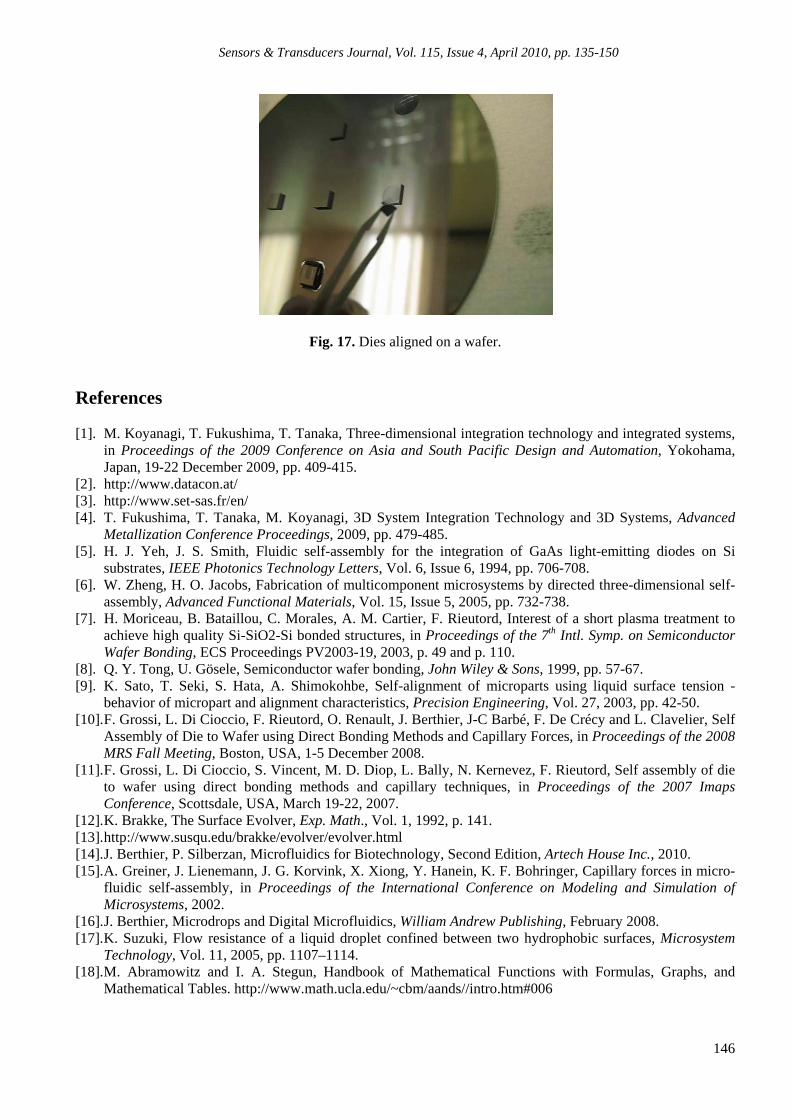
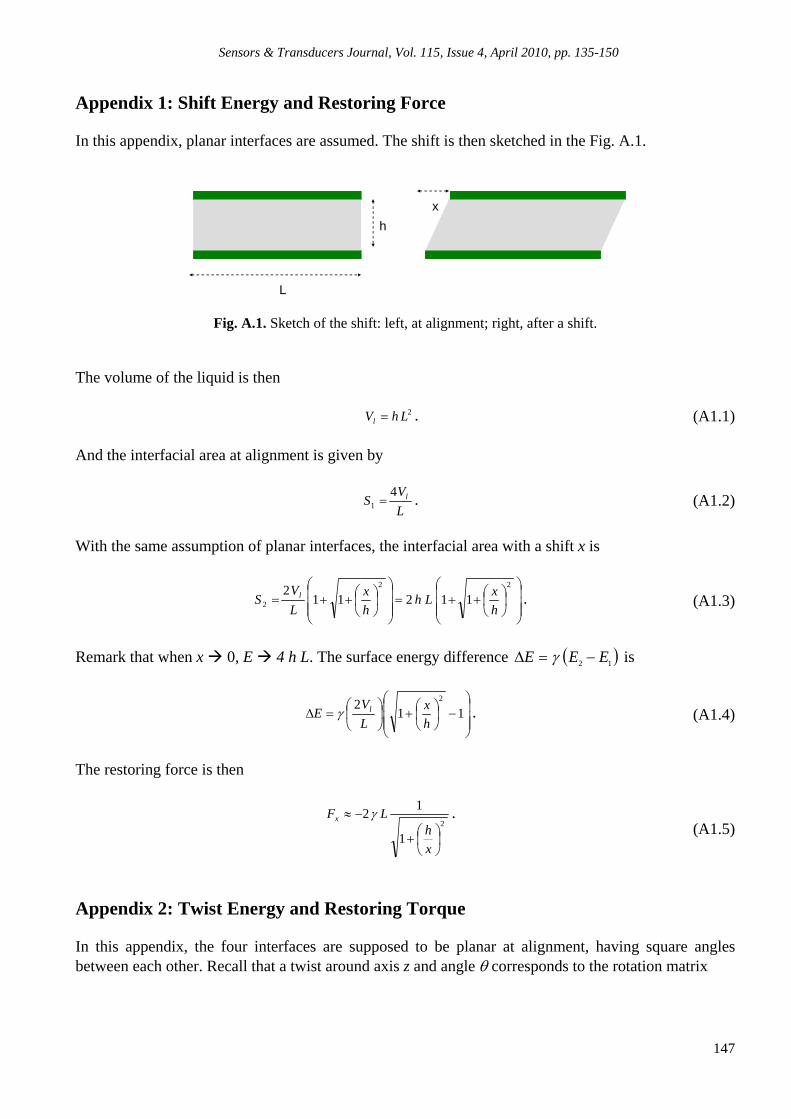
De-pinning might also be a problem for alignment: if the liquid overflows on the hydrophobic surface, the alignment has no reasons to be good. Curiously, de-pinning has the property to be stable to tilt, allowing the die to regain horizontality, as shown in Fig. 16. In conclusion, die self-alignment using patterning and droplet evaporation is a promising technique (Fig. 17). Shift, lift and twist misalignments are prevented by the capillary forces. Tilt or roll misalignment is slightly unstable, but, under the condition that the die is light enough and the liquid volume small, the die will eventually form a receding dihedral aligned with the wafer. A strong hydrophilic-hydrophobic contrast is needed to prevent liquid overflow.
(a)
(b)
(c)
Fig. 16. Image of the liquid droplet overflowing outside the super-hydrophilic patch area (contact angle on the patch 3°, and 60° outside on the wafer) after a too brutal deposition of the die. The die comes back into
horizontal position (a and b). This expansion allows the die regain horizontality (b). However alignment is lost (c).
Sensors & Transducers Journal, Vol. 115, Issue 4, April 2010, pp. 135-150
146
Fig. 17. Dies aligned on a wafer. References [1]. M. Koyanagi, T. Fukushima, T. Tanaka, Three-dimensional integration technology and integrated systems,
in Proceedings of the 2009 Conference on Asia and South Pacific Design and Automation, Yokohama, Japan, 19-22 December 2009, pp. 409-415.
[2]. http://www.datacon.at/ [3]. http://www.set-sas.fr/en/ [4]. T. Fukushima, T. Tanaka, M. Koyanagi, 3D System Integration Technology and 3D Systems, Advanced
Metallization Conference Proceedings, 2009, pp. 479-485. [5]. H. J. Yeh, J. S. Smith, Fluidic self-assembly for the integration of GaAs light-emitting diodes on Si
substrates, IEEE Photonics Technology Letters, Vol. 6, Issue 6, 1994, pp. 706-708. [6]. W. Zheng, H. O. Jacobs, Fabrication of multicomponent microsystems by directed three-dimensional self-
assembly, Advanced Functional Materials, Vol. 15, Issue 5, 2005, pp. 732-738. [7]. H. Moriceau, B. Bataillou, C. Morales, A. M. Cartier, F. Rieutord, Interest of a short plasma treatment to
achieve high quality Si-SiO2-Si bonded structures, in Proceedings of the 7th Intl. Symp. on Semiconductor Wafer Bonding, ECS Proceedings PV2003-19, 2003, p. 49 and p. 110.
[8]. Q. Y. Tong, U. Gösele, Semiconductor wafer bonding, John Wiley & Sons, 1999, pp. 57-67. [9]. K. Sato, T. Seki, S. Hata, A. Shimokohbe, Self-alignment of microparts using liquid surface tension -
behavior of micropart and alignment characteristics, Precision Engineering, Vol. 27, 2003, pp. 42-50. [10]. F. Grossi, L. Di Cioccio, F. Rieutord, O. Renault, J. Berthier, J-C Barbé, F. De Crécy and L. Clavelier, Self
Assembly of Die to Wafer using Direct Bonding Methods and Capillary Forces, in Proceedings of the 2008 MRS Fall Meeting, Boston, USA, 1-5 December 2008.
[11]. F. Grossi, L. Di Cioccio, S. Vincent, M. D. Diop, L. Bally, N. Kernevez, F. Rieutord, Self assembly of die to wafer using direct bonding methods and capillary techniques, in Proceedings of the 2007 Imaps Conference, Scottsdale, USA, March 19-22, 2007.
[12]. K. Brakke, The Surface Evolver, Exp. Math., Vol. 1, 1992, p. 141. [13]. http://www.susqu.edu/brakke/evolver/evolver.html [14]. J. Berthier, P. Silberzan, Microfluidics for Biotechnology, Second Edition, Artech House Inc., 2010. [15]. A. Greiner, J. Lienemann, J. G. Korvink, X. Xiong, Y. Hanein, K. F. Bohringer, Capillary forces in micro-
fluidic self-assembly, in Proceedings of the International Conference on Modeling and Simulation of Microsystems, 2002.
[16]. J. Berthier, Microdrops and Digital Microfluidics, William Andrew Publishing, February 2008. [17]. K. Suzuki, Flow resistance of a liquid droplet confined between two hydrophobic surfaces, Microsystem
Technology, Vol. 11, 2005, pp. 1107–1114. [18]. M. Abramowitz and I. A. Stegun, Handbook of Mathematical Functions with Formulas, Graphs, and
Mathematical Tables. http://www.math.ucla.edu/~cbm/aands//intro.htm#006
Sensors & Transducers Journal, Vol. 115, Issue 4, April 2010, pp. 135-150
147
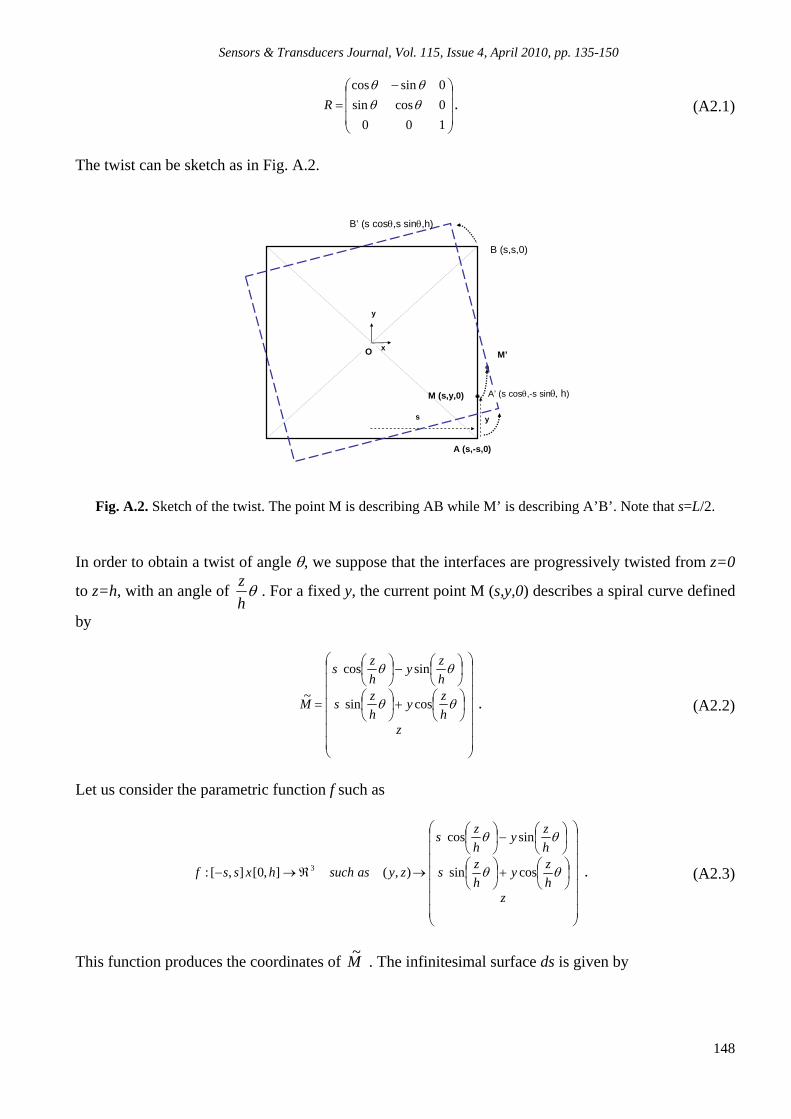
Appendix 1: Shift Energy and Restoring Force In this appendix, planar interfaces are assumed. The shift is then sketched in the Fig. A.1.
L
h
x
Fig. A.1. Sketch of the shift: left, at alignment; right, after a shift.
The volume of the liquid is then 2LhVl . (A1.1) And the interfacial area at alignment is given by
L
VS l4
1 . (A1.2)
With the same assumption of planar interfaces, the interfacial area with a shift x is
22
2 112112
h
xLh
h
x
L
VS l . (A1.3)
Remark that when x 0, E 4 h L. The surface energy difference 12 EEE is
11
22
h
x
L
VE l . (A1.4)
The restoring force is then
2
1
12
x
hLFx .
(A1.5)
Appendix 2: Twist Energy and Restoring Torque In this appendix, the four interfaces are supposed to be planar at alignment, having square angles between each other. Recall that a twist around axis z and angle corresponds to the rotation matrix
Sensors & Transducers Journal, Vol. 115, Issue 4, April 2010, pp. 135-150
148
100
0cossin
0sincos
R . (A2.1)
The twist can be sketch as in Fig. A.2.
O
M (s,y,0)
x
y
s y
M’
A (s,-s,0)
A’ (s cos,-s sinh)
B (s,s,0)
B’ (s cos,s sin,h)
Fig. A.2. Sketch of the twist. The point M is describing AB while M’ is describing A’B’. Note that s=L/2. In order to obtain a twist of angle , we suppose that the interfaces are progressively twisted from z=0
to z=h, with an angle of h
z. For a fixed y, the current point M (s,y,0) describes a spiral curve defined
by
zh
zy
h
zs
h
zy
h
zs
M
cossin
sincos
~ . (A2.2)
Let us consider the parametric function f such as
zh
zy
h
zs
h
zy
h
zs
zyassuchhxssf
cossin
sincos
),(],0[],[: 3 . (A2.3)
This function produces the coordinates of M~
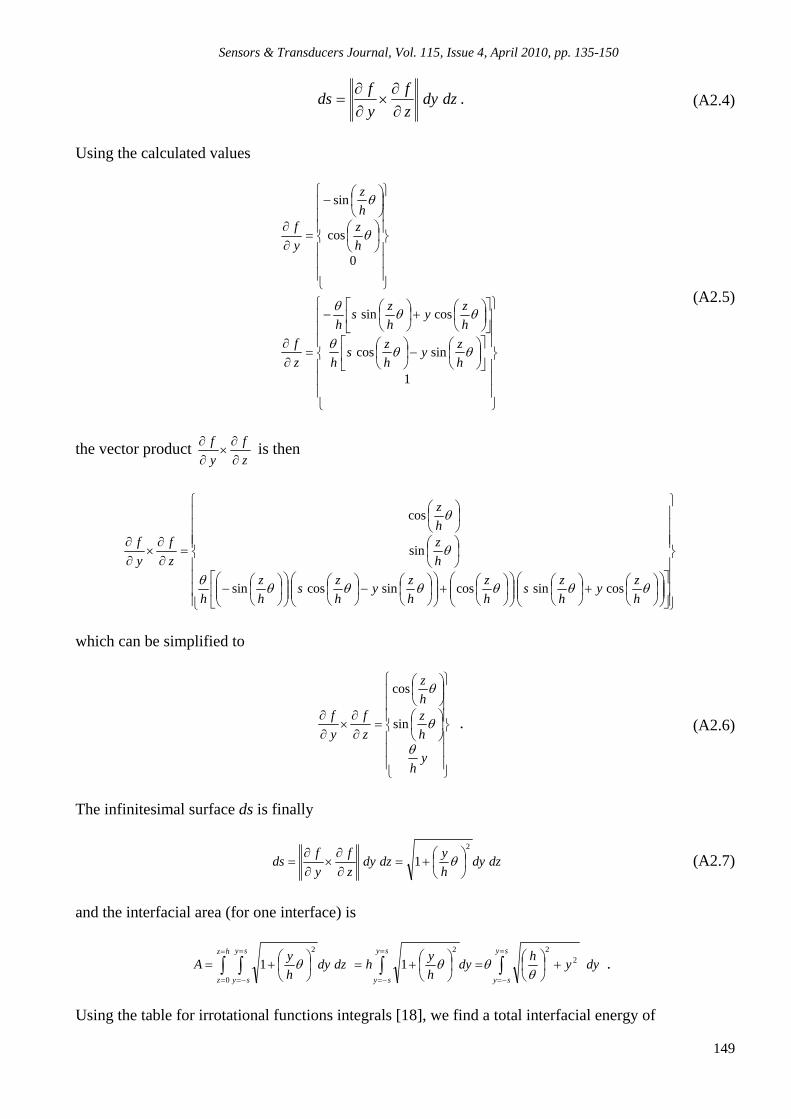
. The infinitesimal surface ds is given by
Sensors & Transducers Journal, Vol. 115, Issue 4, April 2010, pp. 135-150
149
dzdy
z
f
y
fds
. (A2.4)
Using the calculated values
1
sincos
cossin
0
cos
sin
h
zy
h
zs
h
h
zy
h
zs
h
z
f
h
zh
z
y
f
(A2.5)
the vector product z
f
y
f
is then
h
zy
h
zs
h
z
h
zy
h
zs
h
z
h
h
zh
z
z
f
y
f
cossincossincossin
sin
cos
which can be simplified to
yh
h
zh
z
z
f
y
f
sin
cos
. (A2.6)
The infinitesimal surface ds is finally
dzdyh
ydzdy
z
f
y
fds
2
1
(A2.7)
and the interfacial area (for one interface) is
sy
sy
sy
sy
hz
z
sy
sy
dyyh
dyh
yhdzdy
h
yA 2
22
0
2
11
.
Using the table for irrotational functions integrals [18], we find a total interfacial energy of

Sensors & Transducers Journal, Vol. 115, Issue 4, April 2010, pp. 135-150
150
2
22 1ln14 aa
hahsE
, (A2.8)
where h
sa
. Note that when 0, a0 and E hLE 4 . The torque T is given by the
derivative of the energy with respect to the angle
2
2
222
2 1ln
1
11
1
1
14
a
aa
aaaaa
asT . (A2.9)
___________________ 2010 Copyright ©, International Frequency Sensor Association (IFSA). All rights reserved. (http://www.sensorsportal.com)

SSeennssoorrss && TTrraannssdduucceerrss JJoouurrnnaall
GGuuiiddee ffoorr CCoonnttrriibbuuttoorrss
Aims and Scope Sensors & Transducers Journal (ISSN 1726-5479) provides an advanced forum for the science and technology of physical, chemical sensors and biosensors. It publishes state-of-the-art reviews, regular research and application specific papers, short notes, letters to Editor and sensors related books reviews as well as academic, practical and commercial information of interest to its readership. Because it is an open access, peer review international journal, papers rapidly published in Sensors & Transducers Journal will receive a very high publicity. The journal is published monthly as twelve issues per annual by International Frequency Association (IFSA). In additional, some special sponsored and conference issues published annually. Sensors & Transducers Journal is indexed and abstracted very quickly by Chemical Abstracts, IndexCopernicus Journals Master List, Open J-Gate, Google Scholar, etc. Topics Covered Contributions are invited on all aspects of research, development and application of the science and technology of sensors, transducers and sensor instrumentations. Topics include, but are not restricted to: • Physical, chemical and biosensors; • Digital, frequency, period, duty-cycle, time interval, PWM, pulse number output sensors and transducers; • Theory, principles, effects, design, standardization and modeling; • Smart sensors and systems; • Sensor instrumentation; • Virtual instruments; • Sensors interfaces, buses and networks; • Signal processing; • Frequency (period, duty-cycle)-to-digital converters, ADC; • Technologies and materials; • Nanosensors; • Microsystems; • Applications. Submission of papers Articles should be written in English. Authors are invited to submit by e-mail [email protected] 8-14 pages article (including abstract, illustrations (color or grayscale), photos and references) in both: MS Word (doc) and Acrobat (pdf) formats. Detailed preparation instructions, paper example and template of manuscript are available from the journal’s webpage: http://www.sensorsportal.com/HTML/DIGEST/Submition.htm Authors must follow the instructions strictly when submitting their manuscripts. Advertising Information Advertising orders and enquires may be sent to [email protected] Please download also our media kit: http://www.sensorsportal.com/DOWNLOADS/Media_Kit_2009.pdf