sensory coding by cerebellar mossy fibres through ... · pdf filesensory coding by cerebellar...
TRANSCRIPT
LUND UNIVERSITY
PO Box 117221 00 Lund+46 46-222 00 00
Sensory Coding by Cerebellar Mossy Fibres through Inhibition-Driven Phase Resettingand Synchronisation
Holtzman, Tahl; Jörntell, Henrik
Published in:PLoS ONE
DOI:10.1371/journal.pone.0026503
Published: 2011-01-01
Link to publication
Citation for published version (APA):Holtzman, T., & Jörntell, H. (2011). Sensory Coding by Cerebellar Mossy Fibres through Inhibition-Driven PhaseResetting and Synchronisation. PLoS ONE, 6(10). DOI: 10.1371/journal.pone.0026503
General rightsCopyright and moral rights for the publications made accessible in the public portal are retained by the authorsand/or other copyright owners and it is a condition of accessing publications that users recognise and abide by thelegal requirements associated with these rights.
• Users may download and print one copy of any publication from the public portal for the purpose of privatestudy or research. • You may not further distribute the material or use it for any profit-making activity or commercial gain • You may freely distribute the URL identifying the publication in the public portal

Sensory Coding by Cerebellar Mossy Fibres throughInhibition-Driven Phase Resetting and SynchronisationTahl Holtzman1*, Henrik Jorntell2
1 Behavioural and Clinical Neuroscience Institute and Department of Experimental Psychology, University of Cambridge, Cambridge, United Kingdom, 2 Section for
Neurophysiology and Neuronano Research Center, Lund, Sweden
Abstract
Temporal coding of spike-times using oscillatory mechanisms allied to spike-time dependent plasticity could represent apowerful mechanism for neuronal communication. However, it is unclear how temporal coding is constructed at the singleneuronal level. Here we investigate a novel class of highly regular, metronome-like neurones in the rat brainstem whichform a major source of cerebellar afferents. Stimulation of sensory inputs evoked brief periods of inhibition that interruptedthe regular firing of these cells leading to phase-shifted spike-time advancements and delays. Alongside phase-shifting,metronome cells also behaved as band-pass filters during rhythmic sensory stimulation, with maximal spike-stimulussynchronisation at frequencies close to the idiosyncratic firing frequency of each neurone. Phase-shifting and band-passfiltering serve to temporally align ensembles of metronome cells, leading to sustained volleys of near-coincident spike-times, thereby transmitting synchronised sensory information to downstream targets in the cerebellar cortex.
Citation: Holtzman T, Jorntell H (2011) Sensory Coding by Cerebellar Mossy Fibres through Inhibition-Driven Phase Resetting and Synchronisation. PLoSONE 6(10): e26503. doi:10.1371/journal.pone.0026503
Editor: Izumi Sugihara, Tokyo Medical and Dental University, Japan
Received May 24, 2011; Accepted September 28, 2011; Published October 26, 2011
Copyright: � 2011 Holtzman, Jorntell. This is an open-access article distributed under the terms of the Creative Commons Attribution License, which permitsunrestricted use, distribution, and reproduction in any medium, provided the original author and source are credited.
Funding: This work was funded by the Medical Research Council, United Kingdom and the Isaac Newton Trust, Cambridge, United Kingdom. The funders had norole in study design, data collection and analysis, decision to publish, or preparation of the manuscript.
Competing Interests: The authors have declared that no competing interests exist.
* E-mail: [email protected]
Introduction
Oscillatory neuronal activity is considered fundamental for
enabling co-ordinated activity during normal brain functioning
[1–3] whilst disturbances of oscillatory activity are associated with
a variety of brain disorders including epilepsy, Parkinson’s disease
and schizophrenia [4,5]. In general, oscillogenesis is considered to
arise from the concerted interplay of excitation and inhibition
within a local network [for review see 6,7], although intrinsic
oscillatory behaviour can also operate at the single neurone level.
Electrical coupling and intrinsic membrane currents may interact
to produce prominent oscillatory activity, such as that seen in cells
of the inferior olive [8,9], prompting the suggestion that
synchronous oscillations provide a temporal reference for control
of motor performance. Passive and active membrane conductanc-
es can bias cells to oscillatory activity at preferred, resonant
frequencies [reviewed by 10]. For example, cerebellar granule cells
and Golgi cells show a low frequency resonance [11–13]
suggesting that they may be tuned to respond to oscillatory
afferent signals in a narrow frequency range.
At the cellular level, representation of information using
oscillatory schemes gives rise to phase-of-firing coding, where
neurones fire at particular times during an on-going oscillation
thereby implementing a temporal code [see 14]. Sub-threshold
oscillations, and thus spike-time reliability, can be phase shifted by
excitatory inputs [15,16] and by inhibitory inputs [17–19]
suggesting that oscillatory information coding can adapt dynam-
ically. Downstream neurones must be able to read-out such codes
and might employ a variety of mechanisms including spike counts
and spike-time dependent plasticity [see 20–23]. In this regard,
cortical neurones are well-suited to detect correlated oscillatory
activity [24] as are the much smaller, electrotonically compact
cerebellar granule cells [25,26].
In this study we examine a novel class of neurones located in the
lateral reticular nucleus of the brainstem, whose axons form a
major supply of afferents to the cerebellar cortex [27]. These units
fire with remarkable regularity at idiosyncratic frequencies ranging
from ,7–22 Hz. Sensory evoked inhibition serves to phase reset
their regular spike firing enabling spike-time locking to particular
sensory stimulation frequencies. Using phase-response curves,
joint-peristimulus time histograms and simulations we show that
phase resetting can generate synchronised volleys of near-
coincident firing capable of representing a temporal code of
sensory input frequency that is well-suited to influence down-
stream neurones such as Golgi cells and granule cells in the
cerebellar cortex.
Materials and Methods
Experiments were performed, in vivo, on 50 adult Wistar rats
weighing 300–450 g. All procedures were conducted so as to
minimise suffering and were approved by the local ethical review
panel of the University of Cambridge and by UK Home Office
regulations (Project number 80/2234). The methods for general
preparation have been described previously [28]. Under urethane
general anaesthesia (1–1.5 g/kg i.p.) supplemented with 0.1 ml
Hypnorm (i.p.) rats were fixed in a stereotaxic frame and the
cerebellum was exposed. Single unit recordings were made from
units located in lobules Crus Ic/II a/b and in some experiments
recordings were also obtained from the lateral reticular nucleus
(LRN) in which the foramen magnum was opened, exposing the
brainstem landmark obex. For cerebellar penetrations electrode
PLoS ONE | www.plosone.org 1 October 2011 | Volume 6 | Issue 10 | e26503

angles were ,45 degrees from vertical so as to be perpendicular to
the cerebellar folial surface; depth from surface rarely exceeded
700 mm and crossing of Purkinje cell layers was carefully
determined in each electrode track. LRN recordings were targeted
using stereotaxic co-ordinates [29] – electrode angle 30 degrees
from vertical, interaural 24.2 mm AP, interaural 20.3 to 20.5
DV and midline +1.9 mm, following the histologically verified
approach of [30]. Signals from the microelectrodes were amplified
(gain61000–10000), filtered (band-pass 0.3–10 kHz for spikes and
0.1–300 Hz for local field potentials [LFP]) and digitised at
25 kHz (spikes) and 5 kHz (LFP). Some recordings were made
using platinum/tungsten electrodes coated with quartz glass –
80 mm shaft diameter – impedance 2–3 MV Thomas Recording -
Giessen, Germany) arranged in a 464 array or concentric 6+1
array (Eckhorn & Thomas, 1993) whilst on other occasions we
used glass micropipettes pulled from filament glass broken to give
tip impedances of 6–15 MV when filled with 0.5 M NaCl.
During LRN recording experiments, a stainless steel stimulation
electrode (100 kV, Microprobes, MD 20879, USA) was inserted
into the cerebellar cortex/white matter. Biphasic stimulus pulses
(0.2 ms, 2 Hz, 100–400 mA) were used to elicit antidromically
activated spikes in LRN units with all-or-none characteristics and
constant latency (typically ,1.5 ms). Since all of our units were
spontaneously active, antidromicity was confirmed by cancellation
of evoked spikes by collision with spontaneously occurring spikes
(Figure 1B), confirming the identity of these LRN units as
cerebellar-projecting mossy fibres.
Mixed low-threshold somatosensory afferents were stimulated
using percutaneous pin electrodes inserted in to the foot pads and
vibrissal skin at rates generally ,0.66 Hz. During some experi-
ments we used trains of stimuli at frequencies ranging from 6–
30 Hz, with trains lasting for ,1000 ms or 500 ms (frequencies
.20 Hz). Spike trains were discriminated using a custom written
spike shape analysis and cluster-cutting package (LabSpike, Dr.
Gary Bhumbra, Dept. of Physiology, Development and Neuro-
science, Downing Street, Cambridge, UK; available from http://
www.pdn.cam.ac.uk/staff/dyball/labspike.html) and the time
series were used to construct peri-stimulus time-histograms
(PSTHs) and interspike interval histograms (ISIHs). Phase
response curves for somatosensory input were calculated for some
metronome cells, using stimuli delivered at random relative to the
spontaneous firing. Prior to each stimulus, a period of spontaneous
firing (typically 5–6 spikes) was used to estimate the time of the
expected spike if no stimulus had occurred, thus perturbation
phase was calculated using the time of the expected spike and its
predecessor, taking into account peripheral conduction delays
(,10 ms; estimated from the PSTH).
To assess spike-time accuracy during stimulus trains we
calculated a spike-stimulus synchronisation index (SI), by treating
the time interval between stimulus pulses with a periodic function,
thus:
SI~
ffiffiffiffiffiffiffiffiffiffiffiffiffiffiffiffiffiffiffiffiffiffiffiffiffiffiffiffiffiffiffiffiffiffiffiffiffiffiffiffiffiffiffiffiffiffiffiffiffiffiffiffiffiffiffiffiffiffiffiffiffiffiffiffiffiffiffiffiffiffiffiffiffiffiffiffiffiffiffiffiffiffiffiffiffiffiffiffiffiPni~1
hi sin 2pi
n
� �� �2
zPni~1
hi cos 2pi
n
� �� �2
Pni~1
hið Þ2
vuuuuuut ,
where hi = number of spikes occurring in the ith phase bin of n
(typically 36 bins, corresponding to 10 degrees per bin).
ISI distributions were expressed as probability density distribu-
tions using a kernel density estimation algorithm [31] allowing
grouping of datasets and normalisation for idiosyncratic frequen-
cies of individual cells. Spike triggered averages of LFP (STA-LFP)
were constructed by taking epochs of LFP, typically 100 ms either
side of each spike. Confidence limits were calculated using Monte
Carlo simulations (spike-times and LFP segments shuffled,
minimum 100 simulations). Coherence between spikes and LFP
was calculated using spike-field coherence (SFC) as detailed by
[32] and Monte Carlo simulations were used to generate
confidence bounds (1000 simulations). For metronome cell
ensemble recordings we used the joint-peristimulus time-histogram
(JSPTH) technique to assess time-resolved stimulus-evoked
correlations between cell pairs [33]. JPSTHs were constructed
using 2 ms time-bins and smoothed using a gaussian where
s= 2 ms.
A simple model of granule cell synaptic integration, similar to
that used in our earlier work [25,26], was used to calculate the
summation of mossy fiber-EPSPs. The only purpose of this model
was to analyze the pattern of membrane potential fluctuations,
which could be obtained as a result of varying the number and
temporal density of synaptic inputs. In granule cells in vivo, the
spike output is essentially a linear function of the membrane
potential [25], so these membrane potential fluctuations should be
closely correlated to spike output, although this remains to be
confirmed in actual recordings from granule cells receiving inputs
from this type of LRN cell. In this paper, we set the model to
operate at a membrane potential of 259 mV to prevent spiking.
The model assumes that different mossy fiber synapses have
different average EPSP amplitudes [25]. As the model was used for
simulations within a narrow membrane potential range, it was
simplified to not include any active membrane conductances or
Golgi cell inhibition. Time-courses and amplitudes of each mossy
fiber-EPSP (at 259 mV) and the paired-pulse depression ratio
when an individual mossy fiber input is activated at high rates
were based on data for the mossy fiber-EPSPs in vivo [25]. The
following parameters were used for the EPSPs: EPSP peak
amplitudes at 800 MV (membrane resistance for granule cells in
vivo) (synapse 1–4): 5.2; 4.0; 3.2; 2.5 mV; time-to-peak: 0.95 ms;
half-time decay: 5.5 ms; paired-pulse depression, max. 63% (at
1 ms interval); paired-pulse depression time constant: 8 ms. The
spike responses, recorded at a temporal resolution of 0.1 ms, of
single metronome cells were fed to each of the four mossy fiber
inputs.
Results
Metronome-like activity in LRN cellsWe made recordings from brainstem units (n = 41, 15 animals)
located in the lateral reticular nucleus (LRN) and also from mossy
fibre terminals in the cerebellar cortex (n = 70, 35 animals). All of
these units were spontaneously active (i.e. in absence of overt
sensory stimulation) and their firing patterns were distinctive in their
regularity. The raw spike train and interspike interval histogram
(ISIH) shown in Figure 1A and 1B show data from an example LRN
unit with a mean firing rate of ,14 Hz. We only included units
recorded in the LRN which were positively identified as cerebellar-
projecting using antidromic collision testing (see Methods). Example
collision data are shown inset in Figure 1B. Across the population of
cells tested, collision latencies ranged from 1.1–1.9 ms, consistent
with fast-conducting fibres (c.f. ,5 ms climbing fibre conduction
latency from the inferior olive [34]). In other experiments, we
recorded units with similar firing patterns in Crus I/II of the
cerebellar cortex. An example unit is illustrated in Figure 1C and
1D. The action potential waveform of this unit (and all others like it
recorded in the cerebellum – see also Figure S1C and S1D)
comprised an early fast- and later variable slow-component typical
of mossy fibre terminals [25,35–37]; the fast component represents
Metronome Mossy Fibres
PLoS ONE | www.plosone.org 2 October 2011 | Volume 6 | Issue 10 | e26503

the axonal action potential and the slow, variable amplitude
component (negative after-wave; NAW) reflecting elements of the
synaptic action potential and post-synaptic response. Such units
were commonly encountered alongside spikes belonging to Golgi
cells and granule cells [see 28,38].
Comparing LRN units with cerebellar units, their mean firing
rates and the regularity of their firing patterns [measured using
CV2; 39] are plotted in Figure 1E, for a selection of units from
each population. Across our sample, individual units fired at a
range of idiosyncratic mean frequencies ranging from ,7–22 Hz;
the distinct regularity of these firing patterns generated CV2 values
which were generally ,0.13 - moreover, our brainstem neurones
showed highly similar characteristics when compared to those
units recorded in the cerebellum (Figure 1E). A one way
multivariate analysis of variance test did not find evidence of a
significant difference between these two groups (p,0.1494)
consistent with these samples being drawn from the same
underlying population. Metronome cells appear to be the most
regular firing of cell types in the cerebellum (perfect regularity
generates CV2 = 0) compared to other cell types such as Purkinje
cells, Golgi cells and granule cells [28,40,41], and in comparison to
neocortical cells [39] (Figure 1F).
In summary, the similarity of the cerebellar metronome firing
patterns to those in the brainstem alongside their dissimilarity to
other cerebellar cortical neurones in the granular layer considered
along with action potential waveforms characteristic of mossy
fibres (see also insets in Figure S1 – see also identical response
patterns between cerebellar and brainstem unit), make it likely that
our sample of cerebellar units represents the synaptic terminals of
metronomic LRN neurones, none-the-less in the absence of
definitive proof, our classification remains putative.
The highly regular firing patterns of metronome cells could arise
via intrinsic oscillatory currents, network activity or regular
afferent inputs – these scenarios are not mutually exclusive. We
used spike-triggered averaging (STA) of local field potentials (LFP)
recorded in the LRN to address this question. LFP-STAs are
useful for assessing the relationship between spikes (supra-
threshold) and peri-spike membrane activity (sub-threshold) since
the LFP represents the average of both supra- and sub-threshold
events from a volume of several 100 mm [for review see 42–45].
Example STAs calculated for a pair of simultaneously recorded
LRN units (different electrodes) are drawn in Figure 2A and 2B.
Peri-spike periodic voltage oscillations dominate the STA; the
period of these oscillations closely matches idiosyncratic firing
Figure 1. Spontaneous firing properties of metronome cells. A shows a 5 second excerpt of spontaneous spiking activity from an examplemetronome cell recorded in the brainstem, alongside the superimposed spike waveforms. B plots the ISIH for this neurone which had an idiosyncraticfrequency ,13 Hz (bin size 1 ms). The inset shows 10 traces of raw data where spontaneous spikes were used to trigger delayed antidromicstimulation in the cerebellum. In the upper traces, antidromically evoked spikes occur at fixed latency (1.3 ms). When stimuli are triggered at less thanthis latency, no antidromic spikes are evoked (lower traces indicated by * - stimulus delay 1 ms) due to collision with spontaneous orthodromicallyconducted spikes. Similar data for an example cerebellar metronome unit (slower idiosyncratic frequency ,8 Hz) are plotted in C and D. Group datafor mean firing frequency and CV2 calculated from spontaneous activity of brainstem and cerebellar units is plotted in E (note that whilst all unitswere spontaneously active, records of spontaneous activity were obtained from a subset of our sample). No significant differences were foundbetween these groups comparing either parameter. F plots CV2 for a variety of neurones in the cerebellum and the neocortex, indicating thatmetronome cells are particularly regular.doi:10.1371/journal.pone.0026503.g001
Metronome Mossy Fibres
PLoS ONE | www.plosone.org 3 October 2011 | Volume 6 | Issue 10 | e26503

frequency of each cell, 16 Hz and 12 Hz, respectively. All LRN
STA’s showed peri-spike periodic voltage oscillations (n = 6). We
used a Monte Carlo shift predictor (spike times randomised, STA
recomputed; 100 shuffles - superimposed broken grey lines) to
calculate 95% confidence interval for the STA, thus values
exceeding these bounds (grey lines) are considered significant
(p,0.05). This neurone pair was separated by approximately
300 mm – we also computed the STA using spikes from one cell
and the LFP signal from its counterpart, giving rise to a ‘flat’ STA
(Figure 2C). Similar results were obtained for other cross-
referenced STAs using simultaneous recordings (data not shown).
STA oscillations were typically 40–80 mV peak to peak, compa-
rable in size to STA oscillations reported elsewhere in the brain
[46–49]. These results suggest that peri-spike oscillations are
generated focally (i.e. spatially restricted), rather than representing
distributed network activity such as that seen during hippocampal
theta oscillations [50].
We also calculated spike-field coherence (SFC) to assess phase
synchronization between the LFP and spike times as a function of
frequency [32]. SFC is a unitless measure between zero and one –
values of one suggest a constant phase synchronisation of spikes
with the LFP. Figure 2D and 2E show SFC spectra for each STA
(solid lines) with maximal peak values at 0.66 and 0.37,
respectively. Confidence limits were generated using Monte
Carlo simulations (95th centile of 1000 shift predictors – broken
lines), thus SFC values above these limits are considered to be
significantly above levels expected by chance synchronisations
between spikes and LFP frequency components (p,0.05).
Figure 2. Spike-LFP coherence of metronome cell firing. A and B show spike-triggered averages of LFP for two example metronome cells(recorded simultaneously on separate electrodes). In each case, spikes referenced to their own LFP signal revealed peri-spike periodic voltagefluctuations (solid lines). Monte Carlo based confidence limits (95%) are superimposed on each plot (broken grey lines). C shows the STA using spikesfrom the cell in A referenced to LFP of the cell in B using the same format – although recorded simultaneously and separated by ,300 mm norelationship between spikes and LFP was apparent. D and E plot spike-field coherence (solid lines) for the same cell pair. Monte Carlo basedconfidence limits (95%) are superimposed on each plot (broken lines) along with probability density estimates for the spiking frequency of each cell(grey curves). Grouped data for SFC values (mean 62 S.E.M.), normalised for idiosyncratic firing frequency are plotted in F.doi:10.1371/journal.pone.0026503.g002
Metronome Mossy Fibres
PLoS ONE | www.plosone.org 4 October 2011 | Volume 6 | Issue 10 | e26503

Dominant peaks in the SFC spectra were closely linked to
idiosyncratic firing frequency, c.f. superimposed spike frequency
distributions (grey curves) in each example. Grouped data are
plotted in Figure 2F (normalised for the idiosyncratic firing rate of
each cell) which shows a 95% confidence interval for SFC values
with respect to normalised idiosyncratic firing frequency;
maximal phase synchronisation occurs at frequencies closely
corresponding to the cell’s idiosyncratic firing frequency. We
conclude that peri-spike voltage oscillations and spike output are
closely synchronised.
The localised origin, spike-time dependence and the spike field
coherence for peri-spike periodic STAs suggests they represent
membrane voltage fluctuations from the individual neurones
under study. These findings are consistent with the regular firing
patterns of metronome cells being underpinned by intrinsic
oscillatory currents [44].
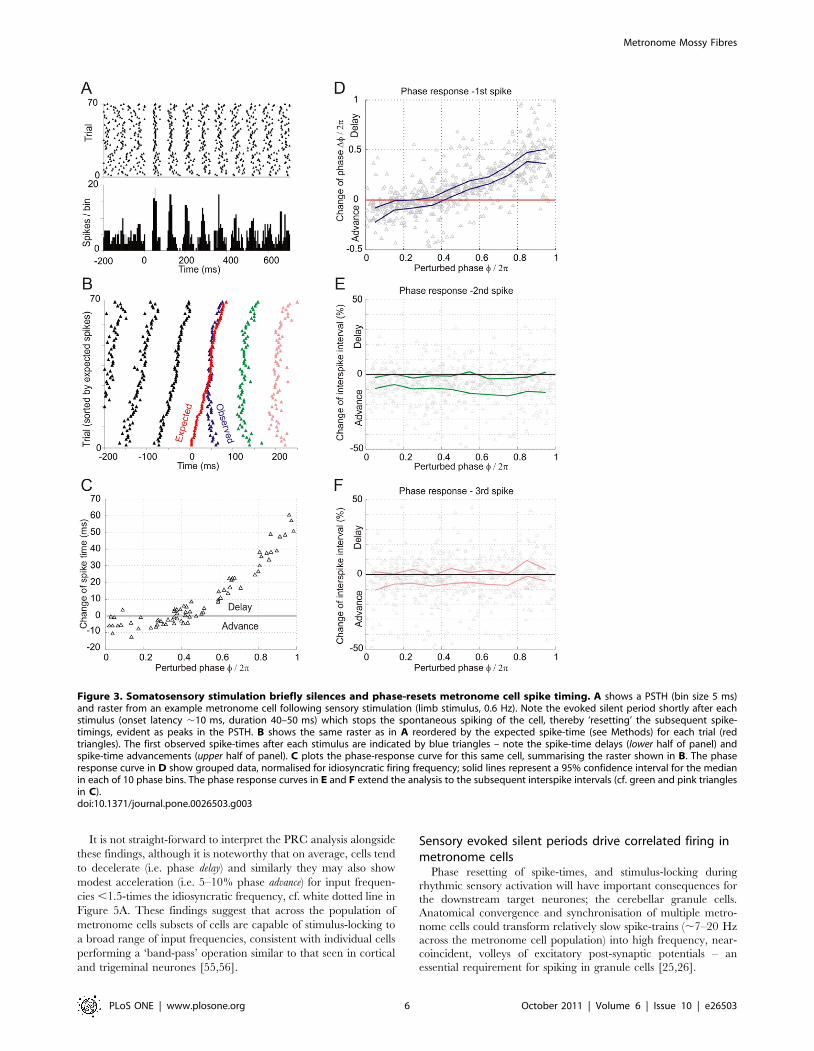
Sensory evoked silent periods phase reset metronomecells
Somatosensory activation interrupted the regular firing of
metronome cells by causing a brief silent period (duration 40–
50 ms) following which the spontaneous spiking resumed, thus
sensory evoked silent periods served to reset the spike-times of the
regular spiking metronome cells (Figure 3A). Responses of this type
could be evoked from widespread areas of the skin, including the
face and limbs, and consistent with previous studies of LRN
neurones [51,52], metronome cells had widely convergent, often
bilateral receptive fields (see Text S1 and Figure S1). In the
example PSTH shown in Figure 3A, stimuli were delivered at
random relative to the firing of the cell. Reorganising the raster
based on the expected spike times (see Methods), reveals the phase
response properties of this neurone (Figure 3B). Intuitively, many
of the observed spikes following the perturbations are delayed (i.e.
evoked silent periods extend the interspike interval = phase
procession; trials 1,30) whilst others show little or no deviation
(trials 31,50). However, the perturbation caused many spikes to
occur earlier than expected (trials 51,71: phase precession). A spike-
time phase response curve (PRC) for this cell is shown in
Figure 3C. The shape of the PRC is related to spike-generation
mechanisms and thus offers a precise characterisation of the effect
a perturbation has on an on-going oscillation and the timing of
subsequent spikes [53]. The PRC shown in Figure 3C indicates
that perturbations of the regular firing of this metronome cell
occurring soon after spontaneously generated spikes (phase 0–0.3)
tended to advance the subsequent spike-time by 5–10 ms (triangles
,0). Spike-time delays up to 60 ms were observed for perturba-
tions occurring later in the firing cycle. Given the idiosyncratic
firing frequency of this cell was 12–13 Hz these changes in spike-
time range from ,10% advancement to ,75% delay.
The PRC for group data from 18 cells tested in the same way
(40 perturbations each) is shown in Figure 3D – data are
normalised for idiosyncratic firing frequencies. Each triangle
represents a perturbed spike-time from an individual cell (cf. blue
triangles in Figure 3B). Data are grouped into 10 phase bins with
95% confidence intervals calculated for the mean of each bin (solid
lines). The PRC indicates that for a typical metronome cell, phase
advancement of 5–10% is likely to occur for perturbations that
arrive within the first third of a typical firing cycle (i.e. observed
spike-times are 5–10% earlier than expected). Little or no change
in spike-time was apparent for perturbations delivered across 30–
40% of a ‘typical’ firing cycle, whereas for all later-arriving
perturbations subsequent spike-times were delayed by up to 50%.
We extended the analysis to the 2nd and 3rd spike-times in the
series (green and pink triangles, respectively in Figure 3B). We
found that the adjacent interspike interval (2nd spike) tended to
show a modest spike-time advancement of 5–10% (Figure 3E, cf.
Figure 3B), irrespective of the phase of the initial perturbation.
The spike-times of the 3rd (and subsequent spikes – not shown) did
not show this effect. This finding indicates that the influence of the
evoked silent periods may extend to 1st and 2nd spike-times after
the perturbation, but not beyond.
The spike-time advancement arising through presumed inhib-
itory input (i.e. evoked silent periods) suggests that inhibition-
activated depolarising mechanisms, such as Ih [54], might be
brought into play following sensory input. Metronome cells can
thus reflect the precise timing of sensory events by the phase
response of their spike-time resetting, on a trial-by-trial basis.
Spike-time alignment of metronome cell firing torhythmic sensory input patterns
The regular firing pattern of metronome cells at idiosyncratic
frequencies ranging from ,7–22 Hz prompted us to examine the
effects of rhythmic somatosensory stimulation on spike-timing. We
used trains of stimuli ranging from 6–30 Hz; a bandwidth that
encompasses rhythmic movements such as licking, grooming,
locomotion and also the distribution of idiosyncratic firing rates of
metronome cells (Figure 1E).
Metronome cells showed a pronounced ability to stimulus-lock
their spike times across a broad range of sensory stimulation
frequencies. Data from an example cell are shown in Figure 4.
Ascending stimulation frequencies (2 Hz steps) cause pronounced
shifts in the overall activity of this cell (cf. Figure 3C), as shown by
the close relationship between spike-times and individual stimulus
pulses (black triangles – Figure 4A). During sensory stimulation,
spike firing shifted toward the stimulation frequency; this cell was
able to lock onto input frequencies ,10 Hz (cf. ISI probability
distributions, Figure 4B), whilst for input frequencies 10–16 Hz,
the firing was split into at least two distributions each tending
toward the stimulation frequency or half of this value, respectively.
With increasing stimulation frequency, spike firing became
increasingly locked to half of the stimulation frequency, reaching
a ceiling at .24 Hz, where the stimulus-locking relationship broke
down. In order to assess spike-time alignment precision at different
input frequencies, we calculated a spike-stimulus synchronisation
index (SI – see Methods; Figure 4C). This provided a unitless
measure between 0 and 1, thus if all spikes occur at the same phase
relative to each stimulus pulse, SI = 1. In this particular example,
spike-stimulus synchronisation exceeded 0.5 for frequencies in the
range 8–20 Hz, thus at least half of the spikes had a consistent
relationship to the stimulation frequency; this particular cell had
an idiosyncratic frequency of ,14 Hz. Given that stimulation
could last for ,1000 ms (see Methods), these findings indicate that
metronome cells can show sustained spike-time alignment to a
broad range of sensory input frequencies.
In order to group data across cells, we normalised for the
idiosyncratic frequencies of our cells. Data for 12 cells tested with
the range of input frequencies are plotted in Figure 5A, where the
ISI frequency distributions during stimulation are represented as
colour-coded probability density. Grouping the data in this way
suggests that stimulus-locking (either at the stimulation frequency
or half of this value) will occur for inputs in the range of 0.5 to ,2-
times the cell’s idiosyncratic frequency, indicated by the diagonal
trends in the colour plot (cf. Figure 4B). Grouped data for the
spike-stimulus synchronisation index are plotted alongside
(Figure 5B). Analogous to tuning curves and best-frequencies for
auditory hair cells, maximal spike-time accuracy for individual
cells occurs with input frequencies close to the idiosyncratic
frequency.
Metronome Mossy Fibres
PLoS ONE | www.plosone.org 5 October 2011 | Volume 6 | Issue 10 | e26503
It is not straight-forward to interpret the PRC analysis alongside
these findings, although it is noteworthy that on average, cells tend
to decelerate (i.e. phase delay) and similarly they may also show
modest acceleration (i.e. 5–10% phase advance) for input frequen-
cies ,1.5-times the idiosyncratic frequency, cf. white dotted line in
Figure 5A. These findings suggest that across the population of
metronome cells subsets of cells are capable of stimulus-locking to
a broad range of input frequencies, consistent with individual cells
performing a ‘band-pass’ operation similar to that seen in cortical
and trigeminal neurones [55,56].
Sensory evoked silent periods drive correlated firing inmetronome cells
Phase resetting of spike-times, and stimulus-locking duringrhythmic sensory activation will have important consequences forthe downstream target neurones; the cerebellar granule cells.Anatomical convergence and synchronisation of multiple metro-nome cells could transform relatively slow spike-trains (,7–20 Hzacross the metronome cell population) into high frequency, near-coincident, volleys of excitatory post-synaptic potentials – anessential requirement for spiking in granule cells [25,26].
Figure 3. Somatosensory stimulation briefly silences and phase-resets metronome cell spike timing. A shows a PSTH (bin size 5 ms)and raster from an example metronome cell following sensory stimulation (limb stimulus, 0.6 Hz). Note the evoked silent period shortly after eachstimulus (onset latency ,10 ms, duration 40–50 ms) which stops the spontaneous spiking of the cell, thereby ‘resetting’ the subsequent spike-timings, evident as peaks in the PSTH. B shows the same raster as in A reordered by the expected spike-time (see Methods) for each trial (redtriangles). The first observed spike-times after each stimulus are indicated by blue triangles – note the spike-time delays (lower half of panel) andspike-time advancements (upper half of panel). C plots the phase-response curve for this same cell, summarising the raster shown in B. The phaseresponse curve in D show grouped data, normalised for idiosyncratic firing frequency; solid lines represent a 95% confidence interval for the medianin each of 10 phase bins. The phase response curves in E and F extend the analysis to the subsequent interspike intervals (cf. green and pink trianglesin C).doi:10.1371/journal.pone.0026503.g003
Metronome Mossy Fibres
PLoS ONE | www.plosone.org 6 October 2011 | Volume 6 | Issue 10 | e26503

To assess time-resolved stimulus-induced correlations between
simultaneously recorded metronome cells, we used the joint peri-
stimulus time histogram technique [JPSTH - 33]. Our analysis
suggests that the evoked silent periods following sensory stimula-
tion can synchronise metronome cells, for the duration of the
sensory stimulation. We analysed data from 11 LRN neurones (12
possible pairs recorded simultaneously) tested with a range of
stimulation frequencies (see Figure 4). Assessment of the
normalised JPSTHs (i.e. normal JPSTH minus shift-predictor)
showed no residual correlations (data not shown) indicating that
any correlations between metronome cells were underpinned by
stimulus-induced spike-time changes, rather than arising through
mutual connections [33]. Since we found no evidence for
correlations other than those driven exclusively by stimulation,
henceforth we only consider the bin-by-bin cross-product of the
two PSTHs (‘predictor’, alternatively the PST-product) – this
represents the null hypothesis that spiking probabilities are related
to the stimulus, although each neurone fires independently of its
counterpart. We first examined near-coincident firing arising from
single stimuli – example data for a metronome cell pair are drawn
in Figure 6A (idiosyncratic frequencies ,12 Hz and 14 Hz,
respectively). The main diagonal of the JPSTH gives rise to the
‘PST coincidence histogram’ (Figure 6B) which displays the
observed rate at which both neurones fire simultaneously (to
within the accuracy of the bin-width of the histogram – 2 ms).
Near-coincident activity is most likely at ,50 ms latency (i.e. the
first spike following the evoked silent periods in each neurone).
Subsequent near-coincident firing occurs due to stochastic
interaction of the cells’ idiosyncratic frequencies, producing the
interference pattern visible in the correlation delay matrix
(paradiagonal to JPSTH diagonal) shown in Figure 6C, which
highlights the lead-lag times for near-coincident spike-timings. The
arbitrarily chosen lead-lag range of 225 to +25 ms corresponds to
a minimum instantaneous frequency of 40 Hz – if these
metronome cells projected to the same granule cell, the principal
coincidences for this cell pair would generate EPSPs at rates
.200 Hz (taken as the instantaneous frequency of the spikes
generated by the cell pair). Grouped data for 11 metronome cell
pairs tested with single stimuli are shown in the same format in
Figure 6D – thus, the population response of metronome cells (of
Figure 4. Rhythmic somatosensory stimulation entrains metronome cell spiking in a band-pass like manner. The PSTHs in A show theresponses of an example metronome cell during a variety of rhythmic stimulation patterns (stimulus frequency indicated beside each PSTH, stimuluspulse times represented by solid triangles under each PSTH; bin-size 10 ms). Simple visual inspection of the PSTHs is misleading as it obscures trial-by-trial variability, thus we computed probability density estimates for the interspike interval frequencies (B) before and during the stimulus trains(white and black distributions, respectively). To aid visual inspection, in each plot in B stimulation frequency is indicated by the open triangleswhereas the grey triangles represent half of this value – note the tendency for spiking frequencies to centre around these values at differentstimulation frequencies. Spike-time accuracy with respect to each stimulus pulse in the train was calculated using a spike-stimulus synchronisationindex (see Methods).doi:10.1371/journal.pone.0026503.g004
Metronome Mossy Fibres
PLoS ONE | www.plosone.org 7 October 2011 | Volume 6 | Issue 10 | e26503

differing idiosyncratic frequencies) following a single stimulus is a
well synchronised, but brief lived increase in near-coincident firing
at ,50 ms (see expanded time-base in lower panel).
The stimulus-locking properties of metronome cells suggest that
spike-timing can be altered for prolonged periods during rhythmic
somatosensory stimulation (see Figures 4 and 5). This may create
ideal conditions for stimulus-induced synchronisation of multiple
metronome cells across the population. Using the same format as
Figure 6D, the correlation delay matrices shown in Figure 6E for
the same cell pair show that stimulus-locking gives rise to repeated
epochs of near-coincident firing closely tied to the stimulation
frequency. Moreover, this behaviour persists for the duration of
each stimulation train (1000 ms), although with the cessation of
stimulus-locking at the termination of the stimulus train, the cell
pair rapidly de-correlated and resumed their idiosyncratic firing
(cf. Figure 6C). As stimulus locking degrades with increasing
stimulation frequencies, especially .20 Hz (correlation delay
matrices not shown) so too does the likelihood of synchronisation,
thus near-coincident firing appears most prominent for this cell
pair for stimulation frequencies ,16 Hz (cf. idiosyncratic
frequencies ,12 Hz and ,14 Hz).
Considered across the population, correlation delay matrices for
grouped data are plotted in Figure 7 showing that the population
of metronome cells, each with idiosyncratic frequencies, are
capable of temporally encoding a variety of stimulation frequen-
cies into sustained ‘packetised’ near-coincident firing. The
stimulus-locking preferences for input frequencies ,20 Hz
considered alongside the decrement in synchronisation likelihood
suggests that the population of metronome cells may behave as a
series of band-pass filters (#20 Hz; cf. individual cells behaving as
band-pass filters – Figure 4) able to broadcast temporally aligned
near-coincident activity to the cerebellum, indexed by the
underlying frequency of sensory events.
Synaptic integration of metronome cell spike-timing ingranule cells
Our analysis suggests that common inhibitory drive can
temporally-align metronome cell spike-timing, leading to a
synchronised population broadcast of mossy fibre activity to the
cerebellum. Prior modelling work has highlighted precise timing of
mossy fibre inputs across granule cell dendrites as a requirement to
reach spike-threshold [25,26]. We examined how metronome
mossy fibre signals might summate in a simulated granule cell (see
Methods), employing real spike-times recorded from a range of
metronome cells (n = 10 cells, covering the range of firing
frequencies, only ipsilateral hindlimb responsive cells were
arbitrarily selected for consistency and to normalise for peripheral
conduction delays). In the first of two scenarios, we assumed that
the simulated granule cell received convergent mossy fibre inputs
with similar frequencies on each of 4 dendrites, in contrast to the
alternative scenario where convergent input frequencies were
dissimilar, instead covering a broad range (note that spiking and
inhibition were not included in the simulation). As expected for the
similar input scenario, a single stimulus reveals a resonant EPSP
pattern, reflecting the auto-correlation of similar frequencies,
particularly close to the idiosyncratic frequency of the mossy fibres
Figure 5. Population entrainment in response to rhythmic somatosensory stimulation. A plots grouped data for 12 metronome cellstested with the gamut of rhythmic stimulation frequencies – data were grouped as probability density estimates and normalised for idiosyncraticfiring rates, thus stimulation frequencies are expressed relative to these values for each cell. The diagonal trends in the probability densitydistributions indicate the tendency for the metronome cells to alias stimulation frequencies in the range of 0.5 - ,2 times their idiosyncraticfrequencies. B plots the spike-stimulus synchronisation index derived from the same grouped data, indicating that maximal spike-time accuracy withrespect to individual stimulation pulses occurred for stimulation frequencies close to the idiosyncratic firing frequency. Data are plotted as mean 62S.E.M.doi:10.1371/journal.pone.0026503.g005
Metronome Mossy Fibres
PLoS ONE | www.plosone.org 8 October 2011 | Volume 6 | Issue 10 | e26503

Figure 6. Near-coincident firing in metronome cells induced by single somatosensory stimuli. A shows the JPSTH for a pair ofsimultaneously recorded metronome cells following a single sensory stimulus (limb); the matrix represents the PST-product, from which the diagonalis used to give rise to the PST coincidence histogram shown in B. A further extension of this is the correlation delays matrix shown in C, whichhighlights epochs of near-coincident firing for the cell pair, along with lead-lag times between counterpart spikes corresponding to a minimum of40 Hz. Note that near-coincident firing is most probable ,50 ms after the stimulus onset (i.e. latency of the first phase-reset spike-time) withsubsequent stochastic interactions between the cells as they resume their idiosyncratic firing patterns (see Figure 3). The correlation delay matrixshown in D plots grouped data for 11 cell pairs tested with single sensory stimuli. E plots correlation delay matrices for the same cell pair illustrated inA–C, during a variety of rhythmic stimulation patterns – stimulation frequency is indicated besides each panel, and individual pulse times arerepresented by vertical white lines. Lead-lag times in each panel are 0625 ms (arbitrarily chosen), corresponding to a minimum instantaneousfrequency of 40 Hz. Note the tendency for epochs of near-coincident firing to persist for the duration of the stimulation trains (1000 ms), and theapparent ‘preference’ of this cell pair for input frequencies ,16 Hz.doi:10.1371/journal.pone.0026503.g006
Metronome Mossy Fibres
PLoS ONE | www.plosone.org 9 October 2011 | Volume 6 | Issue 10 | e26503

(,16 Hz; Figure 8A). In keeping with the stimulus-locking of
individual metronome cells, no patterned EPSP summation
occurred for stimulation frequencies of 20 Hz and above (only
20 Hz case shown; cf. 24 Hz and above in Figure 4 and inputs
.20 Hz in Figures 6 and 7). In our alternative scenario using
dissimilar frequencies, a diverse mixture of metronome cells with
firing frequencies ranging from 8 to 16 Hz converging onto a
single granule cell produced more complex results. In this
situation, single stimuli failed to evoke EPSP summation
(Figure 8B). Although our JPSTH analysis suggests that single
stimuli evoke mass synchronisation across the population (onset
latency ,50 ms; see Figure 6D), it is not guaranteed that all
granule cells receiving convergent metronome mossy fibre inputs
would experience this, as precise synchronisation depends on the
idiosyncratic firing frequencies of the particular mossy fibres
reaching each granule cell. During rhythmic stimulation, modest
EPSP patterning is evident at 6 Hz and 12 Hz, with highly
coincident patterned EPSP summation visible during 18 Hz
stimulation, with a similar failure of summation at the highest
frequency. The pronounced resonance at 18 Hz is sharply in
contrast to the relative lack of resonance at frequencies bordering
this (16 Hz and 20 Hz). Although these models are speculative,
they suggest that frequency-specific EPSP patterning may occur in
individual granule cells and that these properties may emerge as a
function particular pattern of idiosyncratic frequency convergence
of metronomic mossy fibres.
Discussion
Our experiments reveal an unusual spike-time coding strategy
driven by inhibition imposed upon highly regular firing in
metronomic neurones which in turn form a major mossy fibre
input to the cerebellum.
Phase resetting of spike-time by sensory evoked inhibition can
produce either spike-time advancements and delays indexed by the
arrival time of the inhibition relative to preceding spontaneous
spike. This type of biphasic phase response is known as a type II
PRC [57] in contrast to type I PRCs where only spike-time delays
are seen. Many PRC studies in vitro rely on depolarising current or
sinusoidal current injection to evoke firing [54,58,59]. Our study
has the advantage of exploiting rhythmic spontaneous firing and
uses an intact sensory pathway to drive inhibition-mediated phase
resetting. Although we do not address the mechanisms behind this
inhibition, comparison with GABAergic resetting of intrinsic
oscillations and spike-timing mechanisms has been reported in
subthalamic neurones [18], also in Type A cells of the globus
pallidus (Fig. 4 of [19]) and hippocampal pyramidal cells [17] and
indeed GABAergic inhibition has a prominent role in the
generation and maintenance of oscillatory activity [7,60,61].
Our spike-time advancements (extending over two ISIs; approx-
imately 200 ms) are consistent with GABAergic activation of
hyperpolarisation-activated cation currents, such as Ih [54].
Computationally, a pool of oscillators at differing frequencies
can efficiently represent the passage of time [62] and although
inhibitions appear brief-lived (40–50 ms), the ionic mechanisms
underlying regular metronome cell firing create a de facto spike-
time ‘memory’ of inhibition arrival times, extending over many
hundreds of milliseconds (Figures 3 and S1 of [63]). Neurones
considered under integrate-and-fire models (which fire solely on
the basis of synaptic events) do not show this property, it being
instead a property of resonate-and-fire models. Such models rely
on sub-threshold oscillations imparting a membrane resonance to
the neurone – inputs timed according to the eigenfrequency, or its
factors, may bring the cell to spiking threshold. Inhibitory inputs
can also produce post-inhibition spiking, via anodal break
excitation (Figures 4 and 8 of [64]) suggesting a close correlate
between metronome cells and the resonate-and-fire model.
Resonance is generally considered in terms of sub-threshold
oscillations, although our metronome cells were spontaneously
active raising the possibility that spikes and associated after-
potentials might serve as an oscillatory ‘internal’ reset mechanism
as well as an output signal [see 63]. As highlighted in Figure 2,
metronome cells appear to behave as independent neuronal
oscillators since their spikes are intimately associated with locally
generated periodic voltage oscillations intimately linked to the
cell’s idiosyncratic frequency. Since we used spikes and LFP from
the same electrode it is possible that slow components of the spikes
(afterpotentials) contribute to these LFP oscillations as suggested
Figure 7. Near-coincident firing in metronomes cells is pacedby rhythmic sensory stimulation. Following the same format asFigure 6E, correlation delay matrices are shown for grouped dataderived from 11 metronome cell pairs tested with the range ofstimulation frequencies. Note the tendency for epochs of near-coincident firing closely indexed by the stimulation frequency andthe decline of near-coincident firing for input frequencies $20 Hz.doi:10.1371/journal.pone.0026503.g007
Metronome Mossy Fibres
PLoS ONE | www.plosone.org 10 October 2011 | Volume 6 | Issue 10 | e26503

by Buszaki [45]. However, sub-threshold soma-dendritic mem-
brane voltage oscillations also make a direct contribution to local
LFP [44] and we interpret the peri-spike voltage oscillations as
reflecting these processes. An additional concern surrounds our
use of anaesthetic which may have induced regular firing in
metronome cells. However, other cerebellar cell types fire with
much greater irregularity under the same conditions (see
Figure 1F). Our data suggest that metronome cells possess intrinsic
pacemaker-like properties which may be underpinned by
persistent sodium currents and calcium activated potassium
currents leading to membrane resonance [for review see 10] and
auto-rhythmic firing [65,66]. A further limitation of our
experiments concerns the use of electrical micro-stimulation of
sensory afferents capable of producing highly synchronous afferent
volleys. In contrast, natural sensory stimuli may well evoke lower
levels of metronome cell population synchrony although rhythmic
behaviours such as whisking, sniffing, etc. are likely to produce
synchronous afferent input (discussed later). It is also noteworthy
that cerebellar Golgi cells recorded in the same preparation show
qualitatively similar responses to electrical or air-puff stimulation
of the same sensory areas (Figure 8 of [28]).
Ensemble recordings revealed that single sensory evoked
inhibitions can briefly synchronise ensembles of metronome cells
(Figure 6C and 6D). Comparable behaviour has been observed in
Type A globus pallidus cells sharing inhibitory input [19].
Similarly, olfactory bulb mitral cells can form synchronous
ensembles when receiving common inhibitory ‘noise’ [67]
suggesting a close correlate between our metronome cell
synchrony arising via common inhibitory inputs. Across the
population, Type II phase-resetting of spike-times may promote
temporal alignment between cells; neurones with Type II PRCs
receiving common noisy input synchronise more readily than
those with Type I PRC [68]. Thus far, we have only considered
the response of metronome cells following a single, randomly
delivered, sensory evoked inhibition. The large receptive fields of
metronome cells suggest they may gather sensory information
from many sources including the face and limbs (Figure S1).
Vibrissae movements in rats exhibit a range of frequencies from 2–
20 Hz with predominant frequencies around 2 Hz, 5–9 Hz and
,16 Hz [69] similar to licking [4–7.5 Hz 70], rapid sniffing
during odour discrimination [see 71] and stereotyped grooming
behaviour [2–7 Hz 72]. Moreover, in cats, cerebellar-projecting
Figure 8. Simulation of EPSP summation arising from near-coincident firing of metronome cells converging in granule cells. Thecartoons in A & B illustrate the input characteristics used for each simulation of averaged EPSP summation in a simulated granule cell, i.e. similar ordissimilar convergence of metronome mossy fibres. Spike times from a real metronome cell with 16 Hz idiosyncratic firing frequency were fed to eachdendrite in A, giving rise to resonant patterning of EPSPs at a variety of rhythmic stimulation frequencies (stimulus pulse times indicated by triangles).In B, spike times from 4 individual metronome cells, each with differing idiosyncratic firing frequency, were fed into the model. In contrast to A, singlestimuli did not bring about EPSP summatioan although rhythmic stimulation, particularly at 18 Hz gave rise to resonant EPSP patterning.doi:10.1371/journal.pone.0026503.g008
Metronome Mossy Fibres
PLoS ONE | www.plosone.org 11 October 2011 | Volume 6 | Issue 10 | e26503

LRN cells can receive locomotor and/or rhythmic central
respiratory inputs [73]. These sources of rhythmic inputs would
be expected to generate periodic/rhythmic barrages of inhibition
in metronome cells. Rhythmic stimulation in our experiments
created a forced-periodic synchronisation that persisted for the
duration of the stimulus (1000 ms), bearing a close correlate with
periodic stimulation in the resonate-and-fire model [64]. Metro-
nome spike-timing can reliably represent the sensory stimulation
frequency and its factors, with maximal spike-time accuracy
occurring for frequencies close to the cell’s idiosyncratic frequency.
Similar spike-time alignment via phase-resetting of intrinsic
oscillations and synchronisation of multiple hippocampal principal
cells can be induced by rhythmic stimulation of inhibitory inputs at
5 Hz [17], although in that study other frequencies were not
examined. Such behaviour suggests that metronome cells can
behave in a manner similar to band-pass filters [c.f. 55,56] and
that as a population they broadcast a ‘packetised’ code of sensory
input frequency [74], established through brief-lived epochs of
synchronisation, to their downstream targets in the cerebellum.
However, the reliability of such a code at the single neurone level
may be low since stimulus-spike locking can be ,1:1 (see Figure 4
and 5). None-the-less, these limitations might be compensated for
at the population level by synchronised ensembles of cells and
through the possible anatomical convergence of metronome cell
projections upon their downstream targets.
Functionally, our data complement the view that that one of
the major roles for inhibition is to determine precise spike-timing
[18,75]. The most numerous targets for metronome cells are
cerebellar granule cells, although Golgi cells may also be targeted.
Prior modelling work has highlighted precise timing of inputs
across granule cell dendrites as a requirement to reach spike-
threshold [25,26]; we examined these issues using the same
granule cell model. Although we did not specifically examine
spiking (nor was inhibition included) our simulations suggest that
metronomic mossy fibres, if converging on individual granule
cells, may impart their resonant properties predisposing granule
cells to respond favourably at particular input frequencies and
thereby creating preferred times for spike generation. In this
regard, the spiking output of granule cells is expected to linearly
reflect their membrane potential level [25,76], although the exact
timing of granule cell spikes is subject to stochasticity [77].
Alternatively, synchronised metronomic mossy fibre input may be
equally well suited to induce NMDA-receptor mediated plasticity
[c.f. theta burst stimulation used by 78]. However, metronome
cells are not the only source of mossy fibres and we cannot
address the question of whether all LRN cells are metronomic; in
contrast, other mossy fibre types tend to fire at much higher
frequencies (.100 Hz) during signalling [25,35,37,79,80]. In-
deed, a subset of metronome cells do show brief-lived high
frequency excitations (see Figure S1C, S1D, S1F and S1H). In
agreement with our own observations, other studies have
described metronome-like mossy fibre terminals in the anterior
lobe of decerebrate cats [81]. These mossy fibres discharged
regularly at ,20 Hz and showed spike-time resetting responses
initiated by sensory evoked silent periods, identical to our own
responses. Taken together, these observations suggest that
metronome cells are at least common to both rats and cats and
that they may represent a generalised coding scheme of cerebellar
mossy fibres.
If metronome cells converge on individual granule cells our data
suggest that the tight synchronisation of their activity across
multiple dendrites could generate an EPSP profile similar to the
higher frequency firing mossy fibre types. Prior investigations have
not described granule cell EPSP patterns predicted by our
simulations [25,26,80,82] although it is noteworthy that none of
these studies employed rhythmic stimulation – our simulations
suggest that this is a key requirement to reveal frequency-patterned
EPSP summation, in particular, no EPSP patterning is seen when
convergent mossy fibre inputs of dissimilar frequency respond to a
single stimulus (Figure 8B) so the possibility remains that
frequency-patterned EPSP summation is yet to be observed
experimentally. Nonetheless, granule cells in vitro show membrane
resonance around 4–10 Hz and Golgi cells show pacemaker
oscillations at similar frequencies [11,12,66], whilst Golgi cells in
vivo may participate in 5–30 Hz oscillatory activity via gap-
junction coupling to other Golgi cells [13]. LFP oscillations (7–
25 Hz) in the granular layer have been reported in awake
monkeys, rabbits and rats during periods of quiet attentiveness or
learning [13,83–85] although the origin of these signals remains
unclear their frequency range is a very close correlate with
metronome cell firing frequencies (,7–22 Hz). The resonant
properties of Golgi cells and granule cells predisposes them to
‘tune-in’ to oscillatory inputs, thus metronome cells may be one of
the principal orchestrators of oscillatory sensorimotor information
processing at the input stage of the cerebellum.
Supporting Information
Figure S1 Characterisation of somatosensory responsesin metronome cells. The PSTHs in A and B show typical
spike-time resetting responses beginning with silent periods only,
for an example brainstem unit and cerebellar unit, respectively.
Action potential waveforms are inset – note the dual component
action potential of the cerebellar units. Similar data are presented
in C and D illustrating responses beginning with short-lasting
excitations (SLE; highest bins in each PSTH) for example
brainstem and cerebellar units, respectively. The vibrisssal-evoked
SLE response shown in D consisted of two discrete excitations –
see expanded time-base (inset). The bar charts summarise the
response likelihoods from each of six routinely tested skin areas (Eand F) alongside data for onset latencies and durations ofresetting responses overall (G) and SLE excitations only (H).
Note that two bars are presented for vibrissal responses (cf. D).
PSTH bin-size 10 ms. Error bars represent mean 62 S.E.M.
(TIF)
Text S1 Widespread, bilateral receptive fields of metronome
cells.
(DOC)
Acknowledgments
The authors express their gratitude to Dr. Steve Edgley and Prof. Ole
Paulsen, (Dept of Physiology, Development and Neuroscience, Cambridge
University) and to Mr. Patrick Dylan Rich (Janelia Farm Research
Campus) for insightful discussions and helpful comments on the manuscript
and to Dr. Wei Xu (Dept of Physiology, Development and Neuroscience,
Cambridge University) for practical assistance during some experiments.
Author Contributions
Conceived and designed the experiments: TH. Performed the experiments:
TH. Analyzed the data: TH HJ. Contributed reagents/materials/analysis
tools: TH HJ. Wrote the paper: TH.
Metronome Mossy Fibres
PLoS ONE | www.plosone.org 12 October 2011 | Volume 6 | Issue 10 | e26503

References
1. Buzsaki G (2006) Rhythms of the brain. Oxford University Press US, 466 p.
2. Buzsaki G, Draguhn A (2004) Neuronal Oscillations in Cortical Networks.
Science 304: 1926–1929. doi:10.1126/science.1099745.
3. Singer W (1999) Neuronal Synchrony: A Versatile Code Review for the
Definition of Relations? Neuron 24: 49–65.
4. Brown P, Marsden C (1998) What do the basal ganglia do? The Lancet 351:
1801–1804. doi:10.1016/S0140-6736(97)11225-9.
5. Uhlhaas PJ, Singer W (2010) Abnormal neural oscillations and synchrony in
schizophrenia. Nat Rev Neurosci 11: 100–113. doi:10.1038/nrn2774.
6. Hajos N, Paulsen O (2009) Network mechanisms of gamma oscillations in the
CA3 region of the hippocampus. Neural Netw 22: 1113–1119. doi:10.1016/
j.neunet.2009.07.024.
7. Sejnowski TJ, Paulsen O (2006) Network Oscillations: Emerging Computational
Principles. J Neurosci 26: 1673–1676. doi:10.1523/JNEUROSCI.3737-
05d.2006.
8. Welsh JP, Lang EJ, Suglhara I, Llinas R (1995) Dynamic organization of motor
control within the olivocerebellar system. Nature 374: 453–457. doi:10.1038/
374453a0.
9. Llinas RR (2009) Inferior olive oscillation as the temporal basis for motricity and
oscillatory reset as the basis for motor error correction. Neuroscience 162:
797–804. doi:10.1016/j.neuroscience.2009.04.045.
10. Hutcheon B, Yarom Y (2000) Resonance, oscillation and the intrinsic frequency
preferences of neurons. Trends in Neurosciences 23: 216–222.
11. Solinas S, Forti L, Cesana E, Mapelli J, De Schutter E, et al. (2007) Fast-Reset of
Pacemaking and Theta-Frequency Resonance Patterns in Cerebellar Golgi
Cells: Simulations of their Impact In Vivo. Front Cell Neurosci 1: doi:10.3389/
neuro.03.004.2007.
12. D’Angelo E, Nieus T, Maffei A, Armano S, Rossi P, et al. (2001) Theta-
Frequency Bursting and Resonance in Cerebellar Granule Cells: Experimental
Evidence and Modeling of a Slow K+-Dependent Mechanism. J Neurosci 21:
759–770.
13. Dugue GP, Brunel N, Hakim V, Schwartz E, Chat M, et al. (2009) Electrical
Coupling Mediates Tunable Low-Frequency Oscillations and Resonance in
the Cerebellar Golgi Cell Network. Neuron 61: 126–139. doi:10.1016/j.
neuron.2008.11.028.
14. Softky WR (1995) Simple codes versus efficient codes. Curr Opin Neurobiol 5:
239–247.
15. Leznik E, Makarenko V, Llinas R (2002) Electrotonically Mediated Oscillatory
Patterns in Neuronal Ensembles: An In Vitro Voltage-Dependent Dye-Imaging
Study in the Inferior Olive. J Neurosci 22: 2804–2815. doi:20026262.
16. Kanichay RT, Silver RA (2008) Synaptic and Cellular Properties of the
Feedforward Inhibitory Circuit within the Input Layer of the Cerebellar Cortex.
J Neurosci 28: 8955–8967. doi:10.1523/JNEUROSCI.5469-07.2008.
17. Cobb SR, Buhl EH, Halasy K, Paulsen O, Somogyi P (1995) Synchronization of
neuronal activity in hippocampus by individual GABAergic interneurons.
Nature 378: 75–78. doi:10.1038/378075a0.
18. Bevan MD, Magill PJ, Hallworth NE, Bolam JP, Wilson CJ (2002) Regulation of
the timing and pattern of action potential generation in rat subthalamic neurons
in vitro by GABA-A IPSPs. Journal of neurophysiology 87: 1348.
19. Stanford IM (2003) Independent Neuronal Oscillators of the Rat Globus
Pallidus. J Neurophysiol 89: 1713–1717. doi:10.1152/jn.00864.2002.
20. Samengo I, Montemurro MA (2010) Conversion of Phase Information into a
Spike-Count Code by Bursting Neurons. PLoS ONE 5: e9669. doi:10.1371/
journal.pone.0009669.
21. Mathy A, Ho SSN, Davie JT, Duguid IC, Clark BA, et al. (2009) Encoding of
Oscillations by Axonal Bursts in Inferior Olive Neurons. Neuron 62: 388–399.
doi:10.1016/j.neuron.2009.03.023.
22. Masquelier T, Hugues E, Deco G, Thorpe SJ (2009) Oscillations, Phase-of-
Firing Coding, and Spike Timing-Dependent Plasticity: An Efficient Learning
Scheme. J Neurosci 29: 13484–13493. doi:10.1523/JNEUROSCI.2207-
09.2009.
23. Kwag J, Paulsen O (2009) The timing of external input controls the sign of
plasticity at local synapses. Nat Neurosci 12: 1219–1221. doi:10.1038/nn.2388.
24. Salinas E, Sejnowski TJ (2000) Impact of Correlated Synaptic Input on Output
Firing Rate and Variability in Simple Neuronal Models. J Neurosci 20:
6193–6209.
25. Jorntell H, Ekerot CF (2006) Properties of Somatosensory Synaptic Integration
in Cerebellar Granule Cells In Vivo. J Neurosci 26: 11786–11797. doi:10.1523/
JNEUROSCI.2939-06.2006.
26. Bengtsson F, Jorntell H (2009) Sensory transmission in cerebellar granule cells
relies on similarly coded mossy fiber inputs. Proceedings of the National
Academy of Sciences 106: 2389–2394. doi:10.1073/pnas.0808428106.
27. Wu HS, Sugihara I, Shinoda Y (1999) Projection patterns of single mossy fibers
originating from the lateral reticular nucleus in the rat cerebellar cortex and
nuclei. J Comp Neurol 411: 97–118.
28. Holtzman T, Rajapaksa T, Mostofi A, Edgley SA (2006) Different responses of
rat cerebellar Purkinje cells and Golgi cells evoked by widespread convergent
sensory inputs. J Physiol 574: 491–507. doi:10.1113/jphysiol.2006.108282.
29. Paxinos G, Watson C (2004) The Rat Brain in Stereotaxic Coordinates - The
New Coronal Set. 5th ed. Academic Press 209 p.
30. Xu W, Edgley SA (2010) Cerebellar Golgi cells in the rat receive convergent
peripheral inputs via a lateral reticular nucleus relay. European Journal of
Neuroscience 32: 591–597. doi:10.1111/j.1460-9568.2010.07307.x.
31. Botev ZI (2006) A Novel Nonparametric Density Estimator. Available:http://
espace.library.uq.edu.au/view.php?pid = UQ:12535. Accessed 3 August 2010.
32. Fries P, Reynolds JH, Rorie AE, Desimone R (2001) Modulation of Oscillatory
Neuronal Synchronization by Selective Visual Attention. Science 291:
1560–1563. doi:10.1126/science.1055465.
33. Aertsen AM, Gerstein GL, Habib MK, Palm G (1989) Dynamics of neuronal
firing correlation: modulation of‘‘ effective connectivity.’’ Journal of Neuro-
physiology 61: 900.
34. Xu W, Edgley SA (2008) Climbing fibre-dependent changes in Golgi cell
responses to peripheral stimulation. J Physiol (Lond) 586: 4951–4959.
doi:10.1113/jphysiol.2008.160879.
35. Prsa M, Dash S, Catz N, Dicke PW, Thier P (2009) Characteristics of responses
of Golgi cells and mossy fibers to eye saccades and saccadic adaptation recorded
from the posterior vermis of the cerebellum. J Neurosci 29: 250–262.
doi:10.1523/JNEUROSCI.4791-08.2009.
36. van Kan PL, Gibson AR, Houk JC (1993) Movement-related inputs to
intermediate cerebellum of the monkey. J Neurophysiol 69: 74–94.
37. Garwicz M, Jorntell H, Ekerot CF (1998) Cutaneous receptive fields and
topography of mossy fibres and climbing fibres projecting to cat cerebellar C3
zone. J Physiol (Lond) 512(Pt 1): 277–293.
38. Holtzman T, Sivam V, Zhao T, Frey O, Dow van der Wal P, et al. (2011)
Multiple extra-synaptic spillover mechanisms regulate prolonged activity in
cerebellar Golgi cell - granule cell loops. J Physiol, Available:http://www.ncbi.
nlm.nih.gov/pubmed/21669981. Accessed 2011 Jul 25.
39. Holt GR, Softky WR, Koch C, Douglas RJ (1996) Comparison of discharge
variability in vitro and in vivo in cat visual cortex neurons. Journal of
Neurophysiology 75: 1806–1814.
40. Shin S-L, Hoebeek FE, Schonewille M, De Zeeuw CI, Aertsen A, et al. (2007)
Regular Patterns in Cerebellar Purkinje Cell Simple Spike Trains. PLoS ONE 2:
doi:10.1371/journal.pone.0000485.
41. Heine SA, Highstein SM, Blazquez PM (2010) Golgi Cells Operate as State-
Specific Temporal Filters at the Input Stage of the Cerebellar Cortex. J Neurosci
30: 17004–17014. doi:10.1523/JNEUROSCI.3513-10.2010.
42. Logothetis NK (2003) The Underpinnings of the BOLD Functional Magnetic
Resonance Imaging Signal. J Neurosci 23: 3963–3971.
43. Katzner S, Nauhaus I, Benucci A, Bonin V, Ringach DL, et al. (2009) Local
Origin of Field Potentials in Visual Cortex. Neuron 61: 35–41. doi:10.1016/
j.neuron.2008.11.016.
44. Kamondi A, Acsady L, Wang X-J, Buzsaki G (1998) Theta oscillations in somata
and dendrites of hippocampal pyramidal cells in vivo: Activity-dependent phase-
precession of action potentials. Hippocampus 8: 244–261. doi:10.1002/
(SICI)1098-1063(1998)8:3,244::AID-HIPO7.3.0.CO;2-J.
45. Buzsaki G, Bickford R, Ponomareff G, Thal L, Mandel R, et al. (1988) Nucleus
basalis and thalamic control of neocortical activity in the freely moving rat.
J Neurosci 8: 4007–4026.
46. Jin J, Wang Y, Swadlow HA, Alonso JM (2011) Population receptive fields of
ON and OFF thalamic inputs to an orientation column in visual cortex. Nat
Neurosci 14: 232–238. doi:10.1038/nn.2729.
47. Marino J, Martinez L, Canedo A (1996) Coupled slow and delta oscillations
between cuneothalamic and thalamocortical neurons in the chloralose
anesthetized cat. Neurosci Lett 219: 107–110.
48. Amzica F, Neckelmann D, Steriade M (1997) Instrumental Conditioning of Fast
(20- to 50-Hz) Oscillations in Corticothalamic Networks. Proceedings of the
National Academy of Sciences of the United States of America 94: 1985–1989.
49. Bruno RM, Khatri V, Land PW, Simons DJ (2003) Thalamocortical angular
tuning domains within individual barrels of rat somatosensory cortex. J Neurosci
23: 9565–9574.
50. Vinogradova OS, Kitchigina VF, Zenchenko CI (1998) Pacemaker neurons of
the forebrain medical septal area and theta rhythm of the hippocampus. Membr
Cell Biol 11: 715–725.
51. Ekerot CF (1990) The lateral reticular nucleus in the cat. VI. Excitatory and
inhibitory afferent paths. Exp Brain Res 79: 109–119.
52. Ekerot CF (1990) The lateral reticular nucleus in the cat. VIII. Excitatory and
inhibitory projection from the bilateral ventral flexor reflex tract (bVFRT). Exp
Brain Res 79: 129–137.
53. Gutkin BS, Ermentrout GB, Reyes AD (2005) Phase-response curves give the
responses of neurons to transient inputs. J Neurophysiol 94: 1623–1635.
doi:10.1152/jn.00359.2004.
54. Kwag J, Paulsen O (2009) Bidirectional control of spike timing by GABAA
receptor-mediated inhibition during theta oscillation in CA1 pyramidal neurons.
Neuroreport 20: 1209–1213.
55. Garabedian CE, Jones SR, Merzenich MM, Dale A, Moore CI (2003) Band-
Pass Response Properties of Rat SI Neurons. J Neurophysiol 90: 1379–1391.
doi:10.1152/jn.01158.2002.
56. Makarov VA, Pavlov AN, Tupitsyn AN, Panetsos F, Moreno A (2010) Stability
of neural firing in the trigeminal nuclei under mechanical whisker stimulation.
Comput Intell Neurosci: 340541. doi:10.1155/2010/340541.
Metronome Mossy Fibres
PLoS ONE | www.plosone.org 13 October 2011 | Volume 6 | Issue 10 | e26503

57. Rinzel J, Ermentrout GB (1989) Analysis of neural excitability and oscillations.
In: Methods in Neuronal Modeling: From Synapses to Networks C. Koch, I.Segev, eds. Cambridge MA.: MIT Press. pp 135–169.
58. Tateno T, Robinson HPC (2007) Phase Resetting Curves and Oscillatory
Stability in Interneurons of Rat Somatosensory Cortex. Biophys J 92: 683–695.doi:10.1529/biophysj.106.088021.
59. Phoka E, Cuntz H, Roth A, Hausser M (2010) A New Approach forDetermining Phase Response Curves Reveals that Purkinje Cells Can Act as
Perfect Integrators. PLoS Comput Biol 6: doi:10.1371/journal.pcbi.1000768.
60. Mann EO, Paulsen O (2007) Role of GABAergic inhibition in hippocampalnetwork oscillations. Trends Neurosci 30: 343–349. doi:10.1016/j.tins.2007.05.003.
61. Hasenstaub A, Shu Y, Haider B, Kraushaar U, Duque A, et al. (2005) Inhibitorypostsynaptic potentials carry synchronized frequency information in active
cortical networks. Neuron 47: 423–435. doi:10.1016/j.neuron.2005.06.016.62. Medina JF, Mauk MD (2000) Computer simulation of cerebellar information
processing. Nat Neurosci 3: 1205–1211.
63. Stiefel KM, Fellous JM, Thomas PJ, Sejnowski TJ (2010) Intrinsic subthresholdoscillations extend the influence of inhibitory synaptic inputs on cortical
pyramidal neurons. European Journal of Neuroscience 31: 1019–1026.64. Izhikevich EM (2001) Resonate-and-fire neurons. Neural networks 14: 883–894.
65. Elisabetta Cesana LF, Mapelli J, D’Angelo E (2006) Ionic mechanisms of
autorhythmic firing in rat cerebellar Golgi cells. J Physiol 574: 711–729.doi:10.1113/jphysiol.2006.110858.
66. Solinas S, Forti L, Cesana E, Mapelli J, De Schutter E, et al. (2007) ComputationalReconstruction of Pacemaking and Intrinsic Electroresponsiveness in Cerebellar
Golgi Cells. Front Cell Neurosci 1: doi:10.3389/neuro.03.002.2007.67. Galan RF, Fourcaud-Trocme N, Ermentrout GB, Urban NN (2006)
Correlation-Induced Synchronization of Oscillations in Olfactory Bulb Neurons.
J Neurosci 26: 3646–3655. doi:10.1523/JNEUROSCI.4605-05.2006.68. Abouzeid A, Ermentrout B (2009) Type-II phase resetting curve is optimal for
stochastic synchrony. Phys Rev E 80: Available:http://link.aps.org/doi/10.1103/PhysRevE.80.011911.
69. Carvell G, Simons D (1990) Biometric analyses of vibrissal tactile discrimination
in the rat. J Neurosci 10: 2638–2648.70. Weijnen JA (1998) Licking behavior in the rat: measurement and situational
control of licking frequency. Neurosci Biobehav Rev 22: 751–760.71. Wesson DW, Verhagen JV, Wachowiak M (2009) Why sniff fast? The
relationship between sniff frequency, odor discrimination, and receptor neuronactivation in the rat. J Neurophysiol 101: 1089–1102. doi:10.1152/
jn.90981.2008.
72. Berridge KC, Fentress JC, Parr H (1987) Natural syntax rules control action
sequence of rats. Behavioural Brain Research 23: 59–68. doi:10.1016/0166-4328(87)90242-7.
73. Ezure K, Tanaka I (1997) Convergence of central respiratory and locomotor
rhythms onto single neurons of the lateral reticular nucleus. Exp Brain Res 113:230–242.
74. Sosnik R, Haidarliu S, Ahissar E (2001) Temporal Frequency of WhiskerMovement. I. Representations in Brain Stem and Thalamus. J Neurophysiol 86:
339–353.
75. Vreeswijk C, Abbott LF, Bard Ermentrout G (1994) When inhibition notexcitation synchronizes neural firing. Journal of Computational Neuroscience 1:
313–321.76. D’Angelo E, Rossi P, Gall D, Prestori F, Nieus T, et al. (2005) Long-term
potentiation of synaptic transmission at the mossy fiber-granule cell relay ofcerebellum. Prog Brain Res 148: 69–80. doi:10.1016/S0079-6123(04)48007-8.
77. Saarinen A, Linne M-L, Yli-Harja O (2008) Stochastic differential equation
model for cerebellar granule cell excitability. PLoS Comput Biol 4: e1000004.doi:10.1371/journal.pcbi.1000004.
78. Mapelli J, D’Angelo E (2007) The Spatial Organization of Long-Term SynapticPlasticity at the Input Stage of Cerebellum. J Neurosci 27: 1285–1296.
doi:10.1523/JNEUROSCI.4873-06.2007.
79. van Kan PL, Gibson AR, Houk JC (1993) Movement-related inputs tointermediate cerebellum of the monkey. J Neurophysiol 69: 74–94.
80. Rancz EA, Ishikawa T, Duguid I, Chadderton P, Mahon S, et al. (2007) High-fidelity transmission of sensory information by single cerebellar mossy fibre
boutons. Nature 450: 1245–1248. doi:10.1038/nature05995.81. Eccles JC, Faber DS, Murphy JT, Sabah NH, Taborıkova H (1971) Afferent
volleys in limb nerves influencing impulse discharges in cerebellar cortex. I. In
mossy fibers and granule cells. Exp Brain Res 13: 15–35.82. Chadderton P, Margrie TW, Hausser M (2004) Integration of quanta in
cerebellar granule cells during sensory processing. Nature 428: 856–860.doi:10.1038/nature02442.
83. Hartmann MJ, Bower JM (1998) Oscillatory Activity in the Cerebellar
Hemispheres of Unrestrained Rats. J Neurophysiol 80: 1598–1604.84. Courtemanche R, Pellerin J-P, Lamarre Y (2002) Local field potential
oscillations in primate cerebellar cortex: modulation during active and passiveexpectancy. J Neurophysiol 88: 771–782.
85. Wikgren J, Nokia MS, Penttonen M (2010) Hippocampo-cerebellar theta bandphase synchrony in rabbits. Neuroscience 165: 1538–1545. doi:10.1016/
j.neuroscience.2009.11.044.
Metronome Mossy Fibres
PLoS ONE | www.plosone.org 14 October 2011 | Volume 6 | Issue 10 | e26503