sensory evaluation of poultry meat: a comparative survey
TRANSCRIPT
RESEARCH ARTICLE
Sensory evaluation of poultry meat: A
comparative survey of results from normal
sighted and blind people
Krzysztof DamaziakID1*, Adrian Stelmasiak2, Julia Riedel1, Żaneta Zdanowska-Sąsiadek3,
Mateusz Bucław4, Dariusz Gozdowski5, Monika Michalczuk1
1 Department of Animal Breeding and Production, Poultry Breeding Division, University of Life Sciences,
Warsaw, Poland, 2 Department of Technique and Food Development, Division of Engineering in Nutrition,
University of Life Sciences, Warsaw, Poland, 3 Department of Animal Improvement, Institute of Genetics and
Animal Breeding, Polish Academy of Sciences, Magdalenka, Poland, 4 Department of Poultry and
Ornamental Bird Breeding, Faculty of Biotechnology and Animal Husbandry, West Pomeranian University of
Technology, Szczecin, Poland, 5 Department of Experimental Design and Bioinformatics, University of Life
Sciences, Warsaw, Poland
Abstract
Visual assessment is one of the key criteria in the sensory evaluation of foods. The appear-
ance of food products may affect their perception by other senses, sometimes giving a false
picture of their quality. A true assessment of such sensory attributes as aroma, taste, tender-
ness, and juiciness, which are components of the overall liking of food, without the use of
instrumental methods is feasible only by blind people. We have advanced a hypothesis that
blindness may modify the impressions perceived through other senses used in food evalua-
tion. To confirm this hypothesis, a sensory testing of cooked breast and leg meat from vari-
ous poultry species was conducted by normal sighted and blind panelists aged from 18 to
26 years. It has been demonstrated that the lack of sight is compensated by other senses,
the intensified perception of which enables a more precise sensory evaluation of food in
terms of such parameters as the aroma, tenderness and juiciness. Thus, blind people can
be recommended as panelists evaluating the sensory profile of food products. Scores given
by the sensory panel allowed the conclusion that the most desirable poultry meat was BM of
broiler chicken and capon, followed by Guinea fowl. Lower scores were given by the panel-
ists to meat of water fowl (goose, duck), whereas the lowest ones were assigned to cooked
ostrich meat.
Introduction
Until recently, one of the most important criteria for food choice was its price. However,
increased nutritional awareness by consumers, especially in developing countries, has made
quality a new driving force behind purchase decisions. The concept of quality encompasses a
multitude of headwords, the most common of which being: methods of food acquisition/pro-
duction, health safety of food, its nutritive value, and sensory properties. The latter factors–
PLOS ONE | https://doi.org/10.1371/journal.pone.0210722 January 30, 2019 1 / 24
a1111111111
a1111111111
a1111111111
a1111111111
a1111111111
OPEN ACCESS
Citation: Damaziak K, Stelmasiak A, Riedel J,
Zdanowska-Sąsiadek Ż, Bucław M, Gozdowski D,
et al. (2019) Sensory evaluation of poultry meat: A
comparative survey of results from normal sighted
and blind people. PLoS ONE 14(1): e0210722.
https://doi.org/10.1371/journal.pone.0210722
Editor: Arda Yildirim, Tokat Gaziosmanpasa
University, TURKEY
Received: July 10, 2018
Accepted: December 31, 2018
Published: January 30, 2019
Copyright: © 2019 Damaziak et al. This is an open
access article distributed under the terms of the
Creative Commons Attribution License, which
permits unrestricted use, distribution, and
reproduction in any medium, provided the original
author and source are credited.
Data Availability Statement: All relevant data are
within the paper and its Supporting Information
files.
Funding: The author received no specific funding
for this work. The research leading to these results
was only funded by Warsaw University of Life
Science: Faculty of Animal Science and Faculty of
Human Nutrition and Consumer Sciences.
Competing interests: The authors have declared
that no competing interests exist.
despite being regarded as the most important quality traits of food products–are the most diffi-
cult to measure and the most subjective. Of course, there are several analytical and instrumen-
tal methods employed for food product assessment, including microbiological procedures,
instrumental analyses of tenderness, springiness, color, taste, and other traits of the widely
understood food quality. Unfortunately, many food products differing in sensory attributes
may achieve identical scores when assessed with these traditional methods. Therefore, sensory
evaluation based on direct impressions remains a reference method and an invaluable mea-
surement tool in food quality assessment [1].
In simple words, sensory evaluation may be described as a scientific discipline which mea-
sures the properties of a product with the use of human senses [2]. A normal person uses five
senses (sight, smell, hearing, taste, and touch) and engages all of these in different ways and
with various intensities to establish the quality of food products [3]. Taste is the strongest crea-
tor of human sensations concerning food, especially given that humans may discriminate 5
types (sweet, sour, salty, bitter, and umami) at up to 30 intensity levels [4]. However, it has
been demonstrated several times that it is sight which is the driving force shaping our assess-
ment of food products and which often modifies the impressions perceived through other
senses [5,6,7]. It was as early as in 1936 that Apicius coined the phrase “We eat first with oureyes” [8]. Ever since, successive developments in medical knowledge in the field of neurology,
anatomy, and physiology have proved this saying right [9,10,11,12]. Today, an extension of
knowledge concerning human perception of food quality through senses other than taste
seems to be more important than ever. This results from the rapid advance in various culinary
techniques and technologies, advertisements for food products as well as the increased popu-
larity of many Celebrity ‘chefs’ observed in the last 50 years. Owing to the use of specialized
TV, graphical tools, and photoshopping or using eye-catching kitchenware, the media present
foods in a completely unrealistic light [13]. Food depicted in this way, regardless of its quality,
arouses strong desirability in the viewer. Increasingly often this way of food advertising is pejo-
ratively called ‘gastroporn’ or ‘food porn’ [5]. Negative outcomes of such marketing include,
among other things, the growing incidence of obesity, especially in children and adolescents,
and problems with hypertension and other diet-related diseases [14].
The awareness that food does not always taste as good as it looks encourages the search for
an explicit answer to the question of whether sight may indeed modify the perception of
impressions offered by other senses in such a way that the same food product will be differently
evaluated by various persons. The key to this answer is finding an appropriate group of panel-
ists who, when evaluating a food product, would not rely on their sight. Obviously, the simplest
way would be to blindfold the eyes of panelists, but we still need to bear in mind the so-called
“visual memory” [15]. Consequently, testing with the same persons–once blindfolded and
once with uncovered eyes–could give false results. The only group of panelists without a
“visual memory” and who pay no attention to the appearance of a food product during assess-
ment are persons completely blind from birth. A sensory assessment conducted by the blind
may also be less subjective for other reasons. One of these is the fact that “blindness may lead
to a compensatory sharpening of the other senses” [16]. In addition, the blind-from-birth may
have various perception capabilities, which to some extent compensate for their blindness
[17,18].
Poultry meat was selected for our study out of the immense variety of food products based
on the growing contribution of poultry products in diets of both developing and developed
populations [19]. Unlike beef and pork, poultry meat is additionally not subject to religious
restrictions [20]. Consumers perceive it as healthy and with a high nutritional value, owing to
which it is regularly consumed by most consumers, except for those who do not eat meat. The
high level of consumption of poultry products also results from their relatively low price, ease
Poultry meat sensory analysis by sighted and blind people
PLOS ONE | https://doi.org/10.1371/journal.pone.0210722 January 30, 2019 2 / 24

to prepare, and flavor. Compared to meat of other livestock, another factor for poultry meat is
that it is available in quite a wide range of forms. Starting from the diversity of commonly avail-
able species of domesticated fowl, consumers may choose between breast muscles and leg mus-
cles as well as between white breast meat of the gallinaceous birds (e.g., chicken, turkey) and the
red meat including leg muscles of all species and breast muscles of water fowl (duck, goose).
To date, no meat sensory quality tests have been conducted with the participation of blind
persons, thus the objective of this study was to verify whether blind persons may evaluate the
same food products differently than normal sighted consumers, and if so how big the differ-
ence can be. Thus, we have constructed a hypothesis, where blind persons compared with
sighted persons would use the remaining senses with higher intensity. We suspect, that in the
situations where evaluation of a given product will differ between both panelist groups, the
one declared by blind persons is more reliable—as it is not burdened with the overall appear-
ance, and thus it will solely concern sensory properties of a product, and not its visual presen-
tation, which can be easily falsified to manipulate the purchasing intention of a consumer. In
addition, we expect that thanks to the method used (participation of blind people) the study
results will provide will provide an answer to the question of which of the offered range of
poultry meat is the best in terms of the evaluated attributes. The study will also enable the dem-
onstration of whether consumer preferences concerning exclusively sensory impressions are
consistent with purchasing preferences on the market which are connected with economic fac-
tors such as price or convenience of preparation for consumption.
Materials and methods
All sighted participants signed informed consent prior to taking part in the study. All blind
participants gave an oral consent, which was signed by a formal guardian–Director of the
Elżbieta Roża Czacka Society for the Care of the Blind in Laski (PL). Data obtained within the
study have been protected in accordance with the Security Policy assumed at the SGGW- Reg-
ulation of His Magnificence Rector No. 88/2013 of 3 December 2013. The study was approved
by the Warsaw University of Life Sciences Ethics Committee for Scientific Research with Par-
ticipation of People.
Panelists
Two groups of panelists participated in the study. The first group was composed of 132 normal
sighted persons, including 83 men and 49 women aged from 19 to 23 years (SD; M = 1.4,
W = 1.6). They were recruited at random from among students of Warsaw University of Life
Sciences (PL) via e-mail or leaflets. Among all those who volunteered, only those were selected
who declared that their senses of taste and smell were not debilitated as a result of disease, who
declared they consumed poultry meat at least once a week, and who were not allergic to any
component of food products of animal origin. The second group was composed of 103 persons
completely blind from birth, including 58 men and 45 women aged from 18 to 26 years (SD;
M = 2.6, W = 3.0). They were selected from among charges of the Elżbieta Roża Czacka Society
for the Care of the Blind in Laski (PL), according to the same criteria as the sighted panelists.
In addition, only those persons were selected whose blindness was a congenital defect not cor-
related with any other sensory disorders. All blind persons spent 5 days a week in the Elżbieta
Roża Czacka Society where they were nourished (breakfast, dinner, supper) in the canteen
with a balanced diet consisting of meat (including poultry), vegetables, dairy products, bread
and fruit. All blind persons returned home for two days a week, where their nutrition was
largely determined by their caregivers. Thus, the diet of the blind people was considerably less
varied in comparison to sighted people, who determined what and when to eat on their own.
Poultry meat sensory analysis by sighted and blind people
PLOS ONE | https://doi.org/10.1371/journal.pone.0210722 January 30, 2019 3 / 24

None of the panelists declared food neophobia. One of the blind persons, who demonstrated
fear of consuming an unknown type of meat was released from participation in the study. The
panelists were not identified and grouped in terms of eating habits and the frequency of con-
suming poultry meat. All panelists were of Polish nationality–i.e. Slavs. During the entire
experiment, statistical analyses were performed for the scores given only by those persons who
were involved in both sessions of assessment (see point 2.3). Experimental procedures and
study objectives were explained in detail to all participants and also to their carers, especially
the staff of The Society for the Care of the Blind. This was performed during a training orga-
nized before the experiment, so that they could join the study being fully aware of its goals.
The panelists were trained according to Polish guidelines [21,22]. They were informed that the
object of the study was poultry meat, but did not know the species of birds or the type of meat
(muscle) being evaluated.
Meat characteristics
Before the study, experimental material was collected in the form of whole carcasses of the fol-
lowing birds: broiler chickens, turkeys, barbarie ducks (Muscovy), capons (surgically castrated
and specially fattened young rooster.), guinea fowls, goose, as well as leg muscles from ostrich.
Fresh carcasses were purchased in a supermarket belonging to a popular retail network,
whereas ostrich meat was acquired directly from the producer (S1 Fig). The carcasses and
ostrich meat were packed in VSP packages (99% vacuum is equal to 1.3 KPa) (EDESSA–
Spain), and then frozen at a temperature of −22˚C until analyzed.
Meat preparation for sensory study
Two sessions of assessment were conducted with each group of panelists, at 7 d intervals: the
first one concerned breast muscles (Pectoralis superficialis; BM), and the second concerned leg
muscles (Ilio tibiali; LM) (S1 Fig). Because ostrich meat intended for culinary purposes
includes mainly leg muscles, 6 types of meat were assessed in the first session and 7 types of
meat in the second session. Meat was defrosted at a temperature of 0±2˚C in a KUPERSBUCH
cold store for 24 h. Afterwards, whole muscles were subjected to heat treatment with the Sous–
vide method in a circulator (Lotus, 2016, Treviso, Italy). Breast muscles without skin and inter-
nal fat were formatted and unified to the weight of 400±15 g. Next, they were vacuum-packed
using an EDDESA apparatus (VAC-20SL 2A, 2014, Barcelona, Spain) into PP polypropylene
bags and immersed in a water bath at 75˚C in a circulator under cover (S1 Fig). The heat treat-
ment lasted 40–75 min until the temperature of 72˚C was reached in the geometric center of
the product. After completed heat treatment, meat samples were collected out from packages.
Meat juice for cooking yield (CL) determination was decanted to gastro norm (GN) contain-
ers, individually for each species. The heat-treated muscles were cut crosswise into representa-
tive samples weighing 15±5 g and placed in their own juice (CL) in GN containers under
cover. The containers with meat were placed into bain-maries (water temperature of 60˚C).
The samples were served immediately after being collected out from the bain-maries (S2 Fig).
Consumer testing
Consumer testing was conducted at the laboratory of the Division of Engineering in Nutrition,
Faculty of Human Nutrition and Consumer Sciences of Warsaw University of Life Sciences,
equipped with individual stations. Throughout the tests, a temperature of 22˚C (±0.5˚C) was
maintained in the whole laboratory by a controlled air-conditioning system. Incandescent
lighting reached ca. 500 lx [23]. Five persons simultaneously conducted the testing; however,
each blind person was accompanied by their carer.
Poultry meat sensory analysis by sighted and blind people
PLOS ONE | https://doi.org/10.1371/journal.pone.0210722 January 30, 2019 4 / 24

Directly before the testing, each station was equipped with a white plastic tray onto which 6
white carton trays and white plastic forks were placed in the first session and 7 white cartoon
trays and white plastic forks in the second session (Dart Container, Co). The trays were
marked with a three-digit code, with the last digit indicating a specific sample: 1.–broiler
chicken, 2.–turkey, 3.–barbarie duck, 4.–capon, 5.–guinea fowl, 6.–goose, and 7.–ostrich. The
samples were always served for the assessment in the same order. After assessment of each
sample, the panelists neutralized its taste with a sip of bitter, slightly cooled tea and a bite from
a wheat roll. The sighted persons were given pens and evaluation sheets for systematic comple-
tion during testing. The blind people received the same sheets which were completed by their
carers, together with sheets in Braille (Mountbatten Brailler Whisperer Plus) (S3 Fig). Each
sheet contained brief instructions on how it had to be completed and a short definition of each
attribute. The following attributes were assessed in each sample: meat color (only sighted–
color perceived between whitish and yellowish for BM and between light and dark red for
LM), aroma (smell associated with cooked meat), taste (taste associated with cooked meat),
tenderness (fibers perceived during mastication), juiciness (water perceived during mastica-
tion), and overall liking (overall satisfaction and desire to eat again). The assessment was per-
formed based on a modified five-point hedonic scale (1 = dislike extremely, 3 = neither like
nor dislike, and 5 = like extremely; [24]).
Statistical analysis
Mean values and standard deviations (SD) were calculated for each attribute. Comparisons of
means for each variable between sighted and blind people were conducted using a Mann–
Whitney U test [25]. Means for various types of meat (species) within each group of people
were compared using Duncan’s multiple range test at 0.05 or 0.01 probability level [25]. Multi-
variate comparisons between scores given by the sighted and blind people were conducted
using MANOVA [25]. It allows evaluating statistical significance between the sighted and
blind people according to groups of traits. Multiple regression and analysis of correlations
were applied for evaluation of relationships between all examined attributes and poultry meat
overall appreciation. Following the regression model was used for the analyses:
yi ¼ b0þ b1� 1þ b2� 2þ . . .þ bk� kþ ei
where: y is dependent variable, x1, x2, xk are independent variables, b0 is intercept, b1, b2, bk,
are partial regression coefficients, ei is error term.
The results were presented as standardized regression coefficients. In addition, evaluation
of multivariate differences of the analyzed meat sensory attributes was conducted with cluster
analysis. The square of Euclidian distance was adopted as a measure of distance for standard-
ized data, and grouping of objects was conducted with the Ward’s method [25]. Results were
depicted in the form of dendrograms. Analyses were performed using Statistica 12 software
[26].
Results
Poultry meat color evaluated by the sighted panelists
Results obtained in the study indicate different consumer preferences regarding the color of
poultry meat species and muscle types (Fig 1, S1 Table). For both types of muscles, the highest
scores were given by panelists to those of capon and broiler chickens; while negligibly better
scores were noted for capon BM color (P = 0.078) and for broiler LM color (P = 0.062). For
BM, the lowest scores (P< 0.05) were given to red meat from water fowl (duck and goose).
Poultry meat sensory analysis by sighted and blind people
PLOS ONE | https://doi.org/10.1371/journal.pone.0210722 January 30, 2019 5 / 24

Red LM received lower scores in color assessments compared to white BM, but still when com-
paring only red LM all species were scored similarly (P> 0.05), except for capon and broiler
chicken.
Poultry meat smell evaluated by the sighted and blind panelists
The sighted consumers assessed capon BM as having the best aroma (all BM P> 0.05) (Fig 2,
S2 Table). For LM, the observed difference was significant only when compared to the lowest
Fig 1. Poultry meat color based on the evaluation by the sighted panelists.
https://doi.org/10.1371/journal.pone.0210722.g001
Poultry meat sensory analysis by sighted and blind people
PLOS ONE | https://doi.org/10.1371/journal.pone.0210722 January 30, 2019 6 / 24

scored LM from turkey and ostrich (both P> 0.05). In blind panelist’s opinion, the aroma of
both BM and LM from all analyzed poultry species were similar (all meats P< 0.05). The only
difference between the sighted and the blind panelists was in the perception of goose BM
aroma, which was scored significantly higher by the blind persons compared to the sighted
ones (P = 0.048). Considering scores given to aroma of all meat species collected together, the
multi-way analysis of variance demonstrated significant differences in the assessment of the
sighted and the blind panelists for both BM (P = 0.038) as well as LM (P = 0.002).
Fig 2. Poultry meat smell based on the evaluation by the sighted and blind panelists.
https://doi.org/10.1371/journal.pone.0210722.g002
Poultry meat sensory analysis by sighted and blind people
PLOS ONE | https://doi.org/10.1371/journal.pone.0210722 January 30, 2019 7 / 24
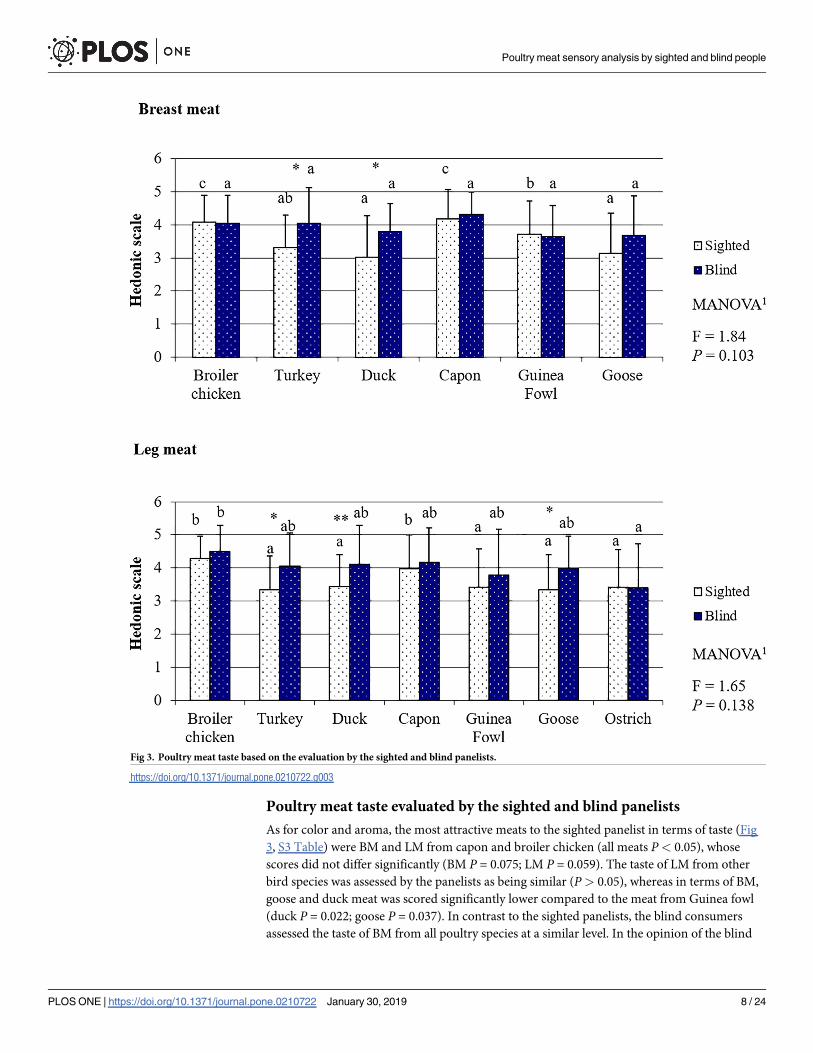
Poultry meat taste evaluated by the sighted and blind panelists
As for color and aroma, the most attractive meats to the sighted panelist in terms of taste (Fig
3, S3 Table) were BM and LM from capon and broiler chicken (all meats P< 0.05), whose
scores did not differ significantly (BM P = 0.075; LM P = 0.059). The taste of LM from other
bird species was assessed by the panelists as being similar (P> 0.05), whereas in terms of BM,
goose and duck meat was scored significantly lower compared to the meat from Guinea fowl
(duck P = 0.022; goose P = 0.037). In contrast to the sighted panelists, the blind consumers
assessed the taste of BM from all poultry species at a similar level. In the opinion of the blind
Fig 3. Poultry meat taste based on the evaluation by the sighted and blind panelists.
https://doi.org/10.1371/journal.pone.0210722.g003
Poultry meat sensory analysis by sighted and blind people
PLOS ONE | https://doi.org/10.1371/journal.pone.0210722 January 30, 2019 8 / 24

panelists, the least tasty LM were these from ostrich (all LMs P> 0.05) and Guinea fowl; how-
ever, Guinea fowl LM were assessed significantly worse only compared to the highest scored
broiler chicken meat (P = 0.037). The blind panelists gave significantly higher scores to the
taste of BM from turkey (P = 0.011) and goose (P = 0.028) and to the taste of LM from turkey
(P = 0.020), duck (P = 0.010), and goose (P = 0.031), compared to the scores of the sighted con-
sumers. Broiler chicken and capon meat, in taste assessment, was evaluated similarly by both
groups of panelists (P> 0.05). Despite the many individual differences in taste assessment
made for individual meat species within one group of panelists (Mann-Whitney U test) as well
as the differences between the sighted and the blind panelists, the multiway analysis of variance
demonstrated that the sighted and blind persons evaluated the taste of both BM (P = 0.103)
and LM (P = 0.138) at a similar level.
Poultry meat tenderness evaluated by the sighted and blind panelists
Both the sighted and blind panelists scored BM tenderness for the evaluated poultry species in
the same order (Fig 4, S4 Table), i.e. BM from capon and broiler chicken as the most tender
(both P< 0.05), followed by BM from Guinea fowl. The fourth in terms of tenderness turned
out to be turkey BM and the fifth–duck. The worst tenderness was found for goose BM; how-
ever, in the opinion of the sighted panelists it was comparable to duck BM tenderness
(P = 0.069), and for the blind respondents–comparable with the tenderness of BM from both
duck (P = 0.088) and turkey (P = 0.055). For LM, the highest scores were again given by the
sighted consumers to the muscles of capon and broiler chicken (both P< 0.05). In the assess-
ment of LM tenderness, the blind panelists distinguished meat from broiler chickens as the
best (all meats P> 0.05) and ostrich meat as the worst (all meats P> 0.05). Ostrich LM was
also the least tender in the assessment made by the sighted panelists, but it was rated equally
with LM from goose and duck. In contrast to the taste assessment in which the blind panelists
in most cases gave higher scores, meat tenderness usually received significantly lower scores
when evaluated by this group of consumers compared to the sighted panelists (Fig 4, S4
Table). The exception was ostrich LM, the tenderness of which was scored higher by the blind
than by the sighted panelists (P = 0.044). As a consequence, as for meat aroma, the multiway
analysis of variance demonstrated that persons with different visual capabilities compared to
the blind persons evaluated the tenderness of both BM (P = 0.001) and LM (P< 0.001) differ-
ently considering all poultry species taken together.
Poultry meat juiciness evaluated by the sighted and blind panelists
In the opinion of both groups of panelists, the juiciest BM were those from capon, followed by
those from broiler chicken (Fig 5). The third in terms of juiciness as perceived by the sighted
consumers were BM from Guinea fowl and then (with slightly worse scores) BM from turkey.
In turn, in the assessment of the blind panelists, turkey BM was placed third and almost the
same scores were given to duck BM. The lowest scores in BM juiciness evaluation were given
by both the sighted and blind panelists to goose, but the difference between juiciness of goose
BM and duck BM was insignificant when the muscles were assessed by the sighted consumers
(P = 0.064), whereas a significant difference was demonstrated between juiciness of goose BM
and capon BM in the assessment of the blind panelists (P = 0.021). For LM juiciness, the high-
est scores were given by the sighted panelists to meat from broiler chicken (P< 0.05), followed
by similarly scored meat from capon and Guinea fowl (both P = 0.091). The third in terms of
juiciness as evaluated by the sighted panelists were similarly scored LM from water fowl
(P = 0.033); however, the lower scored juiciness of goose LM was in the opinion of this group
of panelists comparable with juiciness of turkey LM (P = 0.068). The driest meat according to
Poultry meat sensory analysis by sighted and blind people
PLOS ONE | https://doi.org/10.1371/journal.pone.0210722 January 30, 2019 9 / 24

the sighted consumers was LM from ostrich, whose juiciness was evaluated as being similar to
that of turkey LM (P = 0.056). The blind consumers perceived ostrich LM as the driest. The
juiciness of BM was most often evaluated by the blind consumers significantly lower (Fig 5, S5
Table) than by the sighted panelists, likewise in the case of LM tenderness (Fig 4, S4 Table).
Consequently, the multi-way analysis of variance demonstrated that the sighted and blind pan-
elists evaluated BM juiciness differently (P< 0.001). Similar and significant results, although
less intensive, were demonstrated for LM (P = 0.042). However, the difference in LM juiciness
assessment occurred only for Guinea fowl LM which were scored significantly higher by the
blind panelists (P = 0.003).
Fig 4. Poultry meat tenderness based on the evaluation by the sighted and blind panelists.
https://doi.org/10.1371/journal.pone.0210722.g004
Poultry meat sensory analysis by sighted and blind people
PLOS ONE | https://doi.org/10.1371/journal.pone.0210722 January 30, 2019 10 / 24

Poultry meat overall liking evaluated by the sighted and blind panelists
In BM assessment by the sighted panelists, the best in terms of overall liking (Fig 6, S6 Table)
turned out to be meat from capon (all BMs P< 0.05), followed by broiler chicken and Guinea
fowl (both P> 0.05). The worst scores were given by these panelists to BM from turkey, goose,
and duck (all three P> 0.05). The blind consumers also assessed capon BM as the best in
terms of overall liking. For LM, the highest scores for overall liking were given by the sighted
Fig 5. Poultry meat juiciness based on the evaluation by the sighted and blind panelists.
https://doi.org/10.1371/journal.pone.0210722.g005
Poultry meat sensory analysis by sighted and blind people
PLOS ONE | https://doi.org/10.1371/journal.pone.0210722 January 30, 2019 11 / 24

panelists to muscles from broiler chicken and capon (all meats P< 0.05), whereas by the blind
panelists to muscles from broiler chicken, turkey, duck, and goose. The mean score given by
the blind consumers to broiler chicken LM (4.56) was also the highest score in the overall lik-
ing assessment in the whole study. Ostrich LM turned out to be the least acceptable in terms of
sensory quality by both the sighted and blind panelists. The sighted consumers gave equally
low scores to turkey LM and insignificantly higher scores to goose and duck LM (P = 0.088;
P = 0.064, respectively). Compared to the sighted panelists, the blind consumers gave signifi-
cantly higher scores in the overall liking assessment to both types of muscles from duck.
Fig 6. Poultry meat overall liking based on the evaluation by the sighted and blind panelists.
https://doi.org/10.1371/journal.pone.0210722.g006
Poultry meat sensory analysis by sighted and blind people
PLOS ONE | https://doi.org/10.1371/journal.pone.0210722 January 30, 2019 12 / 24
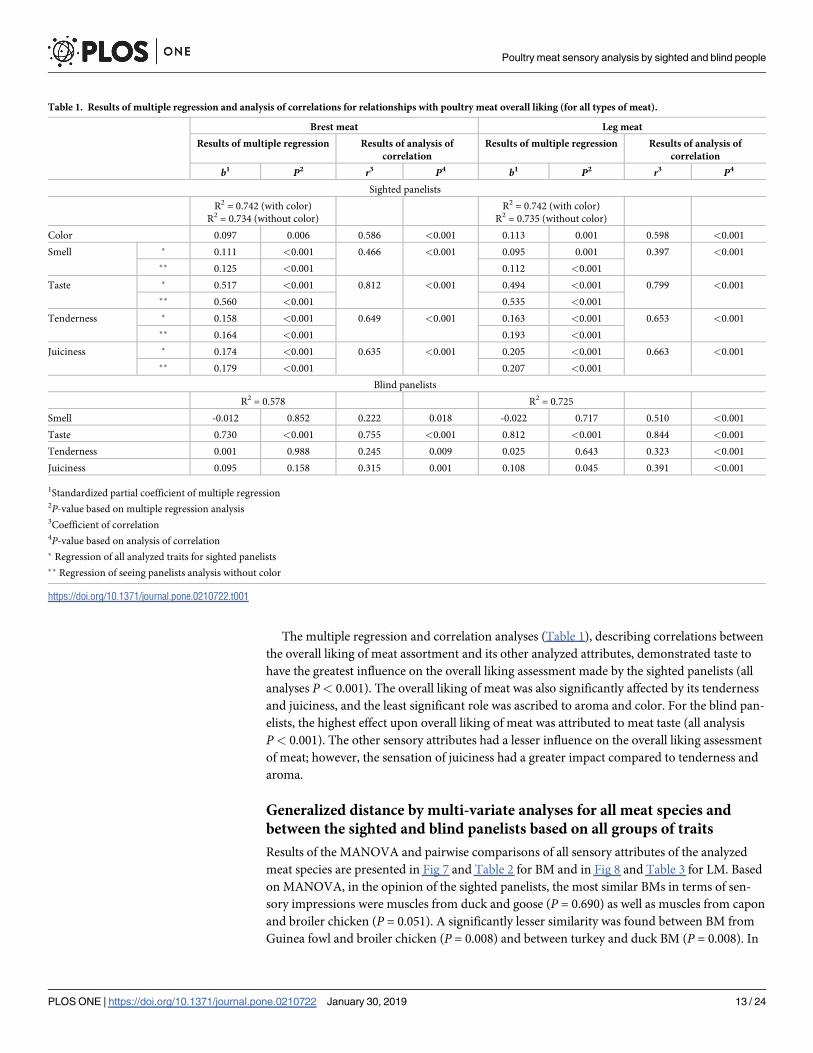
The multiple regression and correlation analyses (Table 1), describing correlations between
the overall liking of meat assortment and its other analyzed attributes, demonstrated taste to
have the greatest influence on the overall liking assessment made by the sighted panelists (all
analyses P< 0.001). The overall liking of meat was also significantly affected by its tenderness
and juiciness, and the least significant role was ascribed to aroma and color. For the blind pan-
elists, the highest effect upon overall liking of meat was attributed to meat taste (all analysis
P< 0.001). The other sensory attributes had a lesser influence on the overall liking assessment
of meat; however, the sensation of juiciness had a greater impact compared to tenderness and
aroma.
Generalized distance by multi-variate analyses for all meat species and
between the sighted and blind panelists based on all groups of traits
Results of the MANOVA and pairwise comparisons of all sensory attributes of the analyzed
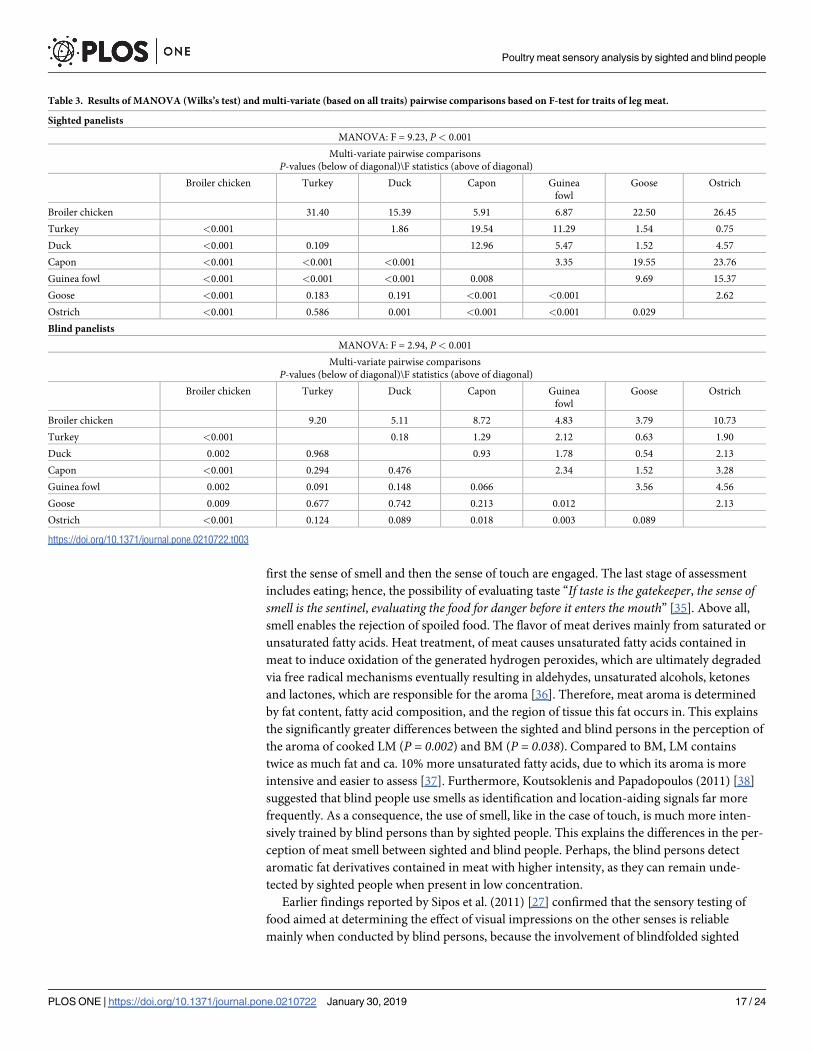
meat species are presented in Fig 7 and Table 2 for BM and in Fig 8 and Table 3 for LM. Based
on MANOVA, in the opinion of the sighted panelists, the most similar BMs in terms of sen-
sory impressions were muscles from duck and goose (P = 0.690) as well as muscles from capon
and broiler chicken (P = 0.051). A significantly lesser similarity was found between BM from
Guinea fowl and broiler chicken (P = 0.008) and between turkey and duck BM (P = 0.008). In
Table 1. Results of multiple regression and analysis of correlations for relationships with poultry meat overall liking (for all types of meat).
Brest meat Leg meat
Results of multiple regression Results of analysis of
correlation
Results of multiple regression Results of analysis of
correlation
b1 P2 r3 P4 b1 P2 r3 P4
Sighted panelists
R2 = 0.742 (with color)
R2 = 0.734 (without color)
R2 = 0.742 (with color)
R2 = 0.735 (without color)
Color 0.097 0.006 0.586 <0.001 0.113 0.001 0.598 <0.001
Smell � 0.111 <0.001 0.466 <0.001 0.095 0.001 0.397 <0.001
�� 0.125 <0.001 0.112 <0.001
Taste � 0.517 <0.001 0.812 <0.001 0.494 <0.001 0.799 <0.001
�� 0.560 <0.001 0.535 <0.001
Tenderness � 0.158 <0.001 0.649 <0.001 0.163 <0.001 0.653 <0.001
�� 0.164 <0.001 0.193 <0.001
Juiciness � 0.174 <0.001 0.635 <0.001 0.205 <0.001 0.663 <0.001
�� 0.179 <0.001 0.207 <0.001
Blind panelists
R2 = 0.578 R2 = 0.725
Smell -0.012 0.852 0.222 0.018 -0.022 0.717 0.510 <0.001
Taste 0.730 <0.001 0.755 <0.001 0.812 <0.001 0.844 <0.001
Tenderness 0.001 0.988 0.245 0.009 0.025 0.643 0.323 <0.001
Juiciness 0.095 0.158 0.315 0.001 0.108 0.045 0.391 <0.001
1Standardized partial coefficient of multiple regression2P-value based on multiple regression analysis3Coefficient of correlation4P-value based on analysis of correlation
� Regression of all analyzed traits for sighted panelists
�� Regression of seeing panelists analysis without color
https://doi.org/10.1371/journal.pone.0210722.t001
Poultry meat sensory analysis by sighted and blind people
PLOS ONE | https://doi.org/10.1371/journal.pone.0210722 January 30, 2019 13 / 24

the opinion of the blind panelists, the most similar BMs in terms of sensory attributes were
those of turkey and duck (P = 0.920), followed by those of duck and goose (P = 0.521). The
BMs of capon and broiler chicken, which received the highest scores in sensory quality assess-
ment, were also classified to one homogenous group but with a lesser similarity (P = 0.326).
Noteworthy is the fact that based on scores given by the blind panelists, compared to those
given by the sighted consumers, we were unable to indicate poultry species differing signifi-
cantly (P> 0.001) between each other in terms of all sensory attributes of BM assessed
together.
Considering the scores given in the sensory assessment by the sighted panelists, broiler
chicken LM differed significantly from all other poultry species (P< 0.001). Ostrich and tur-
key LM (P = 0.586) as well as duck and goose LM (P = 0.191) were classified to the same
homogenous group. A lesser similarity was found between turkey and goose LM (P = 0.183)
and duck LM (P = 0.109) and between ostrich and goose LM (P = 0.191) and duck LM
(P = 0.001). In the assessment made by the blind panelists, broiler chicken LM differed signifi-
cantly (P< 0.001) from LM from turkey, capon, and ostrich in terms of the analyzed sensory
attributes, likewise in the assessment of the sighted consumers. The most similar to each other
turned out to be LM from turkey and duck (P = 0.968) with goose LM (P = 0.677), as well as
goose and duck LM (P = 0.742), and capon and duck LM (P = 0.476).
On the basis of dendrogram (Fig 7) and matrix of multivariate distances (results not pre-
sented) we can conclude that differences between normal sighted and blind people according
to variables of sensory evaluation of BM were the biggest for guinea fowl (P< 0.001). Slightly
Fig 7. Dendrograms based on cluster analysis using Ward’s method using five examined traits poultry breast meat, ie.
smell, taste, tenderness, juiciness and overal liking.
https://doi.org/10.1371/journal.pone.0210722.g007
Poultry meat sensory analysis by sighted and blind people
PLOS ONE | https://doi.org/10.1371/journal.pone.0210722 January 30, 2019 14 / 24

smaller differences were observed for other birds, the smallest differences were observed for
capon (P = 0.011). The biggest multivariate differences between normal sighted and blind peo-
ple according to variables of sensory evaluation of LM (Fig 8) were detected for broiler chicken
(P< 0.001) and geese (P< 0.001). Moreover, big differences were observed for guinea fowl
(P = 0.006), while the smallest differences for capon. The multivariate differences between nor-
mal sighted and blind people according variables of sensory evaluation were bigger for LM in
comparison with BM.
Discussion
Sensory quality of poultry meat assessed based on sensory perceptions of
the sighted and blind panelists
The results clearly show that the sensory perception of poultry meat by the sighted and blind
people was completely different. This is mainly indicated by the fact that, apart from taste (Fig
3), the assessment of the other sensory attributes differed between the groups of panelists (Figs
2 and 4–6). The lack of differences in the perception of the taste of meat of most poultry species
suggests that visual disability has no or little effect on this sense. Sipos et al. (2011) [27] have
conducted a similar study concerning the assessment of the sensory quality of five apple varie-
ties. They demonstrated that blindness affected the overall sensory acceptability of the fruits;
however, differences between assessments made by the sighted and blind panelists concerned
mainly such attributes as: flavor, texture, and perception of size, and to a lesser extent the taste
of fruits. In our study, it was also the perception and preference for such sensory attributes as
tenderness and juiciness–both perceived with the sense of touch–that caused differences in the
sensory assessment of meat between the sighted and blind persons. These results are in line
Table 2. Results of MANOVA (Wilks’s test) and multi-variate (based on all traits) pairwise comparisons based on F-test for traits of breast meat.
Sighted panelists
MANOVA: F = 10.14, P < 0.001
Multi-variate pairwise comparisons
P-values (below of diagonal)\F statistics (above of diagonal)
Broiler chicken Turkey Duck Capon Guinea
fowl
Goose
Broiler chicken 17.75 18.98 3.31 2.29 18.33
Turkey <0.001 3.84 25.32 11.75 6.02
Duck <0.001 0.003 24.99 11.03 0.61
Capon 0.051 <0.001 <0.001 5.07 20.19
Guinea fowl 0.008 <0.001 <0.001 <0.001 11.71
Goose <0.001 <0.001 0.690 <0.001 <0.001
Blind panelists
MANOVA: F = 1.71, P = 0.019
Multi-variate pairwise comparisons
P-values (below of diagonal)\F statistics (above of diagonal)
Broiler chicken Turkey Duck Capon Guinea
fowl
Goose
Broiler chicken 2.75 2.84 1.21 1.62 3.60
Turkey 0.036 0.28 2.64 1.81 1.52
Duck 0.031 0.920 3.00 1.55 0.86
Capon 0.326 0.041 0.025 2.65 2.37
Guinea fowl 0.182 0.139 0.204 0.041 1.12
Goose 0.011 0.212 0.521 0.061 0.372
https://doi.org/10.1371/journal.pone.0210722.t002
Poultry meat sensory analysis by sighted and blind people
PLOS ONE | https://doi.org/10.1371/journal.pone.0210722 January 30, 2019 15 / 24

with the preceding observations of Gagnon et al. (2013) [28]. These authors indicated that
blind persons have lower taste sensitivity in comparison to sighted persons. This is primarily
associated with training. The taste system is susceptible to plasticity induced by training, simi-
larly to other senses. Bilyk et al. (2009) [29] demonstrated that in their everyday life, blind peo-
ple encounter strong obstacles in such activities as buying food, preparing meals or eating in
restaurants. Thus, the diet of blind persons is typically less varied, and therefore the training of
flavor sensations is weaker than in the case of sighted people. On the contrary, even the need
of using Braille script results in the touch being the sense heavily trained by the blind persons
and it can be better used by them to identify items than sighted persons. According to Wong
et al. (2011) [30], visual impairment is compensated for by, primarily, increased sensitivity in
the sense of touch. This stems from the fact that when the brain does not receive visual stimuli,
structural and functional reorganization proceeds in those of its regions which use other sen-
sory modalities and areas intermediating in the integration of sensory information needed for
the perception of the world, including especially identification of foods [31,32,33]. It is also a
natural mechanism which would be developed by, e.g., blind or partially sighted animal spe-
cies. For instance, to compensate for their visual disability star-nosed moles (Condylura cris-tata) have throughout evolution developed twenty-two fleshy snout appendages which are
used as a touch organ, known as Eimer’s organs [34]. This provides indisputable proof that
visual disability is to a large extent compensated for by the sense of touch.
The assessment of food through the sensation of touch will, however, occur only when two
other senses fail or when their perception is insufficient to make a final decision. People ini-
tially evaluate food through the sense of sight. If, however, the visual sensations are excluded,
Fig 8. Dendrograms based on cluster analysis using Ward’s method using five examined traits poultry leg meat, ie. smell,
taste, tenderness, juiciness and overal liking.
https://doi.org/10.1371/journal.pone.0210722.g008
Poultry meat sensory analysis by sighted and blind people
PLOS ONE | https://doi.org/10.1371/journal.pone.0210722 January 30, 2019 16 / 24
first the sense of smell and then the sense of touch are engaged. The last stage of assessment
includes eating; hence, the possibility of evaluating taste “If taste is the gatekeeper, the sense ofsmell is the sentinel, evaluating the food for danger before it enters the mouth” [35]. Above all,
smell enables the rejection of spoiled food. The flavor of meat derives mainly from saturated or
unsaturated fatty acids. Heat treatment, of meat causes unsaturated fatty acids contained in
meat to induce oxidation of the generated hydrogen peroxides, which are ultimately degraded
via free radical mechanisms eventually resulting in aldehydes, unsaturated alcohols, ketones
and lactones, which are responsible for the aroma [36]. Therefore, meat aroma is determined
by fat content, fatty acid composition, and the region of tissue this fat occurs in. This explains
the significantly greater differences between the sighted and blind persons in the perception of
the aroma of cooked LM (P = 0.002) and BM (P = 0.038). Compared to BM, LM contains
twice as much fat and ca. 10% more unsaturated fatty acids, due to which its aroma is more
intensive and easier to assess [37]. Furthermore, Koutsoklenis and Papadopoulos (2011) [38]
suggested that blind people use smells as identification and location-aiding signals far more
frequently. As a consequence, the use of smell, like in the case of touch, is much more inten-
sively trained by blind persons than by sighted people. This explains the differences in the per-
ception of meat smell between sighted and blind people. Perhaps, the blind persons detect
aromatic fat derivatives contained in meat with higher intensity, as they can remain unde-
tected by sighted people when present in low concentration.
Earlier findings reported by Sipos et al. (2011) [27] confirmed that the sensory testing of
food aimed at determining the effect of visual impressions on the other senses is reliable
mainly when conducted by blind persons, because the involvement of blindfolded sighted
Table 3. Results of MANOVA (Wilks’s test) and multi-variate (based on all traits) pairwise comparisons based on F-test for traits of leg meat.
Sighted panelists
MANOVA: F = 9.23, P< 0.001
Multi-variate pairwise comparisons
P-values (below of diagonal)\F statistics (above of diagonal)
Broiler chicken Turkey Duck Capon Guinea
fowl
Goose Ostrich
Broiler chicken 31.40 15.39 5.91 6.87 22.50 26.45
Turkey <0.001 1.86 19.54 11.29 1.54 0.75
Duck <0.001 0.109 12.96 5.47 1.52 4.57
Capon <0.001 <0.001 <0.001 3.35 19.55 23.76
Guinea fowl <0.001 <0.001 <0.001 0.008 9.69 15.37
Goose <0.001 0.183 0.191 <0.001 <0.001 2.62
Ostrich <0.001 0.586 0.001 <0.001 <0.001 0.029
Blind panelists
MANOVA: F = 2.94, P< 0.001
Multi-variate pairwise comparisons
P-values (below of diagonal)\F statistics (above of diagonal)
Broiler chicken Turkey Duck Capon Guinea
fowl
Goose Ostrich
Broiler chicken 9.20 5.11 8.72 4.83 3.79 10.73
Turkey <0.001 0.18 1.29 2.12 0.63 1.90
Duck 0.002 0.968 0.93 1.78 0.54 2.13
Capon <0.001 0.294 0.476 2.34 1.52 3.28
Guinea fowl 0.002 0.091 0.148 0.066 3.56 4.56
Goose 0.009 0.677 0.742 0.213 0.012 2.13
Ostrich <0.001 0.124 0.089 0.018 0.003 0.089
https://doi.org/10.1371/journal.pone.0210722.t003
Poultry meat sensory analysis by sighted and blind people
PLOS ONE | https://doi.org/10.1371/journal.pone.0210722 January 30, 2019 17 / 24
persons in consumer or semi-consumer tests ended in highly diverse results in terms of the
sensory assessment: “blindfolding caused uncertainty and disturbed perception, leading toinconsistent judgements”. In our study, the variability of scores given to sensory attributes by
the blind and sighted panelists was in most cases at a similar level. Interesting were results of
the analysis of evaluation sheets of two blind panelists–monozygotic twins (brothers), whose
scores were almost identical, although they could not communicate with each other during
testing. Of course, a single case of twins does not produce any explicit finding, but it is worth
mentioning as it has been demonstrated several times that the perception of sensory impres-
sions of food products, including mainly their taste and aroma, is also partly affected by the
genetic differences in the chemosensory pathways [39,40]. Considering this fact, we chose per-
sons of the same nationality for our study, which could be the reason behind the relatively low
variability of the results achieved.
Ranking of poultry meat sensory quality
The range of poultry meat used in our study deliberately included meat which is known to
most of the panelists from their everyday diets, as well as meat which they consume occasion-
ally or which they had never tried or which they had tried sporadically. The frequency of con-
sumption of a given meat species depends on e.g. the origin of the panelists, and in this study
this was adjusted to current trends observed in Poland. The everyday diet of Poles includes
mainly chicken and turkey meat, whereas meat from water fowl is consumed occasionally
(usually in the holiday season), while meat from capon, ostrich, and Guinea fowl is an exclu-
sive, expensive, and difficult to buy product. The habitual flavor profile was, therefore, the
likely cause of the highly evaluated sensory quality of broiler chicken meat by both the sighted
and blind consumers. In addition, out of all the species analyzed, broiler chickens are slaugh-
tered the earliest, their meat is tender and delicate. In turn, although perceived as a relatively
rich source of protein and recommended as a dietetic product, turkey meat is poor in fat as a
carrier of taste. In addition, the long fattening period of birds (15 wk for hens and 20–22 wk
for toms) makes the meat significantly harder in instrumental evaluation compared to the
meat of broiler chickens [41,42]. Results obtained in our study confirm the low sensory value
of turkey meat and therefore point to the necessity of counteracting these practices.
An interesting finding from this study is the very high assessment of the sensory quality of
both BM and LM from capon. Especially the sighted panelists praised capon meat for most of
the analyzed sensory attributes and indicated BM to be the best in terms of the overall liking
compared to all other analyzed meats (Fig 6). In many cases, scores given to capon meat by the
panelists exceeded scores given to broiler chicken meat. This finding is by far the most interest-
ing as it confirms the advisability of caponization as a procedure aimed at improving the quality
of meat of roosters of local breeds. Amorim et al. (2016) [43] have recently demonstrated that
consumers prefer meat from capons and evaluate their sensory quality much more highly com-
pared to meat of roosters of the same breeds, broiler chickens, and also free range chickens.
This is because caponization contributes to the accumulation of higher amounts of intramuscu-
lar fat, improves the lipid profile of meat, and reduces the growth of muscle fibers, owing to
which meat becomes more tender, juicy, and tasty. Today, capon meat is the most expensive
poultry meat and one of the most expensive meats in general. This results from the necessity of
conducting the caponization procedure, the long fattening period, specific feeding, and the
necessity of choosing a specified of roosters. Study results may suggest that the explicit prefer-
ences of consumers should stimulate future research on the improvement of capon production
technology that would enable the reduction of production costs and make this product more
accessible to a wider group of consumers, including lower-income social groups.
Poultry meat sensory analysis by sighted and blind people
PLOS ONE | https://doi.org/10.1371/journal.pone.0210722 January 30, 2019 18 / 24

As for capon, a relatively expensive and unpopular poultry meat is Guinea fowl. Apart from
the African countries, which are the homeland of this species, and France where the produc-
tion of meat-type birds has been initiated and developed [44], in other regions of the world
Guinea fowls are typically imported or kept on small household farms. Together with broiler
chickens and turkeys, Guinea fowls belong to the order of the Galliformes; hence, their meat
includes white BM and red LM. The few studies on Guinea fowl meat quality demonstrate that
its BM is characterized by a higher protein content and a lower fat content compared to broiler
chicken BM [45]. In turn, Nsoso et al. (2008) [46] demonstrated the protein content in Guinea
fowl BM to be significantly higher than in LM, and the contents of fat and water to be similar
in both types of muscles. However, the BM and LM from Guinea fowl differ significantly in
their fatty acid profile, including especially high contents of mono- and polyunsaturated fatty
acids in LM, and a higher content of n-6 fatty acids and a lower ratio of polyunsaturated to sat-
urated fatty acids in BM. These differences were, probably, the cause of differences in scores
given in the sensory assessment of the breast and leg muscles, especially by the blind panelists
who rely mainly on the sense of touch. The blind consumers especially praised the juiciness of
Guinea fowl LM (4.44) compared to BM (2.68), which could be due to the high content of
unsaturated fatty acids, the long-chain ones in particular, in these muscles. The high content
of unsaturated fatty acids is positively correlated with high sensory scores, because it creates
the sensation of a more soft and delicate meat, compared to the more compact and harder tis-
sues with a high content of saturated fatty acids [47]. Insignificantly higher scores given in the
sensory quality assessment of Guinea fowl BM by the sighted panelists resulted from a rela-
tively high evaluation of meat color. This not only confirms the role of sight in food assess-
ment, but also indicates consumer preferences for the white and not red muscles.
The increased consumption of goose and duck meat in the holiday seasons may suggest
high sensory values of these products. Unfortunately, water fowl meat was not preferred in our
study, especially by the sighted panelists who classified BM and LM from both these species in
terms of their sensory quality to the same group, being different from the other analyzed meat
(Figs 7 and 8). The blind panelists scored goose and duck meat higher, particularly the taste of
LM (Fig 3). The low scores given by the sighted panelists in the overall liking assessment could
result from low scores for meat color, mainly for BM (Fig 1), which–being a red-type meat–dis-
tinguished itself from the other white muscles. Previous studies on the sensory profile of water
fowl meat have usually presented different results indicating goose and duck meats as products
of high sensory values [48]. The likely reason for these differences is that this type of meat is
scored higher in the absence of a direct comparison with meats from other poultry species, the
galliformes in particular. In addition, in our study, meat samples were cooked without skin and
subcutaneous fat to make the analyzed range more unified. In most studies addressing the sen-
sory profile of goose and duck meat, analyzes have been conducted for fillets with skin and sub-
cutaneous fat or for products made of fillets, e.g. spickgans (smoked pectoral meat from goose
with skin and subcutaneous fat) [49], whereas meat from water fowl and especially its BM
devoid of skin and subcutaneous fat has a relatively low content of fat and is a thick-fiber tissue
[50]. Hence, special attention should be paid to the fact that our results concern exclusively
cooked lean meat from geese and ducks, whereas the sensory profile of commonly used prod-
ucts containing other tissues (subcutaneous fat, skin) may be evaluated significantly higher.
By far the worst scored meat in our study was ostrich meat. Its low overall liking resulted
mainly from low scores given to its tenderness (Fig 4) and juiciness (Fig 5). This is probably
because ostriches need a long time to reach slaughter maturity (12–15 months). In addition,
their meat is built of very thick fibers owing to their high body weight and the intensive work
of their LM which enables them to run very fast. According to Horbańczuk, and Wierzbicka
(2017) [51], this meat is currently gaining in popularity among consumers seeking an
Poultry meat sensory analysis by sighted and blind people
PLOS ONE | https://doi.org/10.1371/journal.pone.0210722 January 30, 2019 19 / 24

alternative to a standard diet, who value its low fat content, high content of polyunsaturated
fatty acids, beneficial ratio of n-6/n-3 fatty acids, and significantly higher content of iron
(heme form) compared to poultry meat and beef. Of course, in terms of the nutritive value of
meat, all the mentioned traits are highly beneficial to consumers, but do not always correspond
with the high sensory values of meat. As in the case of, e.g. turkey meat, the low fat content has
a rather negative effect on taste, tenderness, and juiciness. There is no research available that
would compare the sensory quality of ostrich meat with that of other poultry species, and this
impairs discussion of our results. However, some reports indicate that the addition of commi-
nuted ostrich meat to meat products improves their sensory values [52]. This suggests that
ostrich meat may be a desirable component of cured meat products and processed meat prod-
ucts, but is not preferred as a cooked meat serving.
Conclusion
In summary, that the inclusion of the blind persons onto a panel evaluating the sensory profile
of food–in our case of poultry meat–affords new methodological possibilities for the quality
assessment of food products. In addition, our study results indicate many differences in the
perception of sensory impressions used in food assessment between sighted and blind con-
sumers. They also confirm the fact that blindness is compensated for by other senses responsi-
ble for food assessment. Although this study constitutes the first attempt at carrying out a
sensory panel for products of animal origin with the participation of completely blind persons,
the results are significant in terms of providing information on the quality of the product with-
out its falsification with a visual impression. This is of great importance with regards to the
pressure put by commercial enterprises on consumers through advertising, the positive recep-
tion of which oftentimes stems from the use of modern graphic techniques, and not the quality
of the product itself. Finally, our study proves that the unlimited possibility for the visual
assessment of food products affects the perception of other sensations. This offers significant
opportunities not only for science and industry, but also for visually disabled persons as they
may use their different perception capabilities in practice. In the future, however, a specific
schedule of training for blind panelists should be elaborated in regard of particular groups of
food products. The assessment of the sensory quality of cooked meat did not involve the use of
the sense of hearing, which is perceived as the sharpest sense for blind persons, while sound
analysis may be very useful in the assessment of such food products as bakery products, chips
or some confectionery products. It would also be interesting to conduct sensory testing by
blind panelists in other than hedonic scale models, e.g. in triangle tests.
Results obtained in this study clearly show that the most preferred poultry meat in terms of
the sensory profile were breast muscles (BM) from broiler chicken and capon. Consumer pref-
erences concerning sensory impressions are therefore ambiguous and are in part consistent
with economic preferences. Our study results indicate that–considering consumer prefer-
ences–reorganization of the poultry meat market should be aimed at developing a less expen-
sive technology for capon production. In addition, our results confirmed the low sensory
quality of turkey meat, which however needs to be addressed in future studies and develop-
ment of a production strategy to counteract this phenomenon is urgently required.
Supporting information
S1 Fig. Preparation, packaging and cooking of poultry meat: Broiler chicken = 1, turkey = 2,
duck = 3, capon = 4, guinea fowl = 5, goose = 6 and ostrich = 7.
(TIF)
Poultry meat sensory analysis by sighted and blind people
PLOS ONE | https://doi.org/10.1371/journal.pone.0210722 January 30, 2019 20 / 24

S2 Fig. Poultry meat samples cooked with the sous–vide method and prepared for con-
sumer testing.
(TIF)
S3 Fig. Blind panelist reading the assessment card prepared in Braille.
(TIF)
S1 Table. Data for statistical means and variability for poultry meat color evaluation.
(DOC)
S2 Table. Data for statistical means and variability for poultry meat smell evaluation.
(DOC)
S3 Table. Data for statistical means and variability for poultry meat taste evaluation.
(DOC)
S4 Table. Data for statistical means and variability for poultry meat tenderness evaluation.
(DOC)
S5 Table. Data for statistical means and variability for poultry meat juiciness evaluation.
(DOC)
S6 Table. Data for statistical means and variability for poultry meat overall liking evalua-
tion.
(DOC)
S1 Dataset. Original raw data set.
(XLS)
Acknowledgments
We would like to express our gratitude to the Management, Staff, and Charges of the Roża
Czacka Educational Center for Blind Children in Laski Laski, Brzozowa Str. 75, 05–080 Izabe-
lin, for their great kindliness, and willingness to cooperate and for the possibility of conducting
tests. Special thanks are due to Sister Benita Hadamik for her invaluable help in coordination
of analyzes conducted by the Charges, and for adjusting and preparing sensory evaluation
sheets in Braille.
Author Contributions
Conceptualization: Krzysztof Damaziak.
Data curation: Krzysztof Damaziak, Julia Riedel, Mateusz Bucław.
Formal analysis: Krzysztof Damaziak, Adrian Stelmasiak, Dariusz Gozdowski.
Investigation: Monika Michalczuk.
Methodology: Krzysztof Damaziak, Adrian Stelmasiak.
Project administration: Krzysztof Damaziak, Żaneta Zdanowska-Sąsiadek.
Resources: Monika Michalczuk.
Validation: Żaneta Zdanowska-Sąsiadek.
Writing – original draft: Krzysztof Damaziak.
Writing – review & editing: Krzysztof Damaziak.
Poultry meat sensory analysis by sighted and blind people
PLOS ONE | https://doi.org/10.1371/journal.pone.0210722 January 30, 2019 21 / 24

References1. Singh-Ackbarali D, Maharaj R. Sensory evaluation as a tool in determining acceptability of innovative
products developed by undergraduate students in Food Science and Technology at The University of
Trinidad and Tobago. J Curr Teach, 2014; 3:10―27. https://doi.org/10.5430/jct.v3n1p10
2. Gengler I. When people are the instrument: sensory evaluation methods. ASQ Statistics Division News-
letter, 2009; 27:9―12.
3. Wadhera D, Capaldi-Phillips ED. A review of visual cues associated with food acceptance and con-
sumption. Eat Beh, 2014; 15:132―143. https://doi.org/10.1016/j.eatbeh.2013.11.003 PMID: 24411766
4. Breslin PAS. An Evolutionary Perspective on food review and human taste. Curr Biol, 2013; 23:
R409―R418. https://doi.org/10.1016/j.cub.2013.04.010 PMID: 23660364
5. Ch Spence, Okajima K Cheok AD, Petit O Michel Ch. Eating with our eyes: From visual hunger to digital
satiation. Brian Cogn, 2016; 110:53―63. https://doi.org/10.1016/j.bandc.2015.08.006 PMID:
26432045
6. Hurling R, Shepherd R. Eating with your eyes: Effects of appearance on expectiations of liking. Appe-
tite, 2003; 41: 167―174. PMID: 14550314
7. Spence C, Piqueras-Fiszman B. The perfect meal: The multisensory science of food and dining.
Oxforn, UK: Wiley-Blackwell; 2014.
8. Delwiche JF. You eat with your eyes first. Physiol Behav, 2012; 107:502―504. https://doi.org/10.1016/
j.physbeh.2012.07.007 PMID: 22939762
9. Knutson B, Rick S, Wimmer GE, Prelec D, Loewenstein G. Neural predictors of purchases. Neuron,
2007; 53:147―156. https://doi.org/10.1016/j.neuron.2006.11.010 PMID: 17196537
10. Van der Laan LN, de Ridder DTD, Viergever MA, Smeets PAM. The first taste is always with the eyes:
A meta-analysis on the neural correlates of processing visual food cues. Neuroimage, 2011;
55:296―303. https://doi.org/10.1016/j.neuroimage.2010.11.055 PMID: 21111829
11. Levy I, Lazzaro SC, Rutledge RB, Glimcher PW. Choice from non-choice: predicting consumer prefer-
ences from blood oxygenation level-dependent signals obtained during passive viewing. J Neurosci,
2011; 31:118―125. https://doi.org/10.1523/JNEUROSCI.3214-10.2011 PMID: 21209196
12. Van der Laan LN, de Ridder DTD, Viergever MA, Smeets PAM. Appearance matters: neural correlates
of food choice and packaging aesthetics. PLoS ONE, 2012; 7:e41738. https://doi.org/10.1371/journal.
pone.0041738 PMID: 22848586
13. Hansen S. Society of the Appetite. Celebrity chefs deliver consumers. Food, Culture and Society, 2008;
11:49―67. https://doi.org/10.2752/155280108X276050
14. Boulos R, Vikre EK, Oppenheimer S, Chang H, Kanarek RB. ObsiTV: How television is influencing the
obesity epidemic. Physiol Behav, 2012; 107:146―153. https://doi.org/10.1016/j.physbeh.2012.05.022
PMID: 22677722
15. Geraldo APG, Silva MEMP. Processed foods in infant feeding: analysis of the visual memory of school-
children in Tubate city, São Paulo. J Human Growth and Develop, 2012; 22:53―59.
16. Zwiers MP, Van Opatal AJ, Cruysberg JRM. A spatial hearing deficit in early-blind humans. J Neurosci,
2001; 21: RC142, 1―5. PMID: 11312316
17. Lessard N, Pare M, Lepore F, Lassonde M. Early-blind human subjects localize sound sources better
than sighted subject. Nature, 1998; 395:278―280. https://doi.org/10.1038/26228 PMID: 9751055
18. Rauschecker JP. Auditory cortical plasticity: a comparison with other sensory systems. Trends in Neu-
rosci, 1999; 22:74―80. https://doi.org/10.1016/S0166-2236(98)01303-4 PMID: 10092047
19. Thornton PK. Livestock production: recent trends, future prospects. Philos Trans R Soc Lond B Biol Sci,
2010; 365:2853―2867. https://doi.org/10.1098/rstb.2010.0134 PMID: 20713389
20. Wirsenius S, Azar C, Berndes G. How much land is needed for global food production under scenarios
of dietary changes and livestock productivity increases in 2030. Agricultural Systems, 2010;
103:621―638. https://doi.org/10.1016/j.agsy.2010.07.005
21. ISO 8586–1. Sensory Analysis. General Guidance for the selection, training and monitoring of asses-
sors. Part 1: Selected assessors.
22. ISO 8586–2. Sensory Analysis. General Guidance for the selection, training and monitoring of asses-
sors. Part 2: Experts.
23. ISO, 1988. Sensory Analysis—General Guidance for the Design of Test Rooms. ISO 8589, 1―9.
24. Yeu K, Lee Y, Lee SY. Consumer acceptance of an extrude soy-based high-protein breakfast cereal. J
Food Sci, 2008; 73:S20–S25. https://doi.org/10.1111/j.1750-3841.2007.00601.x. PMID: 18211365
25. Quinn GP, Keough MJ. (2002) Experimental design and data analysis for biologists. Cambridge Univer-
sity Press.
Poultry meat sensory analysis by sighted and blind people
PLOS ONE | https://doi.org/10.1371/journal.pone.0210722 January 30, 2019 22 / 24
26. StatSoft INC. (2014) Statistica (Data Analysis Software System), Version 10 (Tulsa, Oklahoma, USA,
StatSoft Inc.). Available: www.statsoft.com.
27. Sipos L, Kiry I, Babel L, Kokai Z, Toth M. Role of sight in flavor perception: sensory assessment of apple
varieties by sighted and blind panels. Acta Alimentaria, 2011; 40:198―213. https://doi.org/10.1556/
AAlim.40.2011.Suppl.19
28. Gagnon L, Kupers R, Ptito M. Reduced taste sensitivity in congenital blindness. Chem Senses, 2013;
38:509―517. https://doi.org/10.1093/chemse/bjt021 PMID: 23667250
29. Bilyk MC, Sontrop JM, Chapman GE, Barr SI, Mamer L. Food experiences and eating patterns of visu-
ally impaired and blind people. Can J Diet Pract Res, 2009; 70:13―8. https://doi.org/10.3148/70.1.
2009.13 PMID: 19261202
30. Wong M, Gnanakumaran V, Goldreich D. Spatial Acuity enhancement in blindness: evidence for experi-
ence-dependent mechanisms. J Neurosci, 2011; 31:7028―7037. https://doi.org/10.1523/
JNEUROSCI.6461-10.2011 PMID: 21562264
31. Roder B, Rosler F. Compensatory plasticity as a consequence of sensory loss. In: Calvert G, Spence C,
Stein BE. The handbook of multisensory processes: Cambridge, Massachusetts: MIT Press 2004. pp.
719–748.
32. Petkova VI, Zetterberg H, Ehrsson HH. Rubber hands feel touch, but not in blind individuals. PLoS
ONE, 2012; 7:e35912. https://doi.org/10.1371/journal.pone.0035912. PMID: 22558268
33. Bauer CM, Hirsch GV, Zajac L, Koo B, Collignon O, Merabet LB. Multimodal MR-imaging reveals large-
scale structural and functional connectivity changes in profound early blindness. PLoS ONE, 2017; 12:
e0173064. https://doi.org/10.1371/journal.pone.0173064. PMID: 28328939
34. Catania KC. Tactile sensing in specialized predators–from behavior to the brain. Curr Opin Neurobiol,
2012; 22:251―258. https://doi.org/10.1016/j.conb.2011.11.014. PMID: 22209039
35. Reed DR, Knaapila A. Genetics of taste and smell: Poisons and Pleasures. Prog Mol Biol Transl Sci,
2010; 94: 213―240. https://doi.org/10.1016/S1877-1173(10)94008-8. PMID: 21036327
36. Mottram DS. Flavour formation in meat and meat products: a review. Food Chem, 1998; 62:415―424.
https://doi.org/10.1016/S0308-8146(98)00076-4.
37. Chen Y, Qiao Y, Xiao Y, Chen H, Zhao L, Huang M, et al. Differences in physicochemical and nutritional
properties of breast and thigh meat from crossbreed chickens, commercial broilers, and spent hens.
Asian-Australas J Anim Sci, 2016; 29:855―864. https://doi.org/10.5713/ajas.15.0840. PMID: 26954114
38. Koutsoklenis A, Papadopoulos K. Olfactory cues used for wayfinding in urban environments by individu-
als with visual impairments. J Visual Impair Blin, 2011; 105:692―702.
39. Keller A, Zhuang H, Chi Q, Vosshall LB, Matsunami H. Genetic variation in a human odorant receptor
alters odor perception. Nature, 2007; 449:468―472. https://doi.org/10.1038/nature06162. PMID:
17873857
40. Knaapila A, Hwang L, Lysenko A, Duke FF, Fesi B, Khoshnevisa A, et al. Genetic analysis of chemo-
sensory traits in human twins. Chem Senses, 2012; 37:869―881. https://doi.org/10.1093/chemse/
bjs070. PMID: 22977065
41. Luckett CR, Kuttappan VA, Johnson LG, Owens CM, Seo HS. Comparison of three instrumental meth-
ods for predicting sensory texture attributes of poultry deli meat. Journal of Sensory Studies, 2014;
29:171―181. https://doi.org/10.1111/joss.12092
42. Damaziak K, Pietrzak D, Michalczuk M, Adamczak L, Chmiel M, Florkowski T, et al. Early and 24 h
post-mortem changes in breast muscle quality traits of two turkeys genotype and their reciprocal
crosses raised under semi-confined conditions. Br Poult Sci, 2016; 57:51―62. https://doi.org/10.1080/
00071668.2015.1120273. PMID: 26927475
43. Amorim A, Rodriques S, Pereira E, Teixeira A. Physicochemical composition and sensory quality evalu-
ation of capon and rooster meat. Poult Sci, 2016; 95:1211―1219. https://doi.org/10.3382/ps/pev448.
PMID: 26957630
44. Grimaud Frères. Breeder Guinea Fowls. 2018. Available from: http://www.grimaudfreres.com/en/
products/guinea-fowl/ Cited 16 March 2018.
45. Musundire MT, Halimani TE, Chimonyo M. Physical and chemical properties of meat from scavenging
chickens and helmeted guinea flows in response to age and sex. Br Poult Sci, 2017; 58:390―396.
https://doi.org/10.1080/00071668.2017.1313961. PMID: 28394176
46. Nsoso SJ, Mareko M, Manyanda S, Legodimo P. The effect of housing type on body parameters, feed
intake and feed conversion ratio of Guinea Fowl (Numida meleagris) keets and chemical composition of
their meat during growth and development in Btswana. Res J Anim Sci, 2008; 2:36―40.
47. Hwang YH, Joo ST. Fatty acid profiles, meat quality, and sensory palatability of grain-fed and grass-fed
beef from Hanwoo, American, and Australian crossbred cattle. Korean J Food Sci Anim Resour, 2017;
37:153―161. https://doi.org/10.5851/kosfa.2017.37.2.153. PMID: 28515638
Poultry meat sensory analysis by sighted and blind people
PLOS ONE | https://doi.org/10.1371/journal.pone.0210722 January 30, 2019 23 / 24

48. Kim DH, Kim TK, Kim YB, Sung JM, Jang YJ, Shim JY, et al. Effects of the duck skin on quality charac-
teristics of duck hams. Korean J Food Sci Anim Resour, 2017; 37:360―367. https://doi.org/10.5851/
kosfa.2017.37.3.360. PMID: 28747821
49. Damaziak K, Stelmasiak A, Michalczuk M, Wyrwisz J, Moczkowska M, Marcinkowska-Lesiak MM, et al.
Analysis of storage possibility of raw and smoked breast meat of oat-fattened White Kołuda® goose
based on their quality characteristics. Poultry Science, 2016; 95:2186―2197. https://doi.org/10.3382/
ps/pew138. PMID: 27143769
50. Damaziak K, Michalczuk M, Adamek D, Czapliński M, Niemiec J, Goryl A, et al. Influence of housing
system on the growth and histological structure of duck muscles. South African Journal of Animal Sci-
ence, 2014; 44:97―109. https://dx.doi.org/10.4314/sajas.v44i2.1.
51. Horbańczuk OK, Wierzbicka A. Effects of packaging methods on shelf life of ratite meats. J Vet Res,
2017; 61:279―285. https://doi.org/10.1515/jvetres-2017-0031. PMID: 29978084
52. Cavalheiro CP, Piovesan N, de Marsillac TL, Lovato M, Terra NN, Fries M. Colorimetric and sensory
characteristics of fermented cured sausage with Brazilian ostrich meat addition. Food Sci Technol,
2013; 33:660―665. https://dx.doi.org/10.1590/S0101-20612013000400010.
Poultry meat sensory analysis by sighted and blind people
PLOS ONE | https://doi.org/10.1371/journal.pone.0210722 January 30, 2019 24 / 24