sentinel-2 msi in the monitoring of lakes and coastal
TRANSCRIPT

Sentinel-2 MSI in the Monitoring of Lakes and Coastal Waters in Finland: Spectral and Spatial Resolution Considerations
Kari Kallio, Sampsa Koponen, Jenni Attila, Mikko Kervinen, Timo Pyhälahti
Finnish Environment Institute Carsten Brockmann, Tonio Fincke
Brockmann Consult Lena Kritten
Free University of Berlin
Sentinel-2 for Science Workshop, ESRIN, May 20-22 2014
- Global Lakes Sentinel Services
● Collaborative Project (2013-2016) funded by the EU 7th Framework Programme
● Develops processing tools for the upcoming Sentinel-2 and Sentinel-3 satellites to monitor lakes and reservoirs. ○ Algorithm development for various water types
http://www.glass-project.eu/

Outline
● Characteristics of lake and coastal waters in Finland ● Spatial resolution analyses
● Potential of MSI band wavelengths for water quality estimation
with band ratios ● Spectral inversion algorithm SIOCS (The Sensor-Independent
Ocean Colour Processor)
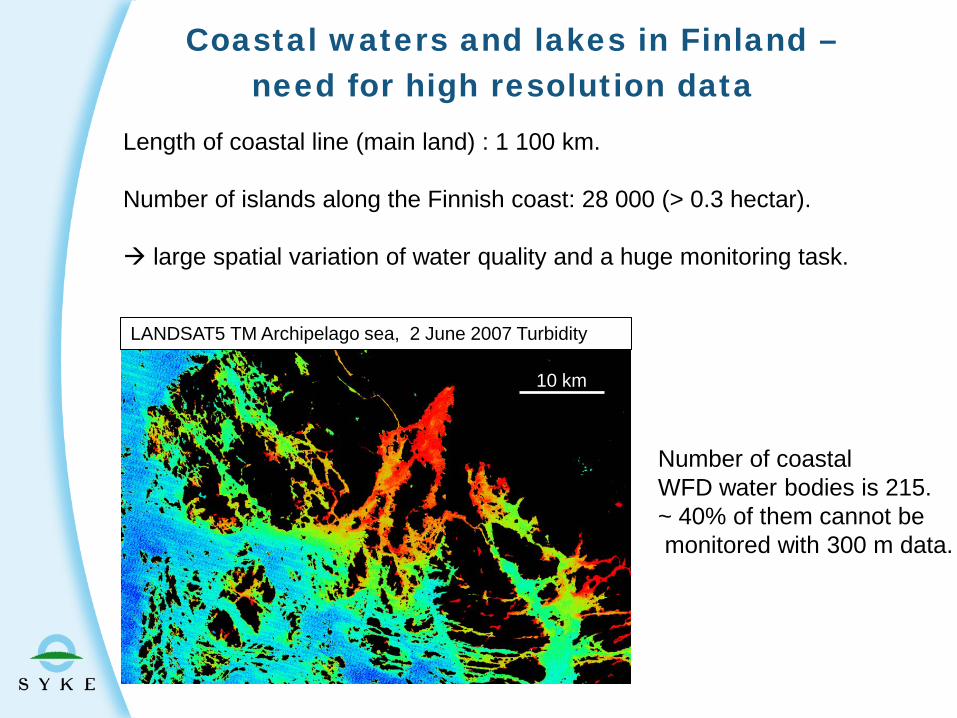
Length of coastal line (main land) : 1 100 km.
Number of islands along the Finnish coast: 28 000 (> 0.3 hectar). large spatial variation of water quality and a huge monitoring task.
Coastal waters and lakes in Finland – need for high resolution data
LANDSAT5 TM Archipelago sea, 2 June 2007 Turbidity
10 km
Number of coastal WFD water bodies is 215. ~ 40% of them cannot be monitored with 300 m data.

5
Lakes in Finland
Lakes not possible to monitor with 300 m resolution instruments
Number of lakes is 56 000 (> 1 hectar)
MERIS pixels

0
200
400
600
800
1000
10 pixels
Landmask1 pixelbuffer
695 15%
201 4%
300 m sensor with land mask 300 m sensor with buffered land mask: the mask is extended by one extra pixel from the shore
WFD monitoring of Finnish lakes with 300 m data (MERIS, OLCI) – Effect of spatial resolution Total number of WFD lakes (> 0.5 km2) is 4596.
With Sentinel 2: All WFD lakes and many smaller lakes
Num
ber o
f lak
es
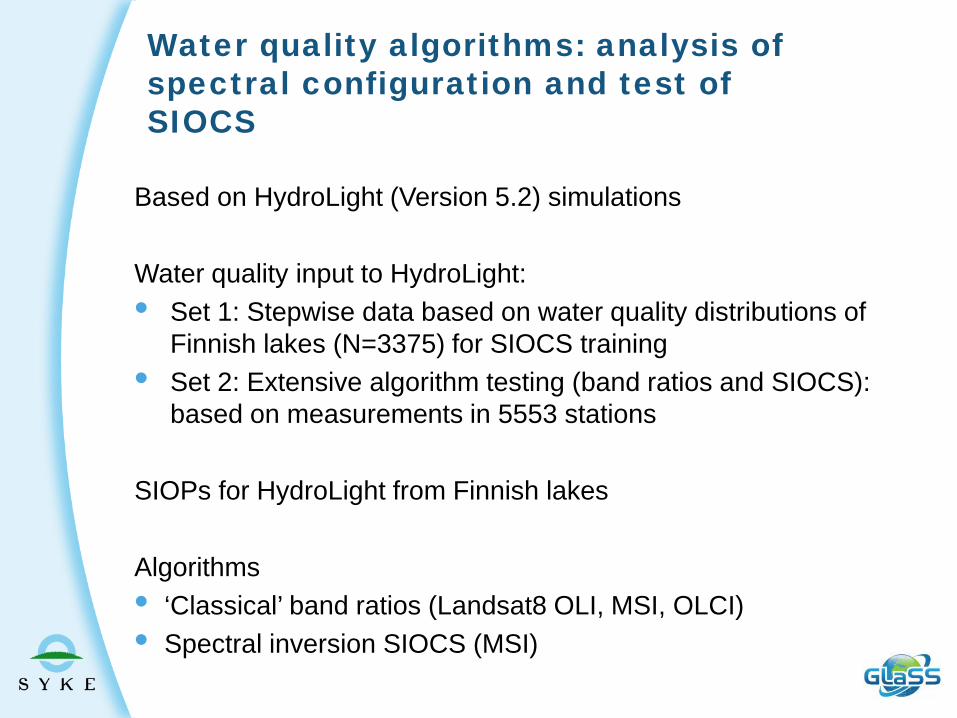
Based on HydroLight (Version 5.2) simulations Water quality input to HydroLight: • Set 1: Stepwise data based on water quality distributions of
Finnish lakes (N=3375) for SIOCS training • Set 2: Extensive algorithm testing (band ratios and SIOCS):
based on measurements in 5553 stations SIOPs for HydroLight from Finnish lakes Algorithms • ‘Classical’ band ratios (Landsat8 OLI, MSI, OLCI) • Spectral inversion SIOCS (MSI)
Water quality algorithms: analysis of spectral configuration and test of SIOCS

Spectral inversion algorithm: Sensor Independent Ocean Color prosessor (SIOCS)
● Joint project of Brockmann Consult and Free University of
Berlin.
● Sensor bands can be selected
● User can use own IOPs/SIOPs and concentration ranges ● Planned to be available in the BEAM EO toolbox
● SIOCS is under development. SYKE has participated in
testing of SIOCS and used HydroLight in its training
8

400 450 500 550 600 650 700 7500
1
2
3
4
wavelength nm
Spectral resolutions of OLI, MSI and OLCI in 390-715 nm
S2 MSI S3 OLCI
Landsat8 OLI
MSI 650-680 nm: 2. absorption maximum of phytoplankton MSI 698-713 nm: small absorption by particles and CDOM

SIOCS: main components
IOPs (aph, aCDOM, ad, bTSM) for the bands
10
Inversion operator - cost function - stop criterium
Rrs simulations Rrs measured
IOPs at 443 nm
Concentrations
SIOPs
3375 cases, stepwise variation
HydroLight HydroLight simulated, 5553 cases, based on measured concentrations
Finnish lakes
Test with Finnish lakes using the S2-MSI bands
LUTs
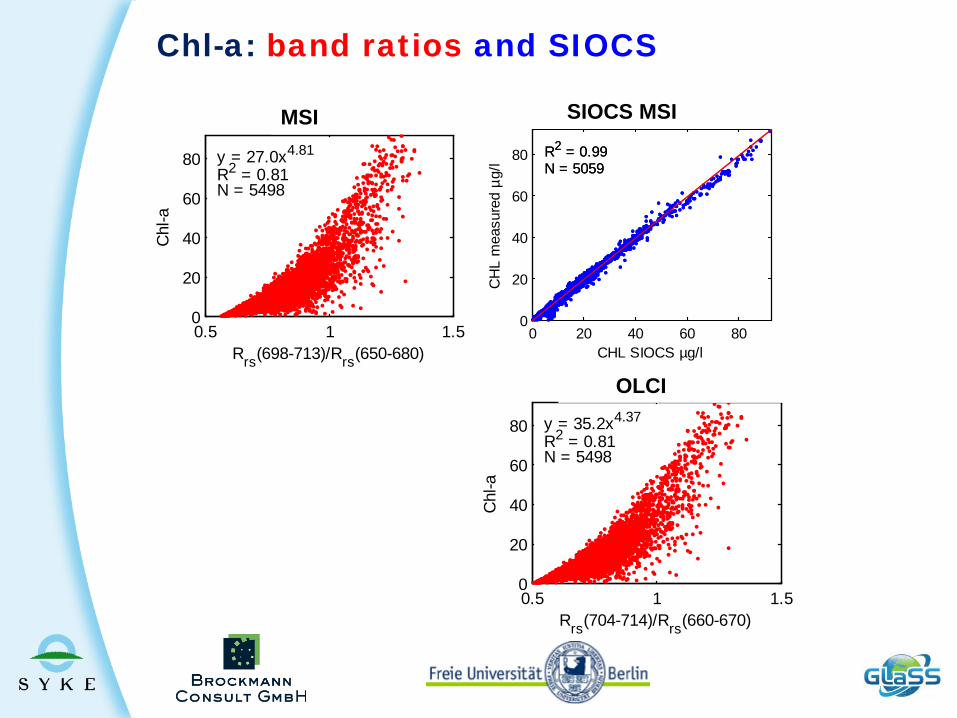
Chl-a: band ratios and SIOCS
11
0.5 1 1.50
20
40
60
80
S2-MSI Chl-a
Rrs(698-713)/Rrs(650-680)
Chl
-ay = 27.0x4.81
R2 = 0.81N = 5498
0.5 1 1.50
20
40
60
80
S3-OLCI Chl-a
Rrs(704-714)/Rrs(660-670)
Chl
-a
y = 35.2x4.37
R2 = 0.81N = 5498
0 20 40 60 800
20
40
60
80
SIOCS S2-MSI Chl-a
CHL SIOCS µg/l
CH
L m
easu
red
µg/l
R2 = 0.99N = 5059R2 = 0.99N = 5059
MSI SIOCS MSI
OLCI
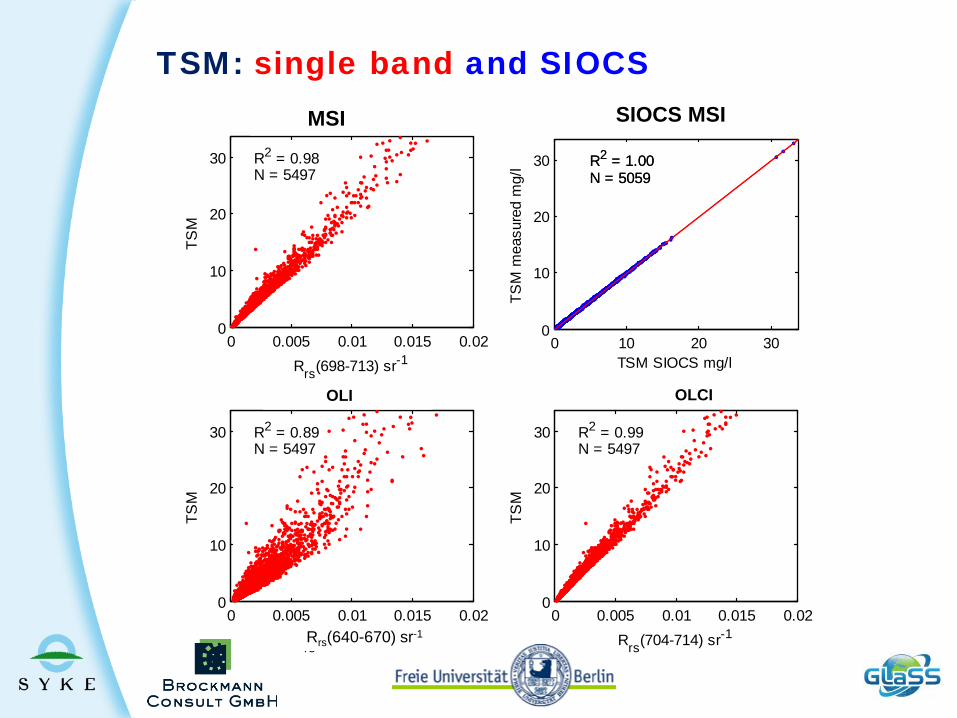
0 0.005 0.01 0.015 0.020
10
20
30
S3-OLCI TSM
Rrs(704-714) sr-1
TSM
R2 = 0.99N = 5497
0 0.005 0.01 0.015 0.020
10
20
30
Landsat8-OLI TSM
Rrs(640-670) sr-1
TSM
R2 = 0.89N = 5497
0 0.005 0.01 0.015 0.020
10
20
30
S2-MSI TSM
Rrs(698-713) sr-1
TSM
R2 = 0.98N = 5497
TSM: single band and SIOCS
12
0 10 20 300
10
20
30
SIOCS S2-MSI TSM
TSM SIOCS mg/l
TSM
mea
sure
d m
g/l R2 = 1.00
N = 5059R2 = 1.00N = 5059
MSI SIOCS MSI
OLI OLCI
Rrs(640-670) sr-1
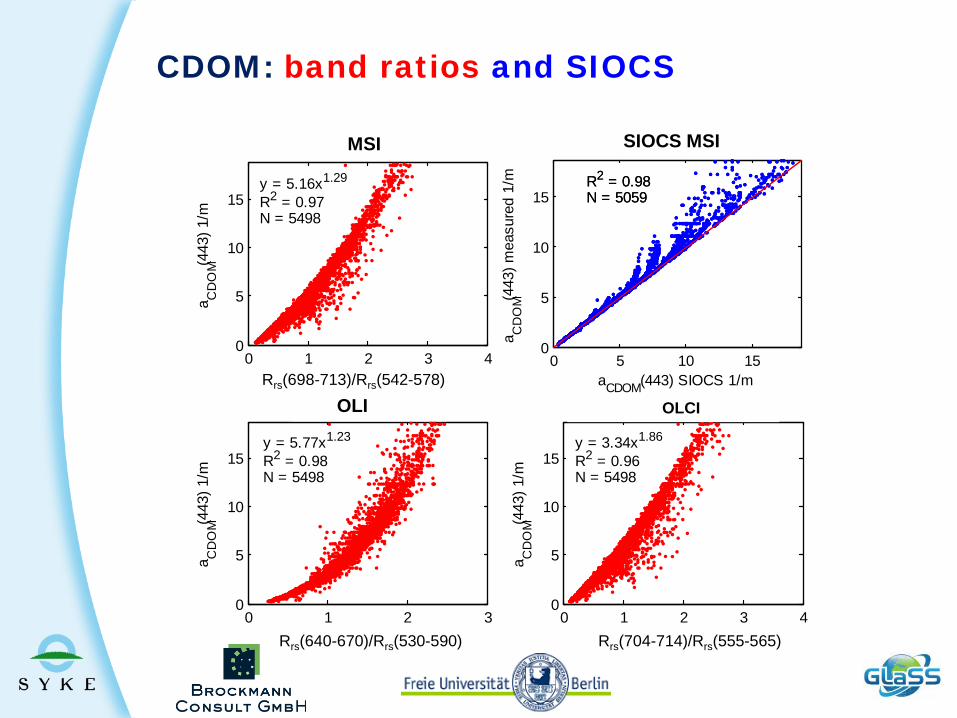
CDOM: band ratios and SIOCS
13
0 1 2 3 40
5
10
15
S2-MSI CDOM
Rrs(705)/Rrs(560)
a CD
OM(4
43) 1
/my = 5.16x1.29
R2 = 0.97N = 5498
0 1 2 30
5
10
15
Landsat8-OLI CDOM
Rrs(665)/Rrs(560)
a CD
OM(4
43) 1
/m
y = 5.77x1.23
R2 = 0.98N = 5498
0 1 2 3 40
5
10
15
S3-OLCI CDOM
Rrs(709)/Rrs(560)
a CD
OM(4
43) 1
/m
y = 3.34x1.86
R2 = 0.96N = 5498
0 5 10 150
5
10
15
SIOCS S2-MSI aCDOM(443)
aCDOM(443) SIOCS 1/m
a CD
OM(4
43) m
easu
red
1/m R2 = 0.98
N = 5059R2 = 0.98N = 5059
SIOCS MSI MSI
OLI OLCI
Rrs(698-713)/Rrs(542-578)
Rrs(640-670)/Rrs(530-590) Rrs(704-714)/Rrs(555-565)
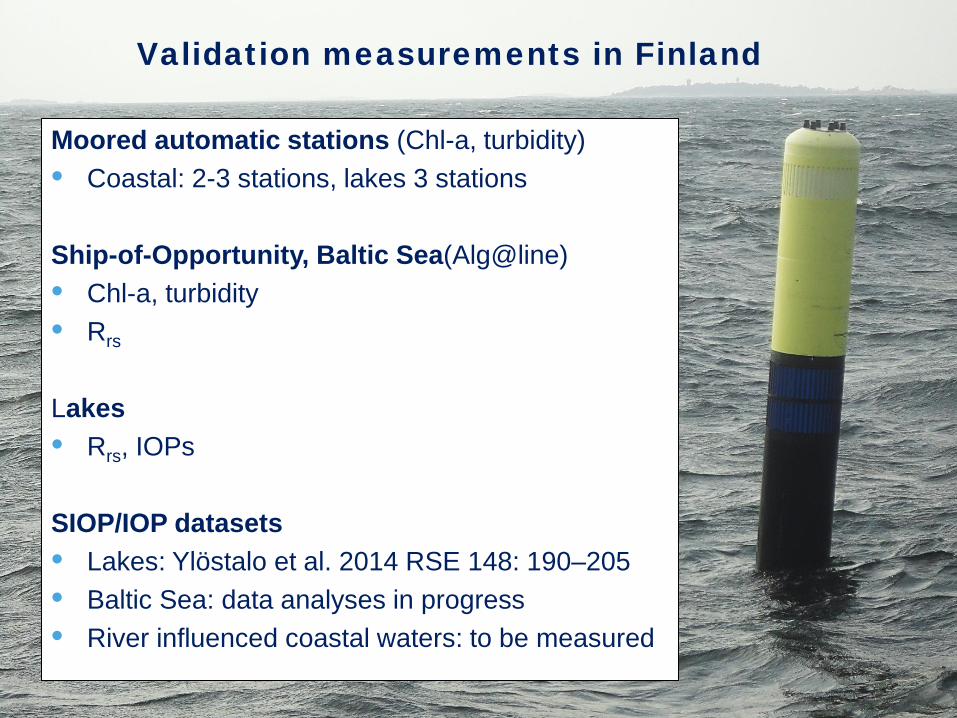
Moored automatic stations (Chl-a, turbidity) • Coastal: 2-3 stations, lakes 3 stations
Ship-of-Opportunity, Baltic Sea(Alg@line) • Chl-a, turbidity • Rrs
Lakes • Rrs, IOPs
SIOP/IOP datasets • Lakes: Ylöstalo et al. 2014 RSE 148: 190–205 • Baltic Sea: data analyses in progress • River influenced coastal waters: to be measured
Validation measurements in Finland

• WFD ecological classification (Chl-a, transparency)
• Estimation of the impact of water protection measures (Chl-a, turbidity)
• Mapping of areas influenced by river plumes (turbidity)
• Macrophyte mapping (e.g. common reed belts)
• Bottom refrectance may become a limiting factor in part of the coastal and lake environments
S2-MSI data will help in
• High resolution data of S2 MSI can cover all the Finnish coastal waters and lakes.
• S2 MSI improves the estimation accuracy of TSM
compared to the currently operational HighRes sensors and is likely to enable the estimation of Chl-a.
• SIOCS will be improved e.g. by testing different options for the initial guess values.
• The SIOCS spectral inversion algorithm will be very useful enables e.g. local SIOP adjustment improved regional/local products.
Conclusions
Thank you!