separation of xylose from glucose- xylose solution …umpir.ump.edu.my/id/eprint/8825/1/cd...
TRANSCRIPT
III
SEPARATION OF XYLOSE FROM GLUCOSE-
XYLOSE SOLUTION USING ION EXCHANGE
RESINS
MOHAMMAD AIZZAT BIN NAWI
Thesis submitted in partial fulfilment of the requirements
for the award of the degree of
Bachelor of Chemical Engineering (Biotechnology)
Faculty of Chemical & Natural Resources Engineering
UNIVERSITI MALAYSIA PAHANG
JUNE 2013
©MOHAMMAD AIZZAT BIN NAWI (2013)
VIII
ABSTRACT
In this present study 5 different types of ion-exchange resins were used to separate
xylose from glucose-xylose mixture. The resins were strong base cation (SBC), strong
acid cation (SAC) and weak acidic cation (WAC) with same ion forms of H+. Glucose
and xylose were measured using single-component isotherms and being measured at
20oC, 30
oC and 40
oC. The concentration of the glucose-xylose mixtures are 0.5g/L,
1.0g/L and 1.5g/L. The composition of mixture of glucose-xylose also being varies 1:1,
1:9 and 9:1. The entire sample is being tested at different rotation speeds which are
110rpm, 160rpm and 210rpm. The wavelength is set at 620nm for this experiment. All
the data obtained from 5 different resins were described in linear isotherms. The result
of each resins were compared based on their adsorption capabilities towards those
sugar. From the result gathered, Dowex M-31 shows highest separation of glucose from
the glucose-xylose mixture. The optimum temperature and rotation is 30oC and 160rpm
respectively.
IX
ABSTRAK
Di dalam kajian ini 5 jenis resin pertukaran ion telah digunakan untuk memisahkan
xylose daripada campuran glukosa-xylose. Resin adalah kation kuat asas (SBC), kation
asid kuat (MPS) dan kation berasid lemah (WAC) dengan bentuk ion sama H +.
Glukosa dan xylose diukur dengan menggunakan isoterma satu komponen dan yang
diukur pada 20oC, 30oC dan 40oC. Kepekatan campuran glukosa xylose adalah 0.5g /
L, 1.0g / L dan 1.5g / L. Komposisi campuran glukosa xylose juga berbeza 1:1, 1:09 dan
9:01. Keseluruhan sampel yang diuji pada kelajuan putaran yang berbeza yang 110rpm,
160rpm dan 210rpm. Panjang gelombang yang ditetapkan pada 620nm bagi eksperimen
ini. Semua data yang diperoleh daripada 5 resin yang berbeza telah diterangkan dalam
isoterma linear. Hasil setiap damar dibandingkan berdasarkan keupayaan penjerapan
mereka ke arah mereka gula. Dari hasil yang dikumpulkan, Dowex M-31 menunjukkan
pemisahan tertinggi glukosa daripada campuran glukosa xylose. Suhu optimum dan
putaran adalah 30oC dan 160rpm.
X
TABLE OF CONTENTS
SUPERVISOR’S DECLARATION ............................................................................... IV
STUDENT’S DECLARATION ...................................................................................... V
Dedication ....................................................................................................................... VI
ACKNOWLEDGEMENT ............................................................................................. VII
ABSTRACT ................................................................................................................... VII
ABSTRAK ...................................................................................................................... IX
TABLE OF CONTENTS ................................................................................................ IX
LIST OF FIGURES ....................................................................................................... XII
LIST OF TABLES ......................................................................................................... XII
LIST OF ABBREVIATIONS ..................................................................................... XIIII
1 INTRODUCTION.....................................................................................................1
1.1 Motivation and statement of problem ................................................................ 1
1.2 Objectives ........................................................................................................... 2
1.3 Scope of this research ......................................................................................... 2
1.4 Organisation of this thesis .................................................................................. 3
2 LITERATURE REVIEW ......................................................................................... 4
2.1 Xylose ................................................................................................................ 4
2.2 Glucose ............................................................................................................... 5
2.3 Ion exchange resin .............................................................................................. 6
2.4 Analysis methods ............................................................................................. 10
2.4.1 Anthrone reaction...........................................................................................10
2.4.2 High performance liquid chromatography (HPLC).......................................10
2.4.3 DNS method...................................................................................................10
2.5 Separation process ........................................................................................ ....11
2.5.1 Previous works on separation of xylose and glucose......................................11
2.6 Data collection ......................................................................................... . ......13
2.6.1Ultraviolet visible spectrophotometer.............................................................13
3 MATERIALS AND METHODS ............................................................................ 14
3.1 Overview .......................................................................................................... 14
3.2 Instruments ....................................................................................................... 14
3.3 Chemicals ......................................................................................................... 15
3.4 Experimental procedure ................................................................................... 15
3.4.1 Standard preparation.......................................................................................15
4 RESULT AND DISCUSSION ............................................................................... 16
4.1 Overview .......................................................................................................... 16
4.2 Glucose standard curve ....................................................................................... 16
4.3 The efficiency of resins .................................................................................... 17
4.4 The effect of temperature ................................................................................. 21
5 CONCLUSION ....................................................................................................... 24
5.1 Conclusion........................................................................................................ 24
5.2 Recommendation .............................................................................................. 25
REFRENCES .................................................................................................................. 26
APPENDICES ................................................................................................................ 30
XI
LIST OF FIGURES
Figure 2.1 : D-xylose ........................................................................................................ 4
Figure 2.2 : D-glucose ...................................................................................................... 6
Figure 2.3 : Strong acid resin ............................................................................................ 7
Figure 2.4 : Strong base resin (I) ...................................................................................... 7
Figure 2.5 : Strong base resin (II) ..................................................................................... 7
Figure 2.6 : Weak base resin ............................................................................................. 7
Figure 2.7 : Schematic representation of an IER bead ..................................................... 8
Figure 3.1 : UV-Vis spectrophotometer ......................................................................... 14
Figure 4.1 : Glucose standard curve.................................................................................17
Figure 4.2 : Resin efficiency ........................................................................................... 20
Figure 4.3 : Final xylose concentration (0.5g/L) ............................................................ 21
Figure 4.4 : Final xylose concentration (1.0g/L) ............................................................ 22
Figure 4.5 : Final xylose concentration (1.5g/L) ............................................................ 23
Figure A-1 : Preparation of glucose standard curve ....................................................... 30
Figure A-2 : 0.5g resins were placed inside the centrifuge tubes ................................... 30
XII
LIST OF TABLES
Table 2.1: Physical characteristics and size measures of D-xylose...................................5
Table 2.2: Physical characteristics and size measures of D-glucose.................................6
Table 2.3: Dowex M-31(H+).............................................................................................8
Table 2.4: Dowex MAC-3 (H+)........................................................................................8
Table 2.5: Dowex Maraton MSC (H+)..............................................................................9
Table 2.6: Amberlite IRN150 (H+)...................................................................................9
Table 2.7: Amberlite IRC86 (H+).....................................................................................9
Table 4.1: Absorbance reading from UV-Vis spectrophotometer (Glucose)..................16
Table 4.2: Optical density at 30oC (160rpm)...................................................................18
Table 4.3: Final xylose concentration (0.5g/L)...............................................................29
Table 4.4: Final xylose concentration (1.0g/L)...............................................................30
Table 4.5: Final xylose concentration (1.5g/L)...............................................................30
Table A-1: Optical density at 20oC (110rpm).................................................................31
Table A-2: Optical density at 20oC (160rpm).................................................................32
Table A-3: Optical density at 20oC (210rpm).................................................................33
Table A-4: Optical density at 30oC (110rpm).................................................................34
Table A-5: Optical density at 30oC (210rpm).................................................................35
Table A-6: Optical density at 40oC (110rpm).................................................................36
Table A-7: Optical density at 40oC (160rpm).................................................................37
Table A-8: Optical density at 40oC (210rpm).................................................................38
XIII
LIST OF ABBREVIATIONS
% Percentage
oC Degree Celcius
µm Micrometer
g Gram
g/L Gram per liter
HPLC High Performance Liquid Chromatography
IER Ion exchange resin
L Liter
mL Milliliter
nm Nanometer
OD Optical density
SAC Strong acidic cation
SBC Strong basic cation
UV-Vis Ultraviolet visible
WAC Weak acidic cation

1
1 INTRODUCTION
1.1 Motivation and problem statement
Xylose is an intermediate product of xylitol which is a substitute sugar with numerous
benefits compare to the normal sugar. It has anticariogenic properties which is a great
concern of food industry and biomedical sector. It can be found in woody materials such
as saw dust and other hard wood residues (Lei et al., 2007).
Xylose can be found around 25% - 35% by weight of the woody biomass and compose
inside the hemicelluloses. Woody materials compose of hemicelluloses, cellulose and
lignin. Around 50% of cellulose is glucose. Xylitol is hard to harvest abundantly due to
the high percentage of glucose in woody materials. So, it is suggested the xylose and
glucose to be separated using chromatography method. The glucose is expected to be
trapped inside the ion-exchange resin and high percentage of xylose will be recovered in
permeate.
Xylose is very useful material in biomedical and bioethanol industries. For bioethanol
industries, it can be used as fuel additive which can be produced by fermentation
method from agricultural feedstock and crop residues such as corn, sugarcane and other
carbon-based sources. Xylose and glucose is the most abundant polysaccharides that
can be found in plant cell embedded in cellulose and hemicelluloses. However, xylose
cannot be converted efficiently to bioethanol in industrial scale in the present of
glucose. (Bi et al., 2010)
The xylose and glucose has almost similar characteristic including its size which is
0.68nm for xylose and 0.72nm for glucose respectively (Sjoman et al., 2007). Ion
exchange resin method is the chosen process in separation of glucose-xylose mixtures
by using 5 different types of resins. Thus, this research is aims to search the best resin in
separating the glucose-xylose mixtures by gaining highest xylose concentration the final
sample.
2
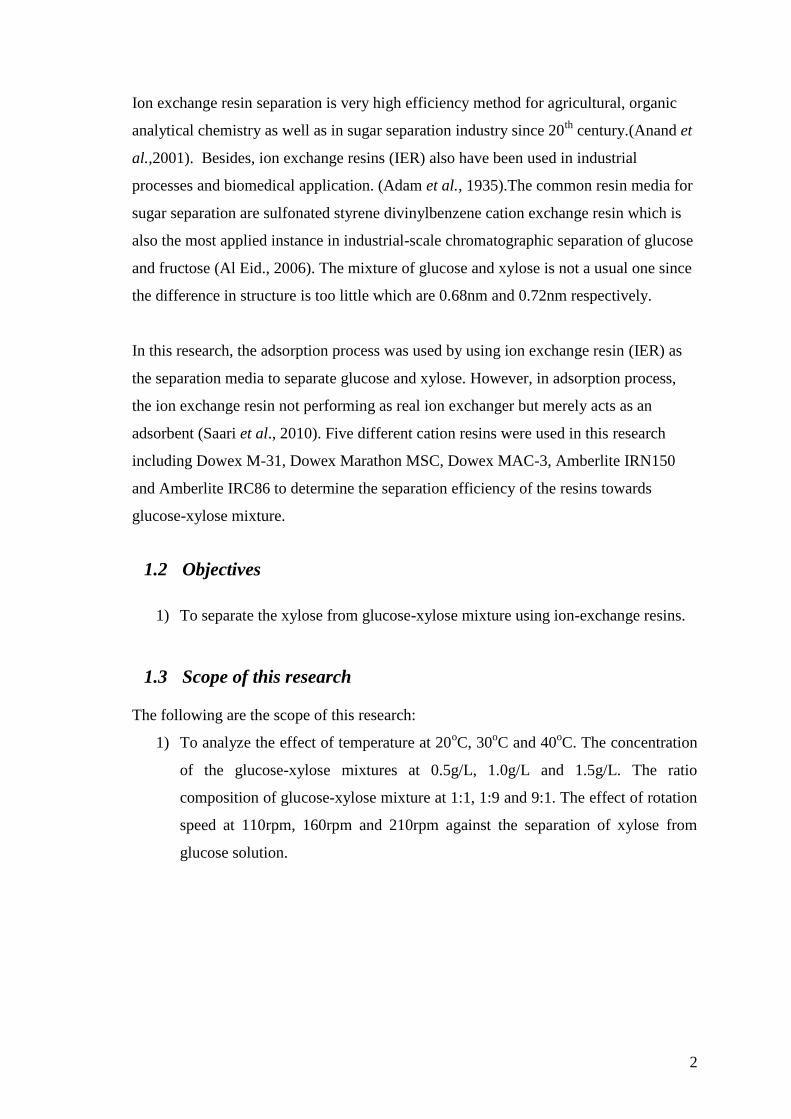
Ion exchange resin separation is very high efficiency method for agricultural, organic
analytical chemistry as well as in sugar separation industry since 20th
century.(Anand et
al.,2001). Besides, ion exchange resins (IER) also have been used in industrial
processes and biomedical application. (Adam et al., 1935).The common resin media for
sugar separation are sulfonated styrene divinylbenzene cation exchange resin which is
also the most applied instance in industrial-scale chromatographic separation of glucose
and fructose (Al Eid., 2006). The mixture of glucose and xylose is not a usual one since
the difference in structure is too little which are 0.68nm and 0.72nm respectively.
In this research, the adsorption process was used by using ion exchange resin (IER) as
the separation media to separate glucose and xylose. However, in adsorption process,
the ion exchange resin not performing as real ion exchanger but merely acts as an
adsorbent (Saari et al., 2010). Five different cation resins were used in this research
including Dowex M-31, Dowex Marathon MSC, Dowex MAC-3, Amberlite IRN150
and Amberlite IRC86 to determine the separation efficiency of the resins towards
glucose-xylose mixture.
1.2 Objectives
1) To separate the xylose from glucose-xylose mixture using ion-exchange resins.
1.3 Scope of this research
The following are the scope of this research:
1) To analyze the effect of temperature at 20oC, 30
oC and 40
oC. The concentration
of the glucose-xylose mixtures at 0.5g/L, 1.0g/L and 1.5g/L. The ratio
composition of glucose-xylose mixture at 1:1, 1:9 and 9:1. The effect of rotation
speed at 110rpm, 160rpm and 210rpm against the separation of xylose from
glucose solution.

3
1.4 Organisation of this thesis
The structure of the reminder of the thesis is outlined as follow:
Chapter 2 provides a description of physical characteristic of the raw material, xylose
and glucose. This chapter also provides a brief discussion about the benefit of xylitol
and application of it. A description of the methods that have been use to separate those
sugars was included in this chapter. Other than that, a brief description of apparatus and
solvent was explained in this chapter.
Chapter 3 gives a review of the method and preparation used in this project. The step
was finalized and done accordingly. A detailed step is included in this chapter. The
precaution was necessarily taken to avoid accidents from occur.
Chapter 4 is devoted to the results that were obtained from this project. The calculation
was included to show the different effect of the parameter.
Chapter 5 draws together a summary of the thesis and outlines the future work which
might be derived from the model developed in this work.
4
2 LITERATURE REVIEW
2.1 Xylose
There are several sources of xylose including in woody materials such as saw dust and
other hard wood residues (Bi et al., 2009). Because of that reason xylose is commonly
obtain from the woody material since it is cheaper and easier to get. Xylose can be
found around 25% - 35% by weight of the woody biomass and compose inside the
hemicelluloses (Sjoman et al.,2007). Xylose is the raw material to produce xylitol by
catalytic hydrogenation (Baudel et al., 2005) or microbial conversion (Granstrom et al.,
2008) which is an alternative high-added-value sweetener with anticariogenic properties
of food industry and biomedical sector. Xylitol is a high value sweetener with a five
carbon alcohol sugar (Barbosa et al., 1988).
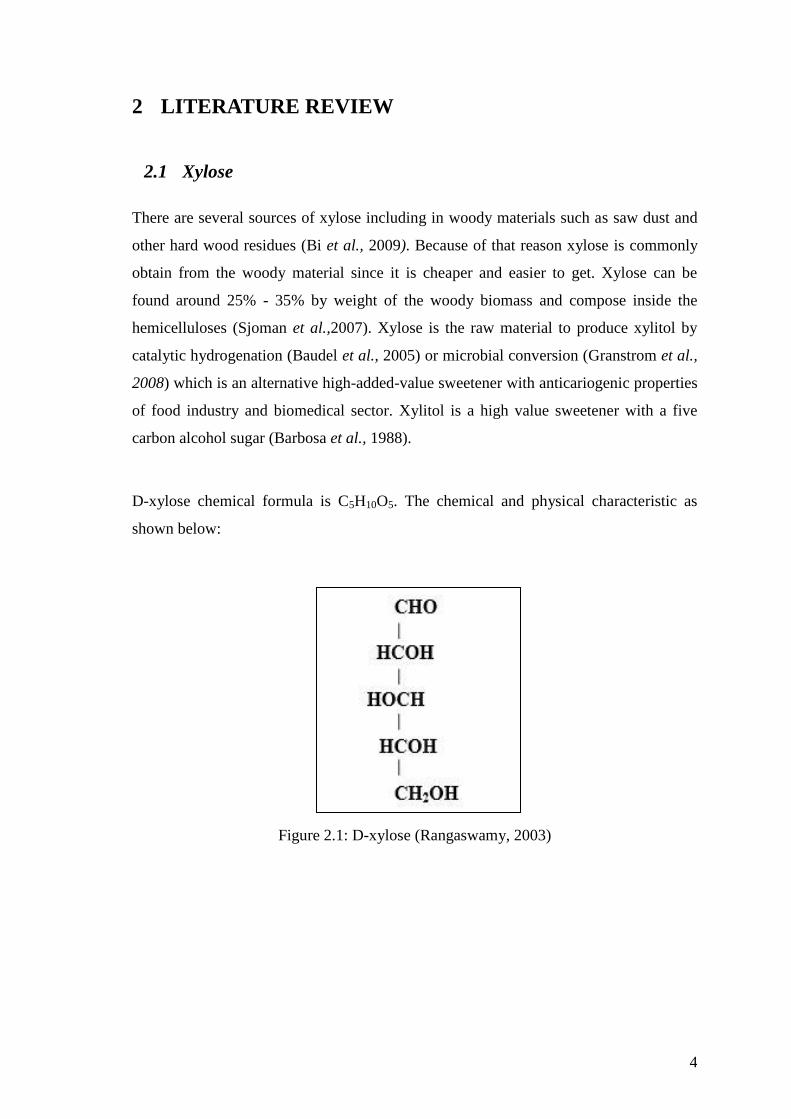
D-xylose chemical formula is C5H10O5. The chemical and physical characteristic as
shown below:
Figure 2.1: D-xylose (Rangaswamy, 2003)

5
Table 2.1: Physical characteristics and size measures of D-Xylose (Sjoman et al., 2007)
D-xylose
Molar mass (g mol-1
) 150.3
pKa 12.26
Diffusion coefficient at 25oC ( x 10
-6 cm
2 s
-1) 7.495
Stokes diameter (nm) 0.65
Equivalent molar diameter (nm) 0.68
Molar volume at normal boiling point (cm3 mol
-1) 155.0
Van der Waals volume (cm3 mol
-1) 73.6
Hydration number in aqueous solution at 298K 6.8
Solubility parameter 31.0
2.2 Glucose
The glucose can be found in most woody plant. It is the main fuel for the cellular
respiration and other biochemical process. Glucose is the main compound that needed
inside the cell in order to give energy and it is important for the metabolism of the cell
(Wooly et al., 1998). The molar mass of glucose molecule is 180gmol-1
and the
diameter is 0.72 nm which is slightly bigger than xylose, 0.68 nm. Table 2 shows
physical characteristics and some of size measure of glucose.
Glucose also known as aldohexose which contain six carbon atoms in its molecules.
The aldohexose sugar can be divided into two isomers known as D-glucose and L-
glucose. D-glucose is biologically active but L-glucose cannot be used by cells. Glucose
consumed by cell in living things and deposited directly into the bloodstream and
transferred throughout the body which helps to supply the energy to the body
(Lutz.,2010).
6
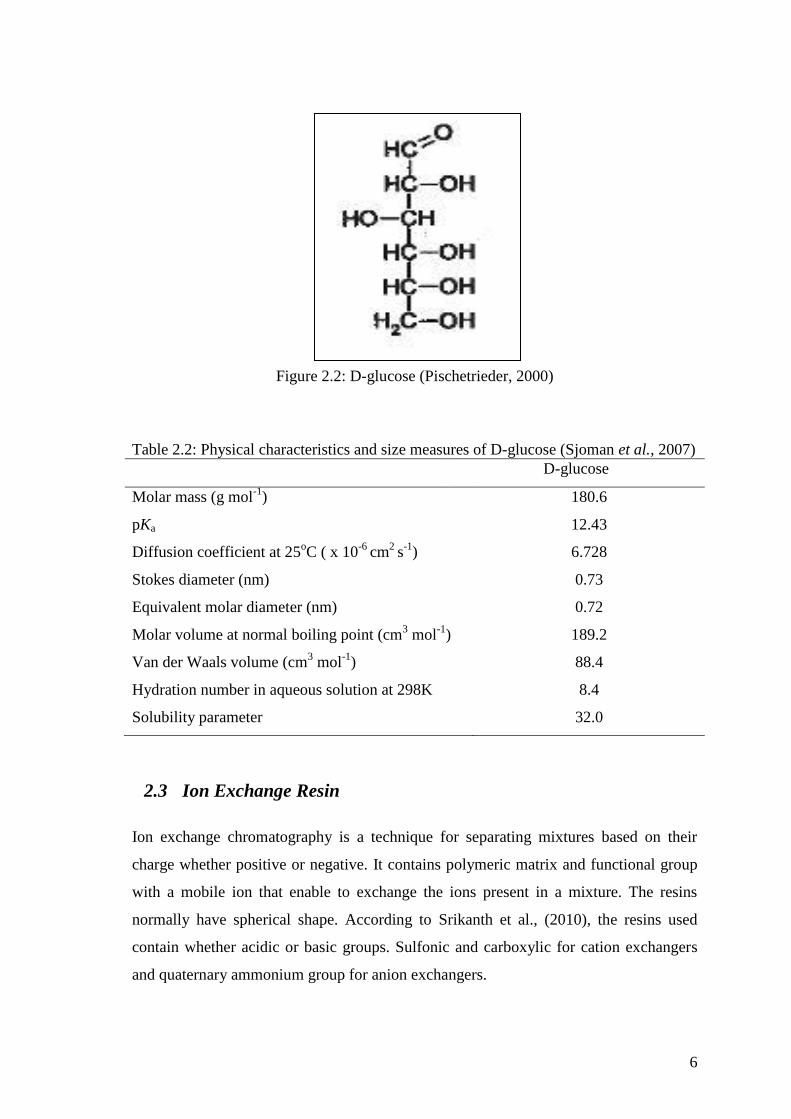
Figure 2.2: D-glucose (Pischetrieder, 2000)
Table 2.2: Physical characteristics and size measures of D-glucose (Sjoman et al., 2007)
D-glucose
Molar mass (g mol-1
) 180.6
pKa 12.43
Diffusion coefficient at 25oC ( x 10
-6 cm
2 s
-1) 6.728
Stokes diameter (nm) 0.73
Equivalent molar diameter (nm) 0.72
Molar volume at normal boiling point (cm3 mol
-1) 189.2
Van der Waals volume (cm3 mol
-1) 88.4
Hydration number in aqueous solution at 298K 8.4
Solubility parameter 32.0
2.3 Ion Exchange Resin
Ion exchange chromatography is a technique for separating mixtures based on their
charge whether positive or negative. It contains polymeric matrix and functional group
with a mobile ion that enable to exchange the ions present in a mixture. The resins
normally have spherical shape. According to Srikanth et al., (2010), the resins used
contain whether acidic or basic groups. Sulfonic and carboxylic for cation exchangers
and quaternary ammonium group for anion exchangers.

7
The resins also can be classified into 4 types which are strong acid cation, weak acid
cation, strong base anion and weak base anion. The schematic diagram of SAC, SBA
and WBA as follow:
Figure 2.3: Strong acid resin Figure 2.4: Strong base resin (I)
(DOW Company, 2002) (DOW Company, 2002)
Figure 2.5: Strong base resin (II) Figure 2.6: Weak base resin
(DOW Company, 2002) (DOW Company, 2002)
The media contain positively or negatively charged functional groups such as K+, Ca
2+,
Na+, H
+ (cation) and Cl
-, NO3
-, SO4
2- (anion) which attached to the divinylbenzene
skeleton. However, 5 resins used in the experiment contain H+
functional group. The
compound that has opposite charge to the functional group will be adsorbed and
retained inside the resin. On the other hand, the compound that has similar or no charge
will pass through the resin and eluted from the column. The compound adsorbed can be
eluted for further investigation.
8
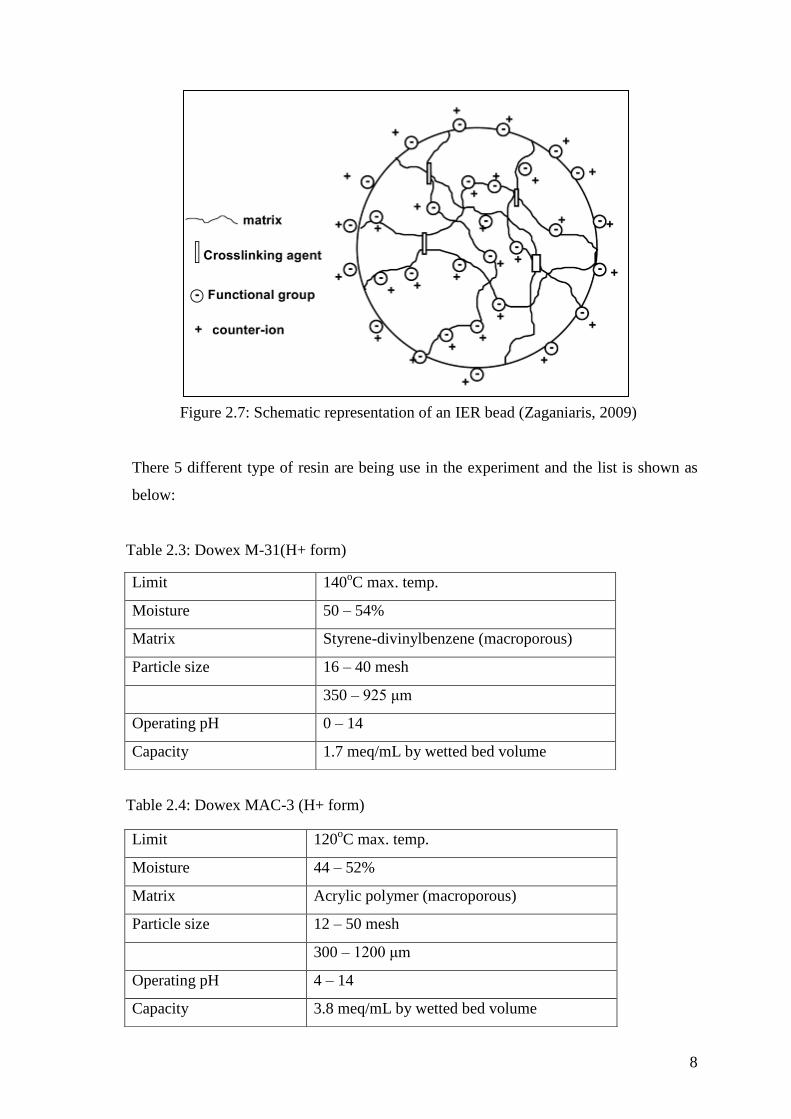
Figure 2.7: Schematic representation of an IER bead (Zaganiaris, 2009)
There 5 different type of resin are being use in the experiment and the list is shown as
below:
Table 2.3: Dowex M-31(H+ form)
Table 2.4: Dowex MAC-3 (H+ form)
Limit 140oC max. temp.
Moisture 50 – 54%
Matrix Styrene-divinylbenzene (macroporous)
Particle size 16 – 40 mesh
350 – 925 μm
Operating pH 0 – 14
Capacity 1.7 meq/mL by wetted bed volume
Limit 120oC max. temp.
Moisture 44 – 52%
Matrix Acrylic polymer (macroporous)
Particle size 12 – 50 mesh
300 – 1200 μm
Operating pH 4 – 14
Capacity 3.8 meq/mL by wetted bed volume
9
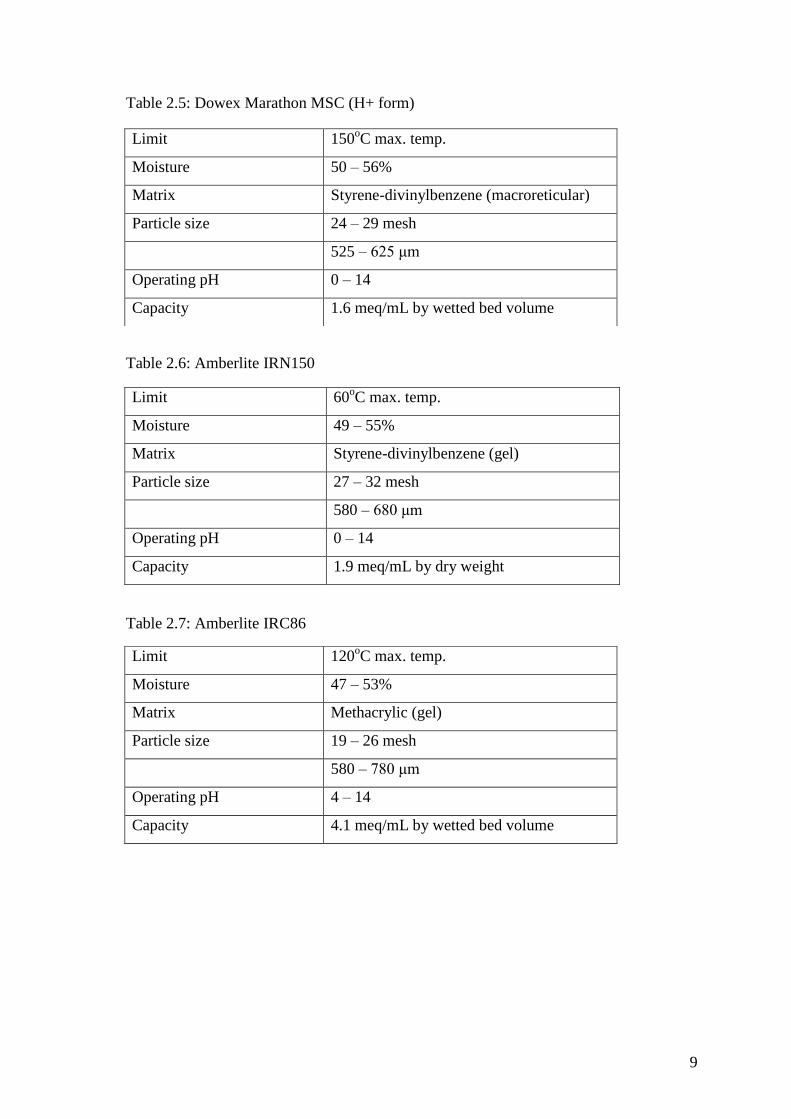
Table 2.5: Dowex Marathon MSC (H+ form)
Table 2.6: Amberlite IRN150
Table 2.7: Amberlite IRC86
Limit 150oC max. temp.
Moisture 50 – 56%
Matrix Styrene-divinylbenzene (macroreticular)
Particle size 24 – 29 mesh
525 – 625 μm
Operating pH 0 – 14
Capacity 1.6 meq/mL by wetted bed volume
Limit 60oC max. temp.
Moisture 49 – 55%
Matrix Styrene-divinylbenzene (gel)
Particle size 27 – 32 mesh
580 – 680 μm
Operating pH 0 – 14
Capacity 1.9 meq/mL by dry weight
Limit 120oC max. temp.
Moisture 47 – 53%
Matrix Methacrylic (gel)
Particle size 19 – 26 mesh
580 – 780 μm
Operating pH 4 – 14
Capacity 4.1 meq/mL by wetted bed volume
10
2.4 Analysis Method
2.4.1 Anthrone Reaction
This is used for quantitative analysis of sugars. It is a method for determining the
amount of carbohydrate in a given sample (Cerning-Beroard., 1975). This method is
less expensive compare to High Performance Liquid Chromatography (HPLC). Specific
amount of processed sugar mixture was mixed with anthrone solution and heated in
boiling water. The sample is case was covered to avoid the liquid from vaporised into
the atmosphere. Then the sample was analyzed by using UV-Vis spectrophotometer at
wavelength of 620nm.Anthrone was added to the concentrated sulphuric acid to produce
anthrone solution. The glycosidic bond in the sugar mixture will be hydrolyzed to form
monosaccharides and caused the solution to turn into blue-green colour.
2.4.2 High Performance Liquid Chromatography (HPLC)
HPLC is the best equipment to analyze the carbohydrate in a solution. It has very high
sensitivity and accuracy. The solution contained target molecule is injected into the
mobile phase and being detected by detector in the equipment. The output of the
detector is an electrical signal which displayed on the computer’s screen (Lindsay,
1992). The disadvantages of the HPLC are the column is very expansive, short
operating life, solvents are expensive and difficult to dispose the used solvent.
(McMaster, 2007).
2.4.3 Dinitrosalicyclic acid Method (DNS)
The dinitrosalicyclic acid (DNS) method is the method that gives a rapid and simple
estimation of the extent of saccharification by measuring the total amount of reducing
sugar in the hydrolysate (Warwik et al., 2007). DNS method also use of xylose standard
curve as a standard to determine the amount of reducing sugar released (Bailey et al.,
1992). This method is simple, less expansive and suitable to use for large number of
samples at a time.
11
2.5 Separation Process
Separation is a process which compounds or materials of interest are removed from the
other compounds in the sample that may react similarly and interfere with a quantitative
determination.
2.5.1 Previous works on xylose and glucose separation
1) To separate xylose from monosaccharide mixtures, the adsorption
equilibrium of glucose, xylose, and arabinose on five different resins is
investigated.The selectivity and adsorption amounts of all the monosaccharide
towards 5 different resins were compared. The resins went through the
pretreatment process first, and then extraparticle liquid was removed by
centrifugation process. The resins and monosaccharides were weighed
precisely and poured inside a flask (25mL). The flasks were hermetically
sealed and placed inside a tempered shaker at 160rpm at 25oC for 12 hours.
Then, the quantification process of the monosaccharide was carried out by
using HPLC. The mobile phase used is deionized and degassed water. The dry
substance content of the resin was determined by drying until constant weight
in a vacuum dying oven at 80oC. (Huajie et al., 2010)
2) The separation was carried out at 60oC for the best performance of the
anion-exchange resin. The sucrose-based mixtures were inverted and separated
at 45oC to avoid the sugar from caramelized. The flow rates were chosen with
previous experience of cation resins. The unit was operated continuously for
10 to 12 cycles for 6 hours to ensure pseudo-equilibrium state was achieved.
The product was weighed and analysed at the end of each cycle. The
concentration of products was monitored versus time. Then, the column was
purged separately to determine the quantity of sugar retained by each column.
(Barker et al., 1984)
12
2) Two types of polymeric adsorbents which are Dowex99 and poly(4-vinyl
pyridine)(PVP) was used to recover sugars from corn-stover hydrolyzate. The
main component of the hydrolyzate are 5 sugars, glucose, mannose, xylose,
galactose, and arabinose, and four impurities, sulphuric acid, acetic acid,
hydroxylmethyl furfural (HMF), and furfural. The Dowex99 and the five
sugars are packed inside the chromatography column, “center-cut”. The
sulphuric acid elutes earlier and the other impurities elute later than the sugar.
For the column packed with the PVP, the sugars elute earlier than the
impurities. The intrinsic adsorption and mass transfer parameter of the sugars
and impurities were obtained from elution and frontal chromatography tests
on single component. The simulations based on the detailed rate model and
single component intrinsic parameter is in close agreement with the
experimental elution chromatograms of the hydrolyzate. By using batch
chromatography processes the hydrolyzate sugars are recovered and then
fermented with genetically engineered yeast. (Xie et al., 2005)
3) The feed solutions were made of glucose and xylose with different mass
ratios and total monosaccharide concentrations. The ratios of glucose to
xylose in the solutions were 9:1, 1:1 and 1:9 respectively. For the
monosaccharides concentration it is set at 2, 10 and 30 wt. %. There are 3
types of membranes used in the experiment which are Desal-5 DK, -DL and
NF270. The filtration processes were done in total reflux mode (both retentate
and permeate were recycled back to the feed tank) at 50oC and the pressure
varies from 2 to 40 bar. ( SjÖman et al., 2007)
4) The xylose and glucose were separated using silica-confined ionic liquid (IL)
stationary phase. Five different stationary phases were synthesized and
characterized respectively. Compare to NH2 column, the imidazolium
stationary phases exhibit more effective retention to the glucose and xylose.
As the concentration of the acetonitrile decrease, the retention factor and
resolution of the monosaccharides also decreases. Moreover, the xylose and
glucose also being studied on their adsorption behavior. Then, both
temperature and mobile phase were optimized in order to improve the
performance for the separation of the monosaccharides (Bi et al., 2010).
13
2.6 Data Collection
2.6.1 Ultraviolet – Visible Spectrophotometer (UV-Vis)
After the sample placed in the incubator shaker for 12h, the samples were analyzed with
anthrone reaction solution in 1:4 ratio. Then the samples were put in acuvette and the
optical density measured using untraviolet-visible spectrometry (UV-Vis). Thus,
ultraviolet-visible spectrometry (UV-Vis) method will be used. Ultraviolet-visible
spectrometry (UV-Vis) refers to absorption of spectroscopy or reflectance spectroscopy
in the ultraviolet-visible spectral region. The absorption or reflectance in the visible
range directly affects the perceived colour of the chemical involved. In this region of the
electromagnetic spectrum, molecules undergo electronic transition. The method is most
often used in a quantitative way to determine concentration of an absorbing species in
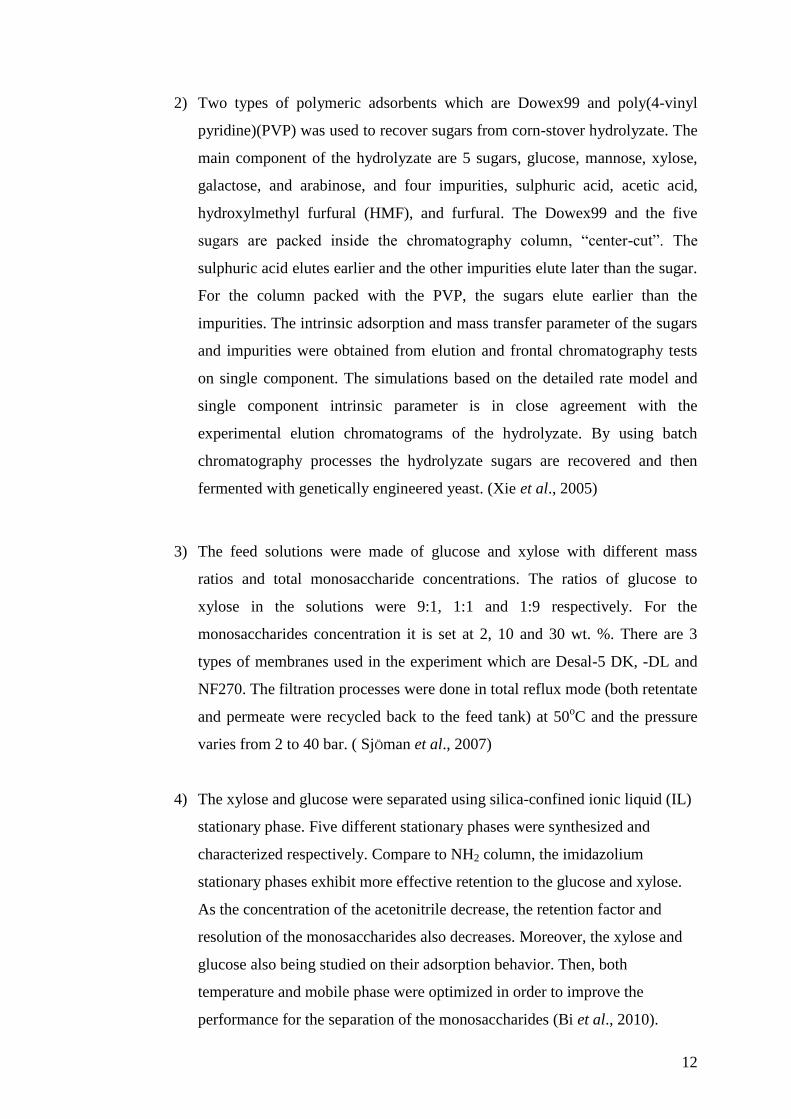
solution, using the Beer – Lambert law. (Williams et al., 2011):
Where A is the measured absorbance with AU as the unit. Io is the intensity of the
accident light at a given wavelength and I is the transmitted intensity. L is the
pathlength through the sample and c is the concentration of the absorbing species.
In the experiment the wavelength used is 680nm which is the most suitable as anthrone
method is used to determine the sugar concentration in the final sample.
.

14
3 MATERIALS AND METHODS
3.1 Overview
This chapter describes the materials and methods employed for the separation process
xylose from glucose solution using ion-exchange resins. It begins with the preparation
of sugar samples in different concentration. The sugar mixture undergo the experiment
with different rotation speed and temperature Then, follow by incubation and
centrifugation process before test it with UV-Vis spectrophotometer.
3.2 Instruments
The anthrone solution was prepared in a 100 mL volumetric flask. 100 mL concentrated
sulphuric acid (H2SO4) was mixed with 0.2g anthrone powder to produce anthrone
solution. Besides, this experiment also used UV-Vis spectrophotometer in determining
the isotherms of each samples.
Figure 3.1: UV-Vis spectrophotometer
15
3.3 Chemicals
Anthrone, sulphuric acid (concentrated), D-glucose and D-xylose were purchased from
Sigma Aldrich, Malaysia.
3.4 Experimental Procedure
The main materials used in the experiment are D-xylose and D-glucose. Both sugars
were mixed in different concentration (0.5 g/L, 1.0 g/L and 1.5 g/L). The resin was
precisely weighed and added with the sugar mixtures. The glucose-xylose mixtures
were placed in incubator shaker at certain speed (110rpm, 160rpm and 210rpm). The
glucose-xylose mixtures also being tested at different temperatures(20oC, 30
oC and
40oC). Moreover, the samples were also tested in different ratio (1:1, 9:1 and 1:9). Then,
the samples were allowed in the incubator shaker for 12h.Then, the sample was filtered
using 0.2μm filter to separate glucose-xylose mixture from the resin beads. Then, the
glucose-xylose mixtures were diluted with ultrapure water in 1:9 ratio (1mL sugar
mixture + 9mL ultrapure water). Then, diluted samples were added with anthrone
solution in 1:4 ratio (1mL sample + 4mL anthrone). The samples were covered with cap
and placed in boiling water for 10 minutes before let it cooled at room temperature.
Then, the samples were tested with UV-Vis spectrophotometer at wavelength of 620nm
and the curve of each samples with different parameters were constructed.
3.4.1 Standard Preparation
Glucose standard is prepared in 3 different concentrations (0.5 g/L, 1.0 g/L and 1.5 g/L).
For each concentration the standard curve is plotted as the guide for the samples result.
The xylose and glucose solution at 1.5g/L is added at different volume and
being check using UV-Vis for the absorption wavelength as the standard for
the samples.

16
4 RESULT AND DISCUSSION
4.1 Overview
This chapter discussed the experimental results that carried out in the research work.
The material discussed in this chapter includes the effect of different parameters and the
sugar concentration after being tested with different conditions. Other than that, this
chapter also discussed the experimental result tested using UV-Vis analysis method.
Then, each of the results was discussed thoroughly and justified accordingly.
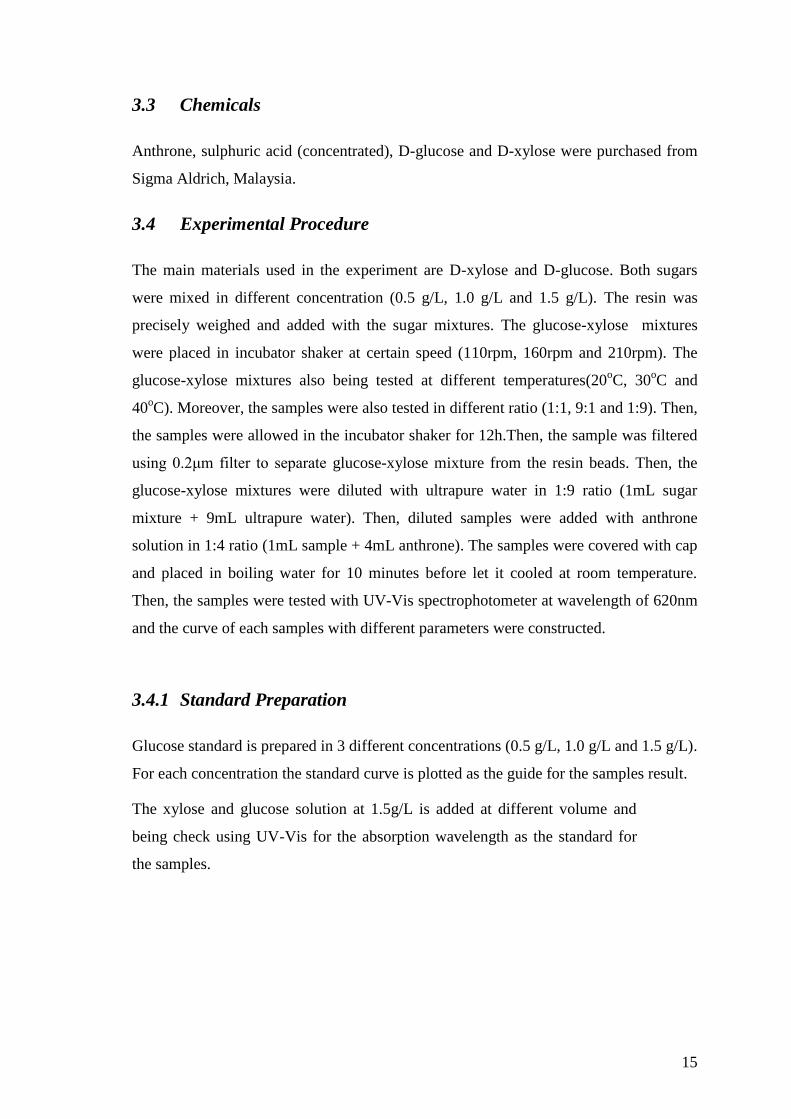
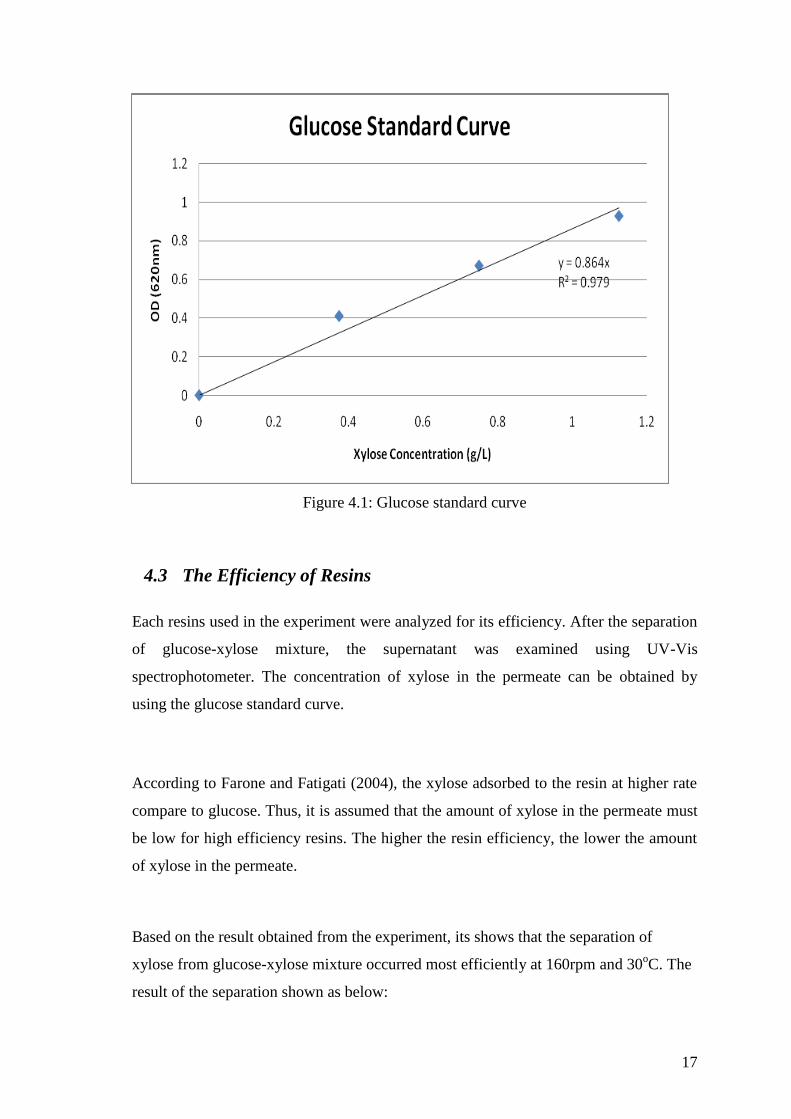
4.2 Glucose Standard Curve
The glucose standard curve with concentration of 0.375g/L, 0.750g/L and 1.125g/L was
plotted in figure 4.1 below by using the data in the table 4.1 obtained during the
experiment. From figure 4.1, linear equations for glucose concentration were obtained
as follows in equation 4.1:
Y = mX + C (4.1)
Table 4-1: Absorbance reading from UV-Vis spectrophotometer (Glucose)
Glucose Concentration
(g/L)
Optical density (OD)
Average 1 2 3
0.000 0.000 0.000 0.000 0.000
0.375 0.407 0.411 0.412 0.410
0.750 0.673 0.670 0.671 0.671
17
Figure 4.1: Glucose standard curve
4.3 The Efficiency of Resins
Each resins used in the experiment were analyzed for its efficiency. After the separation
of glucose-xylose mixture, the supernatant was examined using UV-Vis
spectrophotometer. The concentration of xylose in the permeate can be obtained by
using the glucose standard curve.
According to Farone and Fatigati (2004), the xylose adsorbed to the resin at higher rate
compare to glucose. Thus, it is assumed that the amount of xylose in the permeate must
be low for high efficiency resins. The higher the resin efficiency, the lower the amount
of xylose in the permeate.
Based on the result obtained from the experiment, its shows that the separation of
xylose from glucose-xylose mixture occurred most efficiently at 160rpm and 30oC. The
result of the separation shown as below: