september 19-20, 2005© seil 20051 progress summary “dawn” muri review anthony ephremides...
Post on 21-Dec-2015
214 views
TRANSCRIPT

September 19-20, 2005 © SEIL 2005 1
Progress Summary
“Dawn” MURI Review
Anthony EphremidesUniversity of Maryland
Santa Cruz, CASeptember 12, 2006

© HyNet 2006 2
OUTLINE
• Over-Riding Theme: Layer Integration & Theoretical Foundations
– Physical layer incorporation into MAC and beyond
1) Capture
2) Alternative Access/Receiver Comparison
3) Multicast Stability/Capacity
4) Tandem Network Stability/CapacityNetworkCoding

© HyNet 2006 3
(1) On Capture (with J. Wieselthier & G. Nguyen)
• Essence: – Bridging The Gap Of Networking And
Communication-Information-Theoretic Approach To Multiple Access via the SINR Tool
– Correcting Previous Analyses For Capture Probability Derivation

© HyNet 2006 4
Random-Access System
• Collision channel – no capture
• General Multiple-Access channel – all users “succeed”
• In-between: Reception in the presence of interference– SINR-based model
• One or more users can be successful
Receiver

© HyNet 2006 5
Capture Probability
• Capture probability:
– Cn = Pr{at least one transmission is successful
| n simultaneous transmissions}
• Expected number of successful packets in a slot:– Sn = E{number of successful packets | n simultaneous transmissions}
• Multi-Packet reception capability– Depends on detector
Receiver

© HyNet 2006 6
SINR-based Capture Model
• A packet from user j is successful if and only if
b = 0: Perfect capturesingle detector: largest always successfulmultiple detectors: all are successful
b = ∞: No capture (collision channel)when 2 or more transmit, none are successful
SINR( j)P( j)
N P(i)i1,ij
n
b
P(j) = Power at receiving node from user j
b = Threshold that depends on many system parameters (increasing function of rate)
Receiver
j

© HyNet 2006 7
Earlier Work (Zorzi & Rao, JSAC 1994)
• t = test user
• Pn(r0) = Pr{SINR(t) > b | rt = r0}
• h(r0) = pdf of r0 (distance of user to base station)
(*) is not valid for b < 1
Implicitly assumes only one signal can satisfy SINR
Example:
• Propagation loss factor = 4
• Fading and shadowing are present
*which exceeds 1 when
Cn nPr{SINR(t) b} nPn(r0 )h(r0 )dr0
0
1
C
2
b
b
4
2
(*)
00.5
11.5
22.5
33.5
44.5
5
0 0.1 0.2 0.3 0.4 0.5 0.6 0.7 0.8 0.9 1b
C

© HyNet 2006 8
Extend Model toAccommodate All Values of b
Observations• More than one user can satisfy SINR > b when b < 1 Interesting case
• Cn = Pr{one or more users satisfy SINR condition}
= Pr{largest signal satisfies SINR condition}
• Let user M be the one with the largest signal
*Thus, Cn = Pr{SINR(M) > b}
• Since all users are equally likely to be the largest
*Cn = n Pr{SINR(1) > b, M = 1}

© HyNet 2006 9
Analytical Evaluation of Capture Probability
• Cn = n Pr{SINR(1) > b, M = 1} = Pr{SINR(M) > b}
*where M is the user with largest received power
• Example:
*For
• In general,
Cn n 1 ...0
FP max (b x j ),x2 ,x3,..,j2
n
xn
0
0
dFP (x2 )dFP (x3)...dFP (xn )
where
FP is the common cdf of the received power levels (which are i.i.d.)
P( j)PT r , C2
1 if b1
b 2/ if b 1

© HyNet 2006 10
Simulation is Neededto Evaluate Cn
• Users uniformly distributed in disk of radius = 1– No fading or shadowing:
• any propagation model can be accommodated
• Results for b > 1 are same as those obtained by others
0
0.2
0.4
0.6
0.8
1
1 10 100 1000number of transmitted packets (n)
b = 0
b = 0.1
b = 0.2
b = 0.5
b = 1
b = 2
b = 10
0
0.2
0.4
0.6
0.8
1
1 10 100 1000number of transmitted packets (n)
b = 0.2
b = 0.5
b = 1
b = 2
b = 10
PR PT r
PR
PT
r2
PR
PT
r4
The model is not realistic!Valid only in far-field regionReceived power approaches ∞ as r approaches 0
PR PT r
© HyNet 2006 11
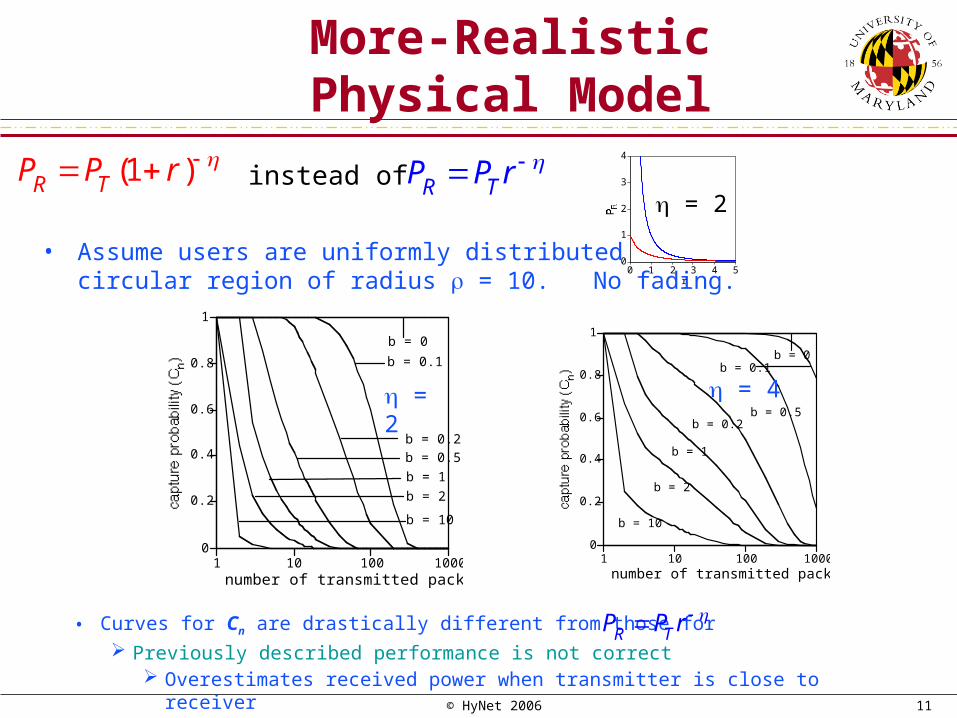
More-RealisticPhysical Model
• Assume users are uniformly distributed in a circular region of radius = 10. No fading.
0
0.2
0.4
0.6
0.8
1
1 10 100 1000number of transmitted packets (n)
b = 0
b = 0.1
b = 0.2
b = 0.5
b = 1
b = 2
b = 10
0
0.2
0.4
0.6
0.8
1
1 10 100 1000number of transmitted packets (n)
b = 0b = 0.1
b = 0.2b = 0.5
b = 1
b = 2
b = 10
PR PT (1 r)
• Curves for Cn are drastically different from those for Previously described performance is not correct Overestimates received power when transmitter is close to receiver
PR PT r
= 2 = 4
0
1
2
3
4
0 1 2 3 4 5r
= 2instead of PR PT r

© HyNet 2006 12
Multi-Packet Reception
• All packets for which SINR > b are successful– Not only the largest
• Sn = n Pr{SINR(1) > b}
0
1
2
3
4
5
1 10 100 1000number of transmitted packets (n)
b = 0
b = 0.1
b = 0.2
b = 0.5
b = 1b = 2b = 10
0
1
2
3
1 10 100 1000number of transmitted packets (n)
b = 0
b = 0.1
b = 0.2
b = 0.5
b = 1
b = 2b = 10
PR 1
1 r 2
PR 1
1 r 4
= 10

© HyNet 2006 13
A Network with Two Destinations
• Users uniformly distributed throughout union of 2 circles of radius • One destination receiver in each circle
– Separated by distance d
• Traffic distribution
– Each packet has a specific destination (receiver)
• Does not add to throughput when decoded at “wrong” receiver
• Adds to interference at both receivers
– In intersection of 2 circles
• Packet is equally likely to be intended for D1 or D2
– In rest of region
• Packet is intended for closer destination
.D1. D2
d
© HyNet 2006 14
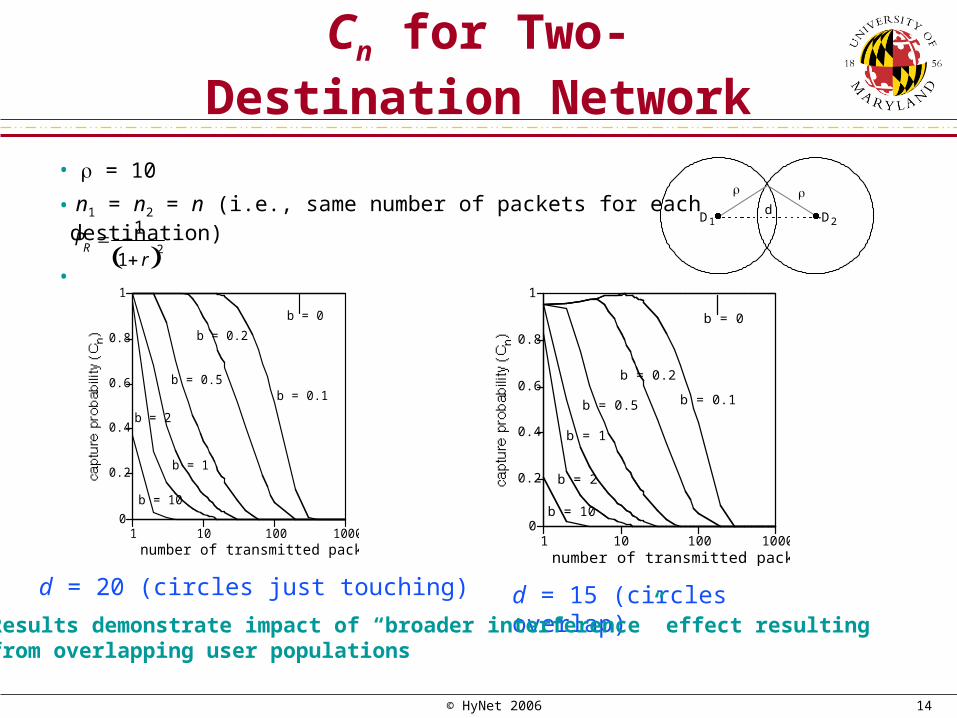
Cn for Two-Destination Network
.D1. D2
d
0
0.2
0.4
0.6
0.8
1
1 10 100 1000number of transmitted packets (n)
b = 10
b = 2
b = 1
b = 0.5
b = 0.2
b = 0.1
b = 0
0
0.2
0.4
0.6
0.8
1
1 10 100 1000number of transmitted packets (n)
b = 10
b = 2
b = 1
b = 0.5
b = 0.2
b = 0.1
b = 0
d = 20 (circles just touching) d = 15 (circles overlap)
• = 10
• n1 = n2 = n (i.e., same number of packets for each destination)
•
PR 1
1 r 2
Results demonstrate impact of “broader interference” effect resulting from overlapping user populations

© HyNet 2006 15
(2) Alternative Access-Receiver Comparison
(joint work with Jie (Rockey Luo)
• Essence: – Comparison of Scheduled and Simultaneous
(Parallel) Multiple Access Strategies
– Two Low-Complexity Schedules: TDMA PMAS
– Spectral Efficiency vs. Energy Cost comparison
– PMAS Dominates if Multiple Antennas are Available at the Receiver

© HyNet 2006 16
Three Channel Sharing Schemes
Optimal(complex)
Parallel transmission, Multiuser decoding.
TDMA (simple)
Sequential transmission
PMAS (simple)
Parallel transmission, Single user decoding.
Joint Decoding
Rsum=log[1+iPi /N0]
SNRi=Pi /(N0+jiPj)
Single user Decoding
Gaussian noise of power N0
Pi is the transmit power of user i. All channels have unit gain.

© HyNet 2006 17
Spectral Efficiency Comparison
1 1.2 1.4 1.6 0
0.1
0.2
0.3
0.4
0.5
0.6
0.7
0.8
0.9
1
Energy Cost: E (Joule/nat)
Spe
ctra
l Eff
icie
ncy:
R (
nat/s
ec/B
Hz)
PMAS
OPT & TDMA
approximately half spectral efficiency
10 transmitters, time-invariant channel, channel gains randomly generated, transmitters know channel states
1 1.2 1.4 1.6 0
0.1
0.2
0.3
0.4
0.5
0.6
0.7
0.8
0.9
1
Energy Cost: E (Joule/nat)
Spe
ctra
l Eff
icie
ncy:
R (
nat/s
ec/B
Hz)
PMAS & TDMA
OPT
10 transmitters, time-variant channel, independent Rayleigh fading, transmitters do not know channel states
approximately half spectral efficiency
Comparing the three schemes: Optimal, TDMA and PMAS

© HyNet 2006 18
Comparison on System Slopes
1 2 3 4 5 6 7 8 9 10 0
1
2
3
4
5
6
7
8
9
10
Number of Receive Antennas
Sys
tem
Slo
pe
PMAS
OPT
TDMA
MK
MK
EE
S
F
ii
Hiii
OPT
222
2
0
h
hhθ
12
22
22
242
2
0
MK
MK
E
E
EE
S
i
i
ii
F
ii
Hiii
PMAS
h
h
h
hh
1
222
2
40
M
M
E
E
S
ii
ii
TDMA
h
h
10 transmitters, time-variant channel, Rayleigh fading, CDI at the transmitterK: number of transmittersM: number of receive antennas
We can exploit space resource at the receiver!

© HyNet 2006 19
Superiority of PMAS over TDMA
General Results : PMAS is better than TDMA !
In low power regime, let # of terminals ∞ RPMAS ROPT / 2 ROPT, RPMAS # receive antennas RTDMA constant
• Multiantenna sampling creates a multi dimensional image.
• Nature helps separating signals (multiuser multiplex gain)
• Orthogonal channel sharing is inefficient in exploiting multiuser multiplex gain.

© HyNet 2006 20
Summary
The dominance of TDMA is due to its simplicity.
1.1.
Orthogonal channel sharing is inefficient in exploiting multiuser multiplex gain. Such inefficiency can be significant in the low power regime.
2.2.
Overcoming this inefficiency with simple alternative is the key challenge. We showed that such alternative exists in low power regime multiple access systems.
3.3.

© HyNet 2006 21
(3) Multicast Stability/Capacity(joint work with B. Shrader and Y. Sagduyu)
• Essence: – Extension of Collision Channel Results
– Stability Region Capacity Region
– Simple Network coding Scheme Extends Stability Region to the Capacity Region

© HyNet 2006 22

© HyNet 2006 23

© HyNet 2006 24

© HyNet 2006 25

© HyNet 2006 26
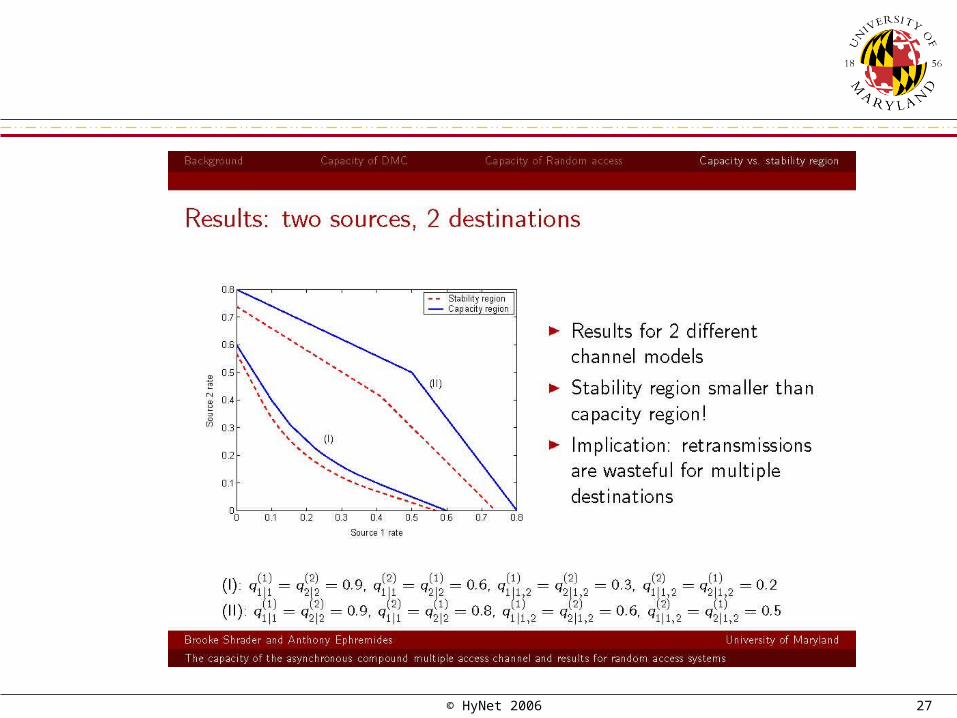
© HyNet 2006 27

© HyNet 2006 28
(4) Tandem Network Stability/Capacity (via Network coding)
(joint work with Y. Sagduyu)
• Essence: – Joint Access/Network coding Broadcasting
over Wireless Tandem Networks
– Focus on Stable Throughput
– Extensions (Cooperative/Competitive Strategies, Energy Optimization)

© HyNet 2006 29
• Tandem network:
• Multiple sources.
• Error-free transmissions & Mostly broadcasting.
• Case 1: Assume continuously generated packet traffic, i.e. saturated packet queues.
– With or without Network Coding, Find Maximum Throughput Region.
• Case 2: Allow packet queues to empty.
– With or without Network Coding, Find Maximum Stable Throughput Region.
Model and Objectives
i,j : average rate (packets/s)
i j

© HyNet 2006 30
• Three separate
queues at node i:
• Plain Routing: Network Coding:
Tandem Wireless Network Model (Saturated Queues)
• Scheduled Access: Group 1: 1, 4, 7, …, Group 2: 2, 5, 8, …, Group 3: 3, 6, 9, …
Activate node group m over disjoint fractions of time tm , m {1,2,3}.
• Random Access: Node i transmits (new or collided) packets with fixed probability pi .
(Crucial Point)
1 2 3 n -1 n4 5 6
Qi1 stores source packets node i generates.
Qi2 stores relay packets from right neighbor of node i
Qi3 stores relay packets from left neighbor of node i
+
orQi1
Qi2
Qi3
or
or
Qi1
Qi2
Qi3
Qi3
Qi1
Qi2
(Linear combination)

© HyNet 2006 31
Achievable Throughput Region under Scheduled Access
routingplain for ,,
codingnetwork for ,, ,
)(
)()(
Nit
Nitt
iml
ir
ii
iml
iiimr
ii
ir and i
l : total rates of packets arriving at node i from right and left neighbors.
i : throughput rate from node i to destinations Mi.
• Throughput rates satisfy:
• Achievable throughput
region A includes s.t.:
For n = 3, achievable
throughput region A is:
3
1 )(:
3
1 )(:
routingplain for 1}{max
codingnetwork for 1}),max({max
m
li
rii
mimi
m
li
rii
mimi

© HyNet 2006 32
• Allow packet queues to empty.
– Packet underflow possible: node can wait to perform Network Coding or proceed with Plain Routing.
– Consider two dynamic strategies based on instantaneous queue contents:
• Strategy 1: Every node attempts first to transmit relay packets and
transmits a source packet only if both relay queues are empty.
• Strategy 2: Every node attempts first to transmit a source packet and
transmits relay packets only if the source queue is empty.
– Strategy 2 expands the stability region STR(S) to the boundary of TR(A).
Stable Throughput Region under Scheduled Access
routingplain forcoding,network for11 )()()(
)( iml
ir
iiim
li
im
ri
imi ttt
t
routingplain forcoding,network for),max( )()( iml
ir
iiiml
ir
ii tt

© HyNet 2006 33
• Deriving the achievable and stable throughput regions A and S is difficult.
– Throughput regions depend on the transmission schedules t.
• Consider alternative measures:
• Assume saturated queues (or non-saturated queues together with strategy 2.).
•
Alternative Optimization Measures
i iiii M ||}{minmin
Minimum transmitted throughput “Sum”-delivered throughput
tt ,
min,
maxargmaxarg
• Find best schedule t to maximize min or over A or S.

© HyNet 2006 34
Throughput Optimization Results
• For broadcasting
2 4 6 8 10 12 14 16 18 200
0.05
0.1
0.15
0.2
0.25
0.3
0.35
0.4
0.45
0.5
number of nodes n
thro
ughput per
sourc
e-d
est
inatio
n p
air
Network coding for optimal min
Plain routing for optimal min
Network coding for optimal
Plain routing for optimal
with Mi = N – {i}, i N :
min = 0 for optimal values of .
Network coding doubles .
No improvement in min,
as n increases.
Objectives of maximizing min and under broadcast communication cannot be achieved simultaneously.

© HyNet 2006 35
Extension to Random Access
• Assume saturated queues (otherwise, the problem involves interacting queues).
– Nodes randomize between waiting or transmitting source packets or relay packets.
– Source packet transmissions:
A: Transmit new source packets at any time slot (no feedback - possible loss)
B: Transmit source packets until they are received by both neighbors (feedback + repetition)
C: Transmit linear combinations of source packets (feedback + coding) :
4 6 8 10 12 14 16 18 200
0.02
0.04
0.06
0.08
0.1
0.12
0.14
number of nodes n
thro
ughp
ut p
er s
ourc
e-de
stin
atio
n pa
ir
Network coding with method A
Network coding with method B
Network coding with method C
Plain routing with method A
Plain routing with method B
Plain routing with method C
Packet remains in queue Qi1.
Packet enters queue Qi2.
Packet enters queue Qi3.

© HyNet 2006 36
Wrap-Up
• Four Inter-Related Sets of Contributions
• Physical Layer Role in MA
• Network coding in Wireless Multicast Environments
• Stable Throughput Region Focus
© HyNet 2006 37
Plans
• Convert Throughput Results (packets/s) to Spectral Efficiencies (bits/s)
• Scheduling versus Parallel Transmission (with or without Network Coding)
• Packet Erasure Channel Models to be Broadened
• Connect Delay Analysis to Back-Pressure Algorithm