september 2014 the chief supply chain officer report …
TRANSCRIPT

THE CHIEF SUPPLY CHAIN OFFICER REPORT 2014PULSE OF THE PROFESSION
SEPTEMBER 2014

This document is the result of primary research performed by SCM World. SCM World’s methodologies provide for objective, fact-based research and represent the best analysis available at the time of publication. Unless otherwise noted, the entire contents of this publication are copyrighted by SCM World and may not be reproduced, distributed, archived or transmitted in any form or by any means without prior written consent by SCM World.
© 2014 SCM World. All rights reserved.
Report authors:
Kevin O’Marah, Chief Content Officer, SCM World, and Senior Research Fellow, Stanford Global Supply Chain Forum, Stanford Graduate School of Business
Geraint John, Senior Vice President, Research, SCM World
Barry Blake, Vice President, Research, SCM World
Pierfrancesco Manenti, Vice President, Research, SCM World

FOREWORD .......................................................................................................4
INTRODUCTION ...............................................................................................5
SURVEY HIGHLIGHTS .....................................................................................8
EXECUTIVE SUMMARY ................................................................................ 10
1: CUSTOMER CENTRICITY ........................................................................ 12
2: DIGITAL DEMAND & OMNICHANNEL ............................................... 14
3: DISTRIBUTION NETWORKS .................................................................. 16
4: MANUFACTURING STRATEGIES .......................................................... 18
5: DESIGN FOR PROFITABILITY ................................................................. 20
6: SOURCING & SUPPLIER MANAGEMENT .......................................... 22
7: SALES & OPERATIONS PLANNING ...................................................... 24
8: RISK MANAGEMENT ................................................................................ 26
9: SUSTAINABILITY ........................................................................................ 28
10: TRANSFORMATION & TALENT ........................................................... 30
CONTENTS

A global supply chain
focused on growth,
agility and sustainability.
It’s part of our DNA.

5SCM WORLD CHIEF SUPPLY CHAIN OFFICER REPORT 2014
As I walk the campus at Nike’s headquarters outside Portland, Oregon, I can’t help but be reminded of the role of supply chain in the birth and growth of our brand: from the back of our co-founder Phil Knight’s VW bus – our first “distribution system” – to a complex global supply chain focused on growth, agility and sustainability. It’s part of our DNA.
We create compelling new products and services, develop great retail and digital experiences, and invest in marketing to create demand. Yet all this investment would be for nothing if, when our customers want to buy, the product is unavailable. A lost sale, for sure, but also a lost opportunity to build a relationship.
Supply chain is about delivering the right product, in the right place, at the right time, and increasingly also about enabling “the right experience”. At Nike this is how we capitalise on the opportunity created by our investment in product, retail and brand. A simple statement but no simple task, considering the wide product range, short product lifecycles, long lead times, fickle demand, radically shifting consumer requirements, and increasing scope, complexity and speed of the world we work in.
Sport is a business of winners and losers – everyone wants the winner’s jersey, the loser’s jersey not so much. Speed is increasing exponentially, driven in part by the “I want it now” expectation set in the digital era. Custom products and services are becoming the norm. Eleven-year-olds – tomorrow’s consumers – are growing up with a seamless experience and will not accept today’s compromises.
The ability to deliver an “omnichannel” experience with the consumer and her iPhone 6 at the control panel creates tremendous architectural challenges for the supply chain. Companies that invest ahead of the curve in the right infrastructure, capabilities and technologies will be in a position to win in 2020 and beyond.
SCM World and the Chief Supply Chain Officer Survey provide insights into the experiences and perspectives of supply chain leaders across industries and across the globe, who are all wrestling with similar challenges. This study is an important part of the dialogue about the revolution that we are all facing, whether as manufacturers or retailers, hi-tech or low-tech, consumer or B2B.
Our markets expand into new countries and new channels; expectations accelerate exponentially; competitive intensity outpaces our capabilities and talent pipelines; and networks and landscapes endlessly evolve. An external and forward-looking perspective is crucial as we design and build the supply chains of the future. I hope that this report provides insight and, more importantly, triggers questions.
FOREWORD
Hans van Alebeek
Executive Vice President Global Operations & Technology
Nike

6 SCM WORLD CHIEF SUPPLY CHAIN OFFICER REPORT 2014
INTRODUCTION
In 2014 we saw high levels of participation with 1,068 completed surveys across all industries and geographies.
For the fourth year in a row, SCM World has polled a wide swath of the supply chain community to take the pulse of the profession. In 2014 we saw high levels of participation with 1,068 completed surveys across all industries and geographies. The information collected represents the largest and most comprehensive single data set anywhere on the topic of supply chain management practices and perceptions.
Our intent is not to answer any one specific question with this survey, but instead to use it as a common touchstone for all of our research throughout the year. Comprising, as it does, qualified individual answers to 129 questions and sub-questions, all gathered at a single point in time, the CSCO data set offers a unique ability to understand, in detail, what is happening in the world of supply chain management.
This year’s report is broken out into 10 modules that comprise the SCM World content library, with data drawn both from this year’s CSCO study and from time series analyses of past years.
THE POPULATION
Having always strictly limited the respondent pool to active supply chain professionals in industry, plus academics, we are forced to reject many responses from consultants, software executives and other professional services practitioners. Logistics services, distributors and contract manufacturers, all of whom act as vendors in some sense to the supply chain world, were included since all do manage physical assets. The breakdown of all respondents by industry can be seen in Figure 1.
CPG
16 16 9 8 8 6 6 5 4 4 3 3 2 2 2 6
Food
& Bevera
ge
Hi-Tec
h
Indus
trial
Health
care
& Pharm
aReta
il
Chemica
ls
Utilities
& Energy
Logisti
cs & Distr
ibution
Automoti
ve
Fabric
& Apparel
Agricult
ure & M
ining
Aerosp
ace &
Defenc
eOthe
r
Academ
ic
Media
& Telco
% of respondentsn=1,068
Respondents by industry sector1

7SCM WORLD CHIEF SUPPLY CHAIN OFFICER REPORT 2014
We also made a point of surveying as widely as possible geographically. Nearly half of our respondents are located in the Americas, 36% in Europe, Middle East or Africa, and another 14% in Asia.
The respondent pool also comprises perspectives from different levels of seniority. The portion of the group that could be called “CSCO” includes 174 individuals at the SVP/EVP or board level of management within their companies. The largest single pool of respondents, however, is those classified as VPs or directors – in this case 44% of the total. We recognise that titles are often misleading, especially across different geographies and languages, but still feel it is important to distinguish perspectives by level of responsibility.
Respondents are also tracked according to job function. Nearly half overall classify themselves as “supply chain”, but this still leaves significant groups self-identified as “purchasing/procurement” (11%), “logistics & distribution” (9%), “operations” (8%) and “manufacturing” or “general management” (5% each).
Lastly, we capture the size of survey participants’ companies, reflected in annual sales. Almost half have revenue of more than $5 billion a year, with 23% in excess of $25 billion. Another fifth is in the range $1-5 billion.
% of respondentsn=1,068
Respondents by geography
Asia & Australia
Europe, Middle East & Africa
Rest of the World
North & South America
2
1
36
14
49
VP/Director
SVP/EVP/Board Level
Other
Manager/Head
% of respondentsn=1,068
Respondents by job level3
11 16
44
29
$1bn-$5bn
<$1bn
$10bn-$25bn
Undisclosed
$5bn-$10bn
$25bn plus
% of respondentsn=1,068
Respondents by annual sales4
22
21
1211
23
11
% of respondentsn=1,068
Supply Chain
Purchasing/Procurement
Logistics/Transport & Distribution
Operations
Manufacturing/Production
General Management
Other
Respondents by job function5
48
11
14
9
8
5
5

8 SCM WORLD CHIEF SUPPLY CHAIN OFFICER REPORT 2014
SURVEY HIGHLIGHTS
DISRUPTIVE TECHNOLOGIES
Big data analytics is the most disruptive technology impacting supply chain strategy. The importance of volatile demand as a concern in 2014, coupled with the hope that better visibility may come from drilling into huge new data sources, makes big data a big winner.
Trailing big data are two related digital technologies that promise speed, agility and efficiency in both delivery of value to customers and closed-loop awareness of what’s happening in the physical supply chain. The first, digital supply chain, has the potential to meet increasingly complex demand requirements with light speed and low costs by “shipping” software or other digitised product to the point of consumption. Mobile phone apps are the
most obvious example, but formulations, mechanical enablement and pure content are also significant.
The internet of things is important as a way to know what is happening in the physical supply chain, from smart shelves in stores to self-provisioning capital equipment. Both for demand sensing and remote control of physical assets, the internet of things offers huge potential.
The key takeaway is that strategists need to start thinking more deeply about digitisation of the supply chain, both in terms of managing demand and executing supply.
MOST ATTRACTIVE MARKETS FOR GROWTH
The top country markets from a growth opportunity perspective are also very often the most risky in which to operate. China, which is by a wide margin the most frequently cited choice as a key growth market, is also fifth most likely to be considered “too risky to operate in”.
Especially attractive markets by this logic include Brazil, which comes second in terms of growth prospects, but only 13th in risk, and the United States, which is third best overall for growth, but virtually riskless in comparison to the top of our list.
The key takeaway is that traditionally successful supply chain strategies will increasingly need to be tuned to serve markets with big potential payback, but new challenges operationally.Disruptive and important Interesting, but unclear usefulness Irrelevant
% of respondentsn=1,057
Big data analytics
Digital supply chain
Internet of things
Cloud computing
Advanced robotics
3D printing
Drone/self-guided vehicles
Sharing economy (e.g., Uber, Airbnb, Instacart)
64 31 5
6
5
49 45
6
134245
33 53 14
334027
20 42 38
51
39
38
53
11
8
Disruptive technologies for supply chain6

9SCM WORLD CHIEF SUPPLY CHAIN OFFICER REPORT 2014
Top countries from a growth opportunity perspective are also very often the most risky in which to operate. China is by a wide margin the most attractive growth market, but is also considered the fifth most risky.
n=936
JapanTurkey
Mexico Nigeria
Saudi ArabiaUnited Arab EmiratesMalaysia
SingaporePoland
Vietnam
Angola
Iran
Pakistan VenezuelaEgypt . . . .Ukraine
FranceSouth Korea
Australia
Canada
GR
OW
TH O
PPO
RTU
NIT
YH
IGH
LOW
LOWOPERATING RISK
Indonesia
Russia
ChinaBrazilIndiaUSA
Nigeria
Argentina
South Africa
HIGH
Germany
UK
Country growth opportunities versus risksSelected countries in top 50 for growth and risk
7
Note: Respondents were asked to rank their top 3 countries for growth and risk. The size of the bubbles represent the scale of the growth opportunity, calculated by weighting the scores.

10 SCM WORLD CHIEF SUPPLY CHAIN OFFICER REPORT 2014
EXECUTIVE SUMMARY
Chief executives can no longer afford to delegate strategic understanding of supply chain operations. The connectedness of supply chain capability to margin growth, market entry, product innovation and corporate responsibility now compels CEOs to master at least the broad strokes of what it means to be “agile”. The data in this year’s Chief Supply Chain Officer Survey points to growing volatility in customer demand, greater complexity in customer expectations and deeper operational integration throughout value chains.
It may once have been sensible to outsource supply chain as a way to cut costs and trim assets, but as of 2014 the reverse is often true. Manufacturing is growing more vertically integrated, route to market is now a two-way street, and suppliers are increasingly consolidated and powerful with capacity and technology that customers cannot find elsewhere. Efficiency alone no longer wins the game.
This report is written for CSCOs and their teams as a survey of practices and trends in the profession. Its main message is that supply chain strategists need to raise their sights from traditional cost-cutting, process-standardising principles and prepare for a new era.
Uncertainty has long been supply chain’s enemy. Business leaders hoping to succeed in this new era must learn to make it a friend. Agility is the answer.
EMBRACING UNCERTAINTY
2014 may be the year that marks the end of process dominance in the supply chain profession. Looking ahead, supply chains that are able to articulate the true cost to serve for each and every order will succeed more by negotiating along customer demand curves than efficiently replenishing via standardised process flows. The end game could be a world in which supply-demand balancing is built on embracing uncertainty rather than resisting it.
Our data this year shows an explosion in the complexity, volume and urgency of demand. Among 14 specific supply chain risks considered, respondents’ top overall concern was customer demand volatility. Just over 40% of all respondents say they use social media as a source of real-time customer feedback, but less than 20% say it helps to improve demand sensing and forecasting. The top disruptive technology in supply chain, and by a wide margin, is big data analytics. And of course, the onward march of digital demand continues to increase SKU counts, fragment fulfilment modes and shorten cycle times. To many, it may feel that there is simply too much demand noise.
2014 may be the year that marks the end of process dominance in supply chain.
Looking ahead, those that are able to
articulate the true cost to serve for every
order will succeed more by negotiating
along customer demand curves.

11SCM WORLD CHIEF SUPPLY CHAIN OFFICER REPORT 2014
Attitudes about how supply chains create business value are also increasingly schizophrenic, with “operating cost reduction” dominant as ever but closely followed by “agility in meeting customers’ needs”. Over half of our survey participants assert that supply chain is understood by the CEO as an equal partner to sales and product management in the success of the business, but clarity on what this means in action is elusive. Enhanced customer service and loyalty is the top choice for how a high-performing supply chain impacts the business – 45% say this has “very high” value, well above the second most popular choice, accelerated new product introduction (37%), and the third, stronger supplier relationships (35%). Supply chain is trying to be all things to all people.
In response to the weight of these rising expectations, supply chain leaders are moving towards a more ambitious systems engineering view of their responsibilities and away from the outsourced, core competence model that initially took root in the early days of business-to-business internet commerce. Manufacturing strategies are expected to be highly vertically integrated in five years’ time for 52% of all respondents, against only 26% who expect to be mainly outsourced. Larger, more centralised distribution centres continue to outpace smaller, local distribution centres in strategists’ plans. Three-quarters rely on standard platforms for at least a third of their products. The depth of mechanical and logical integration across today’s supply chain is clearly increasing.
Supplier relationships are also changing with consolidation of supply bases and deeper collaborative relationships linking those chosen few who make the cut. The co-dependency that is increasingly common
between suppliers and their customers is gradually eroding out-of-date bullying tactics in purchasing. Going forwards, customer-of-choice behaviours like sharing demand plans, collaborating on cost savings and jointly developing intellectual property are deepening their roots.
2014 is shaping up as a year in which supply chain accountability, both in terms of financial impact and social and environmental responsibility, is at an all-time high. The surge evident in demand complexity is being widely met with a push for greater agility. A key proof point in the data is the doubling since 2011 in the proportion of respondents who say talent acquisition and development has gotten harder. We increasingly need people who can handle the technical duties of supply chain across silos, who can apply business judgment continually in action and, with any luck, who are able to master emerging tools for data collection and analysis.
Agility appeals now because it means winning many different battles. Process standardisation will wane in importance as a new generation of opportunistic supply chain professionals masters the deeply interdependent networks they are building to consistently say “yes” to profitable orders and “no” to the impossible.
Uncertainty has long been supply
chain’s enemy. Business leaders hoping
to succeed in this new era must learn to
make it a friend. Agility is the answer.

12 SCM WORLD CHIEF SUPPLY CHAIN OFFICER REPORT 2014
CUSTOMER CENTRICITY
Customer-centric supply chains are created by harnessing point-of-sale, channel and social data to sense both short-term and long-term demand. Connecting this data with a view of supply enables demand management to direct customers to the most profitable solutions while maximising customer satisfaction.
The real-world example most people know is buying airline tickets. Customers’ price elasticity is matched automatically against cost-to-serve variables to best load the flight. Although still in its infancy elsewhere, this principle will allow customers willing to pay a premium to get exactly what they want, while those looking for a bargain can adjust to supply constraints presented at the point of sale as options. Everyone wins.
For four years running we’ve asked how a high-performing supply chain creates value. The number one answer again this year, up marginally over the past two years, is “enhanced customer service and customer loyalty”. Customer service and loyalty dominates all industry sectors, in fact, showing
1
that, more even than cost, supply chain excellence from a business perspective hinges on customer centricity.
The importance of customer service also correlates closely with the degree to which senior business management sees supply chain as a strategic player. By a factor of nearly 2:1 those who state that their CEOs consider them equal business partners to sales and product management rather than simply a cost centre believe that customer service is paramount. Supply chain organisations that are kept in the background as service functions or pure cost centres fail to appreciate the urgency of customer service and loyalty. This may be fine for a 1980s factory model of supply chain, but not for the challenges of 2014.
These same supply chains that are considered peers at the C-level also demand broader skillsets within their teams. Customer management and sales skills are both rated at least 10 percentage points higher as “essential” for those sitting at the table than among those who aren’t. Interestingly, there is an even wider gap between the two groups of respondents on manufacturing skills, illustrating that customer centricity at the highest level is not just about saying “yes” to customers, but instead is a matter of knowing how to meet customer demand profitably.
By a factor of nearly 2:1 those who state that their CEOs consider them equal partners to sales and product management rather than simply a cost centre believe that customer service is paramount.

13SCM WORLD CHIEF SUPPLY CHAIN OFFICER REPORT 2014
Customer centricity is the flashpoint of change in supply chain. Traditional disciplines such as lean and S&OP that have created value in the past look less able to cope with demand volatility going forward. Perhaps more concerning is the need not only to fulfil demand, but also to meet highly customised requirements profitably. Customer service is a huge driver of value, but without supply visibility to ready inventory and true cost to serve it could easily destroy margins. Learning how to negotiate customer service commitments at the point of sale may be the only way for a supply chain to be sustainably customer centric.
Very high value High value % of respondentsn=1,022
Logistics & Distribution
Retail
Chemicals
Hi-Tech
Industrial
CPG
Healthcare & Pharma
61 34
37
34
39
39
40
4333
41
45
46
50
56
Supply chain’s contribution to customer service & loyaltyValue created through a high-performing supply chain
8
OtherVery high value % of respondentsn=1,061
Supply chain is service function
31 69
Supply chain is cost centre
36 64
Supply chain is enabler
37 63
Supply chain is equal partner
53 47
Customer service more valued when supply chain is an equal partnerValue of enhanced customer service/loyalty
9
Customer-facing skills more prized in leading functionsSkill is ‘essential’ for supply chain
10
Equal partners Other % of respondentsn=1,021
Planning8486
Sourcing7369
Foundational supply chainC
ustomer service integration
Manufacturing6047
Delivery/logistics7975
Governance4943
Sales3726
Customer management6353
14 SCM WORLD CHIEF SUPPLY CHAIN OFFICER REPORT 2014
Our latest CSCO survey data reaffirms that for most businesses digital demand is a major supply chain disruptor and that, for a few, some progress has been made. Three years’ worth of study findings indicate that the majority of supply chain organisations continue to support direct-to-customer delivery in response to e-commerce and mobile demand, either via third parties or in-house fulfilment.
In 2012 we asked respondents to project how they felt digitally empowered customers would affect their supply chain strategies, including whether they would increase SKU counts, whether they would build direct-to-customer fulfilment capabilities, and how they expected distribution networks to evolve. The answers pointed to radical change.
In the past two years we have seen these predictions borne out, with survey questions asking what actual changes have taken place. Now, in 2014, it is clear that most supply chains are being reconfigured around the needs of this far more complex force of demand.
Between 2013 and 2014, the overall percentage of companies building direct-to-consumer fulfilment fell slightly from 48% to 45%. This may indicate simply that progress has been made and that some have already established the direct fulfilment modes. Differences by industry are significant, however, with fabric and apparel highest at
DIGITAL DEMAND & OMNICHANNEL2
95% and major sectors such as food (35%) and pharmaceuticals (34%) much lower. Retail’s figure, at 70%, confirms that omnichannel has most certainly become commonplace.
Government data shows that in 2013 e-commerce represented 8% of US and 15% of UK retail sales, and annual revenues are forecast to top $370 billion by 2017. Although this still represents a small percentage of total spending, these figures indicate massive disproportionate growth. This growth is driving changes to supply chain networks and early leaders appear be settling in.
Across all industries, speed and agility in meeting customer fulfilment objectives is rated the second most important driver of competitive advantage. For retailers, improving supply chain speed and agility are more important to competitive advantage than any other strategy. Just over 6 in 10 rate it “very important”, compared with 54% for operating cost reduction. Retailers are also more driven by speed and agility than other sectors, including consumer products (48%).
Omnichannel fulfilment requires agility across both demand and supply networks, and, as the data shows, retailers are feeling this pressure most acutely. The critical opportunity available with omnichannel is that shoppers may buy more if, given a wider range of options, they find some incremental deals worth taking.
Government data shows that in 2013 e-commerce represented 8% of US and 15% of UK retail sales. Annual revenues are forecast to top $370 billion by 2017.

15SCM WORLD CHIEF SUPPLY CHAIN OFFICER REPORT 2014
Little or no change in SKU assortmentsSmaller SKU assortments
Much larger SKU assortmentsSome SKU expansion
n=1,034
Impact of e-commerce and mobile consumers on SKUs% of respondents saying their supply chain is supporting…
11
1023
37
30
Relying on e-commerce retailers for customer fulfilment
Building direct-to-customer fulfilment capabilities
Seeing little or no change to existing channels for customer fulfilment
% of respondentsn=857
Fabric & Apparel
Media & Telco
Retail
Logistics & Distribution
Industrial
Hi-Tech
CPG
Automotive
Chemicals
Food & Beverage
Healthcare & Pharma
95
73
70
66
50
48
42
38
37
35
34
5
21
25
16
42
39
30
49
48
37
51
6
5
18
8
13
28
13
15
28
15
Impact of e-commerce and mobile consumers on customer fulfilment – sector view14
Smaller, more local distribution centres
Larger, more centralised distribution centres
The same type of distribution centres
n=1,035
Impact of e-commerce and mobile consumers on DCs% of respondents saying their supply chain is building…
12
33
21
46
Relying on e-commerce retailers for customer fulfilment
Building direct-to-customer fulfilment capabilities
Seeing little or no change to existing channels for customer fulfilment
n=1,037
Impact of e-commerce and mobile consumers on customer fulfilment% of respondents saying their supply chain is…
13
45
17
38
16 SCM WORLD CHIEF SUPPLY CHAIN OFFICER REPORT 2014
The most significant factor impacting distribution and logistics network design decisions is customer demand volatility. This was clearly shown in a comprehensive study we ran earlier this year on distribution and logistics1, with just over half (51%) of all respondents saying that demand volatility caused them the greatest pain when designing distribution and logistics networks.
Our latest CSCO study data not only corroborates these results, but also deepens our understanding of just how challenging customer demand volatility is in distribution network design. Four-fifths of survey respondents are either concerned or very concerned by the risks posed to their supply chains by excessive customer demand volatility. Network investments are risky decisions for supply chain professionals to make, and this risk is largely driven by our inability to predict or manage swings in demand.
Accompanying these large swings are expectations among customers for more value-added services, from control tower capabilities, to custom packs and kits, and packaging innovations. These services, driven increasingly by the channel transformation brought on by e-commerce and digital demand, typically are deployed out of distribution centres and across distribution networks. This has been impacting the design of facilities for a number of years.
When our 2014 CSCO data is cut by industry and sorted according to whether respondents see a need for change, two things emerge. First is that the sectors seeing the most change are those most affected by volatile demand. Many are also particularly close to the consumer. The other thing is that those making changes are, on balance, much more likely to be building larger, more centralised distribution centres. This also reflects the dampening of oil price volatility on world markets, which makes longer
DISTRIBUTION NETWORKS3
transport distances less problematic when modelling an ideal distribution network design.
The data for logistics and distribution businesses is especially interesting. Many of our respondents work for third-party logistics providers that serve the fulfilment needs of other retailers and manufacturers. The small share (33%) that say they have not changed the way they build DCs suggests that the leading edge is very much in transition. Compare this to the three sectors where a majority are not changing DC design – automotive, chemicals and healthcare & pharma – and it is clear that businesses removed from demand volatility feel less of a need to build different kinds of DC capabilities.
Logistics and distribution businesses that are driving this change are also showing the relative scale up of what a DC can do. By a ratio of 2:1 these respondents say they are building larger, more centralised DCs rather than smaller, more local DCs. This includes substantial investments in automation. In research conducted earlier this year, 54% of logistics and distribution businesses indicated that they plan to increase investments in automation, which is 10% higher than the all-sector average.
The types of automation technologies companies plan to invest in varies, but it is safe to say that drones and self-guided vehicles are not part of these investment plans. Over half of respondents say drones and self-guided
1 The Smart DC: Delivering Value Through State-of-the-Art Distribution & Logistics, SCM World, March 2014.

17SCM WORLD CHIEF SUPPLY CHAIN OFFICER REPORT 2014
vehicles are irrelevant. Apparently, drones hold promise only for the likes of Amazon and Google, both of which are developing drones of different types for commercial use.
The small share of logistics
businesses that say they have
not changed the way they build distribution centres suggests
that the leading edge is very
much in transition.
Media & Telco
Retail
Industrial
Hi-Tech
Food & Beverage
CPG
Healthcare & Pharma
Chemicals
Automotive
Larger Smaller Same % of respondentsn=853
38
27
33
37
33
32
31
25
23
27
25
26
19
22
22
20
17
18
Logistics & Distribution452233
Fabric & Apparel522424
35
48
41
44
45
46
49
58
59
Sector differences on DC building plans15

18 SCM WORLD CHIEF SUPPLY CHAIN OFFICER REPORT 2014
This year for the first time we included a series of questions on manufacturing strategies in the CSCO survey. The data suggests that traditional manufacturing strategies are set for significant change over the next five years.
For at least the past two decades, outsourced manufacturing topped supply chain strategists’ agendas. Today, a return to in-house production is clearly under way. Projecting ahead five years from now, nearly three-quarters of manufacturers say they will have a significant share of in-house production. A slight majority plan to become highly vertically integrated, while another 23% expect to concentrate on modular platforms and critical parts, and use outsourced manufacturing to support this.
This return to in-house production was evident in research we published in April last year. In our report Manufacturing Footprints: Getting to Plant X, it emerged that 29% of
MANUFACTURING STRATEGIES4
manufacturers were ready to bring some manufacturing back in-house, outpacing by five points those planning to increase their amount of outsourced manufacturing. The new survey data collected here suggests that this trend is strengthening and that vertical integration – a strategy successfully employed by companies such as Google, Intel and Burberry – is back.
As vertical integration returns, nearly a quarter of our respondents say they will focus on producing modular platforms and critical parts in-house, while final configuration will be made on demand by a network of third-party factories or retailers closer to customers. The concept of “platforming”, which has been successful in businesses ranging from consumer packaged goods to vehicles, offers a supply chain strategy that enables greater agility and cost efficiency in meeting specific customer needs.
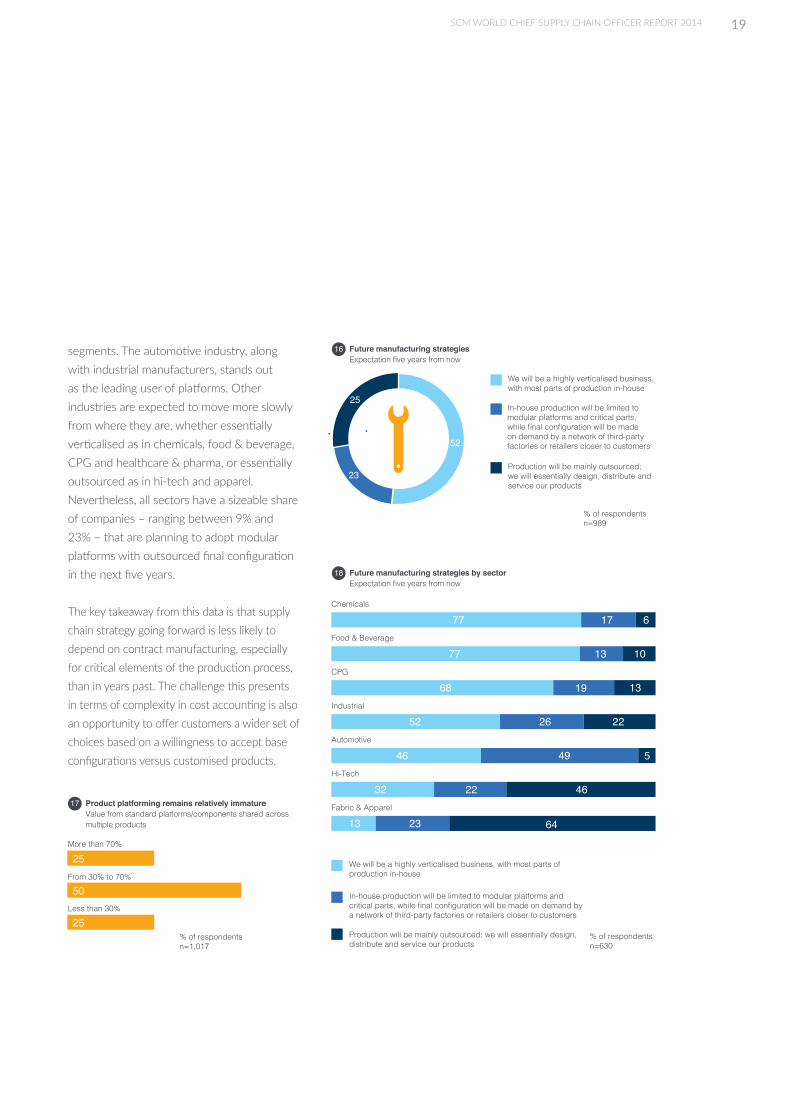
Our data shows that less than a quarter of companies have mature product platforming in place today – that is to say, more than 70% of the value of their products comes from standard platforms or components that are shared across multiple products. The majority of other respondents are on their way to embracing this concept in the near future, as they are showing mild elements of product platforming, ranging from 30% to 70% of product value.
The degree to which supply chain strategists embrace vertical integration and platforming differs significantly across manufacturing
52% of manufacturing companies expect to be highly vertically integrated in the next five years — more than double the proportion that say their production will be mainly outsourced.
19SCM WORLD CHIEF SUPPLY CHAIN OFFICER REPORT 2014
% of respondentsn=1,017
More than 70%
From 30% to 70%
Less than 30%
25
50
25
Product platforming remains relatively immatureValue from standard platforms/components shared acrossmultiple products
17
% of respondentsn=630
Chemicals
Food & Beverage
CPG
Industrial
Automotive
Hi-Tech
Fabric & Apparel
Production will be mainly outsourced; we will essentially design, distribute and service our products
In-house production will be limited to modular platforms and critical parts, while final configuration will be made on demand by a network of third-party factories or retailers closer to customers
We will be a highly verticalised business, with most parts of production in-house
77 17
13
1319
10
6
77
68
52
46
32
13
26
49
46
5
22
22
23 64
Future manufacturing strategies by sectorExpectation five years from now
18
Production will be mainly outsourced; we will essentially design, distribute and service our products
In-house production will be limited to modular platforms and critical parts, while final configuration will be made on demand by a network of third-party factories or retailers closer to customers
We will be a highly verticalised business, with most parts of production in-house
% of respondentsn=989
52
23
25
Future manufacturing strategiesExpectation five years from now
16segments. The automotive industry, along with industrial manufacturers, stands out as the leading user of platforms. Other industries are expected to move more slowly from where they are, whether essentially verticalised as in chemicals, food & beverage, CPG and healthcare & pharma, or essentially outsourced as in hi-tech and apparel. Nevertheless, all sectors have a sizeable share of companies – ranging between 9% and 23% – that are planning to adopt modular platforms with outsourced final configuration in the next five years.
The key takeaway from this data is that supply chain strategy going forward is less likely to depend on contract manufacturing, especially for critical elements of the production process, than in years past. The challenge this presents in terms of complexity in cost accounting is also an opportunity to offer customers a wider set of choices based on a willingness to accept base configurations versus customised products.

20 SCM WORLD CHIEF SUPPLY CHAIN OFFICER REPORT 2014
Most organisations today aren’t as fully open and collaborative when it comes to new product development and launch (NPDL) as would be ideal given the truism that 80% of a product’s costs are locked in during the initial design phase.
Our CSCO data indicates that about a third of companies believe they have full integration between not only R&D and supply chain but also marketing and sales. Based on our conversations with manufacturing clients, we believe respondents have been quite generous in their assessment here. Organisations that have a truly mature approach to NPDL – with supply chain, product development and sales & marketing functions being equal partners in an orchestrated NPDL process – are probably less numerous than the survey data suggests.
In most cases, supply chain and manufacturing are only partially linked to product design and engineering/R&D functions and loosely tied to customer needs via sales & marketing, making their support for the NPDL process somewhat limited.
DESIGN FOR PROFITABILITY5
As we noted in our April 2014 report Design for Profitability, an ideal NPDL process starts with an attitude about innovation that is inclusive of inputs not only from engineers and marketers but also from supply chain and manufacturing. Most companies are not there yet. The issue lies in the different understanding of the NPDL process, particularly in how open, collaborative and integrated it should be.
Our CSCO data, when cut by function, shows that general management, sales & marketing and engineering have a more generous view about the level of maturity of their NPDL process, while manufacturing, supply chain and, most notably, procurement disagree as they do not feel fully integrated in the process.
Sourcing, logistics, manufacturing
Marketing, sales, service
Design, R&D, engineering
Product design and engineering/R&D functions are isolated from both manufacturing/supply chain and sales & marketing
PURE SILO ORGANISATION
LINKED ORGANISATION
SEMI-INTEGRATED ORGANISATION
INTEGRATED ORGANISATION
Product design and engineering/R&D functions are loosely linked to manufacturing/supply chain and sales & marketing. Lessons learned in operations, product development and sales are captured, but not exploited across the functions
Product design and engineering/R&D functions are partially linked to manufacturing/supply chain but only loosely tied to customer need via sales & marketing. Lessons learned in sales & marketing (e.g., product hit rate) are captured, but not fully exploited by product design and engineering/R&D functions
Sales & marketing, manufacturing/supply chain and product design and engineering/R&D functions are equal partners in an orchestrated new product development and launch process. Lessons learned in operations, innovation and the market inform and support future generations of product
32%38%23%7%
% of respondentsn=1,092
Organisational structures for NPDL19

21SCM WORLD CHIEF SUPPLY CHAIN OFFICER REPORT 2014
Where CEOs see supply chain as
equally important to sales or product
development, companies get integrated
around a streamlined NPDL process.
This highlights how supply chain in many companies today is not yet considered an equal partner to engineering/R&D and sales & marketing.
Involving supply chain in NPDL often requires a deep mindset change, which may be difficult for traditional functionally divided organisations. The only way to change this is the direct involvement of top management. Our survey shows, in fact, that when the CEO and executive management understand supply chain as an equally important part of business success as sales & marketing or R&D/product development, companies get integrated around a streamlined NPDL process (Figure 21).
Achieving better integration between supply chain and the functions that traditionally drive product innovation is good practice under any circumstances. In
today’s business environment, however, when so much interdependent engineering and investment goes into production and material technologies, and when so much potential customer value can be postponed for digital delivery late in the manufacturing process or even post-sale, this lack of integration is potentially fatal.
% of respondentsn=990
Customer facing
Internal facing
FUN
CTI
ON
S
Supply facing
PURE SILO ORGANISATION
1 2 3 4
LINKED ORGANISATION
SEMI-INTEGRATED ORGANISATION
INTEGRATED ORGANISATION
Manufacturing/Operations
Purchasing/Procurement
Supply Chain/Logistics
Engineering/R&D
General management
Sales & marketing
Supply chain is understood as an equally important part of business success as sales & marketing or R&D/product development
Supply chain is an enabler of product or sales-driven business strategies
Supply chain is understood primarily as a cost centre that affects margins
Supply chain is strictly seen as a function meant to service the business
45
22
13
10
35
43
34
23
16
28
39
40
14
4
7
27
Integrated organisation Semi-integrated organisation
Linked organisation Pure silo organisation
% of respondentsn=1,029
Supply chain’s standing and NPDL maturity21
How different functions perceive NPDL maturityWeighted average 1-4, where 1=pure silo, 4=integrated
20

22 SCM WORLD CHIEF SUPPLY CHAIN OFFICER REPORT 2014
The growing importance of true supplier management, as opposed to traditional purchasing, reflects much of the same deepening complexity we see in manufacturing and product design.
Demand complexity is pushing supply chains across industry to commit not only to ever lower costs, but also to more varied capa-bilities in the final product as delivered. This squeeze can increasingly only be met by bet-ter collaborating with suppliers. However far an organisation goes with vertical integration, there will always be a need to engage sup-pliers. The more complex the commitments made to customers, the more dependent busi-nesses are on their suppliers.
This is reflected in the fact that the proportion of survey respondents saying that strong sup-plier relationships create “very high value” for their organisations has risen by five percentage points year on year (35% in 2014 vs 30% in 2013). Priority access to scarce raw materials and capacity, and collaboration on supply chain cost efficiency are seen as the two most valu-able benefits from strategic supplier engage-ment. Almost two-thirds of respondents overall say these are “extremely relevant” to their competitive advantage. Hi-tech, aerospace & defence and apparel are the sectors that care
SOURCING & SUPPLIER MANAGEMENT6
most about priority access (three-quarters of the sample in each case), while CPG is most focused on collaborative cost reduction (71% say it’s extremely relevant).
There is quite a bit of sector variation on the other “customer of choice” benefits. Automo-tive firms value supplier innovation most highly (61% vs 46% across all sectors). Hi-tech and CPG firms value co-development the most (44% and 43% respectively, vs 35% overall). Media & telecoms firms value collaboration on customer propositions (46% vs 30%), while perhaps not surprisingly given their short product lifecycles, apparel and hi-tech firms prize faster time to market and problem solving (71% and 65% vs 54% overall).
Our analysis of the data indicates that strategic supplier engagement has the biggest impact on the supply chain function’s internal standing. Among the 420-plus respondents who say it is “very important” to their organisations’ competitive advantage, 69% believe supply chain has an equal status to R&D and sales/marketing – slightly ahead of those who say the same about long-term equity improvement and differentiated service capabilities, and well ahead of operating cost reduction (55%).
And although access to a supplier’s best talent may be last on the supplier engagement ben-efits list, it appears to be the most significant factor in boosting supply chain’s status – 65% of the 177 respondents who say it is extremely relevant also believe they are “absolutely” on a par with other functions in the CEO’s eyes.
64% of respondents say that priority access to scarce raw materials/capacity and collaborative cost reduction with suppliers are ‘extremely relevant’ to their competitive advantage.

23SCM WORLD CHIEF SUPPLY CHAIN OFFICER REPORT 2014
n=886
Supplier giving you priority in times of tight supply/capacity
Faster problem solving/time to market
Co-development of new products/services
Collaboration on cost efficiency of supply chain
Supplier giving you innovations/ideas ahead of competitors
Collaboration on new customer propositions
Collaboration on quality improvements
Joint risk mitigation strategies
Access to supplier’s best talent
64
64
54
54
46
36
35
30
29
Our analysis of the data indicates that strategic supplier engagement has the biggest impact on the supply chain function’s internal standing.
Very important
Important
Neither important nor unimportant
Somewhat unimportant
Not at all important
Supply chain is equal partner Supply chain is enabler
Supply chain is cost centre Supply chain is service function
% of respondentsn=1,050
69
44
28 53 12 7
6295114
43 28 29
42 10 4
27 3 1
How strategic supplier engagement boosts competitive advantage% of respondents saying ‘extremely relevant’
How strategic supplier engagement enhances supply chain’s reputationImportance to competitive advantage
22
23

24 SCM WORLD CHIEF SUPPLY CHAIN OFFICER REPORT 2014
Sales & operations planning (S&OP) is the top inquiry within the SCM World community. This is because it applies to essentially all supply chain organisations regardless of size, location or industry, and because S&OP is the most fundamental discipline for balancing supply and demand. However, our previous research on S&OP, as well as anecdotal review of practitioner case studies, suggests an imminent change in the way S&OP works.
For many years S&OP has followed a process-centric trajectory emphasising meetings between supply management, demand management and general business leadership. The notion that “S&OP is a journey” rings true because change management takes so long. Most companies have strong internal alignment around the idea that S&OP is necessary, but clarity on what lies at the end of the journey seems to be hazy.
Looking ahead, the definition of S&OP maturity must centre on the enablement of business decisions that allow general managers to achieve their revenue targets profitably. S&OP, both as a process and in terms of the information needed to make margin-optimising choices, looks constrained not only by data quality, but also by agreement on purpose.
SALES & OPERATIONS PLANNING7
To quote one forward-thinking supply chain leader: “What GMs are looking for is early warning to supply-demand issues only as it relates to how those impact profit and revenue targets. It’s more than just a matter of creating one version of the truth and serving it up, or of extending scope to suppliers and customers. The higher-order need is to create management processes that channel and translate operational information to P&L decision forums.”
Part of the problem is a widening disconnect between visibility to demand and the agility of supply response. When we asked our survey participants “how important is it for your company’s business strategy to focus on supply chain improvements for the following…?”, agility was ranked as the second highest objective after cost.
n=1,061
Operating cost reduction
Strategic supplier engagement
Agility and speed
Differentiated customer service capabilities
Increasing revenue
Long-term equity improvement
96
90
86
84
84
74
How supply chain contributes to competitive advantage% of respondents saying ‘very important’ or ‘important’
24
n=754
Chemicals
CPG
Hi-Tech
Industrial
Retail
Healthcare & Pharma
Logistics & Distribution
86
85
84
79
79
78
74
Concerns about customer demand volatility% of respondents saying ‘very’ or ‘somewhat’ concerned
25

25SCM WORLD CHIEF SUPPLY CHAIN OFFICER REPORT 2014
More than 80% of respondents in CPG, hi-tech and chemicals firms, and over 70% in industrial, healthcare & pharmaceuticals, distribution and retail firms, are either very concerned or somewhat concerned about demand volatility.
As a reflection of what we often hear in practice, this data suggests that a reliable cadence for S&OP meetings is not enough to keep pace with the rising expectations on supply chain’s ability to shift resources in response to changes in demand. The fact also that operating cost reduction remains decisively at the top in importance indicates that simple buffering approaches with inventory or capacity is not often an acceptable strategy.
Considering also the importance of customer service in supply chain, our finding that customer demand volatility is the top risk for executives is worrying. More than 80% of respondents in CPG, hi-tech and chemicals firms, and over 70% in industrial, healthcare & pharmaceuticals, distribution and retail firms, are either very concerned or somewhat concerned about demand volatility. Forecast accuracy, it seems, is more elusive than ever.
Along with the pain of demand volatility, S&OP struggles to digest the exploding quantity of demand data available today. Social media, for instance, is used by 41% of all respondents for real-time customer feedback. Unfortunately, its use for improved demand sensing and forecasting is a relatively paltry 19% – second lowest among the six applications considered. The data is there, but it is not helping with the forecast.
% of respondentsn=1,048
Source of real-time customer feedback
Inform product enhancement/innovation priorities
Give visibility of social/environmental/labour practices
Provide advance warning of potential supply disruptions
Improved communication with trading partners
Improved demand sensing and forecasting
No effect
41
31
30
23
19
19
33
Effect of social media on supply chains today26

26 SCM WORLD CHIEF SUPPLY CHAIN OFFICER REPORT 2014
Supply chain risk management remains a relatively immature discipline, but major disruptions in Japan, Thailand, Europe and elsewhere during the past few years has prompted the majority of companies to a) take it more seriously, and b) invest in developing their internal risk management capabilities.
A recent SCM World report2 showed that leaders in the field take a highly systematic and proactive approach to risk identification, assessment and mitigation, using the latest technologies and analytical methods to get ahead of potential problems across their complex supply networks. They often have dedicated teams within the supply chain organisation responsible for developing risk mitigation strategies and responding quickly and effectively to crises when they happen.
RISK MANAGEMENT8
The slow but steady progress in addressing supply chain risk is reflected in a year-on-year rise in those who believe supply chain adds value not only by tackling problems, but also by stealing a march on competitors in the process – for example, by switching production locations, buying up alternative supplies more quickly and avoiding costly shutdowns. A fifth of respondents rate the ability to leverage external disruptions as “very high value” compared with 16% in 2013, while 32% say it is “high value” – up four percentage points.
Collaboration is the key to success here, according to our data. Joint risk mitigation with suppliers drives companies’ ability to leverage supply chain disruptions by a factor of almost two. Among the 36% of respondents (312 in total) who say that joint risk mitigation is “extremely relevant” in aiding competitive advantage, 37% also say that leveraging opportunities from disruption delivers very high value, compared with 20% of the sample overall. And 39% of these risk leaders say that collaboration with key customers or suppliers is “very effective” as a risk mitigation strategy, compared with 29% of our sample overall.
Innovative methods also play their part. Companies using social media to identify risks and provide advance warning of potential disruptions, for instance, are also better able to leverage opportunities from them: 29% of users report very high value and 44% high value, compared with 17% and 31% of non-users who say this. The same is true of real-time data analytics, where the respective figures are 25% and 37% of users versus 17% and 28% of non-users.
Using risk mapping to identify exposure to potential risks
Dual or multi-sourcing is used ‘very effectively’ for risk
mitigation
Active inventory tracking is used ‘very effectively’ for risk
mitigation
Using real-time data analytics to identify exposure to potential
risks
Joint risk mitigation with strategic suppliers ‘extremely relevant’ to
competitive advantage
Visibility of potential risks at tier-2 suppliers is ‘very good’
or ‘good’
Using social media monitoring to identify exposure to potential
risks
Visibility of potential risks at tier-3+ suppliers is ‘very good’
or ‘good’
60
52
51
47
45
41
23
21
48
36
40
30
24
31
18
13
Risk leaders*
* Those who say that leveraging opportunities from supply disruptions gives ‘high’ or ‘very high’ value
^ Those who say leveraging opportunities from supply disruptions gives ‘moderate’, ‘little’ or ‘no’ value
Others^ % of respondentsn=1,053
Where risk leaders are ahead of the pack27
2 Innovative Approaches to Supply Chain Risk, SCM World, July 2014.

27SCM WORLD CHIEF SUPPLY CHAIN OFFICER REPORT 2014
Leaders in supply chain risk have better visibility of potential risks and are more satisfied with mitigation efforts than those less equipped to leverage disruptions. Almost half (47%) of the former say they have good or very good visibility among tier-2 suppliers, compared with 36% of all respondents. And a quarter says the same about tier-3+ suppliers, versus 17%. On the customer side, 40% of leaders have visibility of risks among indirect customers, against 31% of all firms. Hi-tech firms claim the deepest visibility upstream and downstream. Among leading companies, 60% rate dual sourcing and 56% active inventory tracking – the two most popular risk mitigation tactics – as very effective, compared with 44% and 46% respectively among all firms.
n=1,040
Geopolit
ical in
stability
Natural
disaste
r affe
cting
supplier
facili
ties
Data se
curity
/IT in
ciden
ts
Shipping
/logisti
cs
disrup
tions
Breach
of in
tellec
tual
propert
y rights
Safety/
quality
incid
ents
Legal/
regula
tory is
sues
Other in
ciden
ts at
supplier
faciliti
es
Supply s
horta
ge of k
ey
materia
ls/com
ponen
ts
Finan
cial fa
ilure o
f criti
cal
custo
mer
Commod
ity pric
e vola
tility
Finan
cial fa
ilure o
f criti
cal
supplier
20 8 6 6 6 4 4 4
-2-1
3
-4
Joint risk mitigation with suppliers drives companies’ ability to leverage supply chain disruptions by a factor of almost 2:1.
Sources of potential disruption remain broadly spread. The CSCO survey data shows that safety and quality again attract the greatest levels of concern from executives this year, with 37% overall saying they are “very concerned” about such incidents in 2014-15. Energy and utility companies are by far the most worried, with more than twice this proportion (67%) on high alert, but healthcare & pharma, chemicals and food & beverage firms are also well above the average. However, it is concerns about geopolitical instability that have grown most significantly during the past year, on the back of conflict in Syria, Iraq, Ukraine, Israel and elsewhere – a 20-point rise year on year, with twice as many supply chain practitioners “very concerned” than in 2013 (17% vs 8%).
Key supply chain risks: risers and fallers% point change in respondents ‘very’ or ‘somewhat’ concerned in 2014 vs 2013
28

28 SCM WORLD CHIEF SUPPLY CHAIN OFFICER REPORT 2014
Sustainability (used interchangeably here with social and environmental responsibility or SER) has been part of our survey since 2011, and as such offers the best time series information anywhere in our research.
One of the most decisive trends we see in 2014 is the steady rise of cost savings as a justification for investments in SER. Although the leading reason for such investments this year is (as it has been since 2011) “creating a positive brand image”, the biggest increase by far is cost savings.
This trend is especially positive since it provides a self-funding basis for continued efforts made in supply chain to improve SER performance. It is based on significant cash savings in energy, packaging expense and general material cost efficiency. Also important is the way cost savings are replacing mistaken hopes that consumers would reward companies for green or socially responsible products. As our data shows, this is the only business justification for SER that has lost credibility since 2011. Consumers, it appears, don’t buy from sustainable supply chains as much as many had hoped they would.
SUSTAINABILITY9
The onward march of sustainability initiatives over the past few years is impressive. Our data includes questions asked in both 2013 and 2014 about how deeply sustainability has been pressed into the supply chain. Big jumps in activities fully implemented internally as well as smaller amounts of progress across the wider value chain show that supply chain leaders are making real progress.
However, the progress is uneven. When industry sectors are compared, the data shows big differences between leaders in hi-tech and laggards in healthcare & pharmaceuticals. The reasons for this appear to include the high value placed on brand image, which has a disproportionate impact on consumer products and, in the case of hi-tech, an early exposure to concerns over fair labour and hazardous waste. Hi-tech firms were among the first to voluntarily combine around industry-wide sustainability efforts like the Electronic Industry Citizenship Coalition (EICC), formed initially in 2004.
Sustainability in supply chain continues to progress and appears to be getting stronger. The good news from a global wellness perspective is obvious, but from a business perspective there is both threat and opportunity. The threat, especially in light of the fast-rising role of social media impacting supply chain strategy, is that sudden negative brand impacts can seriously affect sales on the downside, even if little reward has been seen for good behaviour on the upside.
2014 n=975
Reduc
e cos
ts PR
Regula
tion
Supply c
ontin
uity
Brand im
age
Increa
se sa
les
61 26 19 11 8
-11
Board motivations for investing in sustainability% change, 2011-14
29

29SCM WORLD CHIEF SUPPLY CHAIN OFFICER REPORT 2014
One of the most decisive trends we see in 2014 is the steady rise of cost savings as a justification for investments in SER.
The opportunity, however, is closely related. Consumer consciousness is rising, especially among the young, but consumer knowledge is still virtually non-existent. Supply chain visibility at the point of sale could include not only price as always, but increasingly other elements of total cost, including service features as described above, and, ultimately, social or environmental impact. Giving consumers a clearer picture of what happens when they pull on the global supply chain by choosing one product over another may well end in meaningful revenue bumps for those that can show positive social and/or environmental impact.
Internal operations
Key suppliers
Extended supplier network
Whole value chain
10 373814
10 3510 33
21 46
34 49
24 48
45 42
2014 Activities fully implemented 2014 Currently implementing activities
2013 Activities fully implemented 2013 Currently implementing activities
% of respondents2014 n=955
Level at which SER activities have been implemented30
Internal operations
Key suppliers
Extended supplier network
Whole value chain
51
35
16
17
47
25
9
14
46
23
9
13
38
9
4
6
Hi-Tech Consumer Goods & Retail
Industrial Healthcare & Pharmaceutical
% of respondentsn=955
Level at which SER activities have been implemented – by sector31

30 SCM WORLD CHIEF SUPPLY CHAIN OFFICER REPORT 2014
Supply chain transformation and supply chain talent development are inextricably linked. Without the ongoing transformational efforts experienced by most supply chain organisations, managing and developing talent will likely be relegated to a set of transactional activities managed through a corporate HR function.
In companies that have yet to connect supply chain transformation efforts to their supply chain talent development process, these transactional activities become divorced from the broader supply chain strategy of the organisation, which in nearly all cases involves a multi-year implementation process – a transformation. A company’s approach to talent development, acquisition and retention has to be synced into the broader strategic plan of the supply chain organisation.
Since 2011 when we first started surveying supply chain practitioners on talent management the pressure has ramped up steadily. Despite rising interest in supply chain among universities and significant investments by professional associations such as APICS, the ISM and the CSCMP, business leaders seem to be facing harder times building and managing their teams than ever before. In fact, 43% of supply chain practitioners say that this task has become harder in the past two years – nearly double the rate in 2011 and up notably over last year.
TRANSFORMATION & TALENT10
Digging into the root causes reveals that much of the pain comes at the front end of the pipeline. “Finding talent” is comfortably at the top of the “extremely challenging” list. Also up from last year, and trending positive since 2011, is “hiring talent”. Skills are obviously getting harder to find on the open market.
At the same time we are seeing a slight downward trend in the pain felt around managing people who are already on board. In 2011 the top problem by a wide margin was “offering staff a compelling career progression”. While this is still the second most serious talent management challenge, it is down from its original peak. We’ve also seen a slight downtick in the share that considers “developing skills among existing staff” to be extremely challenging.
One interpretation may be that supply chain leaders are working harder to leverage what they already have since raw recruitment is such a problem. This should be good news for human resource folks dedicated to supply chain organisations, but it may end up merely postponing the solution to a later time.
In terms of the ideal skills profile for an emerging supply chain leader, our survey data shows a very stable perspective over the past three years. What senior leaders want, it seems, is not only solid competence in the classic supply chain disciplines of planning, sourcing, manufacturing and distribution, but also business management skills such as performance management, governance and change management. In addition, there is a
43% of supply chain executives say talent acquisition and development has become harder in the past two years – almost double the figure in 2011.
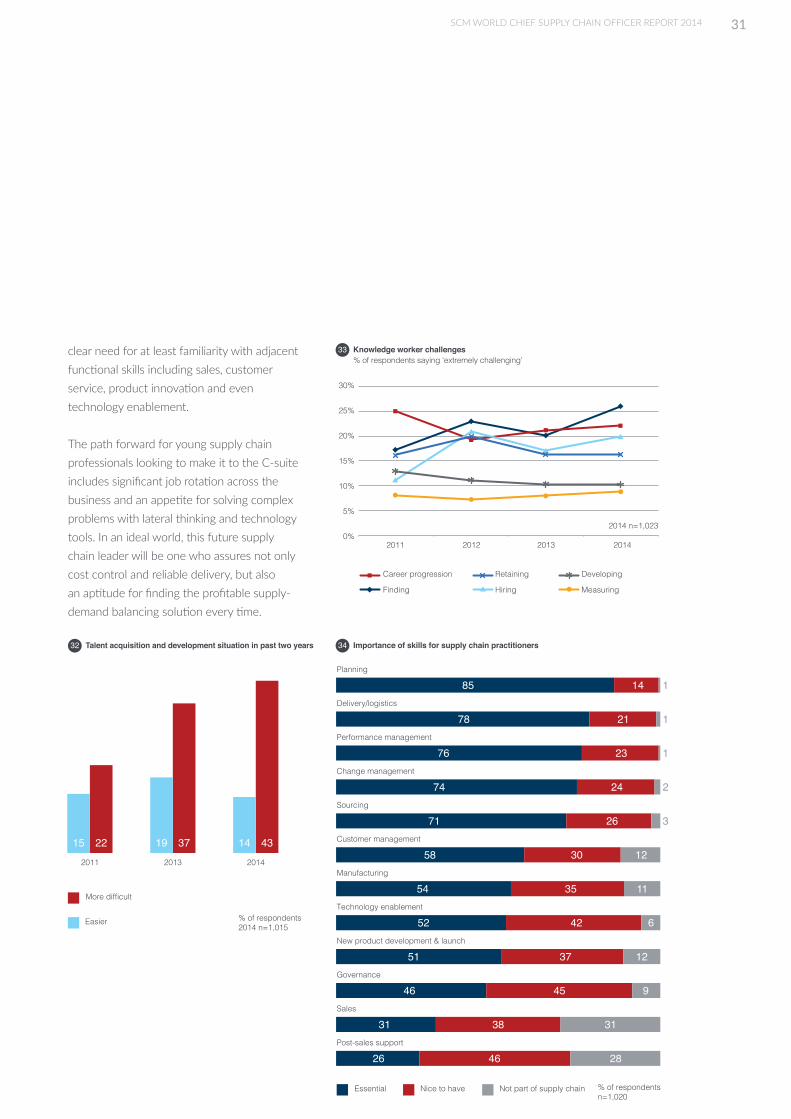
31SCM WORLD CHIEF SUPPLY CHAIN OFFICER REPORT 2014
clear need for at least familiarity with adjacent functional skills including sales, customer service, product innovation and even technology enablement.
The path forward for young supply chain professionals looking to make it to the C-suite includes significant job rotation across the business and an appetite for solving complex problems with lateral thinking and technology tools. In an ideal world, this future supply chain leader will be one who assures not only cost control and reliable delivery, but also an aptitude for finding the profitable supply-demand balancing solution every time.
More difficult
2011 2013 2014
Easier % of respondents2014 n=1,015
15 22 19 37 14 43
Talent acquisition and development situation in past two years 32
Essential Nice to have Not part of supply chain % of respondentsn=1,020
Planning
Delivery/logistics
Performance management
Change management
Sourcing
Customer management
Manufacturing
Technology enablement
New product development & launch
Governance
Sales
Post-sales support
85
76
71
54
51
31
78
74
58
52
46
26
14
23
26
35
37
3138
21
24
30
42
9
11
12
12
6
3
2
1
1
1
45
2846
Importance of skills for supply chain practitioners34
2011 2012 2013 2014
30%
25%
20%
15%
10%
5%
0%
Career progression Retaining Developing
Finding Hiring Measuring
2014 n=1,023
Knowledge worker challenges % of respondents saying ‘extremely challenging’
33

32 SCM WORLD CHIEF SUPPLY CHAIN OFFICER REPORT 2014
ABOUT SCM WORLD
SCM World is the supply chain talent development partner for the world’s leading companies, empowering professionals with the capability, commitment and confidence to drive greater positive impact on business performance and help solve three of the world’s fundamental challenges: health, hunger and environmental sustainability.
The SCM World community accelerates collective learning and performance by harnessing the knowledge of the most forward-thinking supply chain practitioners, shared through industry-leading research, best-practice exchanges, peer networking and events. Over 150 companies participate in and contribute to the SCM World community, including P&G, Unilever, Nestlé, Samsung, Lenovo, Cisco, Merck, Caterpillar, Nike, Walgreens, Jaguar Land Rover, Raytheon, Chevron, Shell and BASF.
scmworld.com
For more information about our research programme, contact:
Geraint JohnSenior Vice President, Research+44 (0) 20 3747 [email protected]

33SCM WORLD CHIEF SUPPLY CHAIN OFFICER REPORT 2014

2 London BridgeLondon SE1 9RAUnited Kingdom
+44 (0) 20 3747 6200scmworld.com