september 2016 highway bridgesbridges in this report refer to publicly owned highway bridges that...
TRANSCRIPT

HIGHWAY BRIDGES
Linking Funding to Conditions May Help Demonstrate Impact of Federal Investment
Report to Congressional Committees
September 2016
GAO-16-779
United States Government Accountability Office

United States Government Accountability Office
Highlights of GAO-16-779, a report to congressional committees
September 2016
HIGHWAY BRIDGES
Linking Funding to Conditions May Help Demonstrate Impact of Federal Investment
What GAO Found Bridge conditions have generally improved nationwide from 2006 to 2015, based on GAO analysis of federal bridge data. For example, the percentage of structurally deficient bridge deck area (the surface area that carries vehicles) decreased from 9 percent to 7 percent nationwide during this period. The number of structurally deficient bridges also decreased from 13 percent to 10 percent nationwide. However, some states have substantially higher percentages of structurally deficient deck area than others. Bridge conditions may become more challenging to address as bridges age, because the number of bridges and amount of total deck area increased dramatically from the 1950s through the 1970s, generally with a 50-year design life. Analysis of federal bridge data shows that the amount of structurally deficient deck area is greatest for bridges built from 1960 through 1974, indicating an expected need for additional maintenance, replacement, or rehabilitation.
Federal funds obligated for bridge projects have remained relatively stable from 2006 to 2015, between $6 billion and $7 billion annually in most years. During this period, the use of federal funds on bridges shifted somewhat from building new bridges to projects that preserve existing bridges, such as bridge rehabilitation or preventative maintenance. While the Federal Highway Administration (FHWA) estimates total funds dedicated to bridges and collects data on bridge conditions nationwide, it does not track the linkage between federal funds and changes in bridge conditions. GAO has previously reported that linking performance outcomes with resources invested can help agencies to more clearly determine how changes in invested resources may result in changes to performance. Using such performance measures would help FHWA demonstrate the link between federal funding and outcomes for bridges.
Officials from the selected 24 states and the District of Columbia (D.C.) reported little change in the way they have funded and managed bridges since 2012. Officials from 21 states and D.C. reported bridge funding has been stable since the federal bridge program was consolidated in 2012. Officials from 3 states reported an increase in bridge funding since that time. The general stability in bridge funding may be a result of the long time frame for planning bridge projects; for example, bridge funding cycles can be 5 years or longer, a time span that means any changes would not be apparent for several years. Officials from 10 states mentioned increased flexibility in their ability to use federal funds for bridge projects. Changes from the Moving Ahead for Progress in the 21st Century Act provided states flexibility to determine whether to spend federal highway funds on bridges or other highway needs. Further, officials from 18 states and D.C. reported that they have not changed how they prioritize bridge projects relative to other transportation projects. With respect to challenges, officials from 14 states described inadequate funding as a challenge, and officials from 13 states reported aging bridges as a challenge. For many of these states, the challenge of maintaining aging bridges is intertwined with the challenge of inadequate funds.
View GAO-16-779. For more information, contact Mark Goldstein at 202-512-2834 or [email protected].
Why GAO Did This Study The nation’s 612,000 bridges are critical elements of the surface transportation system, but the entire system is under growing strain and funding it is on GAO’s High Risk List. While state and local governments own and maintain most of the nation’s bridges, the federal government provides some funding for them, administered by FHWA. In 2012, legislative changes consolidated the bridge-funding program into other highway programs, giving states more flexibility in how to allocate funds.
GAO was asked to review the funding and management of bridges. This report examines trends, over the past 10 years, in (1) the condition and (2) the funding of the nation’s bridges, as well as (3) how states fund and manage their bridge programs, given the 2012 legislative changes. GAO analyzed FHWA’s bridge conditions and funding data; reviewed applicable laws, relevant FHWA program guidance, and federal guidance on performance measures; and interviewed federal officials and transportation officials from 24 states and D.C., selected to include those with large bridge inventories, among other factors.
What GAO Recommends GAO recommends that DOT direct FHWA to develop measures on the linkage between the federal funding of bridges and the desired outcomes—maintained or improved bridge conditions—and report results to Congress. DOT concurred with our recommendation. DOT also provided technical comments, which we incorporated, as appropriate.

Page i GAO-16-779 Highway Bridges
Letter 1
Background 3 Bridge Conditions Have Generally Improved Nationwide over the
Past 10 Years 9 Federal Bridge Funding has Been Stable in the Last 10 Years, but
the Effects of Expended Resources Are Unclear 15 Selected States Reported Little Change in the Way They Fund
and Manage Highway Bridges, and Identified Various Challenges Related to Funding and Aging Bridges 23
Conclusions 29 Recommendation for Executive Action 29 Agency Comments 29
Appendix I Objectives, Scope, and Methodology 31
Appendix II Change in the Condition of Bridges, by State, from 2006 to 2015 33
Appendix III Comments from the Department of Transportation 35
Appendix IV GAO Contact and Staff Acknowledgments 37
Tables
Table 1: Federal Highway Administration Funds Obligated for Highway Bridges by Program, Fiscal Years 2006 through 2015 (Millions) 16
Table 2: Estimated Highway Bridge Spending by All Levels of Government (Federal, State, and Local), Selected Years (Billions) 19
Table 3: Examples of Increased Flexibility of Federal Highway Funds for Bridge Projects 24
Table 4: State DOT Examples of Challenges of Inadequate Funding for Highway Bridges 26
Table 5: State DOT Examples of Challenges Relating to Aging Highway Bridge Inventories 27
Table 6: Other Challenges Cited by State DOT Officials 28
Contents

Page ii GAO-16-779 Highway Bridges
Table 7: Change in the Percentage of Bridges and Total Deck Area That Are Structurally Deficient, by State, from 2006 to 2015 33
Figures
Figure 1: Total Deck Area Accounts for the Size of Bridges 8 Figure 2: Percentage of Structurally Deficient Highway Bridges
Nationwide by Total Deck Area and by Number, 2006 to 2015 10
Figure 3: Percentage of Total Deck Area on Highway Bridges in Each State That Is Structurally Deficient, 2015 12
Figure 4: Total Deck Area of Highway Bridges, by Year Built, 1900 through 2015 14
Figure 5: Total Deck Area of Structurally Deficient Highway Bridges, by Year Built, 1900 through 2015 15
Figure 6: Federal Obligations for Highway Bridges by Improvement Type, Fiscal Years 2006 and 2015 18
Figure 7: Efficiency Measures Are a Ratio of a Program’s Inputs to Its Outputs or Outcomes 21

Page iii GAO-16-779 Highway Bridges
Abbreviations AASHTO American Association of State Highway and Transportation
Officials D.C. District of Columbia DOT Department of Transportation ER Emergency Relief Program FAST Act Fixing America’s Surface Transportation Act FHWA Federal Highway Administration FMIS Fiscal Management Information System GPRA Government Performance and Results Act HBP Highway Bridge Program MAP-21 Moving Ahead for Progress in the 21st Century Act NACE National Association of County Engineers NBI National Bridge Inventory NBIS National Bridge Inspection Standards NHPP National Highway Performance Program NHS National Highway System non-NHS non-National Highway System OMB Office of Management and Budget STBGP Surface Transportation Block Grant Program STP Surface Transportation Program
This is a work of the U.S. government and is not subject to copyright protection in the United States. The published product may be reproduced and distributed in its entirety without further permission from GAO. However, because this work may contain copyrighted images or other material, permission from the copyright holder may be necessary if you wish to reproduce this material separately.
Page 1 GAO-16-779 Highway Bridges
441 G St. N.W. Washington, DC 20548
September 14, 2016 The Honorable Bill Shuster Chairman The Honorable Peter A. DeFazio Ranking Member Committee on Transportation and Infrastructure House of Representatives
The Honorable Sam Graves Chairman The Honorable Eleanor Holmes Norton Ranking Member Subcommittee on Highways and Transit Committee on Transportation and Infrastructure House of Representatives
Bridges are critical elements of the nation’s transportation system, supporting commerce, economic vitality, and personal mobility. In 2015, the United States had nearly 612,000 bridges comprising over 4-billion square feet of total deck area.1 Bridge safety first emerged as a high-priority issue in the United States in the 1960s, following the collapse of the Silver Bridge between Ohio and West Virginia, a collapse that killed 46 people. Congress responded to national concerns by establishing the first federal bridge program in 1970, which provided a funding mechanism to assist states in replacing unsafe bridges on the federal-aid highway system.2 The Federal Highway Administration (FHWA), within the federal Department of Transportation (DOT), both: (1) administers the program that supports the construction, maintenance, and preservation of the
1Bridges in this report refer to publicly owned highway bridges that are greater than 20 feet in length and that are located on public roads. Deck area is a measure that accounts for the size of bridges. We include culverts (structures with fill over them) in measurements of total deck area. 2The Special Bridge Replacement Program (Pub. L. No. 91-605, 84 Stat. 1713 (1970)) was replaced and expanded through subsequent legislation and became known as the Highway Bridge Program (HBP).
Letter

Page 2 GAO-16-779 Highway Bridges
nation's bridges and (2) oversees the implementation of the National Bridge Inspection Standards (NBIS), among other duties. While federal funding is provided to state governments to help improve highway infrastructure, state and local governments own and maintain most of the nation’s highways and bridges. State-level DOTs are responsible for ensuring bridge inspections are completed and compiling data in a national inventory on bridge conditions within their states according to federal standards.
Funding the nation’s surface transportation system is on GAO’s High Risk List.3 Our work has shown that the system is under growing strain, and the cost to repair and upgrade the system to meet current and future demands is estimated to be in the hundreds of billions of dollars. We had also found that the buying power of motor fuel and other truck-related taxes that support the Highway Trust Fund—the major source of federal surface transportation funding—are eroding and a long-term sustainable plan for funding surface transportation is needed. In 2012, after over 40 years of having a dedicated federal bridge program, provisions in the Moving Ahead for Progress in the 21st Century Act (MAP-21) altered the sources of federal funds to use for bridge activities and projects and gave states more flexibility in determining how to allocate highway funds.4 You asked us to review bridge funding and management. This report examines:
1. trends, over the past 10 years, in the condition of the nation’s bridges;
2. trends, over the same period, in federal funding of the nation’s bridges and how FHWA monitors the linkage between this funding and outcomes; and
3. changes since the enactment of MAP-21 in how selected states fund and manage their bridge programs, including any challenges they face.
To conduct this work, we reviewed applicable laws and relevant FHWA program guidance. To determine trends in the condition of the nation’s bridges, we reviewed and analyzed FHWA’s National Bridge Inventory (NBI) data from calendar years 2006 through 2015. To determine trends
3GAO, High-Risk Series: An Update, GAO-15-290 (Washington, D.C.: Feb. 11, 2015). 4Pub. L. No. 112-141, § 1106,126 Stat. 405,432 (2012).

Page 3 GAO-16-779 Highway Bridges
in funding the nation’s bridges, we reviewed and analyzed data on federal obligations for bridge projects in FHWA’s Fiscal Management Information System (FMIS) from fiscal years 2006 through 2015. We assessed the reliability of the data that we used by reviewing documentation and interviewing FHWA officials on data verification and found the data to be reliable for our purposes. We interviewed FHWA officials on bridge conditions and funding and reviewed Office of Management and Budget’s (OMB) guidance and leading practices we have previously identified related to tracking, through performance measures, the linkage between funding and outcomes and compared current activities to this guidance and these leading practices. To determine how states fund and manage their bridge programs, including any challenges they face, we interviewed representatives from the American Association of State Highway and Transportation Officials (AASHTO) and the National Association of County Engineers (NACE), state officials from 24 states and the District of Columbia (D.C.), and local government transportation officials from 10 agencies. We selected this non-generalizable sample of states because they have large bridge inventories and receive relatively high levels of federal surface transportation funding and for geographic dispersion. From the selected states, we further selected 5 states for site visits, based on similar selection criteria, in order to obtain additional information. We selected California, Oklahoma, Rhode Island, Texas, and Washington for site visits. In these states, we met with state transportation officials, FHWA Division Office officials, and officials from two local government transportation agencies from each state based on recommendations from state officials. Appendix I contains more detailed information on our scope and methodology.
We conducted this performance audit from October 2015 to September 2016 in accordance with generally accepted government auditing standards. Those standards require that we plan and perform the audit to obtain sufficient, appropriate evidence to provide a reasonable basis for our findings and conclusions based on our audit objectives. We believe that the evidence obtained provides a reasonable basis for our findings and conclusions based on our audit objectives.
Federal programs for bridge construction, reconstruction, and repair are authorized in surface transportation acts. In 2012, MAP-21 consolidated a number of existing highway formula programs, including the Highway Bridge Program (HBP). Bridge projects are now generally funded through the National Highway Performance Program (NHPP) and the Surface
Background
Page 4 GAO-16-779 Highway Bridges
Transportation Block Grant Program (STBGP).5 MAP-21 included a number of statutory requirements related to transforming the surface transportation system to a performance-based approach. For instance, MAP-21 directed DOT to establish performance measures related to highway safety, asset condition, and highway system performance, among other things. In some cases, MAP-21 required DOT to use the rulemaking process to implement performance-based requirements.6 In 2015, the Fixing America’s Surface Transportation Act (FAST Act), which reauthorized surface transportation programs, largely maintained current program structures, including MAP-21’s overall performance-management approach. The FAST Act also expanded the eligibility of NHPP funds to be used for reconstruction, resurfacing, restoration, rehabilitation, or preservation of a non-National Highway System (non-NHS) bridge if the bridge is on a Federal-aid highway.7
5MAP-21 authorized funding, through the NHPP and the Surface Transportation Program (STP), to assist states in the construction, replacement, rehabilitation, preservation, and protection of bridges. Pub. L. No. 112-141, § 1106,126 Stat. 405,432 (2012). The 2015 Fixing America’s Surface Transportation Act (FAST Act; Pub. L. No. 114-94, 129 Stat. 1312) replaced the STP with the STBGP. 6DOT is formally establishing requirements for states and other grantees to implement the performance-based approach through the rulemaking process, including two planned rules—1) National Performance Management Measures: Assessing Pavement Condition for the National Highway Performance Program and Bridge Condition for the National Highway Performance Program 80 Fed. Reg. 8250 (Feb. 17, 2015) and 2) Asset Management Plan 80 Fed. Reg. 9231 (Feb. 20, 2015)—relevant to bridge condition measures. After DOT defines the performance measures, states are to set and maintain targets based on those measures, collect data, and report to DOT their progress in meeting their targets. Transportation performance measures relate to the condition of pavement, the condition of bridges, and other aspects such as highway safety. GAO, Surface Transportation: DOT is Progressing toward a Performance-Based Approach, but States and Grantees Report Potential Implementation Challenges, GAO-15-217 (Washington, D.C.: Jan. 16, 2015). 7The term “Federal-aid highway” means a public highway eligible for federal-funding assistance other than a highway functionally classified as a local road or rural minor collector. 23 U.S.C. § 101(a)(6). All bridges are grouped into one of two general categories: federal-aid highway bridges and bridges not on Federal-aid highways. Federal-aid highway bridges are generally located on the National Highway System (NHS), which includes about 230,000 miles of highway that are considered important to the nation’s economy, defense, and mobility. Non-Federal-aid highway bridges, also known as “off-system bridges,” generally carry lower volumes of traffic and are located on highways functionally classified as a local road or rural minor collector.
Page 5 GAO-16-779 Highway Bridges
FHWA is the agency charged with oversight of the condition of the nation’s bridges. FHWA administers the federal-aid highway program that provides about $40 billion each year to states to design, construct, and preserve the nation’s roadway and bridge infrastructure. These funds are distributed through annual apportionments established by statutory formulas. FHWA oversees the federal-aid highway program primarily through its 52 Division Offices located in each state, D.C., and Puerto Rico. FHWA Division Offices have 10 to 61 staff each, depending on the size of the state’s highway program and other factors. As of June 2016, FHWA had approximately 2,800 staff—about two-thirds in the field and the remaining third at FHWA headquarters.
FHWA distributes and tracks federal funds for highway and bridge projects and collects some data to estimate annual spending by state and local governments on highway and bridge projects. Specifically, FHWA tracks federal-aid highway program obligations in FMIS, for individual project segments or contracts. This allows FHWA to collect and report information on the types of activities (such as obligations for the construction of new bridges) funded with Highway Trust Fund monies.8
Although federal funding is provided to states to help improve highway infrastructure, state and local agencies own and maintain most of the nation’s bridges. State and local agencies typically provide matching funds on bridge projects that receive federal funding and may contribute funds beyond their match amount.9 State-level DOTs are responsible for ensuring bridge inspections are completed and for inventorying bridges within their states according to federal standards (except for tribally or federally owned bridges). State DOTs and local-planning organizations have discretion in determining how to allocate available federal funds among various projects and are responsible for selecting highway projects, including bridge projects.
8Federal surface transportation programs are primarily funded by taxes on motor fuels and other truck-related taxes that are deposited into the Highway Trust Fund. 26 U.S.C. § 9503. 9Federal funds for highways must generally be matched by funds from other sources—usually state and local governments. The matching requirement on most projects is 80 percent federal and 20 percent state or local funding.
Page 6 GAO-16-779 Highway Bridges
FHWA collects some data to estimate annual spending by state and local governments on highway and bridge projects. Specifically, FHWA requests that state DOTs submit several forms to the Office of Transportation Policy Studies on a regular basis, such as:
• Form 532, State Highway Expenditures—submitted annually, it requests the total spent on all highways by the state, including bridges; bridges are not separately reported.
• Form 536, Local Highway Finance Report—submitted biennially, it requests the total spent on all highways by all units of the state’s local governments. Bridges are not separately reported. Acknowledging difficulties in obtaining data from local agencies, FHWA recommends that states use sampling and estimation to prepare this form, such as collecting data from a selection of local governments and then expanding the sample to generate statewide totals.
• Form 534, State Highway Capital Outlay and Maintenance Expenditures—submitted annually, it requests bridge-specific and other highway outlays. This form is designed to complement the data in Form 532 by classifying the highway expenditures of states into improvement types, such as new construction and rehabilitation, among other things.
As part of its oversight role, FHWA collects information from states on bridge conditions and maintains this data in its NBI database. Bridges that receive low inspection ratings on specific bridge elements are classified as deficient. Bridges may be classified as deficient for one of two reasons:
• A structurally deficient bridge has one or more structural components, such as the deck that directly carries vehicles, in poor condition. Structurally deficient bridges often require maintenance and repair to remain in service.
• A functionally obsolete bridge has a configuration or design that may no longer be adequate for the traffic it serves, such as being too

Page 7 GAO-16-779 Highway Bridges
narrow or having inadequate overhead clearance.10 Functionally obsolete bridges do not necessarily require repair to remain in service. A bridge that is both structurally deficient and functionally obsolete is listed as structurally deficient in the NBI.
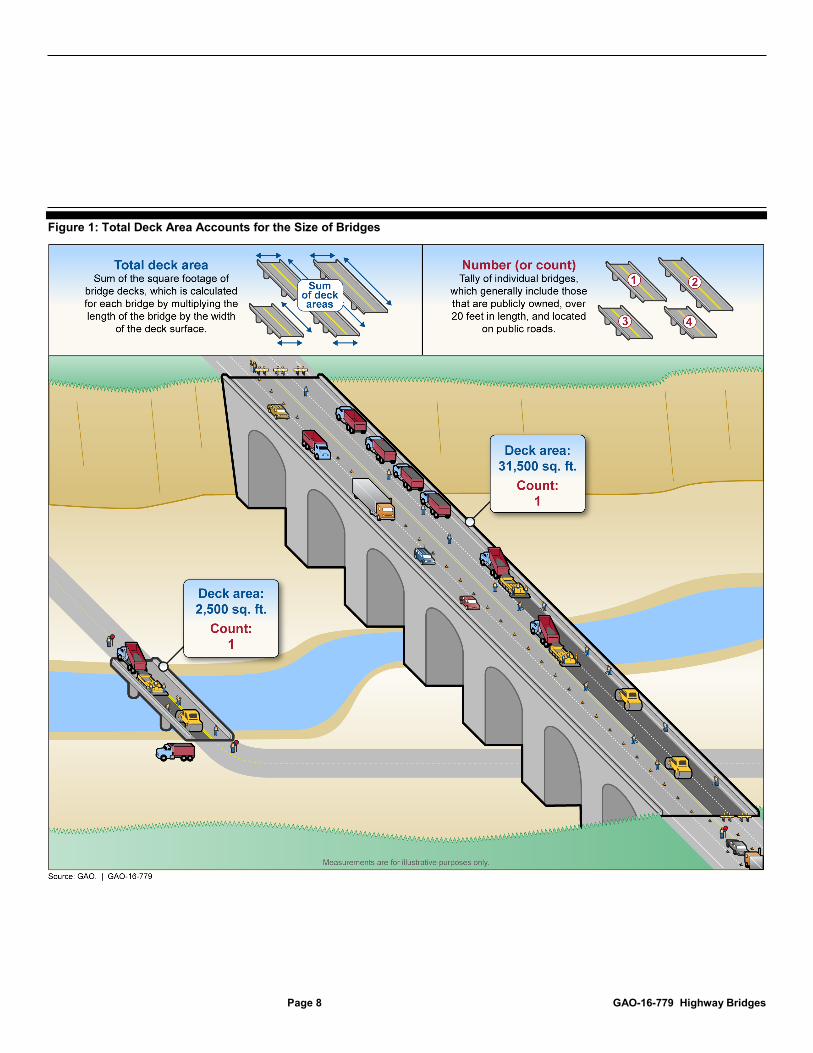
In this report, we assess the conditions of bridges classified as structurally deficient by both the total deck area and number of bridges.11 Analysis of conditions based on the total number of bridges without considering the size of bridges can create an incomplete picture. A state may have a large number of deficient bridges, but if the deficient bridges are small bridges, the total deck area in need could still be relatively low. In comparison, another state could have very few deficient bridges, but if those deficient bridges are large, the total deck area in need could be much higher. Bridges may vary significantly in size and generally, the needs of larger bridges are more costly than those of smaller bridges. Measuring the total deck area, which accounts for the size of a bridge, provides more information than counting the number of bridges (see fig. 1).
10Functionally obsolete is a classification indicating deficiency. However, these deficiencies are not connected to the structural condition of the bridge. According to FHWA officials, functionally obsolete is a legacy term that was used to help make funding decisions prior to MAP-21 and does not measure bridge condition. FHWA is moving away from this term. In this report, we will include data on functionally obsolete bridges in footnotes. 11To determine the total deck area, we calculated the deck area of each bridge in the NBI by multiplying the “structure length” (NBI Item number 49) by the “deck width, out-to-out” (NBI Item number 52) or by the “approach roadway width” (NBI Item number 32) for culverts.
Page 8 GAO-16-779 Highway Bridges
Figure 1: Total Deck Area Accounts for the Size of Bridges

Page 9 GAO-16-779 Highway Bridges
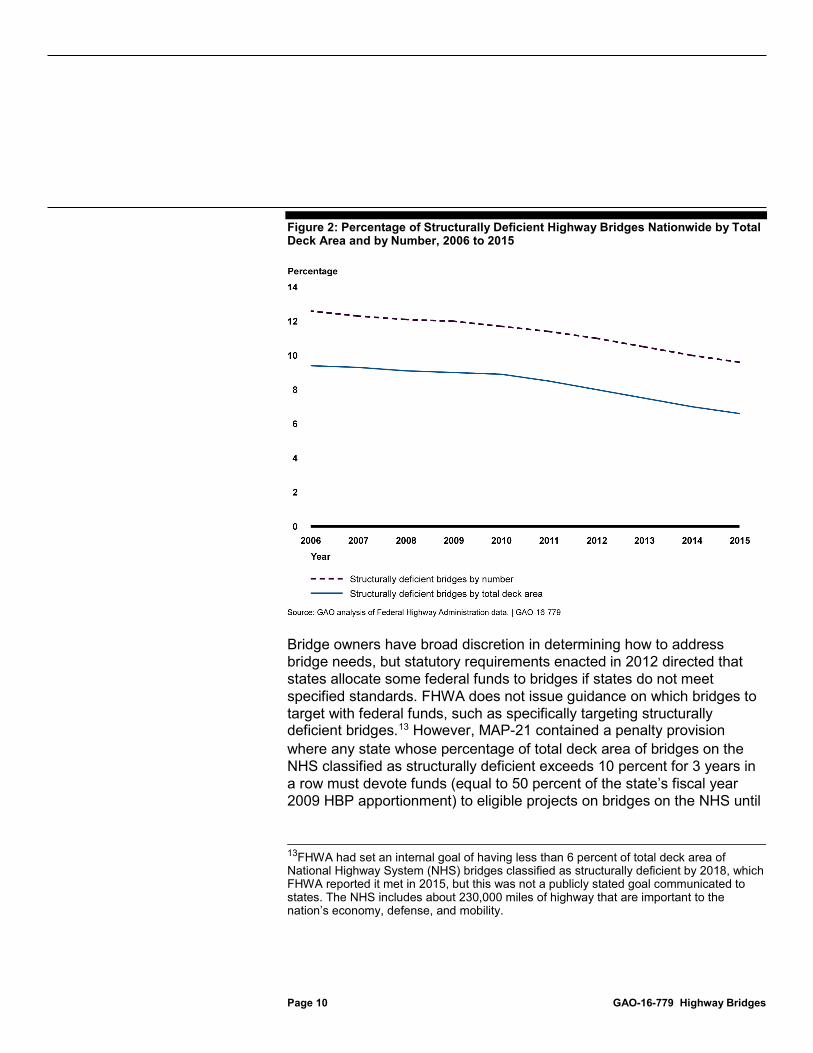
We found that bridge conditions, as indicated by data in the NBI, have improved nationwide over the past 10 years, as measured by total deck area and number of bridges that are structurally deficient. The percentage of structurally deficient deck area and bridges declined along the same trajectory from 2006 to 2015. Specifically, the deck area on bridges classified as structurally deficient decreased from 9 percent to 7 percent, and over the same time period, structurally deficient bridges, by number of bridges, decreased from 13 percent to 10 percent (see fig. 2).12
12The percentage of deck area classified as functionally obsolete remained the same at 20 percent from 2006 to 2015, and decreased from 15 percent to 14 percent by number of bridges.
Bridge Conditions Have Generally Improved Nationwide over the Past 10 Years Bridge Conditions Have Generally Improved, but Improvements Vary by State
Page 10 GAO-16-779 Highway Bridges
Figure 2: Percentage of Structurally Deficient Highway Bridges Nationwide by Total Deck Area and by Number, 2006 to 2015
Bridge owners have broad discretion in determining how to address bridge needs, but statutory requirements enacted in 2012 directed that states allocate some federal funds to bridges if states do not meet specified standards. FHWA does not issue guidance on which bridges to target with federal funds, such as specifically targeting structurally deficient bridges.13 However, MAP-21 contained a penalty provision where any state whose percentage of total deck area of bridges on the NHS classified as structurally deficient exceeds 10 percent for 3 years in a row must devote funds (equal to 50 percent of the state’s fiscal year 2009 HBP apportionment) to eligible projects on bridges on the NHS until
13FHWA had set an internal goal of having less than 6 percent of total deck area of National Highway System (NHS) bridges classified as structurally deficient by 2018, which FHWA reported it met in 2015, but this was not a publicly stated goal communicated to states. The NHS includes about 230,000 miles of highway that are important to the nation’s economy, defense, and mobility.

Page 11 GAO-16-779 Highway Bridges
they meet this minimum threshold.14 FHWA officials told us they plan to use bridge condition data from 2014 through 2016 to determine if a penalty is to be applied to the states, and begin imposing this penalty in 2017 if needed.
Despite overall improvements, among states there is variation in bridge conditions. Specifically, our review of 2015 NBI data shows that some states have substantially higher percentages of deck area on bridges classified as structurally deficient than others have (see fig. 3). For example, 21 percent of the total deck area in Rhode Island, affecting 23 percent of the 766 bridges in the state, is structurally deficient. While in Texas, less than 2 percent of the total deck area, affecting less than 2 percent of the state’s 53,209 bridges, is structurally deficient.
14Pub. L. No. 112-141, § 1106, 126 Stat. 432, codified at 23 U.S.C. § 119(f)(2).

Page 12 GAO-16-779 Highway Bridges
Figure 3: Percentage of Total Deck Area on Highway Bridges in Each State That Is Structurally Deficient, 2015
Most but not all states have made some improvements in reducing their percentage of deck area on bridges classified as structurally deficient over the past 10 years. Forty-one states, D.C., and Puerto Rico reduced the percentage from 2006 to 2015. Rhode Island had the greatest reduction, going from over 40 percent to over 20 percent of total deck area on bridges that are structurally deficient. However, in 9 states the percentage increased from 2006 to 2015. Delaware had the highest increase in the percentage of deck area on bridges classified as structurally deficient, going from 2 percent to almost 6 percent.15 GAO
15According to FHWA, in states with a small inventory of bridges, such as Delaware, one large bridge becoming structurally deficient can substantially increase the percentage of deck area on bridges that are structurally deficient.
Page 13 GAO-16-779 Highway Bridges
has reported that reducing structurally deficient bridges may not always be a state’s highest priority.16 For example, a state may have other priorities for bridge projects such as seismic retrofitting. According to AASHTO representatives, states use their judgment in deciding how to prioritize their funding for bridge projects. See appendix II for more information about the percentages of bridges and total deck area that are structurally deficient in each state.
The number of bridges and amount of total deck area increased dramatically from the 1950s through 1970s. The average age of bridges nationwide is 45 years, based on our analysis of NBI data. According to FHWA, the design life of the majority of existing bridges is 50 years, though bridges have life spans that are dependent on factors such as materials, environment, level of use, and level of maintenance. Also according to FHWA, new design guidelines and construction materials may raise the expected service life of new bridges to 75 years or longer. However, states and other bridge owners are faced with significant challenges in addressing the needs of existing bridges. In the 1950s, at the beginning of the Interstate-era, through the 1970s, the number of bridges constructed in the United States as well as the total square footage of bridge deck constructed increased greatly (see fig. 4).
16GAO, Highway Bridge Program, Clearer Goals and Performance Measures Needed for a More Focused and Sustainable Program, GAO-08-1043 (Washington, D.C.: Sept. 10, 2008).
Bridge Conditions May Become More Challenging to Address as Bridges Age

Page 14 GAO-16-779 Highway Bridges
Figure 4: Total Deck Area of Highway Bridges, by Year Built, 1900 through 2015
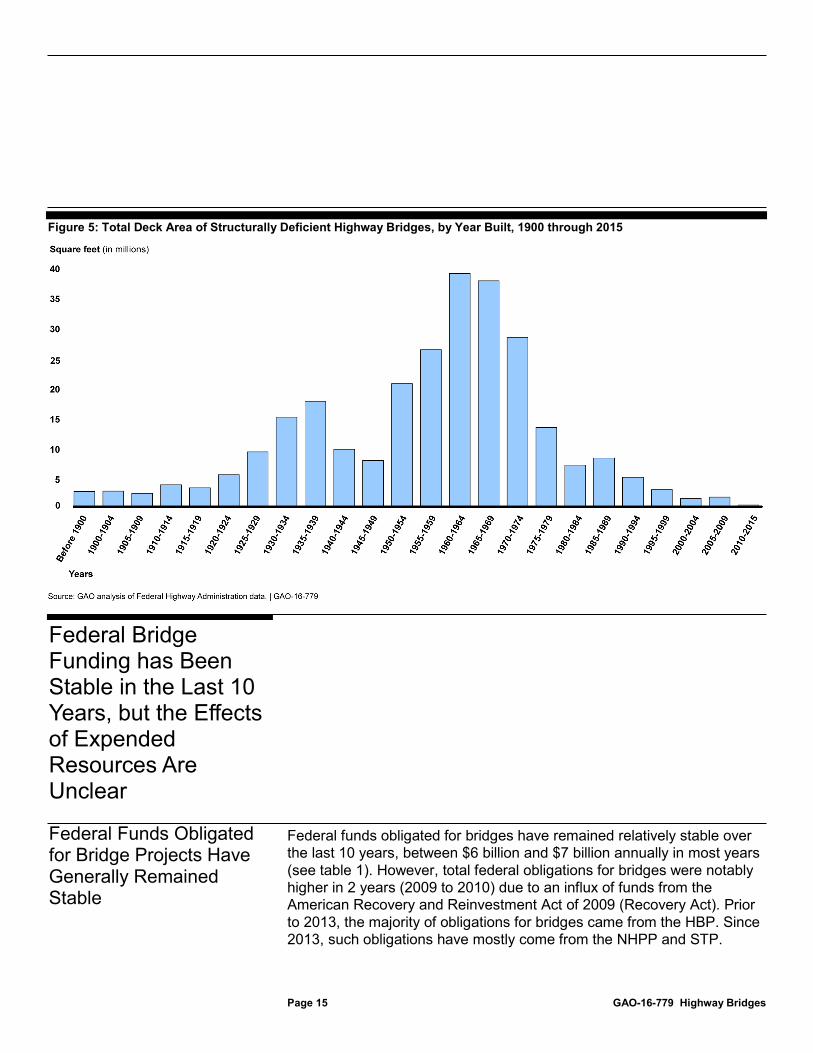
Analysis of NBI data indicates that the large number of bridges built during that time has led to an increase in the need to address those bridges that are now structurally deficient. Specifically, as shown in figure 5, the levels of structurally deficient total deck area are greatest for those built from 1960 through 1974, during which years the total deck area of bridges built in the United States peaked. The increased total deck area of bridges built after the 1950s suggest that an increase in bridges with structural deficiency may be expected and thus would increase the need for bridge maintenance, replacement, or rehabilitation.
Page 15 GAO-16-779 Highway Bridges
Figure 5: Total Deck Area of Structurally Deficient Highway Bridges, by Year Built, 1900 through 2015
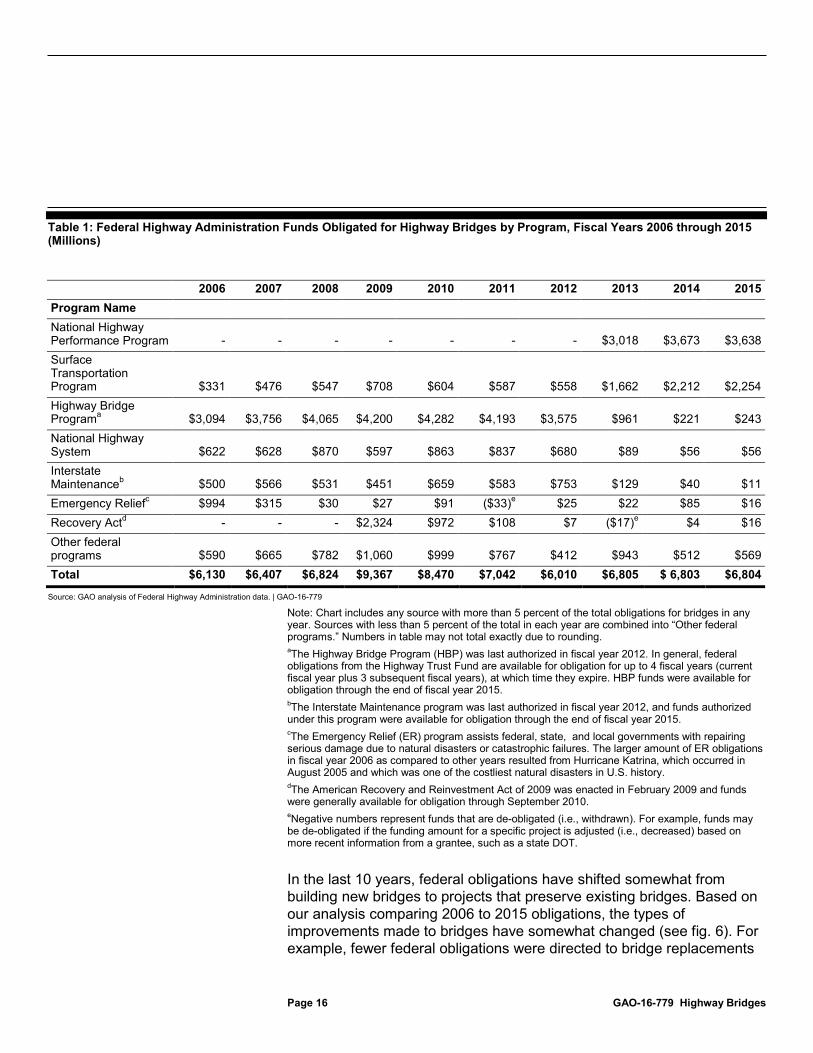
Federal funds obligated for bridges have remained relatively stable over the last 10 years, between $6 billion and $7 billion annually in most years (see table 1). However, total federal obligations for bridges were notably higher in 2 years (2009 to 2010) due to an influx of funds from the American Recovery and Reinvestment Act of 2009 (Recovery Act). Prior to 2013, the majority of obligations for bridges came from the HBP. Since 2013, such obligations have mostly come from the NHPP and STP.
Federal Bridge Funding has Been Stable in the Last 10 Years, but the Effects of Expended Resources Are Unclear
Federal Funds Obligated for Bridge Projects Have Generally Remained Stable
Page 16 GAO-16-779 Highway Bridges
Table 1: Federal Highway Administration Funds Obligated for Highway Bridges by Program, Fiscal Years 2006 through 2015 (Millions)
2006 2007 2008 2009 2010 2011 2012 2013 2014 2015 Program Name National Highway Performance Program - - - - - - - $3,018 $3,673 $3,638 Surface Transportation Program $331 $476 $547 $708 $604 $587 $558 $1,662 $2,212 $2,254 Highway Bridge Programa $3,094 $3,756 $4,065 $4,200 $4,282 $4,193 $3,575 $961 $221 $243 National Highway System $622 $628 $870 $597 $863 $837 $680 $89 $56 $56 Interstate Maintenanceb $500 $566 $531 $451 $659 $583 $753 $129 $40 $11 Emergency Reliefc $994 $315 $30 $27 $91 ($33)e $25 $22 $85 $16 Recovery Actd - - - $2,324 $972 $108 $7 ($17)e $4 $16 Other federal programs $590 $665 $782 $1,060 $999 $767 $412 $943 $512 $569 Total $6,130 $6,407 $6,824 $9,367 $8,470 $7,042 $6,010 $6,805 $ 6,803 $6,804
Source: GAO analysis of Federal Highway Administration data. | GAO-16-779
Note: Chart includes any source with more than 5 percent of the total obligations for bridges in any year. Sources with less than 5 percent of the total in each year are combined into “Other federal programs.” Numbers in table may not total exactly due to rounding. aThe Highway Bridge Program (HBP) was last authorized in fiscal year 2012. In general, federal obligations from the Highway Trust Fund are available for obligation for up to 4 fiscal years (current fiscal year plus 3 subsequent fiscal years), at which time they expire. HBP funds were available for obligation through the end of fiscal year 2015. bThe Interstate Maintenance program was last authorized in fiscal year 2012, and funds authorized under this program were available for obligation through the end of fiscal year 2015. cThe Emergency Relief (ER) program assists federal, state, and local governments with repairing serious damage due to natural disasters or catastrophic failures. The larger amount of ER obligations in fiscal year 2006 as compared to other years resulted from Hurricane Katrina, which occurred in August 2005 and which was one of the costliest natural disasters in U.S. history. dThe American Recovery and Reinvestment Act of 2009 was enacted in February 2009 and funds were generally available for obligation through September 2010. eNegative numbers represent funds that are de-obligated (i.e., withdrawn). For example, funds may be de-obligated if the funding amount for a specific project is adjusted (i.e., decreased) based on more recent information from a grantee, such as a state DOT.
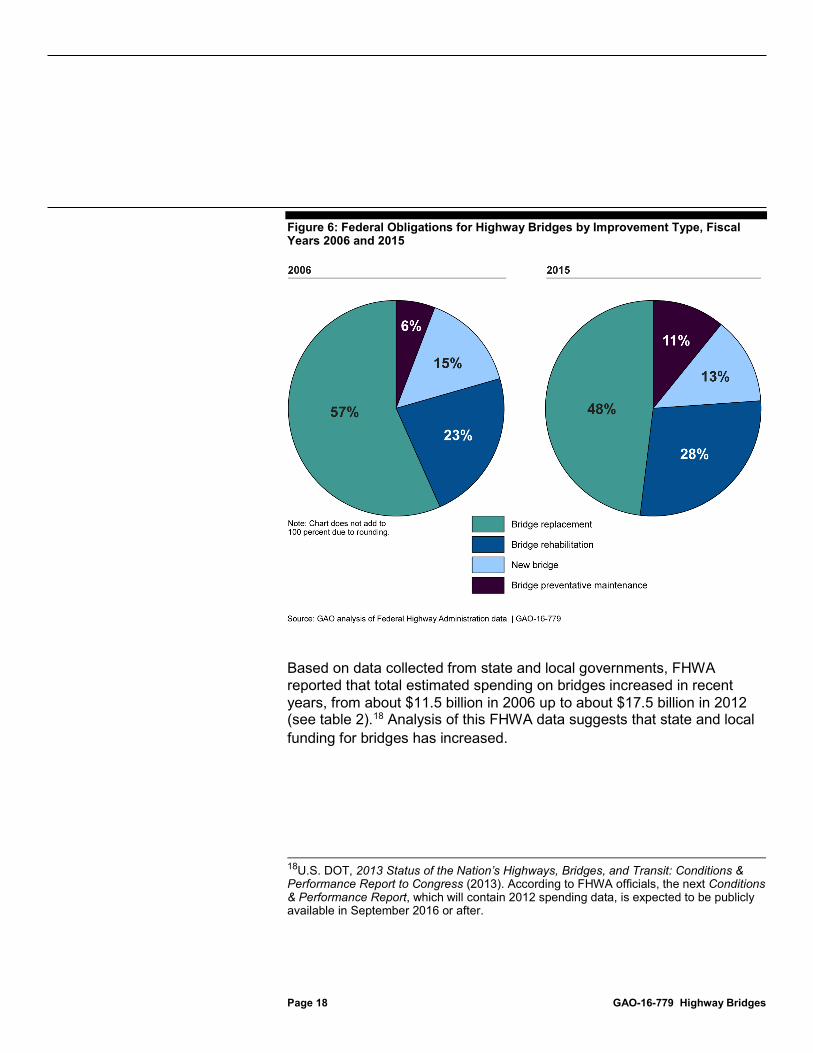
In the last 10 years, federal obligations have shifted somewhat from building new bridges to projects that preserve existing bridges. Based on our analysis comparing 2006 to 2015 obligations, the types of improvements made to bridges have somewhat changed (see fig. 6). For example, fewer federal obligations were directed to bridge replacements

Page 17 GAO-16-779 Highway Bridges
in 2015 than in 2006 (decreasing from 57 percent in 2006 to 48 percent in 2015). Also, fewer obligations went toward new bridges in 2015 than in 2006 (from 15 percent to 13 percent). Additionally, more obligations went toward bridge rehabilitation work—major work required to restore the structural integrity of a bridge or necessary to correct major safety defects—in 2015 than in 2006 (this increased from 23 percent of obligations in 2006 to 28 percent in 2015). Finally, the percentage of obligations used for preventative maintenance increased from 2006 to 2015 (from 6 percent to 11 percent). This is partly because more preventative maintenance activities such as bridge cleaning, painting steel bridges, sealing concrete, and repairing or replacing deck joints, became eligible for federal bridge program funding in 2006.17
17FHWA defines preventive maintenance as a planned strategy of extending the useful life by applying cost-effective treatments to preserve bridges, retard future deterioration, and maintain or improve the functional condition of the system (without substantially increasing structural capacity).
Page 18 GAO-16-779 Highway Bridges
Figure 6: Federal Obligations for Highway Bridges by Improvement Type, Fiscal Years 2006 and 2015
Based on data collected from state and local governments, FHWA reported that total estimated spending on bridges increased in recent years, from about $11.5 billion in 2006 up to about $17.5 billion in 2012 (see table 2).18 Analysis of this FHWA data suggests that state and local funding for bridges has increased.
18U.S. DOT, 2013 Status of the Nation’s Highways, Bridges, and Transit: Conditions & Performance Report to Congress (2013). According to FHWA officials, the next Conditions & Performance Report, which will contain 2012 spending data, is expected to be publicly available in September 2016 or after.

Page 19 GAO-16-779 Highway Bridges
Table 2: Estimated Highway Bridge Spending by All Levels of Government (Federal, State, and Local), Selected Years (Billions)
Estimated total bridge
spendinga Federal obligations to
bridgesb
Calculated estimates on state and local bridge spendingc
2006 $11.5 $6.1 $5.4 2008 $14.2 $6.8 $7.4 2010 $18.0 $8.5 $9.5 2012 $17.5 $6.0 $11.5
Source: GAO analysis of Federal Highway Administration data. | GAO-16-779
Notes: According to FHWA, there is a timing difference between obligations and spending. Funds obligated in one year may be spent gradually over a period of years. Federal obligations to bridges were higher in 2010 (as well as in 2009, not shown) due to an influx of funds from the American Recovery and Reinvestment Act of 2009. The table’s figures are drawn from multiple sources as outlined in alphabetical and superscripted table notes below. They correspond to alphabetical and superscripted table notes inside the table. aReported in Federal Highway Administration’s (FHWA) Conditions & Performance Report to Congress, 2013 and additional FHWA data. bGAO analysis of FHWA Fiscal Management Information System data. cGAO analysis.
FHWA tracks both the condition of bridges and the funding targeted to them, as described below.
• As part of its oversight role, FHWA seeks to ensure that states comply with the NBIS, which details the process for and frequency of bridge inspections.19 FHWA also collects bridge condition data from states and maintains the NBI, the primary source of information on the nation’s bridges. The NBI contains information on each bridge, such as its location, size, age, condition, and inspection dates.
• FHWA (1) maintains data on total federal obligations dedicated to bridges each year; (2) periodically estimates the contributions from state and local agencies through data collection efforts; and (3) periodically reports to Congress its estimates of total funds dedicated to bridges (including state and local funds) in its Conditions & Performance Report, issued roughly every 2 years. The report also estimates future-spending needs to maintain or improve current conditions and performance.
1923 C.F.R. §§650.301 – 317.
FHWA Does Not Link Bridge Funding to Changes in Bridge Conditions

Page 20 GAO-16-779 Highway Bridges
However, FHWA currently lacks a mechanism for tracking the relationship between the invested funds and the corresponding outcomes—maintained and improved bridge conditions. Given that FHWA already estimates total funds dedicated to bridges and collects data on bridge conditions nationwide, it has the information needed to create performance measures that would demonstrate the link between federal funding and the outcomes for bridges. According to leading practices for government management identified by OMB and GAO, agencies should not only have and report performance measures but also use them to link outcomes with resources invested. Specifically, the Government Performance and Results Act (GPRA) of 1993 and the GPRA Modernization Act of 2010 establish the framework for performance management in the federal government. Under this framework, federal agencies are required to, among other things, assess whether relevant programs and activities are contributing as planned to established goals.20 Further, MAP-21 included a declaration on the importance of accountability and linking performance outcomes to investment decisions.21 We have reported that linking performance outcomes with information on resources invested (i.e., data on the resources used to produce an outcome, including costs) can help agencies to more clearly understand how changes in invested resources may result in changes to performance.22
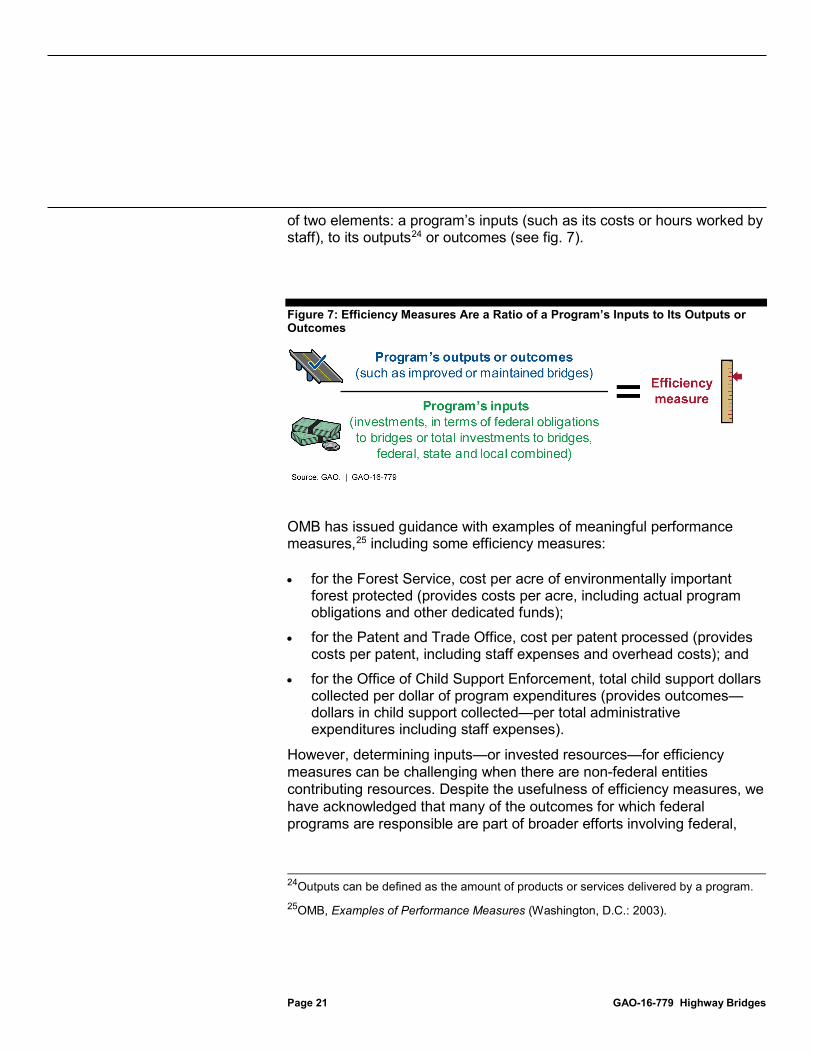
We have also reported that an effective way to show the relationship between resources invested and outcomes is for agencies to use efficiency measures.23 These measures are typically defined as the ratio
20While the GPRA framework requires agency-level entities (e.g. DOT) to use and track performance measures, this tracking is considered a leading practice for modal units within agencies, as we have previously reported, such as for FHWA. For example, see GAO, Foreign Aid Reform: Comprehensive Strategy, Interagency Coordination, and Operational Improvements Would Bolster Current Efforts, GAO-09-192 (Washington, D.C.: Apr. 17, 2009), 31. 21Pub.L.No. 112-141, § 1111, 126 Stat. 405, 445(2012). 22GAO, Managing for Results: Enhancing Agency Use of Performance Information for Management Decision Making, GAO-05-927 (Washington, D.C.: Sept. 9, 2005). 23GAO, Streamlining Government: Opportunities Exist to Strengthen OMB’s Approach to Improving Efficiency, GAO-10-394 (Washington, D.C.: May 7, 2010).
Page 21 GAO-16-779 Highway Bridges
of two elements: a program’s inputs (such as its costs or hours worked by staff), to its outputs24 or outcomes (see fig. 7).
Figure 7: Efficiency Measures Are a Ratio of a Program’s Inputs to Its Outputs or Outcomes
OMB has issued guidance with examples of meaningful performance measures,25 including some efficiency measures:
• for the Forest Service, cost per acre of environmentally important forest protected (provides costs per acre, including actual program obligations and other dedicated funds);
• for the Patent and Trade Office, cost per patent processed (provides costs per patent, including staff expenses and overhead costs); and
• for the Office of Child Support Enforcement, total child support dollars collected per dollar of program expenditures (provides outcomes—dollars in child support collected—per total administrative expenditures including staff expenses).
However, determining inputs—or invested resources—for efficiency measures can be challenging when there are non-federal entities contributing resources. Despite the usefulness of efficiency measures, we have acknowledged that many of the outcomes for which federal programs are responsible are part of broader efforts involving federal,
24Outputs can be defined as the amount of products or services delivered by a program. 25OMB, Examples of Performance Measures (Washington, D.C.: 2003).

Page 22 GAO-16-779 Highway Bridges
state, local, and other partners, and thus it can be difficult to isolate a particular federal program’s contribution to the broader outcomes.26 This is the case for highway programs, since funds from federal, state and local sources all contribute to maintained or improved asset conditions. However, federal guidance exists that may help. To assist agencies in implementing the GPRA framework, OMB issued guidance about how federal agencies might address the challenge of developing performance measures for programs that co-mingle funds from different sources (i.e., federal, state, and local funds) in support of a broad goal.27 The guidance acknowledged that it can be difficult to assess the marginal impact of the federal investment for programs where combined co-mingled funding contributes to the same broad performance outcome, but recommended that agencies should nonetheless seek to assess the marginal impact of the federal investment to the overall outcomes. OMB guidance noted that in such cases, the resource inputs from non-federal partners may be relevant in assessing the effectiveness of programs matched by federal assistance. OMB suggested that in such cases, agencies should consider crafting two performance measures of efficiency: one measure reporting unit costs in terms of output per federal dollar spent and another measure reporting unit costs in terms of the output per combined dollars spent.
FHWA officials told us that they have not developed measures linking resources to outcomes. This is mostly due to limitations of the previous version of their financial tracking system, FMIS. Specifically, officials explained that prior to the most recent version of FMIS (Version 5), which was launched in October 2015, data were collected on a project segment level that may have included multiple bridges. Thus, it was not possible to directly compare federal obligations on bridge projects to outcomes, in the form of bridge conditions found in the NBI. However, when asked, officials said that such a comparison could be possible with the newest version of FMIS by creating a connection between FMIS and the NBI and showing what happens to bridge conditions when federal obligations change over time. Using such performance measures would help FHWA to demonstrate the link between federal funding and outcomes for bridges. As FHWA has reported in recent budget requests, states face increasing
26GAO-10-394. 27OMB, Performance Measurement Challenges and Strategies (Washington, D.C.: June 18, 2003).

Page 23 GAO-16-779 Highway Bridges
challenges in finding sufficient funding for their infrastructure needs.28 In addition, as GAO has previously reported, bridge infrastructure—like most of the nation’s physical infrastructure—is under strain. Steady increases in road usage, congestion, and the aging of the nation’s bridges will likely continue to present challenges in the future.29
Most of the state government officials we interviewed reported that, consistent with FHWA data, bridge funding has been stable since the federal bridge program was consolidated into other programs in 2012. We interviewed officials from 24 states and D.C., and officials from 21 states and D.C. told us there had been no change in funding their bridge programs in the last 4 years. Officials from 3 states reported an overall increase in bridge funding since that time, although officials from 2 of those states indicated that the increase in bridge funding was not necessarily a result of federal changes.
28See, for example, FHWA FY 2016 Budget and FHWA FY 2015 Budget, both accessible from: https://www.transportation.gov/budget, accessed June 10, 2016. 29GAO-08-1043.
Selected States Reported Little Change in the Way They Fund and Manage Highway Bridges, and Identified Various Challenges Related to Funding and Aging Bridges
Selected States Reported That Bridge Funding Has Generally Not Changed but That Flexibility of Funding Has Increased
Page 24 GAO-16-779 Highway Bridges
The general stability in bridge funding may be a result of the long time frame for programming bridge projects, which could create a lag in funding levels’ response to policy changes. AASHTO representatives told us it is difficult to judge the impact of federal statutory changes on bridges because of the long-term nature of infrastructure projects. Ten states and D.C. provided us with examples of bridge-programming cycles of 5 years or greater. For example, Ohio DOT officials told us that they program their bridge projects 6 years into the future. Through this process, state officials determine their project needs and request a planned allocation for the 6th year of the funding cycle. With this type of long-term planning and budgeting process, it may take several years for a change in federal policy to have a noticeable effect on bridge projects’ funding.
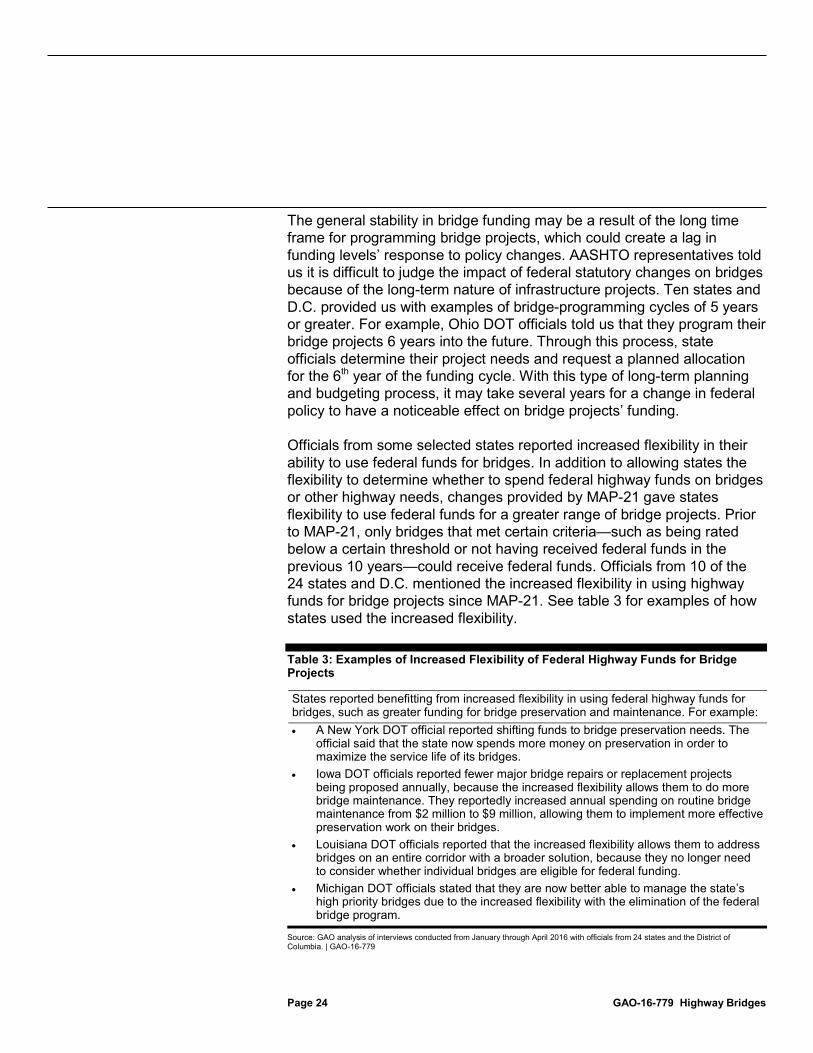
Officials from some selected states reported increased flexibility in their ability to use federal funds for bridges. In addition to allowing states the flexibility to determine whether to spend federal highway funds on bridges or other highway needs, changes provided by MAP-21 gave states flexibility to use federal funds for a greater range of bridge projects. Prior to MAP-21, only bridges that met certain criteria—such as being rated below a certain threshold or not having received federal funds in the previous 10 years—could receive federal funds. Officials from 10 of the 24 states and D.C. mentioned the increased flexibility in using highway funds for bridge projects since MAP-21. See table 3 for examples of how states used the increased flexibility.
Table 3: Examples of Increased Flexibility of Federal Highway Funds for Bridge Projects
States reported benefitting from increased flexibility in using federal highway funds for bridges, such as greater funding for bridge preservation and maintenance. For example: • A New York DOT official reported shifting funds to bridge preservation needs. The
official said that the state now spends more money on preservation in order to maximize the service life of its bridges.
• Iowa DOT officials reported fewer major bridge repairs or replacement projects being proposed annually, because the increased flexibility allows them to do more bridge maintenance. They reportedly increased annual spending on routine bridge maintenance from $2 million to $9 million, allowing them to implement more effective preservation work on their bridges.
• Louisiana DOT officials reported that the increased flexibility allows them to address bridges on an entire corridor with a broader solution, because they no longer need to consider whether individual bridges are eligible for federal funding.
• Michigan DOT officials stated that they are now better able to manage the state’s high priority bridges due to the increased flexibility with the elimination of the federal bridge program.
Source: GAO analysis of interviews conducted from January through April 2016 with officials from 24 states and the District of Columbia. | GAO-16-779
Page 25 GAO-16-779 Highway Bridges
Officials from most selected states told us there have been no changes in prioritizing bridges relative to other transportation assets. Specifically, officials from 18 states and D.C. reported that they give bridges the same priority as they did prior to MAP-21. Officials from several of these states said that bridges have remained a high priority because of safety concerns. For example, an official from the New York DOT said that there is a keen awareness of what happens when bridges are not maintained, citing the state’s major bridge failures in the 1980s—the Mianus River Bridge in 1983 and the Schoharie Creek Bridge in 1987, and thus bridges have remained a priority over time in New York.
Though most states have reportedly not changed the way they prioritize bridges, officials from 2 states told us that bridges’ relative priority may change after they implement performance management principles. For example, California officials told us they are transitioning toward a performance-based management approach where the needs of different transportation assets, including bridges and pavement, will be weighed against each other in order to meet performance targets within budgetary constraints. According to officials, a possible outcome is that local agencies in California may need more funding to repair their pavement or other assets to meet performance targets, which have yet to be determined through the FHWA rulemaking process on performance measures that is under way. Further, officials stated that these changes could have an impact on future bridge funding and relative priority. Likewise in Iowa, officials said that the state is moving toward using asset management principles in future decision making, which will involve more comparisons across different types of projects.
Officials from a majority of the states and local agencies we interviewed cited inadequate funding as a challenge for their bridge programs. Of the officials we interviewed from 24 states and D.C., officials from 14 described inadequate funding as a challenge. See table 4 for examples of challenges of inadequate bridge funding cited.
Selected States Have Not Changed How They Prioritize Bridges Relative to Other Transportation Projects
Selected State and Local Officials Reported That the Needs of Aging Bridges Outpace Available Funding, among Other Challenges
Page 26 GAO-16-779 Highway Bridges
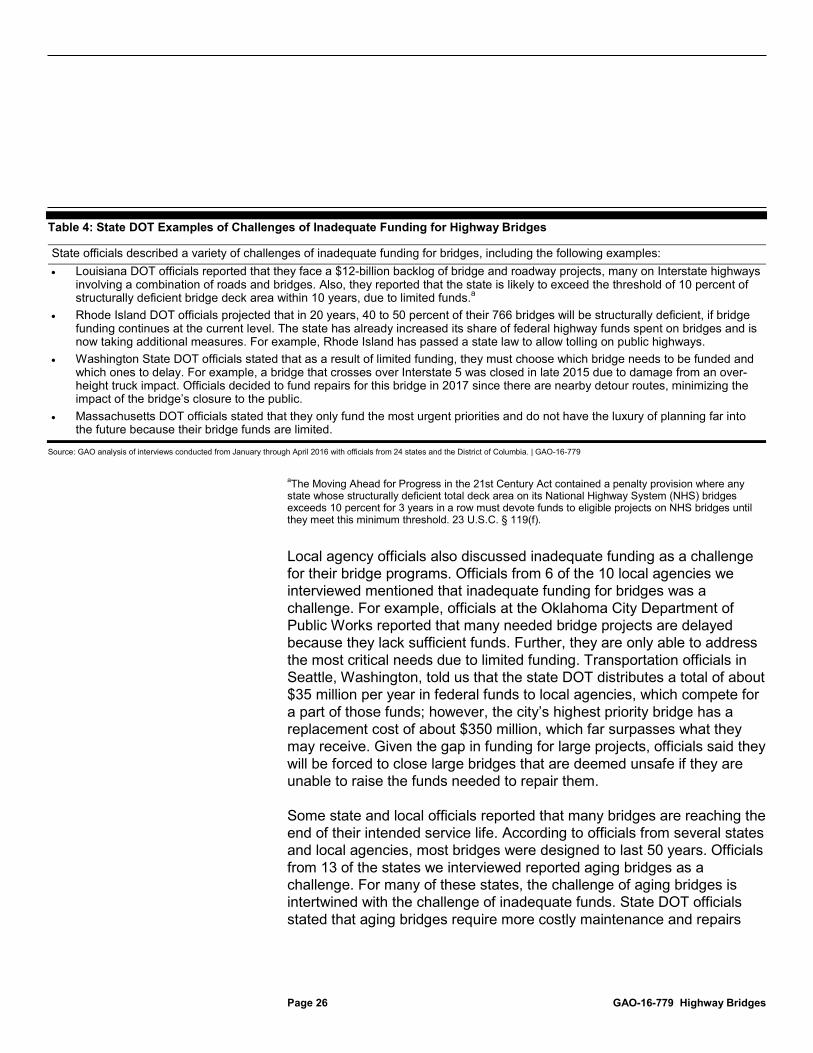
Table 4: State DOT Examples of Challenges of Inadequate Funding for Highway Bridges
State officials described a variety of challenges of inadequate funding for bridges, including the following examples: • Louisiana DOT officials reported that they face a $12-billion backlog of bridge and roadway projects, many on Interstate highways
involving a combination of roads and bridges. Also, they reported that the state is likely to exceed the threshold of 10 percent of structurally deficient bridge deck area within 10 years, due to limited funds.a
• Rhode Island DOT officials projected that in 20 years, 40 to 50 percent of their 766 bridges will be structurally deficient, if bridge funding continues at the current level. The state has already increased its share of federal highway funds spent on bridges and is now taking additional measures. For example, Rhode Island has passed a state law to allow tolling on public highways.
• Washington State DOT officials stated that as a result of limited funding, they must choose which bridge needs to be funded and which ones to delay. For example, a bridge that crosses over Interstate 5 was closed in late 2015 due to damage from an over-height truck impact. Officials decided to fund repairs for this bridge in 2017 since there are nearby detour routes, minimizing the impact of the bridge’s closure to the public.
• Massachusetts DOT officials stated that they only fund the most urgent priorities and do not have the luxury of planning far into the future because their bridge funds are limited.
Source: GAO analysis of interviews conducted from January through April 2016 with officials from 24 states and the District of Columbia. | GAO-16-779
aThe Moving Ahead for Progress in the 21st Century Act contained a penalty provision where any state whose structurally deficient total deck area on its National Highway System (NHS) bridges exceeds 10 percent for 3 years in a row must devote funds to eligible projects on NHS bridges until they meet this minimum threshold. 23 U.S.C. § 119(f).
Local agency officials also discussed inadequate funding as a challenge for their bridge programs. Officials from 6 of the 10 local agencies we interviewed mentioned that inadequate funding for bridges was a challenge. For example, officials at the Oklahoma City Department of Public Works reported that many needed bridge projects are delayed because they lack sufficient funds. Further, they are only able to address the most critical needs due to limited funding. Transportation officials in Seattle, Washington, told us that the state DOT distributes a total of about $35 million per year in federal funds to local agencies, which compete for a part of those funds; however, the city’s highest priority bridge has a replacement cost of about $350 million, which far surpasses what they may receive. Given the gap in funding for large projects, officials said they will be forced to close large bridges that are deemed unsafe if they are unable to raise the funds needed to repair them.
Some state and local officials reported that many bridges are reaching the end of their intended service life. According to officials from several states and local agencies, most bridges were designed to last 50 years. Officials from 13 of the states we interviewed reported aging bridges as a challenge. For many of these states, the challenge of aging bridges is intertwined with the challenge of inadequate funds. State DOT officials stated that aging bridges require more costly maintenance and repairs
Page 27 GAO-16-779 Highway Bridges
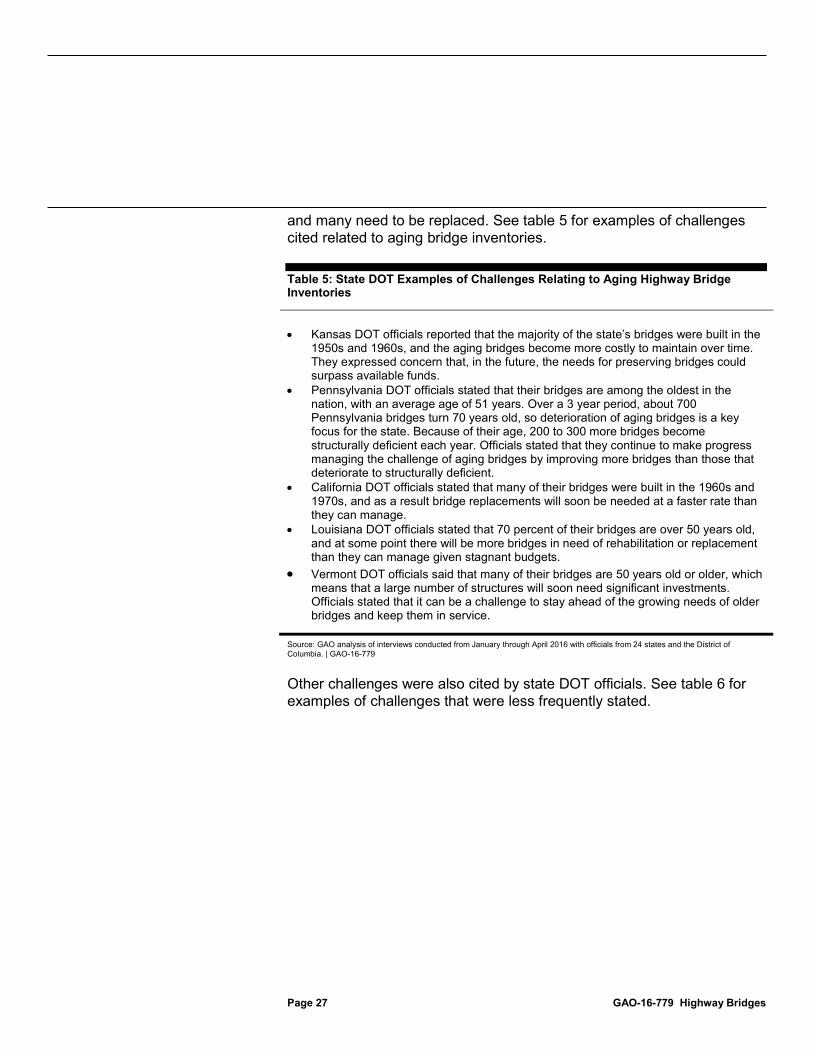
and many need to be replaced. See table 5 for examples of challenges cited related to aging bridge inventories.
Table 5: State DOT Examples of Challenges Relating to Aging Highway Bridge Inventories
• Kansas DOT officials reported that the majority of the state’s bridges were built in the 1950s and 1960s, and the aging bridges become more costly to maintain over time. They expressed concern that, in the future, the needs for preserving bridges could surpass available funds.
• Pennsylvania DOT officials stated that their bridges are among the oldest in the nation, with an average age of 51 years. Over a 3 year period, about 700 Pennsylvania bridges turn 70 years old, so deterioration of aging bridges is a key focus for the state. Because of their age, 200 to 300 more bridges become structurally deficient each year. Officials stated that they continue to make progress managing the challenge of aging bridges by improving more bridges than those that deteriorate to structurally deficient.
• California DOT officials stated that many of their bridges were built in the 1960s and 1970s, and as a result bridge replacements will soon be needed at a faster rate than they can manage.
• Louisiana DOT officials stated that 70 percent of their bridges are over 50 years old, and at some point there will be more bridges in need of rehabilitation or replacement than they can manage given stagnant budgets.
• Vermont DOT officials said that many of their bridges are 50 years old or older, which means that a large number of structures will soon need significant investments. Officials stated that it can be a challenge to stay ahead of the growing needs of older bridges and keep them in service.
Source: GAO analysis of interviews conducted from January through April 2016 with officials from 24 states and the District of Columbia. | GAO-16-779
Other challenges were also cited by state DOT officials. See table 6 for examples of challenges that were less frequently stated.
Page 28 GAO-16-779 Highway Bridges
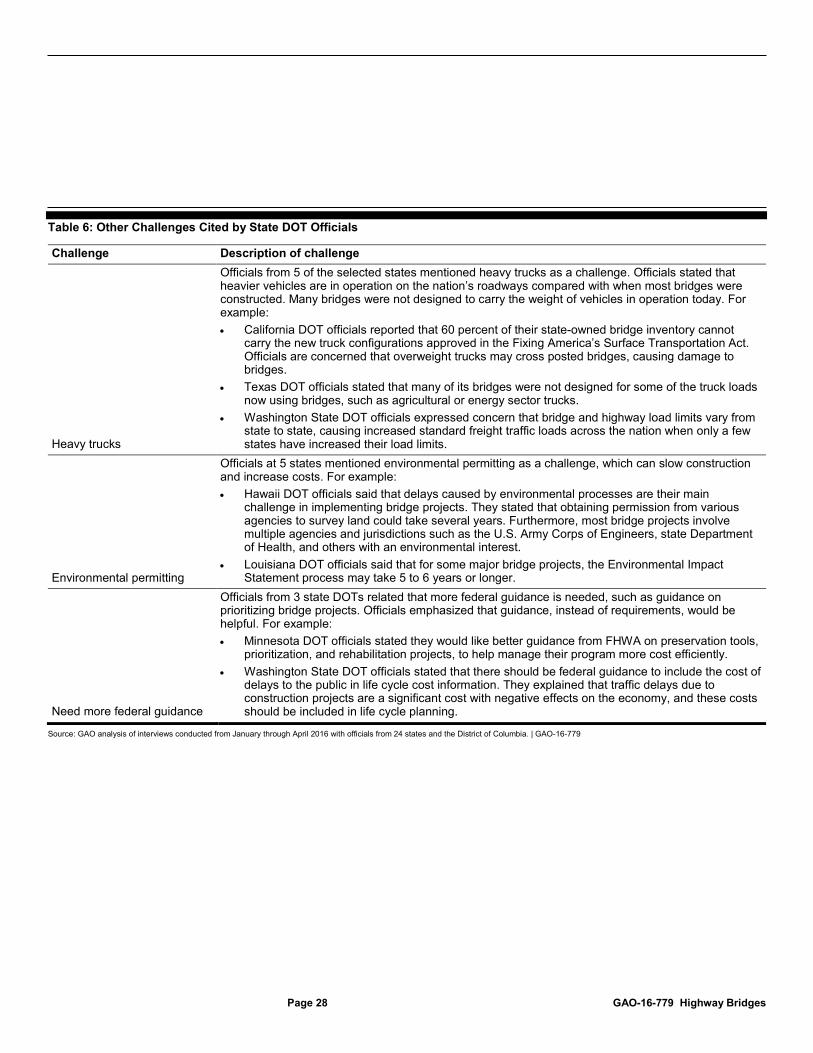
Table 6: Other Challenges Cited by State DOT Officials
Challenge Description of challenge
Heavy trucks
Officials from 5 of the selected states mentioned heavy trucks as a challenge. Officials stated that heavier vehicles are in operation on the nation’s roadways compared with when most bridges were constructed. Many bridges were not designed to carry the weight of vehicles in operation today. For example: • California DOT officials reported that 60 percent of their state-owned bridge inventory cannot
carry the new truck configurations approved in the Fixing America’s Surface Transportation Act. Officials are concerned that overweight trucks may cross posted bridges, causing damage to bridges.
• Texas DOT officials stated that many of its bridges were not designed for some of the truck loads now using bridges, such as agricultural or energy sector trucks.
• Washington State DOT officials expressed concern that bridge and highway load limits vary from state to state, causing increased standard freight traffic loads across the nation when only a few states have increased their load limits.
Environmental permitting
Officials at 5 states mentioned environmental permitting as a challenge, which can slow construction and increase costs. For example: • Hawaii DOT officials said that delays caused by environmental processes are their main
challenge in implementing bridge projects. They stated that obtaining permission from various agencies to survey land could take several years. Furthermore, most bridge projects involve multiple agencies and jurisdictions such as the U.S. Army Corps of Engineers, state Department of Health, and others with an environmental interest.
• Louisiana DOT officials said that for some major bridge projects, the Environmental Impact Statement process may take 5 to 6 years or longer.
Need more federal guidance
Officials from 3 state DOTs related that more federal guidance is needed, such as guidance on prioritizing bridge projects. Officials emphasized that guidance, instead of requirements, would be helpful. For example: • Minnesota DOT officials stated they would like better guidance from FHWA on preservation tools,
prioritization, and rehabilitation projects, to help manage their program more cost efficiently. • Washington State DOT officials stated that there should be federal guidance to include the cost of
delays to the public in life cycle cost information. They explained that traffic delays due to construction projects are a significant cost with negative effects on the economy, and these costs should be included in life cycle planning.
Source: GAO analysis of interviews conducted from January through April 2016 with officials from 24 states and the District of Columbia. | GAO-16-779

Page 29 GAO-16-779 Highway Bridges
Bridge conditions have generally improved nationwide over the past decade. However the increase in the number and size of bridges that are approaching the limits of their design life will likely place a greater demand on bridge owners in the near future, making it more difficult to mitigate issues in a cost-effective manner. While FHWA collects information on bridge conditions annually and maintains data on federal obligations dedicated to bridges, it lacks performance measures demonstrating the link between bridge funding and changes in bridge conditions. This lack is in part because a limitation in the prior financial-tracking system, which did not allow the direct comparison of federal obligations with bridge projects’ outcomes. However, with recent improvements to FMIS, FHWA has the information needed to create an efficiency measure or measures to demonstrate the link between federal funding and the outcomes for bridges. This information can support Congress in making informed choices about how to best invest the limited available resources in maintaining or improving the condition of the nation’s bridges.
We recommend that the Secretary of the Department of Transportation direct the FHWA Administrator to develop an efficiency measure or measures that demonstrate the linkage between the federal funding of bridges and the desired performance outcomes, such as maintained or improved bridge conditions, and report the resulting information to Congress.
We provided a draft of this report to DOT for its review and comment. In written comments, reproduced in appendix III, DOT concurred with our recommendation. In addition, DOT provided technical comments that we incorporated as appropriate.
Conclusions
Recommendation for Executive Action
Agency Comments

Page 30 GAO-16-779 Highway Bridges
We are sending copies of this report to appropriate congressional committees and the Secretary of Transportation. In addition, the report is available at no charge on the GAO website at http://www.gao.gov.
If you or your staff have any questions about this report, please contact me at (202) 512-2834 or [email protected]. Contact points for our Offices of Congressional Relations and Public Affairs may be found on the last page of this statement. The names of GAO staff who made key contributions to this report are listed in appendix IV.
Mark Goldstein Director, Physical Infrastructure Issues

Appendix I: Objectives, Scope, and Methodology
Page 31 GAO-16-779 Highway Bridges
This report addresses the funding and management of bridges and examines: (1) trends, over the past 10 years, in the condition of the nation’s bridges; (2) trends, over the same period, in federal funding of the nation’s bridges and how FHWA monitors the linkage between this funding and outcomes; and (3) changes since MAP-21 in how selected states fund and manage their bridge programs, including any challenges they face.
To determine trends in the condition of the nation’s bridges, we reviewed and analyzed FHWA’s National Bridge Inventory (NBI) data from calendar years 2006 through 2015. We limited our review of NBI data to bridges that are located on public roads and that are at least 20 feet in length. We obtained NBI data for bridges during the selected calendar years for an aggregate of all records and by state, including all 50 states; District of Columbia (D.C.); and Puerto Rico. Specifically, we reviewed data by number of bridges and total deck area, looking at deficiency status and year of bridge construction, among other data. We calculated total deck area based on a formula using structure length and deck width—or in the case of culverts (structures with fill over them), approach roadway width—using NBI data.
To determine trends in funding the nation’s bridges, we reviewed and analyzed federal obligations data on bridge projects in FHWA’s Fiscal Management Information System (FMIS) from fiscal years 2006 through 2015. Specifically, we obtained federal obligations data for bridge new construction, bridge replacement, bridge rehabilitation, bridge preventative maintenance, bridge protection, and bridge inspection and related training. We analyzed the data by improvement codes and by federal highway programs. In addition, we analyzed FHWA’s available data on state and local governments’ spending for bridge projects by reviewing data from the 2013 FHWA Conditions and Performance Report, reviewing FHWA’s Highway Statistics Series of reports, and interviewing FHWA officials. We assessed the reliability of the data that we used by reviewing documentation and interviewing officials on data verification and found the data to be reliable for our purposes. We also reviewed Office of Management and Budget (OMB) guidance and leading practices we have previously identified related to tracking, through performance measures, the linkage between funding and outcomes and compared current activities to this guidance and these leading practices.
To determine how states fund and manage their bridge programs, including any challenges they face, we interviewed representatives from the American Association of State Highway and Transportation Officials
Appendix I: Objectives, Scope, and Methodology
Appendix I: Objectives, Scope, and Methodology
Page 32 GAO-16-779 Highway Bridges
and the National Association of County Engineers. We also interviewed state officials from 24 states and D.C. We selected this non-generalizable sample of states because they have large bridge inventories, relatively high levels of federal surface transportation funding, and for geographic dispersion. The selected states were: California, Connecticut, Florida, Hawaii, Illinois, Iowa, Kansas, Louisiana, Massachusetts, Michigan, Minnesota, Mississippi, Missouri, Nebraska, New York, Ohio, Oklahoma, Oregon, Pennsylvania, Rhode Island, South Dakota, Texas, Vermont, and Washington. From the selected states, we further selected 5 states for site visits, based on selection criteria similar to that stated above, in order to obtain additional information from each state. We selected California, Oklahoma, Rhode Island, Texas, and Washington for site visits. In these states, we met with state transportation officials, FHWA Division Office officials, and officials from two local-government transportation agencies from each state. We selected the non-generalizable sample of local agencies based on recommendations from state officials of nearby local agencies that could accommodate our site visit schedule. The selected local agencies were: Los Angeles County (California); Placer County (California); City of Oklahoma City; Oklahoma Cooperative Circuit Engineering District #7; City of Providence (Rhode Island); Rhode Island Turnpike and Bridge Authority; City of Austin (Texas); Williamson County (Texas); King County (Washington); and City of Seattle (Washington).

Appendix II: Change in the Condition of Bridges, by State, from 2006 to 2015
Page 33 GAO-16-779 Highway Bridges
Table 7: Change in the Percentage of Bridges and Total Deck Area That Are Structurally Deficient, by State, from 2006 to 2015
Percentage of structurally deficient bridges by total deck area
Percentage of structurally deficient bridges by number
2006 2015
Change from 2006 to 2015
2006 2015
Change from 2006 to 2015
Alabama 5.5 3.6 -1.9
13.6 8.4 -5.2 Alaska 10.6 9.5 -1.1
13.0 9.9 -3.1
Arizona 1.8 3.5 1.7
2.3 3.1 0.8 Arkansas 5.5 7.0 1.5
8.8 6.6 -2.2
California 19.4 9.0 -10.4
12.9 7.9 -5.0 Colorado 7.1 5.1 -2.0
7.0 6.0 -1.0
Connecticut 11.5 14.7 3.2
8.6 8.4 -0.2 Delaware 1.7 5.5 3.8
4.1 5.5 1.4
District of Columbia 5.6 4.9 -0.7
8.9 3.9 -5.0 Florida 2.9 2.4 -0.5
2.8 2.1 -0.7
Georgia 4.4 2.7 -1.7
7.8 4.9 -2.9 Hawaii 3.8 1.5 -2.3
14.7 5.3 -9.4
Idaho 8.7 7.2 -1.5
8.5 8.8 0.3 Illinois 8.6 9.9 1.3
9.5 8.4 -1.1
Indiana 9.7 7.0 -2.7
11.4 9.0 -2.4 Iowa 13.3 10.8 -2.5
21.1 20.7 -0.4
Kansas 6.7 4.3 -2.4
12.0 9.2 -2.8 Kentucky 8.7 5.0 -3.7
10.1 8.3 -1.8
Louisiana 9.5 9.4 -0.1
14.1 14.1 0.0 Maine 11.4 8.8 -2.6
14.8 14.8 0.0
Maryland 5.9 3.2 -2.7
8.3 5.8 -2.5 Massachusetts 15.2 14.4 -0.8
12.0 8.9 -3.1
Michigan 16.9 9.2 -7.7
16.9 11.7 -5.2 Minnesota 5.6 4.3 -1.3
8.8 6.1 -2.7
Mississippi 8.9 5.4 -3.5
19.5 12.8 -6.7 Missouri 12.3 9.6 -2.7
19.3 13.2 -6.1
Montana 5.1 7.8 2.7
10.2 7.8 -2.4 Nebraska 8.5 7.7 -0.8
15.7 16.1 0.4
Nevada 2.1 1.7 -0.4
3.4 1.8 -1.6 New Hampshire 10.4 9.8 -0.6
14.0 12.6 -1.4
New Jersey 12.1 7.7 -4.4
12.0 8.9 -3.1 New Mexico 10.7 4.8 -5.9
10.5 6.7 -3.8
Appendix II: Change in the Condition of Bridges, by State, from 2006 to 2015

Appendix II: Change in the Condition of Bridges, by State, from 2006 to 2015
Page 34 GAO-16-779 Highway Bridges
New York 11.9 12.4 0.5
12.4 11.4 -1.0 North Carolina 12.4 9.6 -2.8
12.8 11.5 -1.3
North Dakota 8.9 6.9 -2.0
17.8 15.7 -2.1 Ohio 7.5 4.8 -2.7
10.6 7.0 -3.6
Oklahoma 19.2 9.4 -9.8
27.9 16.4 -11.5 Oregon 11.2 4.5 -6.7
9.1 5.2 -3.9
Pennsylvania 20.3 11.9 -8.4
25.8 21.0 -4.8 Puerto Rico 12.4 9.2 -3.2
12.0 12.8 0.8
Rhode Island 41.2 20.9 -20.3
28.7 23.2 -5.5 South Carolina 10.3 7.1 -3.2
14.3 10.7 -3.6
South Dakota 12.6 10.6 -2.0
20.1 19.7 -0.4 Tennessee 5.6 5.3 -0.3
6.7 5.1 -1.6
Texas 2.4 1.3 -1.1
4.6 1.9 -2.7 Utah 6.4 1.3 -5.1
8.8 3.1 -5.7
Vermont 19.1 5.7 -13.4
16.6 6.9 -9.7 Virginia 5.5 4.8 -0.7
9.0 7.7 -1.3
Washington 7.2 8.1 0.9
5.1 4.7 -0.4 West Virginia 10.3 9.2 -1.1
15.6 15.1 -0.5
Wisconsin 6.9 4.6 -2.3
9.8 9.1 -0.7 Wyoming 11.8 13.3 1.5
13.1 12.0 -1.1
Source: GAO analysis of Federal Highway Administration data. | GAO-16-779
Note: Negative figures indicate a decrease in percentage of structurally deficient bridges.
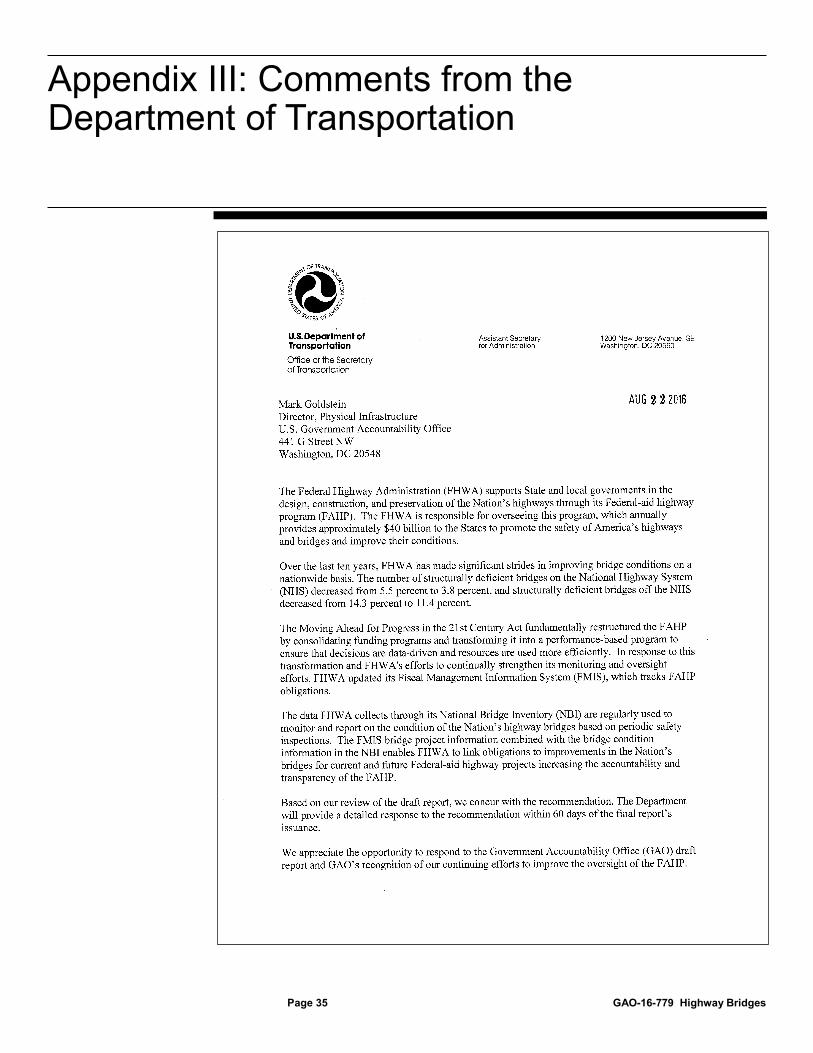
Appendix III: Comments from the Department of Transportation
Page 35 GAO-16-779 Highway Bridges
Appendix III: Comments from the Department of Transportation
Appendix III: Comments from the Department of Transportation
Page 36 GAO-16-779 Highway Bridges
Page 37 GAO-16-779 Highway Bridges
Mark Goldstein, (202) 512-2834, or [email protected]
In addition to the individual named above, Heather MacLeod, Assistant Director, Jessica Bryant-Bertail, Brian Chung, Danielle Ellingston, Dave Hooper, Ying Long, SaraAnn Moessbauer, Josh Ormond, and Amy Rosewarne made key contributions to this report.
Appendix IV: GAO Contact and Staff Acknowledgments
GAO Contact:
Staff Acknowledgments:
(100401)
Page 38 GAO-16-779 Highway Bridges
The Government Accountability Office, the audit, evaluation, and investigative arm of Congress, exists to support Congress in meeting its constitutional responsibilities and to help improve the performance and accountability of the federal government for the American people. GAO examines the use of public funds; evaluates federal programs and policies; and provides analyses, recommendations, and other assistance to help Congress make informed oversight, policy, and funding decisions. GAO’s commitment to good government is reflected in its core values of accountability, integrity, and reliability.
The fastest and easiest way to obtain copies of GAO documents at no cost is through GAO’s website (http://www.gao.gov). Each weekday afternoon, GAO posts on its website newly released reports, testimony, and correspondence. To have GAO e-mail you a list of newly posted products, go to http://www.gao.gov and select “E-mail Updates.”
The price of each GAO publication reflects GAO’s actual cost of production and distribution and depends on the number of pages in the publication and whether the publication is printed in color or black and white. Pricing and ordering information is posted on GAO’s website, http://www.gao.gov/ordering.htm.
Place orders by calling (202) 512-6000, toll free (866) 801-7077, or TDD (202) 512-2537.
Orders may be paid for using American Express, Discover Card, MasterCard, Visa, check, or money order. Call for additional information.
Connect with GAO on Facebook, Flickr, Twitter, and YouTube. Subscribe to our RSS Feeds or E-mail Updates. Listen to our Podcasts. Visit GAO on the web at www.gao.gov.
Contact:
Website: http://www.gao.gov/fraudnet/fraudnet.htm E-mail: [email protected] Automated answering system: (800) 424-5454 or (202) 512-7470
Katherine Siggerud, Managing Director, [email protected], (202) 512-4400, U.S. Government Accountability Office, 441 G Street NW, Room 7125, Washington, DC 20548
Chuck Young, Managing Director, [email protected], (202) 512-4800 U.S. Government Accountability Office, 441 G Street NW, Room 7149 Washington, DC 20548
James-Christian Blockwood, Managing Director, [email protected], (202) 512-4707 U.S. Government Accountability Office, 441 G Street NW, Room 7814, Washington, DC 20548
GAO’s Mission
Obtaining Copies of GAO Reports and Testimony Order by Phone
Connect with GAO
To Report Fraud, Waste, and Abuse in Federal Programs
Congressional Relations
Public Affairs
Strategic Planning and External Liaison
Please Print on Recycled Paper.