september 2016 lgim foresight - investment … · september 2016 lgim foresight 5 understanding...
TRANSCRIPT

SEPTEMBER 2016
For investment professionals only
LGIM Foresight
LONGEVITY RISK AND ITS IMPLICATIONS FOR ENDGAME PORTFOLIOS.

2SEPTEMBER 2016 LGIM FORESIGHT
Executive summary 3
Introduction 4
An increasingly significant component of scheme risk 5
Modelling longevity risk 7
Examining longevity risk 10
Impact on investment strategy 14
Other considerations 17
Conclusions 18
Appendix: Key modelling steps 19
Contents

3SEPTEMBER 2016 LGIM FORESIGHT
Executive summaryThis paper examines how uncertainty regarding future
mortality rates and life expectancy, i.e. longevity risk,
affects defined benefit pension schemes. The purpose of
this paper is to set out a framework for measuring and
understanding longevity risk, and to explore its potential
impact on investment strategy, particularly for schemes
aiming for self-sufficiency. The key points are:
First, pension schemes are maturing and there is an increasing focus on the endgame. As schemes approach their endgame, longevity risk is an increasingly significant component of overall scheme risk.
Second, properly understanding longevity risk requires use of stochastic models. These should integrate with models of the other risks that a pension scheme faces.
Third, consideration of longevity risk impacts investment strategy. For those schemes in run-off, the main conclusion is that schemes should likely maintain some investment risk at high funding levels, predominantly via credit but also from diversified growth assets, unless they are fully funded on particularly prudent longevity assumptions.
John SouthallSenior Investment Strategist
Marcus MollanHead of Investment Strategy

4SEPTEMBER 2016 LGIM FORESIGHT
Many DB pension schemes have not addressed longevity risk.
In general, longevity risk is defined as any potential risk resulting
from members of a population living longer than expected.
Improvements in longevity are bringing many challenges. One
of the most obvious and well-publicised impacts is the increased
cost of pension provision. In this piece we focus on the impact of
longevity risk on defined benefit (DB) pension schemes. We explore
how longevity risk can become a greater concern as a scheme de-
risks and adopts a more cashflow matched strategy, how schemes
can monitor and measure this risk and the potential impact on
investment strategy.
The risk management of DB pension schemes is a high priority for trustees and corporate sponsors. Those managing the assets and liabilities of pension schemes require appropriate models and hedging strategies to deal with the uncertainty around future financial, economic and demographic conditions. Strategies to mitigate equity, interest rate and inflation risk are widely used. In contrast, longevity risk has not yet been addressed in any meaningful way by many schemes. Longevity risk is typically addressed by entering into a buy-in, buy-out or longevity insurance policy.
It is common, when performing asset-liability analysis, to simply ignore longevity risk (and other demographic risks) and assume that benefit cashflows vary only in line with changes in inflation experience and expectations. The temptation is to manage only the risks that are most familiar and readily modelled, without considering the influence of less familiar risks. This does not typically lead to poor decision making when the scheme has a reasonably high proportion of risky assets, since longevity risk is usually dominated by investment risks such as equity risk.
1. Introduction
4SEPTEMBER 2016 LGIM FORESIGHT
As a scheme de-risks, ignoring longevity risk may lead to poor decisions.

5SEPTEMBER 2016 LGIM FORESIGHT
Understanding longevity risk is important for all DB schemes but is
likely to be of most interest to schemes that are in, or close to, their
‘endgame’ – a pension scheme’s long-term funding and investment
objective. This is typically either a ‘self-sufficient’ strategy, a buy-
out (where both longevity and investment risk are transferred to an
insurance company), or a combination of the two.
The term ‘self-sufficiency’ has no agreed definition but the general idea is that with a self-sufficient scheme, there is a reasonably low probability that the pension scheme will need to call on the sponsor for additional funding. In order for this to be the case, typically the scheme needs to be well funded and invested in assets that closely match the liabilities. The instruments usually used are gilts, swaps, liquid and illiquid credit and real assets such as infrastructure debt. There may also be a small allocation to growth assets for diversification purposes and to provide a higher expected return.
The journey to the endgame for a scheme, particularly how the investment strategy changes over time, is generally known as the glide path. Trustees and sponsors will, in general, have a plan for the glide path, setting out how they expect their scheme to move towards a long-term endgame1. Whilst there are some arguments for maintaining a relatively constant level of investment risk over time, trustees and sponsors will generally aim to reduce risk along this journey as a scheme matures and/or the funding position improves. Some of these reasons are given in figure 1.
2. An increasingly significant component of scheme risk
1More detail on these considerations is given in our May 2015 De-risking Dynamics thought piece on
‘‘Glidepaths in Defined Benefit Pension Schemes’’.
Figure 1
De-risking rationale
Reasons for de-risking glide paths in DB schemes
1. Reduced upside relative to the downside of holding growth assets as the funding position improves
2. Declining time frames over which to make good any deficit and therefore potentially more volatile contribution demands
3. Views of The Pensions Regulator that more mature, better-funded schemes would generally be expected to have lower investment risk
4. Regular reviews of strategy and the influence of loss aversion
5. Covenant considerations: it may be imprudent to plan to take a lot of investment risk in the future, when there is a risk that the sponsor covenant may have weakened
6. Growth assets should be held to back long-dated liabilities (eventually switched into matching assets) as the probability of additional return is greater over longer horizons
A DB scheme is typically aiming for ‘self-sufficiency’, buy-out, or a combination of the two.
Most schemes aim to reduce risk over time as a scheme matures.

6SEPTEMBER 2016 LGIM FORESIGHT
For these reasons, a pension scheme that is far away from self-sufficiency is likely to hold a relatively high proportion of its assets in equities and other volatile assets2. It is also more likely that a relatively low proportion of rates and inflation risk is hedged, or is hedged only approximately. In these circumstances, longevity risk will be relatively low risk compared with other sources of risk in the scheme. In contrast, for a more mature scheme that is reasonably well cashflow matched, the impact of longevity risk will be much more significant. Indeed, the key risks within a self-sufficiency portfolio are likely to be credit risk (including illiquidity risk) and longevity risk. Figure 2 shows this indicatively using a simple model for longevity risk. Economic risk in this figure refers to investment risk and liability risk arising from surprise changes in interest rates and inflation. Total risk is the combination of economic risk and longevity risk. Total risk is, in general, less than the sum of economic and longevity risks due to diversification. In the next section we look at more sophisticated approaches to understanding the risks involved.
Figure 2
Source: LGIM calculations
Stylised profile of economic and longevity risks in a pension scheme
2There are circumstances where immature and/or poorly funded schemes may take little investment risk.
This may reflect a weak employer covenant for example. In these circumstances longevity risk could be a
highly significant component of overall risk.
0% 50% 100%
Ris
k
Proportion of rates and inflation risk hedged
Total risk
Economic risk
Longevity risk
Impact of longevity risk = total risk - economic risk
The key risks in a self-sufficiency portfolio are likely to be credit risk and longevity risk.

7SEPTEMBER 2016 LGIM FORESIGHT
When looking at longevity risk, it is first worth looking at traditional approaches to understanding longevity risk in DB pension schemes and why these may prove inadequate. It is also sensible to look at drivers and components of longevity risk, before outlining a stochastic approach.
Traditional approaches for DB pension schemes
Traditionally, in the process of valuing pension liabilities, deterministic mortality tables have been used. These only provide one estimate of future mortality rates (probabilities of death). They account for anticipated future improvements in mortality rates but they do not give an indication of the risk of the mortality rates changing from that projected. Furthermore, irregular updates of these tables can cause problems such as extreme jumps in the reported funding position.
With this approach, sensitivity tests of the deterministic mortality assumption may be carried out, for example by changing the base table used, applying age ratings (e.g. treating everyone as if they were one year younger) or by shifting the assumed future mortality improvement rate up or down. However, deterministic mortality analysis cannot give a clear picture of the full distribution of the liabilities affected by longevity risk or the overall impact on the risks faced by a scheme.
To better understand and predict longevity risk therefore, stochastic mortality models are needed that allow the risk to be quantified both on a standalone basis and in conjunction with the other risks that the scheme faces.
Drivers of longevity risk
Before attempting to model longevity risk, it is worth considering the likely drivers involved. As described in the February 2014 edition of De-risking Dynamics, “Longevity improvements and changing retirement ages”, there are many potential drivers of changes in longevity. These and others are summarised in figure 3.
Stochastic models allow a better understanding of longevity risk than traditional sensitivity testing, as they allow for the interaction with other scheme risks.
3. Modelling longevity risk
Drivers of continued longevity improvements
Drivers of reduced improvement rates
Reduced infectious disease rates Complex illnesses such as dementia may be harder to tackle
Reduced occupational stress Global warming
Improved healthcare Pollution
Rising living standards Obesity
Lifestyle changes Biological limits of the human body
Increasing understanding of genetics and personalised medicine
Antibiotics lose effectiveness
Further advancements in medical technology such as 3D printing and ‘nano-bots’.
Overcrowding
Figure 3
Drivers of longevity changes

8SEPTEMBER 2016 LGIM FORESIGHT
Attempting to model the myriad of potential causes of future longevity trends is a challenging task. Even identifying the causes of historical changes is fraught with problems due to, for example, confusing correlation with causation, behavioural biases and ‘the fallacy of a single cause’3. Due to these difficulties we have instead adopted a stochastic approach which models longevity risk by breaking it down into its key statistical components and looking at the historical behaviour of these components.
Components of longevity risk
The longevity risk that a particular scheme faces has several components. The key components that we consider are shown in figure 4.
We distinguish between a) general changes in the probabilities of deaths occurring in the scheme, (`table risk’), and b) the possible experience of the scheme given those probabilities (`small scheme risk’, sometimes called `volatility risk’).
a) Table risk
There are two key parts to table risk:
• Fluctuations (i.e. noise) around the expected trend taken by mortality rates. We call this ̀ trend risk’
• Changes in the direction of the trend taken by mortality rates. We call this `trend-change risk’
b) Small scheme (volatility) risk
Of course, the experience of the scheme depends not just on the underlying mortality rates but also, given those mortality rates, the number of deaths in the scheme from sheer chance. For example, mortality rates may rise in general but this does not guarantee that there will be more deaths within the scheme. For large enough schemes the probability of experience deviating from probabilities, assuming those probabilities are correct, is negligible.
Small scheme risk is the longevity risk arising from a scheme having few members, or benefits being concentrated with a small number of members.
Figure 4Key components of longevity risk considered
Longevity risk
Table risk
Trend risk
Small scheme risk
Trend-change risk
Fluctuations around the
expected trend
Changes in the direction of the
trend
Idiosyncratic risk due to few
members
3The fallacy of a single cause is a fallacy that occurs when it is assumed that there is a single cause of an
outcome when in reality it may have been caused by several causes that are only jointly sufficient.
Table risk is the risk that underlying mortality rates evolve differently to expected.

9SEPTEMBER 2016 LGIM FORESIGHT
A stochastic model
We have developed a stochastic longevity model that allows for these components and enables us to estimate how uncertainty in future longevity improvements may impact a scheme’s ability to meet benefit cashflows and its funding position.
Our model is slightly different to other approaches, but shares features with many of them. It is inspired by the Lee-Carter modeli, widely used in demography and the social sciences, and Paul Sweeting’s trend shifting versionii of the Cairns-Blake-Dowd (CBD) modeliii, designed to forecast mortality at higher ages. A summary of the key steps involved in our modelling process is given in the Appendix.

10SEPTEMBER 2016 LGIM FORESIGHT
There are occasional shifts in the trend of mortality rates which can have a large impact on mortality rates in the longterm and ultimately how long pensions are paid for.
When looking at longevity risk, we must consider table risk, small scheme (volatility) risk and the approximate overall impact on risk for a scheme in or near self-sufficiency.
Table risk
In their discussion paper “A value-at-risk framework for longevity trend risk”iv
Richards, Currie and Ritchie describe how “longevity risk lies in the long-term trend taken by mortality rates” and that “this trend unfolds over many years as an accumulation of small changes”. The point is that longevity risk stems not so much in a big change in experienced mortality rates from one year to the next. It is more that the general direction of the small increments changes and, after a long time, you can end up far from where you expected to be. This is a result of both fluctuations around the expected trend (trend risk) but also changes in the general trend of mortality rates (trend-change risk).
To understand these two components of table risk, it is useful to look at what is called the ‘time component’ of historical mortality rates, which incorporates the impact of both of them. Knowledge of the precise definition of this is not required; the important point is that it reflects the general level of mortality rates in the population and lower numbers reflect increased longevity (and increased pension costs). This is shown in figure 5 based on mortality rates in England and Wales (males and females combined) going back to 1840.
The lightest blue line represents an approximation of the general trend. Reverting blips from wars and pandemics have deliberately been excluded. There are about half a dozen clear trend changes which can be seen as substantial changes in slope. These changes are usually explained by structural developments such as industrialisation or the introduction of the NHS. In contrast, the random noise (trend risk) seen in the dark blue line is usually explained by environmental factors such as flu outbreaks or harsh winters.
Using the above data, and inspired by Sweeting’s application of trend-change risk to the CBD mortality model, we can estimate the frequency and variability of changes in trend. The small number of trend changes means that there is considerable uncertainty on how to calibrate the model to capture trend-change risk.
Figure 5
Source: Human Mortality Database and LGIM calculations
Historical time component of mortality rates for England and Wales (combined)
4. Examining longevity risk
1840 1860 1880 1900 1920 1940 1960 1980 2000
Tim
e C
ompo
nent
England and Wales combined
England and Wales combined excluding wars and pandemics
England and Wales combined - model approximation

11SEPTEMBER 2016 LGIM FORESIGHT
Allowing for trend-change risk broadly doubles longevity risk. Longevity models that do not allow for it are likely to understate longevity risk.
It appears that approximately every 30 years on average4, a significant change in trend occurs. This allows us to simulate potential future paths for mortality rates incorporating the impact of trend changes. Figure 6 shows example simulated values of the time component that allow for both trend risk and trend-change risk.
Figure 7 applies our model to a scheme with only longevity risk (no investment risk), and shows funding level risk at different time horizons with and without an allowance for trend-change risk. The ̀ table risk’ in our model includes both trend risk and trend-change risk and is shown as the dark blue line in figure 7. The light blue line in figure 7 shows the risk without allowing for trend-change risk (i.e. only trend risk is allowed for) which historically has been a more standard approach to modelling longevity. The scheme is assumed to have a duration of around 23 years and is initially fully funded on an economic basis. The calculations assume no small scheme risk.
As can be seen, allowing for trend-change risk leads to a much greater degree of uncertainty. Indeed, longevity risk is approximately doubled at every projection period.
Although it can be dangerous to think in terms of volatility when studying risk, it can be helpful in getting a conceptual grip on the approximate magnitude of uncertainty involved. Broadly speaking, longevity risk (including trend-change
Figure 6
Figure 7
Source: LGIM calculations
Source: LGIM calculations
Example simulated projections of the time component of mortality rates
Longevity risk and the impact of allowing for trend-change risk
1997 2017 2037 2057 2077 2097
Tim
e co
mpo
nent
Historical time componentExample simulated time componentsCentral case (mean) projected time component
0%2%4%6%8%
10%12%14%16%18%20%
0 5 10 15 20 25
1 in
20
wor
st F
undi
ng L
evel
rela
tive
to e
xpec
ted
Projection period (years)
With trend-change riskWithout trend-change risk
4. We assume that there is a c. 3.5% chance of a trend change risk in any given year. This is independent of
how many years it has been since the last trend change, so multiple trend-changes in a short time period are
possible, as are no trend changes at all.

12SEPTEMBER 2016 LGIM FORESIGHT
risk) has the equivalent of a standalone volatility of around 2% per annum over a 10-year period, based on the analysis shown in figure 7. The actual figure can vary with the cashflow profile, initial funding level of the scheme and the time horizon involved. For example, the annualised volatility actually increases with time which can be a particular problem if investing long-term with a relatively low-risk investment strategy. Indeed this is partly why a sophisticated approach to modelling longevity risk is helpful.
Small scheme risk
Table risk is essentially ‘longevity risk if there were an infinite number of members’, in which case the probability of death would tell you how many people actually die. One of the key benefits of our model is that it can capture idiosyncratic risk from a relatively small scheme membership. How important is the number of members in a scheme in terms of the degree of longevity risk that it experiences? For the same scheme as in figure 7, we have calculated small scheme risk, table risk and total longevity risk at 10 years in terms of its impact on the funding level of the scheme. These are shown in figure 8, assuming that all members’ pensions are equal (the solid lines) or unequal5 (the dotted lines). We show the results of these calculations for a variety of different sizes of scheme membership.
As can be seen, small scheme risk can have a significant impact on total longevity risk, if the scheme has around 500 or fewer members. Larger schemes can also suffer the same risk, but this requires the majority of benefits to be highly concentrated, for example in a small and very generous executive section.
Figure 8
Source: LGIM calculations
Impact of small scheme risk
0%
2%
4%
6%
8%
10%
12%
14%
0 200 400 600 800 1,000 1,200 1,400 1,600 1,800 2,000
1 in
20
Fun
ding
Lev
el r
isk
rela
tive
to e
xpec
ted
afte
r 10
yea
rs
Number of members in pension scheme
Total longevity risk - equal pensionsTotal longevity risk - unequal pensionsTable riskSmall scheme risk - equal pensionsSmall scheme risk - unequal pensions
Small scheme risk is unlikely to matter for schemes with more than 500 members, unless benefits are highly concentrated.
5. For ‘unequal pensions’ we have assumed that the top 10% of accrued pensions amounts to 50% of all
scheme pensions.

13SEPTEMBER 2016 LGIM FORESIGHT
Impact on overall scheme risk
A well-funded scheme with a self-sufficiency strategy of 10% equity, 40% credit and 50% gilts/LDI allocation might be expected to have a short-term funding level volatility of around 3.4% per annum if one only allows for investment risk. Roughly speaking, the total risk would increase by around 0.5% to 3.9% per annum once longevity risk of c. 2.0% per annum is accounted for (assuming no small scheme risk). As you move to higher levels of investment risk, the marginal impact of longevity risk reduces, as figure 2 in section 2 shows.
However this gives a potentially misleading picture, particularly for self-sufficiency strategies. If a scheme invests in a corporate bond portfolio that matches cashflows, short-term volatility in its mark to market is not important – only defaults matter (and potentially downgrades to the extent that downgraded bonds are sold and replaced with lower yielding equivalents). Short-term volatility of the funding position does not necessarily capture genuine risk to the scheme – namely that it might be unable to meet liability cashflows.
Our analysis suggests that downgrade and default volatility for investment grade credit is likely to be in the region of 0.5% to 1.5% per annum. Even a prudent (i.e. high) assumption of 1.5% p.a. would imply that, loosely speaking, the ‘true’ volatility of investment risk in the example above may be in the region of 1.9% p.a. once equity risk is allowed for. This is actually lower than longevity risk on a standalone basis (c. 2.0% p.a.) and so, based on longer-term volatility measures, we now find that longevity risk is the largest risk.
To explore these issues more carefully, a cashflow-driven approach to assessing risk is required. We discuss this further in the next section.
For a self-sufficiency investment strategy, longevity uncertainty could dominate the risk of not meeting cashflows so its management should have a high priority

14SEPTEMBER 2016 LGIM FORESIGHT
Consideration of longevity risk may prompt a range of alterations to investment strategy such as the purchase of longevity insurance or a change in the level of investment risk taken.
There are several broad reasons why consideration of longevity risk may impact a scheme’s investment strategy. We show these in figure 9 below.
Figure 9Reasons why allowing for longevity risk may impact investment strategy.
5. Impact on investment strategy
Consideration Details
Risk-adjusted returns from taking investment risk can be higher in the presence of longevity risk
A simple numerical example may help illustrate the point. Suppose we have a scheme with 4 units of longevity risk and no investment risk. Introducing 3 units of (uncorrelated) investment risk only increases the total risk by √(3^2+ 4^2 )-4=1 unit but increases the expected return of the scheme by the same amount as if there were no longevity risk present. Trustees should be aware that too much of a focus on investment risk minimisation means that they are potentially giving up a significant amount of return for very little reduction in overall risk. The upshot is that as long as longevity risk is retained, then seeking a zero risk premium in the assets may not be optimal.
Short-term risk budgets may have been breached
If longevity risks were not previously recognised, a scheme may have exceeded any short-term risk budgets they may have (the size of which typically reflects the strength of the employer covenant). Recognition of longevity risk may prompt a desire to de-risk elsewhere, given a fixed risk budget. However, hopefully the very existence of longevity risk should not come as a surprise.
Probability of meeting objectives may be lower than thought
In the absence of longevity risk considerations, it may appear rational to fully de-risk into matching assets once a scheme has reached 100% funding on an economic basis. This is because according to a model that ignores demographic risk, doing so ‘guarantees’ that all future benefit payments will be met. However once longevity risk is taken into consideration, it becomes evident that being 100% funded on an economic basis, eliminating all investment risk does not lead to a 100% probability of meeting future benefits. Indeed if there is no prudence in the mortality rates adopted then there is only a 50% chance of meeting all benefits.
Longevity hedging strategies could be useful
The trustees may consider investing in longevity hedging instruments, such as longevity swaps or annuities (buying out). Transferring longevity risk is likely to incur costs but may lead to a better balance of scheme risks. Also, there is a possible ̀ first-mover advantage’ to investing in longevity hedging instruments now. It is possible that with most schemes on de-risking glide paths over the next few decades and with limited demand for longevity risk in the market, increased demand to unload longevity risk may result in higher prices over the medium to long term.
15SEPTEMBER 2016 LGIM FORESIGHT
To explore this further, we look at a strategic asset allocation model that looks to ‘run-off’ assets as might be done in a self-sufficient investment strategy.
The recent LGIM Foresight paper, “Endgame portfolios and the role of credit”6, argues that schemes focused on self-sufficiency should rethink how to measure success. Funding levels and deficit figures are eschewed and a cashflow based model is used to assess the suitability of investment strategies. The idea is that success for a self-sufficient pension scheme is the assets outlasting the liability cashflows. A high funding level alone does not ensure this.
To quantify the chances of assets outlasting liability cashflows, a measure – the chance of ultimate excess or ‘CUE’ – was introduced in the previous paper. This is the likelihood that a scheme’s assets will outlast its liabilities. The CUE can be used to compare various self-sufficient investment portfolios to determine the most efficient one for a particular scheme.
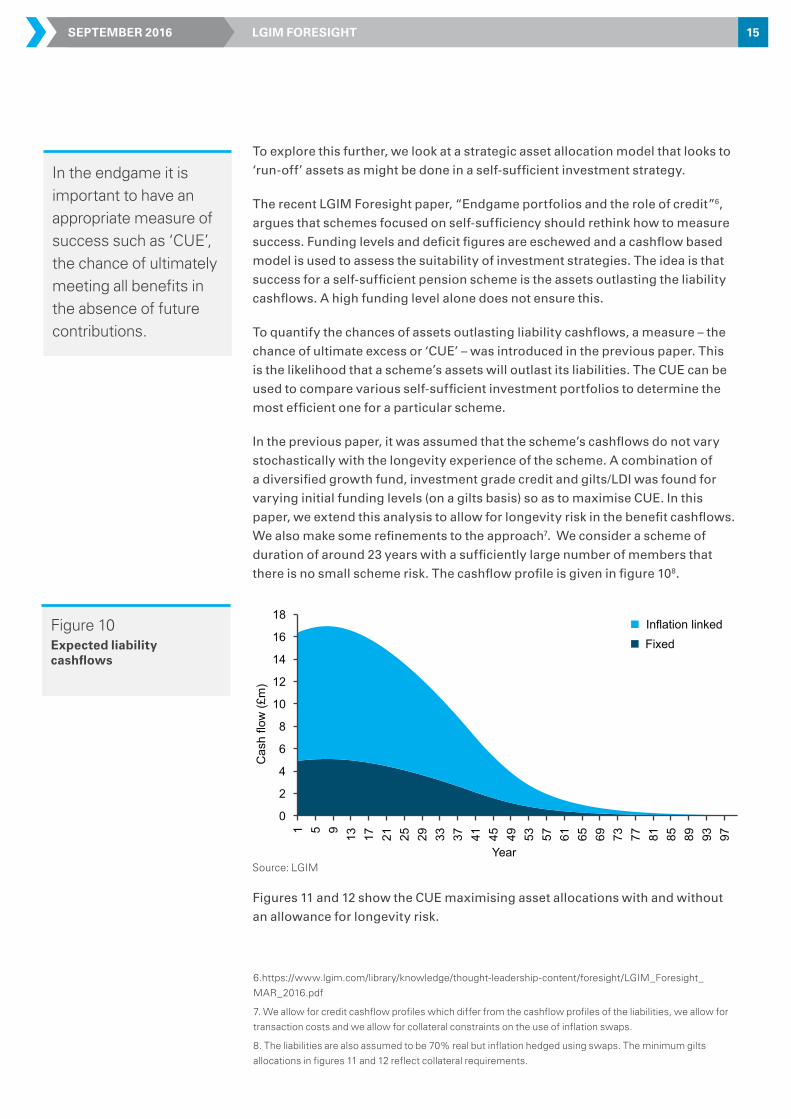
In the previous paper, it was assumed that the scheme’s cashflows do not vary stochastically with the longevity experience of the scheme. A combination of a diversified growth fund, investment grade credit and gilts/LDI was found for varying initial funding levels (on a gilts basis) so as to maximise CUE. In this paper, we extend this analysis to allow for longevity risk in the benefit cashflows. We also make some refinements to the approach7. We consider a scheme of duration of around 23 years with a sufficiently large number of members that there is no small scheme risk. The cashflow profile is given in figure 108.
Figures 11 and 12 show the CUE maximising asset allocations with and without an allowance for longevity risk.
6.https://www.lgim.com/library/knowledge/thought-leadership-content/foresight/LGIM_Foresight_
MAR_2016.pdf
7. We allow for credit cashflow profiles which differ from the cashflow profiles of the liabilities, we allow for
transaction costs and we allow for collateral constraints on the use of inflation swaps.
8. The liabilities are also assumed to be 70% real but inflation hedged using swaps. The minimum gilts
allocations in figures 11 and 12 reflect collateral requirements.
Figure 10
Source: LGIM
Expected liability cashflows
0
2
4
6
8
10
12
14
16
18
1 5 9 13 17 21 25 29 33 37 41 45 49 53 57 61 65 69 73 77 81 85 89 93 97
Cas
h flo
w (£
m)
Year
FixedInflation linked
5. Impact on investment strategy
In the endgame it is important to have an appropriate measure of success such as ‘CUE’, the chance of ultimately meeting all benefits in the absence of future contributions.

16SEPTEMBER 2016 LGIM FORESIGHT
In the presence of longevity risk it may be suboptimal to avoid all investment risk, given the high risk-adjusted returns available.
The key difference between the two charts occurs at high funding levels. Without longevity risk, no investment risk should be taken once the scheme is 100% funded. But with longevity risk, one should continue taking investment risk until much higher funding levels: around 110% funded using best-estimate mortality rates (which might correspond to around a 105% funding level using a typical prudent mortality table).
In practice, determination of the strategic asset allocation is likely to involve looking at a broad range of metrics, not just CUE. Nevertheless such models may help trustees determine the investment strategy that best helps them meet their objectives.
Figure 11
Figure 12
Strategies that maximise the probability of meeting future cashflows if there is no longevity risk
Strategies that maximise the probability of meeting future cashflows allowing for longevity risk
Source: LGIM calculations
Source: LGIM calculations
0%
10%
20%
30%
40%
50%
60%
70%
80%
90%
100%
80% 85% 90% 95% 100% 105% 110%
Initial funding level (gilts basis, best-estimate mortality)
Diversified Growth Fund Gilts/LDI Investment grade credit
0%
10%
20%
30%
40%
50%
60%
70%
80%
90%
100%
80% 85% 90% 95% 100% 105% 110%
Initial funding level (gilts basis, best-estimate mortality)
Diversified Growth Fund Gilts/LDI Investment grade credit

17SEPTEMBER 2016 LGIM FORESIGHT 17SEPTEMBER 2016 LGIM FORESIGHT
6. Other considerations
In our analysis we have assumed that longevity risk is independent of investment risk. However, it could be that there is a connection between investment performance and changes in longevity. Plausibly, for example, extremely poor investment performance could negatively impact living standards to such an extent that longevity is decreased. On the other hand, higher longevity without a commensurate increase in working lifetimes could be a significant drag on growth and, indirectly, investment performance. This is an interesting area of research.
This paper has only looked at one type of demographic risk: longevity risk. Ideally we would capture other demographic risks. For example, commutation terms may be ungenerous and fewer members may take cash at retirement than assumed, which would again introduce uncertainty into the exact liability cashflows.
The cashflows provided by the actuary are calculated assuming a certain mortality table. In the analysis we perform, we implicitly assume that these reflect a best-estimate of the future longevity experience of the scheme. As such, simulated new cashflows are distributed around these, with the supplied cashflows forming a central case. However, one could relax this assumption if given information on the level of prudence adopted.
Further enhancements could also be made to the model, for example to more accurately capture spouses’ benefits on the death of members.
18SEPTEMBER 2016 LGIM FORESIGHT 18SEPTEMBER 2016 LGIM FORESIGHT
As scheme liabilities mature and funding levels increase, more pension schemes will approach their endgame funding objective, whether that is self-sufficiency or buy-out. As they do so, longevity risk is likely to become an increasingly significant component of overall scheme risk. It is important that schemes have a clear plan and robust framework in place to deal with it.
Stochastic models of longevity risk, that allow its impact to be studied in conjunction with the investment risks a scheme faces, can aid effective risk management. In particular, consideration of longevity risk may impact investment strategy. For example, for those schemes aiming to run-off as a self-sufficient scheme and retain all longevity risk, full investment de-risking is only likely to be optimal if the scheme is fully funded on very prudent assumptions.
7. Conclusions

19SEPTEMBER 2016 LGIM FORESIGHT 19SEPTEMBER 2016 LGIM FORESIGHT
8. Appendix: Key modelling steps
Figure 13 below shows the key steps9 our model uses to model longevity risk and allow for its interaction with other scheme risks.
Figure 13: Key modelling steps
We believe that LGIM’s model offers several key benefits from a technical perspective:
• It shares the key powerful step of the Lee-Carter model of reducing a two-dimensional forecasting problem (age and time) to a simpler one-dimensional problem (time only)
• It is suitable at all ages, not just high ones
• Rather than treating the future time component of the projections as a simple random walk with drift, as the simplest form of the Lee-Carter model does, it allows for trend-change risk. This recognises that the drift itself can periodically change
• The model integrates volatility (small scheme) risk
• By producing simulated cashflows from the scheme, it allows longevity risk to be studied in conjunction with the investment risks faced by a scheme
• From a run-off perspective, ultimately what matters are cashflows paid. However a scheme may be interested in the impact on funding level or deficit risk at some point in the future. The model allows assessment of funding level and deficit risk, assuming frequent updating of the mortality tables used to calculate these figures
1. Transform historic/prospective mortality rates using a function to make them easier to manipulate
2. Decompose transformed mortality rates into “age” and ‘time” components
3. Model the progression of the time component
4. Reconstruct underlying mortality rates for each simulation
5. Randomly determine the number of deaths of scheme members at each age for each simulation
6. Translate this into an impact on scheme cash flows and funding position
7. Examine the impact on the scheme including investment risk
Source: LGIM
9. Step 5 is to allow for small scheme risk. It involves simulating a number of deaths for each future year and each age. We assume that the deaths occur independently, implying a binomial distribution for the number of deaths.
i Modeling and Forecasting U.S. Mortality’, Ronald D. Lee and Lawrence R.Carter, Journal of the American Statistical Association, Vol. 87, No. 419 (Sep., 1992), 659-671.
ii A Trend-Change Extension of the Cairns-Blake-Dowd Model’, Paul Sweeting, Annals of Actuarial Science, 5 (2). pp. 143-162. ISSN 1748-4995.
iii A two-factor model for stochastic mortality with parameter uncertainty: theory and calibration’, Andrew J.G. Cairns, David Blake, Kevin Dowd, The Journal of Risk and Insurance, 2006, Vol. 73, No. 4, 687-718.
iv A Value-at-Risk framework for longevity trend risk’, S.J. Richards, I.D. Currie and G.P. Ritchie, British Actuarial Journal, Volume 19, Issue 01, March 2014, pp 116-139.
7. Conclusions

20SEPTEMBER 2016 LGIM FORESIGHT
IMPORTANT NOTICE
Views and opinions expressed herein may change based on market and other conditions. The material contained here is confidential and intended for the person to whom it has been delivered and may not be reproduced or distributed. The material is for informational purposes only and is not intended as a solicitation to buy or sell any securities or other financial instrument or to provide any investment advice or service. Legal & General Investment Management does not guarantee the timeliness, sequence, accuracy or completeness of information included.
The information is produced by Legal & General Investment Management Limited. Opinions expressed in this material may differ from those of other areas within Legal & General Investment Management. The instruments described have a range of different risk profiles and these should be understood by pension schemes before making any investments. Pension schemes should ensure they obtain suitable professional advice. The information contained in this document is not intended to be, nor should be, construed as investment advice nor deemed to be suitable to meet the needs of pension schemes.
This document is designed for our corporate clients and for the use of professional advisers and agents of Legal & General. No responsibility can be accepted by Legal & General Investment Management Limited or contributors as a result of content contained in this publication. Specific advice should be taken when dealing with specific situations. The views expressed are not necessarily those of Legal & General Investment Management Limited and Legal & General Investment Management Limited may or may not have acted upon them.
This document may not be used for the purposes of an offer or solicitation to anyone in any jurisdiction in which such offer or solicitation is not authorised or to any person to whom it is unlawful to make such offer or solicitation.
Legal & General Investment Management Limited (Company Number: 02091894) is registered in England and Wales and has its registered office at One Coleman Street, London, EC2R 5AA (“LGIM”).
Legal & General Investment Management Limited is authorised and regulated by the Financial Conduct Authority.
M0888
CONTACT US.
For more information about our endgame solutions for pension funds, please contact your usual LGIM representative or:
Mike WalshHead of Institutional Distribution+44 (0) 20 3124 [email protected]