september 2016 the scalability and economics of delivering ... · the scalability and economics of...
TRANSCRIPT

White paper
The scalability and economics of delivering Citrix XenApp services from Microsoft Azure Given business dynamics—seasonal peaks, mergers, acquisitions, and changing business priorities—deploying Citrix XenApp 7.11 workloads on a Microsoft Azure cloud can give your IT organization a strategic advantage since it enables agile desktop and application delivery. Best of all, the price point for deploying a XenApp farm on Microsoft Azure can be just over $6.89 per month per user. Microsoft Azure Cloud Services!Microsoft Azure is a reliable and flexible cloud platform that allows applications to be quickly deployed across Microsoft-managed datacenters. Azure offers monthly service level agreements (SLAs) of 99.95% to meet strict requirements for continuously available services. By provisioning XenApp desktops and application workloads on Azure Cloud Services, businesses can avoid expenses for internal infrastructure and rely instead on Microsoft to supply the necessary compute, networking, and storage resources for user workloads. Citrix XenApp Citrix XenApp® 7.11 provides advanced management and scalability, a rich multimedia experience over any network and self-service applications with universal device support across a full range of mobile endpoints—including laptops, tablets, smartphones, PCs, and Macs. XenApp provides session and application virtualization technologies that make it easy for customers to manage centralized applications and apply the optimal combination of local and hosted delivery models to match user requirements. Both XenApp hosted desktop sessions or XenDesktop pooled virtual desktops (if these are also required) can be provisioned on Azure. XenApp simplifies application provisioning, enabling unprecedented levels of scalability that help to increase efficiency. When deployed on Microsoft Azure cloud, XenApp gives IT departments the flexibility of delivering infrastructure services for Windows applications and desktops at an economical price point while extending and integrating current investments on Windows Server System Center and Hyper-V technologies from on-premise environments. Scalability testing of Citrix XenApp on Microsoft Azure instances Microsoft Azure makes it possible to spin up new virtual machines in minutes and adjust usage as infrastructure requirements change. Virtual machines on Azure instances can support all of the infrastructure and XenApp services required for a deployment. To validate XenApp 7.11 configurations using Microsoft Azure virtual machines, Citrix engineers conducted a series of performance tests. The goal was to analyze the scalability and economics of XenApp sessions deployed on Microsoft Azure A, D, and Dv2 series VM instance types. As a part of this exercise, performance and price-performance comparisons are used to evaluate the various VM instance types. Login VSI 4.1.6 was used in testing to generate user connections to XenApp VDA workers, simulating typical user workloads running on Azure instances.Microsoft Azure instance types vary according to infrastructure resources provided and relative cost per hour. Pricing for Azure virtual machines varies by region and includes Windows
September 2016

Citrix.com| White Paper | Citrix XenApp 2
licensing (see https://azure.microsoft.com/en-us/pricing/details/virtual-machines/windows). XenApp workloads were evaluated on Azure A, D, and Dv2 series VM instance types. The Dv2 Series instances are a newer version of D-Series Standard instances. The Dv2 instance type offers more powerful 2.4 GHz Intel Xeon® E5-2673 v3 processors with Turbo Boost 2.0 technology that enables a maximum clock speed of 3.1 GHz. This newer instance series is approximately 35% faster than D-Series instances, while using the same memory and disk configurations as the D-Series. The infrastructure VMs needed to deploy XenApp—Delivery Controllers, SQL servers, Active Directory and DNS servers, etc.—were deployed primarily on D2v2 instances in the testing. The table below shows the configuration and hourly cost for a D2v2 instance type (based on U.S. West pricing at the time of this writing).
Topology for the scalability testing For the Citrix XenApp 7.11 scalability testing, the infrastructure VMs were configured with Microsoft Windows Server 2012 R2 on Azure instances as follows: •! Infrastructure virtual machine on an D2v2 instance containing:
o! 1x Login VSI controller and profile server o! 4x Login VSI launchers
•! Infrastructure virtual machine on a D2v2 instance containing: o! 1x dedicated XenDesktop 7.11 Controller o! 1x Microsoft SQL server o! 1x StoreFront server
•! Infrastructure virtual machine on a D2v2 instance containing: o! 1x Active Directory controller and DNS server o! 1x License server
•! Infrastructure virtual machine on a A2 instance containing: o! 2x NetScaler VPX
•! XenApp workload virtual machine containing a single VDA 7.11 worker server hosting simulated user sessions. This server was deployed on each instance type in different test runs to test the scalability of different Azure instances.
Instance Virtual cores RAM (GB) Storage (GB) Storage Type Price per hour
D2v2 2 7 100 4 data, 1 local SSD $0.28

Citrix.com| White Paper | Citrix XenApp 3
Creating a virtual machine on Azure automatically creates an Azure Resource Group container. By default, virtual machines built in a Resource Group are isolated on the same virtual network. Figure 1 depicts the test architecture.
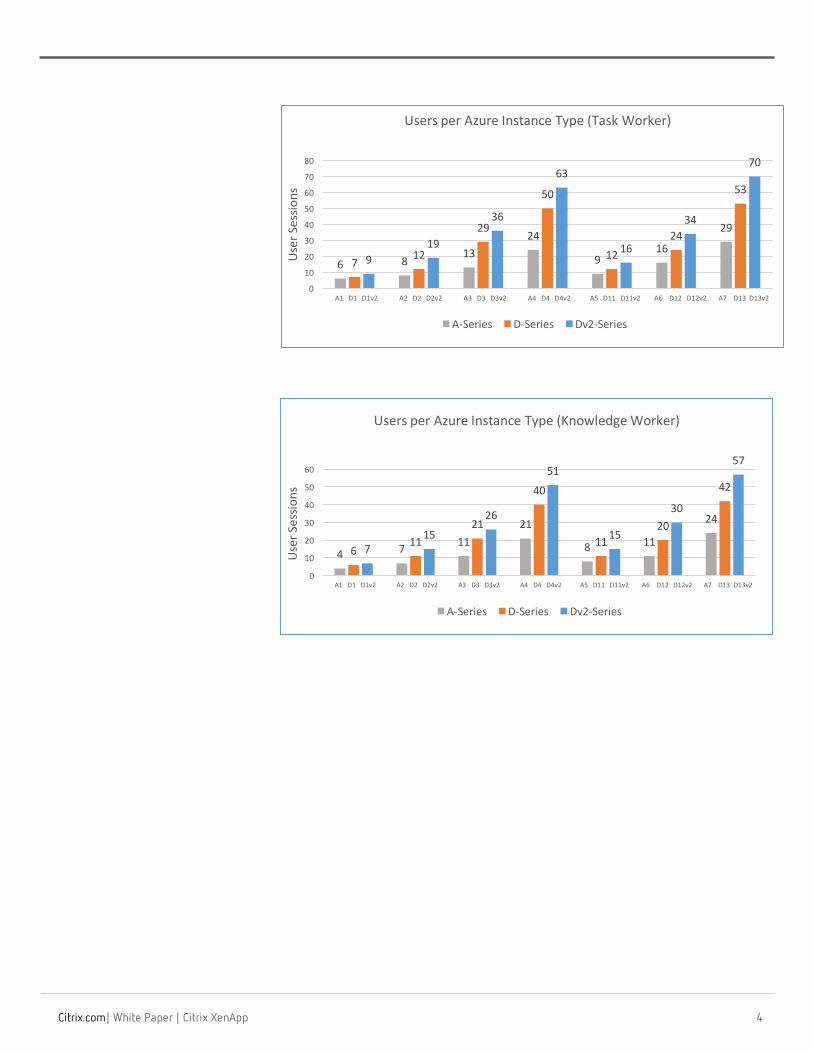
Figure 1: Architecture for XenApp scalability testing on Microsoft Azure. In an Azure deployment, users connect through a StoreFront server to access applications and desktops. (Login VSI clients simulate user connections to the StoreFront server. ) As in a traditional XenDesktop architecture, Delivery Controllers distribute the connections and set up service connection between end-users and VDA workers hosting applications. Results summary The graphs below show side-by-side comparisons of the maximum number of XenApp user sessions supported by the A-Series, D-Series, and Dv2-Series VM instance type in single server scalability testing. As shown, Dv2 VMs offer higher performance compared to the respective A-Series and D-Series VMs. For example, the D13v2 instance (with 8 vCPUs and 56 GB of RAM) hosted the highest densities, sustaining 70 and 57 users under Task Worker and Knowledge Worker workloads, respectively.
Citrix.com| White Paper | Citrix XenApp 4
6 8 1324
916
29
7 12
29
50
1224
53
919
36
63
16
34
70
0
10
20
30
40
50
60
70
80
A1,,,D1,,,D1v2 A2,,,D2,,,D2v2 A3,,,D3,,,D3v2 A4,,,D4,,,D4v2 A5,,,D11,,,D11v2 A6,,,,D12,,,D12v2 A7,,,,D13,,D13v2Us
er,Se
ssions
Users,per,Azure,Instance,Type,(Task,Worker)
ADSeries DDSeries Dv2DSeries
4 7 1121
8 11
24
611
21
40
1120
42
715
26
51
15
30
57
0
10
20
30
40
50
60
A1,,,D1,,,D1v2 A2,,,D2,,,D2v2 A3,,,D3,,,D3v2 A4,,,D4,,,D4v2 A5,,,D11,,,D11v2 A6,,,,D12,,,D12v2 A7,,,,D13,,D13v2
User,Se
ssions
Users,per,Azure,Instance,Type,(Knowledge,Worker)
ADSeries DDSeries Dv2DSeries

Citrix.com| White Paper | Citrix XenApp 5
The pricing model for Azure instances varies according to the region, the instance type, and the resources provided. The graphs below compare the cost efficiency of each instance type based on VDA worker densities achieved in the single server testing. The costs reflect U.S. West pricing for standard VM instances and includes the cost of Microsoft Windows licensing.
As shown in the graphs, the D2v2 instance offers the lowest cost per user. Instance types A5, D11, and D11v2 through A7, D13 and D13v2 are configured to supply additional RAM resources and priced accordingly. In the testing, the density results showed no clear benefit from the extra memory available with these instance definitions. However, if users run applications that are particularly memory-intensive, there may be a benefit in deploying XenApp 7.11 on a memory-intensive instance.
$0.015
$0.0225
$0.027$0.03
$0.036
$0.0412
$0.0455
$0.02
$0.0233$0.0193 $0.0224
$0.0275 $0.0271
$0.0221
$0.0155 $0.0147 $0.0155$0.018
$0.02062 $0.0191$0.0167
$0.000
$0.005
$0.010
$0.015
$0.020
$0.025
$0.030
$0.035
$0.040
$0.045
$0.050
A1,,D1,,,D1v2 A2,,,D2,,,D2v2 A3,,,D3,,,D3v2 A4,,,D4,,,D4v2 A5,,,D11,,,D11v2 A6,,,,D12,,,D12v2 A7,,,,D13,,D13v2
Workload,cost,per,user,per,hour,(Task,worker)
ADSeries DDSeries Dv2DSeries
$0.0225$0.0257
$0.0327 $0.0342
$0.0412
$0.06$0.055
$0.0233$0.0254
$0.0266 $0.028 $0.03$0.0326
$0.0279
$0.02$0.0186
$0.0215$0.0219 $0.022 $0.0217 $0.0205
$0.00
$0.01
$0.02
$0.03
$0.04
$0.05
$0.06
$0.07
A1,,,D1,,,D1v2 A2,,,D2,,,D2v2 A3,,,D3,,,D3v2 A4,,,D4,,,D4v2 A5,,,D11,,,D11v2 A6,,,,D12,,,D12v2 A7,,,,D13,,D13v2
Workload,cost,per,user,per,hour,(Knowledge,worker)
ADSeries DDSeries Dv2DSeries

Citrix.com| White Paper | Citrix XenApp 6
Testing methodology In the scalability testing, Login VSI 4.1.6 was used to run a user load on the XenApp shared desktops. Login VSI helps to gauge the maximum number of users that a desktop environment can support. Login VSI categorizes workloads as Task Worker, Knowledge Worker, Power Worker, and Office Worker. It is important to note that while scalability testing is a key factor in understanding how a platform and overall solution perform, it should not be inferred as an exact measurement for real world production workloads. Customers looking to better assess how applications will perform in a XenApp on Azure solution should conduct their own Login VSI scale testing using custom workload scripts. All test results here reflect application execution using out-of-the-box XenApp policies from Studio. Task Worker and Knowledge Worker workloads were selected for the testing and had the following characteristics: •! Task Worker Workload – includes segments with Microsoft Office 2013 Outlook, Excel, and
Internet Explorer, Adobe Acrobat and PDF Writer. The Task Worker workload does not place a very severe demand on the environment and represents users that do not access the system very heavily.
•! Knowledge Worker Workload – includes segments with Microsoft Outlook, Word, PowerPoint, and Excel; Adobe Acrobat, FreeMind, PhotoViewer, Doro PDF Writer and includes viewing of several 360p movies. The Knowledge Worker workload places a more severe demand on the environment and represents users that access the system more heavily.
Azure A-Series, D-Series, and Dv2-Series VM instance types were tested. Since the goal was to capture a baseline reflecting the densities possible on each instance type in a series, the Login VSI client launchers were configured to go through the StoreFront server. Performance metrics were captured during user logon and virtual desktop acquisition (ramp-up), user workload execution (steady state), and user logoff. To achieve consistent measurements that reflected when components were appropriately cached, each workload ran for 48 minutes before Login VSI performance metrics were recorded. VSI tests were repeated 10 times on each VM instance to get an average number of users that successfully ran the test. D2v2 instance results Since the D2v2 instance proved to be the most cost-effective for XenApp 7.11, the following pages show user density and performance metrics for the D2v2 instance type under the Login VSI Task Worker and Knowledge Worker workloads.

Citrix.com| White Paper | Citrix XenApp 7
Task Worker workload results This section describes test results for the D2v2 instance with the Task Worker workload. VSImax v4 (which indicates the maximum user density under a specific workload) is determined from two other metrics, VSI Baseline and VSI Threshold. VSI Baseline represents a pre-test Login VSI baseline response time measurement that is determined before the normal Login VSI sessions are sampled. The D2v2 instance demonstrates a VSImax v4 density of 19 users running the Task Worker workload.
The next two graphs depict CPU and memory consumption and disk I/O response times measured during the test. These metrics are helpful in assessing performance under the test workload. In the chart below, as user load increases, CPU and memory utilization peaks at the point where the number of users approaches VSImax v4.
012345670
20
40
60
80
100
Mem
ory,(GBytes)
%,CPU
,Utiliza
tion
Time
Memory,and,CPU,consumption,as,users,log,on,(Task,Worker)
%,Processor,Time Memory,used,GBytes
IdleRampup/Logins
Log,off
Log offcomplete

Citrix.com| White Paper | Citrix XenApp 8
The write I/O response time averaged around 0.00385 sec. Read I/O response times averaged to 0.00118 sec.
The following network and disk performance graphs show resource consumption, which can impact scalability as well as cost associated with the solution. The graph below shows networking transfer rates for data going out of Azure data centers. Microsoft charges for outbound data while inbound data transfers are free. For the Task Worker workload, the average outbound bandwidth during steady state is approximately 154 kbps for the test workload of 19 users. This means the per-user outgoing transfer rate is approximately 8.1 kbps (154/19= 8.1 kbps). Outgoing network transfers during logoff occur as user profile data is transmitted.
050
100150200250300350400450500
Kbps
Network,Transfer,rate,(sent),(Task,Worker)
Steady,state
Log,off
0
0.05
0.1
0.15
0.2
Respon
se,Time,(sec)
Time
Disk,I/O,Response,time,Measurements,(Task,Worker)
Avg.,Disk,sec/Read,, Avg.,Disk,sec/Write,,

Citrix.com| White Paper | Citrix XenApp 9
Azure also charges for disk transfers. Disk transfer metrics, which are used in the subsequent cost analysis, are shown below. For the Task Worker workload, disk transfers during steady state averaged about 64 IOPS for the test workload of 19 users, which calculates to an average of about 3.7 IOPS per user. The peak value was 888 IOPS for 19 users or about 47 IOPS per user. Disk transfer activity is also visible during the logoff period as user profile data is recorded.
Knowledge Worker workload results This section shows test results and performance metrics for the D2v2 instance under the Knowledge Worker workload. As shown below, the D2v2 instance supports a VSImax v4 of 15 users running the Knowledge Worker workload.
0
200
400
600
800
1000
IOPS
Time
Total,Disk,Transfers/sec,(Read,and,Write),Task,Worker,,

Citrix.com| White Paper | Citrix XenApp 10
The next two graphs depict CPU and memory consumption and disk I/O response times for the Knowledge Worker workload. These metrics are helpful in assessing performance under the test workload. As the user load increases in the chart below, memory and CPU utilization peaks at the point at which the number of users approaches VSImax v4.
Disk I/O response time metrics for the Knowledge Worker workload are shown below. Write I/O response times averaged around 0.0032 sec while read I/O response times averaged to 0.00115 sec.
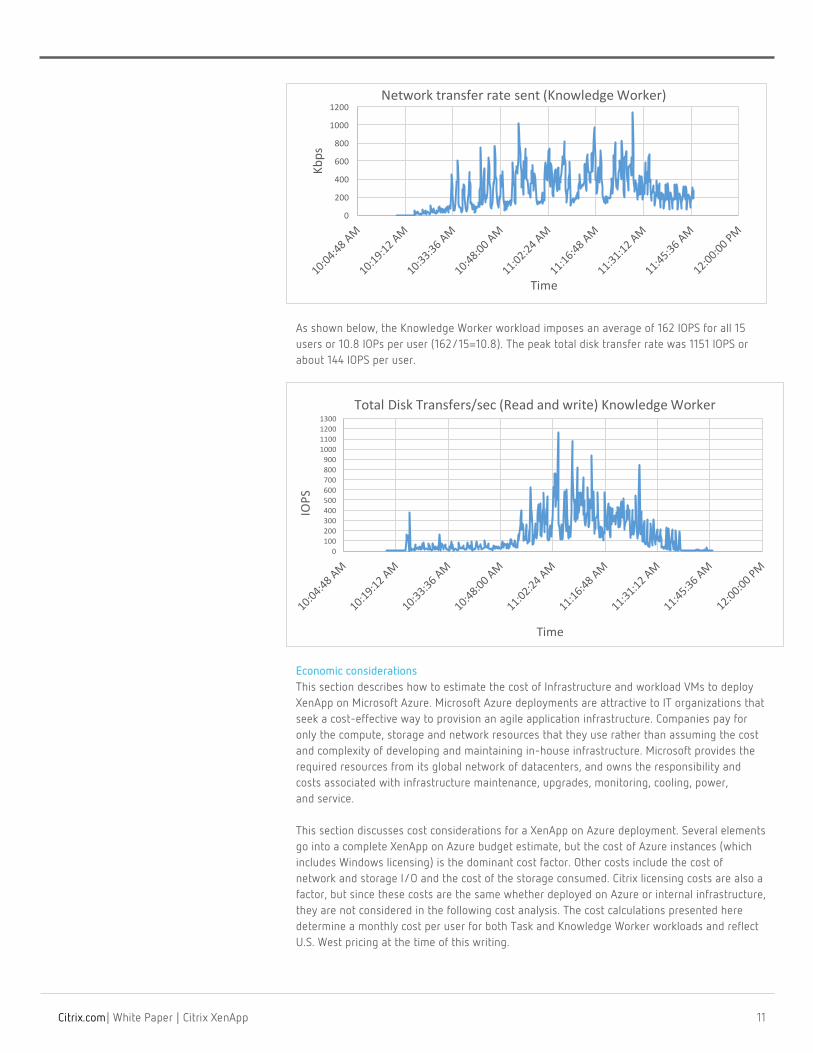
The following graphs show resource consumption metrics for network and disk I/O under the Knowledge Worker workload. The outbound networking transfer rate during steady state averaged around 272 kbps for the test workload of 15 users. This means the outbound transfer rate per user was approximately 18.13 kbps (272/15=18.13 kbps). During the logoff period, network transfer activity reflects how user profile data is transmitted and captured at logoff.
012345670
20
40
60
80
100
Mem
ory,(Gb
ytes)
%CP
U,Utilizatio
n
Time
Memory,and,CPU,consumption,as,users,log,on,(Knowledge,Worker),
%,Processor,Time Gbytes,Memory
IdleRampup/Logins Logoff
Logoffcomplete
0
0.01
0.02
0.03
0.04
0.05
Respon
se,Tim
e,(sec)
Time
Disk,I/O,Response,time,measurement,(Knowledge,Worker)
Avg.,Disk,sec/Read,, Avg.,Disk,sec/Write,,
Steady,state Logoff
Citrix.com| White Paper | Citrix XenApp 11
As shown below, the Knowledge Worker workload imposes an average of 162 IOPS for all 15 users or 10.8 IOPs per user (162/15=10.8). The peak total disk transfer rate was 1151 IOPS or about 144 IOPS per user.
Economic considerations This section describes how to estimate the cost of Infrastructure and workload VMs to deploy XenApp on Microsoft Azure. Microsoft Azure deployments are attractive to IT organizations that seek a cost-effective way to provision an agile application infrastructure. Companies pay for only the compute, storage and network resources that they use rather than assuming the cost and complexity of developing and maintaining in-house infrastructure. Microsoft provides the required resources from its global network of datacenters, and owns the responsibility and costs associated with infrastructure maintenance, upgrades, monitoring, cooling, power, and service. This section discusses cost considerations for a XenApp on Azure deployment. Several elements go into a complete XenApp on Azure budget estimate, but the cost of Azure instances (which includes Windows licensing) is the dominant cost factor. Other costs include the cost of network and storage I/O and the cost of the storage consumed. Citrix licensing costs are also a factor, but since these costs are the same whether deployed on Azure or internal infrastructure, they are not considered in the following cost analysis. The cost calculations presented here determine a monthly cost per user for both Task and Knowledge Worker workloads and reflect U.S. West pricing at the time of this writing.
0
200
400
600
800
1000
1200
Kbps
Time
Network,transfer,rate,sent,(Knowledge,Worker)
01002003004005006007008009001000110012001300
IOPS
Time
Total,Disk,Transfers/sec,(Read,and,write),Knowledge,Worker,,

Citrix.com| White Paper | Citrix XenApp 12
Azure instance costs Instance costs are the largest factor in developing a budget estimate for an Azure deployment. The pricing model for Azure virtual machines varies by region according to instance type and the resources that each instance type provides (see https://azure.microsoft.com/en-us/pricing/details/virtual-machines/windows/). Azure pricing is calculated on an hourly basis. For this costing exercise, it is assumed that users work only 8-hour shifts. Using the Azure management interface (or a PowerShell script provided by Citrix), it’s possible to manually shut down and deallocate virtual machines that are not actively in use, reducing hourly instance charges to conserve budget. For this reason, the cost estimates given here (except for storage capacity) assume that VMs are allocated and in use for a period of 8 hours per day. Given this assumption, a D2v2 instance has a monthly cost of $69.44 and can support 19 XenApp users under a Task Worker workload and 15 users under a Knowledge Worker workload. This equals a monthly per-user cost of $3.65 for each Task Worker workload user and $4.63 for each Knowledge Worker workload user. Network utilization cost Network utilization reflects network I/O operations going out of Azure datacenters (e.g., “outbound data transfers” in Microsoft terminology). Charges vary according to the specific zone (region group) providing services. Pricing is tiered according to the data quantity transferred each month. For the most expensive bracket (zone1), the monthly cost is $0.087 per GB. As shown in the test results, with the Task Worker workload, an average user consumes network bandwidth at a rate of approximately 8 kbps. Assuming an 8-hour workday, a single XenApp user running a Task Worker workload consumes about ~7 GB of network bandwidth per month—which translates to a cost of $0.60 per month per user. For the Knowledge Worker workload, network utilization is about 18 kbps per user or ~16 GB for an 8-hour day, which costs about $1.40 per month per user. Storage utilization cost The cost of I/O operations is $0.0036 per 100,000 transactions to storage (transactions encompass both read and write operations). A Task Worker workload imposes about 3.7 IOPs per user on average, which works out to ~3,303,360 transactions per month (assuming an 8-hour workday) at a cost of $0.12 per user. In contrast, a Knowledge Worker workload requires an average 10.8 IOPs per user. This is about ~9,642,240 IOPs per month per user for an 8-hour day, which means a cost of $0.35 a month for each Knowledge Worker’s storage. Storage capacity cost Azure maintains storage resources for the XenApp infrastructure even when no users are active, so the analysis of storage consumption charges is based on a 24-hour day. Persistent disks for Azure VMs use “page blobs”, block storage that is optimized for random access. Azure provides different storage categories and redundancy options. Storage pricing is tiered with lower rates for higher levels of consumption. Total estimated costs The table below shows approximate total costs per user (based on U.S. West pricing) for both Task and Knowledge Worker workloads. Based on the D2v2 compute instance, the monthly cost for each Task Worker workload user is approximately $6.89. An approximate monthly cost for each user running a Knowledge Worker workload is $8.94. Actual costs will vary, of course, depending on the region and instance infrastructure selected and densities achieved with specific user workloads.

Citrix.com| White Paper | Citrix XenApp 13
Cost per user per month Task Worker workload Knowledge Worker workload
D2v2 compute instance $3.65 $4.63
Network utilization $0.60 $1.40
Storage utilization $0.12 $0.35
Storage capacity $2.52 $2.56
Total $6.89 $8.94
XenApp Infrastructure VM costs on Azure In addition to the cost of deploying VMs to support user workloads, a XenApp deployment requires VMs to host infrastructure servers. The table below shows the approximate total cost per hour for each XenApp infrastructure VM in Azure (based on U.S West pricing). Component Instance type Cost per hour
Delivery Controller D2v2 $0.28
StoreFront D2v2 $0.28
SQL server D2v2 $0.28
License server D2v2 $0.28
Domain controller D2v2 $0.28
NetScaler VPX A2 $0.06
Total $1.46
Citrix Smart Scale service Using the Citrix Smart Scale service technologies, XenApp costs can be optimized by scaling up and scaling down the infrastructure resources to map to the actual usage. For example, the Smart Scaling service can automatically scale up the infrastructure to support high usage during peak hours and scale down the infrastructure at non-peak hours to match low usage. For more information about Citrix Smart Scaling, see https://manage-docs.citrix.com/hc/ en-us/sections/202468983-Smart-Scale. Conclusion The XenApp on Azure scalability results presented here should be used only as guidelines in configuring your Azure solution. Before making final sizing and deployment decisions, it is suggested that you run proof-of-concept tests on different Azure instance types using your own workloads. The Azure instance type that you select to deploy XenApp workloads is the critical element that determines the user density and solution scalability, and in turn the cost-per-user for an Azure delivery model. Different instance types in Azure have advantages for specific workloads. Learn more For more information about deploying Citrix XenApp workloads on Microsoft Azure Cloud Services, see the Citrix and Microsoft partner web site at http://www.citrix.com/global-partners/microsoft/resources.html.

Enterprise Sales North America | 800-424-8749 Worldwide | +1 408-790-8000 Locations Corporate Headquarters | 851 Cypress Creek Road Fort Lauderdale, FL 33309 United States Silicon Valley | 4988 Great America Parkway Santa Clara, CA 95054 United States Copyright© 2016 Inc. All rights reserved. Citrix, the Citrix logo, and other marks appearing herein are property of Citrix Systems, Inc. and/or one or more of its subsidiaries, and may be registered with the U.S. Patent and Trademark Office and in other countries. All other marks are the property of their respective owner/s.