september 2017 berth 5 oil spill - pwsrcac.org€¦ · during crude oil loading ... bt4 n0 n1 n2 n3...
TRANSCRIPT

SEPTEMBER 2017 BERTH 5 OIL SPILL - Sampling Results and Interpretations
JAMES R. PAYNE, PH.D. WILLIAM B. DRISKELL APRIL 2018
PWSRCAC Contract No. 951.18.08
The opinions expressed in this commissioned report are not necessarily those of PWSRCAC

2
Cover photo – Oil spill cleanup operations proceed near Berth 3 in the foreground with Berths 4 & 5 further west on 24 September 2017. Saw Island sampling site lies just beyond Berth 5; Jackson Point sampling site is below photo in foreground. Photograph courtesy of Alyeska Pipeline Service Company.
9-22-2017 Sheen under Berth 5. PWSRCAC Photo.
9-22-2017 Boom under Berth 5. PWSRCAC Photo.

3
9-29-2017 Jackson Pt. Mussel Sampling. PWSRCAC Photo.
12-7-2017 Jackson Pt. Mussel Sampling. PWSRCAC Photo.

4
2017 BERTH 5 OIL SPILL - SAMPLING RESULTS AND INTERPRETATIONS
James R. Payne, Ph.D. and William B. Driskell
Introduction On 21 September 2017, an estimated 150 gallons of Alaska North Slope (ANS) crude oil were accidentally released during crude oil loading arm leak testing at Berth 5 of the Alyeska Marine Terminal. As part of the post-spill monitoring efforts, mussels were collected from the same 3 Port Valdez stations annually sampled as part of the PWSRCAC Long Term Environmental Monitoring Program (LTEMP). Collections at Saw Island (SAW) adjacent to Berth 5, Jackson Point (JAC) east of Berth 3, and Gold Creek (GOC) across the port occurred on Sept 29-30 and again, as a follow up, 70 days later on Dec 7-9, 2017 (Figure 1). Two of the sampling sites, SAW and JAC, bracket the shoreline of the release location with the Saw Island site immediately adjacent (west) of Berth 5 (Figure 2). The GOC reference site is 6 km across the Port.
This report describes and illustrates the pre- and immediate post-spill hydrocarbon signatures plus the state of recovery in Port Valdez mussels 70 days after the spill.
Figure 1. Spill and sampling locations within Port Valdez (satellite image from Google Earth). Tankers are seen docked at both Berths 4 and 5.
Alyeska Marine Terminal
Valdez
Gold Creek
Saw Island Jackson Pt Berth 5

5
Figure 2. Nautical chart of the offshore area immediately adjacent to the Valdez Marine Terminal detailing the Berth 5 incident site. Saw Island (the traditional LTEMP AMT sampling site) and Jackson Point (added to LTEMP in 2016) are denoted by a red X.
During the spill and subsequent cleanup efforts between 21 and 27 September 2017, oil and sheen were observed between Berths 4 and 5 and trending westward including some shoreline impacts between the berths and west and south of Saw Island. Berths 4 and 5 were entirely boomed to contain sheen and oil (Figure 3). Protective booms were also installed around the Solomon Gulch Fish Hatchery (to the east) and Duck Flats (to the northeast), although no oil or sheen was observed in those areas.
Figure 3. Sheen observed between Berths 4 and 5 during cleanup activities in September 2017. Photograph courtesy of Alyeska Pipeline Service Company.
X X
Saw Island

6
Methods Following established LTEMP protocols, triplicate samples comprising approximately 30 adult mussels (Mytilus trossulus) were collected by Austin Love (PWSRCAC) along the shorelines at each location. Handling, processing and chemical analyses followed standard methods previously described in earlier LTEMP reports (Payne et al., 2010; and Payne and Driskell 2017b). Chemical analyses were conducted by PWSRCAC’s LTEMP contractor, Alpha Analytical Laboratory, in Mansfield, MA. Analyses comprised standard methods for polycyclic aromatic hydrocarbons (PAH) and sterane and triterpane biomarkers, using a modified 8270 EPA method on gas chromatography/mass spectrometry (GC/MS SIM) instruments, plus saturated hydrocarbons (SHC), using gas chromatography with flame-ionization detection (GC/FID). From these analyses, 63 PAH, 74 biomarkers and 37 SHC target compounds are reported. Note that the suite of 55 biomarkers normally reported for LTEMP was expanded to include additional mono- and tri-aromatic steranes. These components were recently added to Alpha Laboratory’s target analyte list, and it is believed that they will aid with oil fingerprinting in the future. PAH and biomarker analytes in tissues are reported on a µg/kg dry wt. (ppb) basis, while SHC in tissues are mg/kg (ppm), and all oil components are mg/kg (ppm). For forensic interpretations, an Excel application was assembled to review individual samples graphically overlaid by a source signature scaled to the sample. Comparative excesses or depletions in the patterns of individual analytes reveal the effects of weathering, mixing, or absence of spill oil. These methods are more fully described in Payne and Driskell, 2018; Driskell and Payne, 2018; Payne and Driskell 2017a,b; and Payne et al., 2008, 2010.
Source Oil Characterization During the response activities, a reference source sample was obtained by PWSRCAC from the spilled-oil collection barge on 29 September 2017. The source oil signature (Figure 4) show a slightly weathered ANS profile containing a full suite of PAH, partially evaporated but non-biodegraded SHC, and characteristic biomarkers that permit direct comparisons to the oiled and residual trace profiles observed in the mussel samples (discussed below).

7
Figure 4. Analytic results of the source-oil sample comprise PAH (left plot), SHC (middle plot) and biomarkers (right plot; hopane highlighted). The red overlay line is the spilled source oil and thus exactly matches bar plot of the same source sample. This reference overlay method is used to compare the mussel samples to the source when reviewing each sample plot. Typically, the overlay is scaled to hopane for PAH and biomarkers and n-C27 for SHC.
0
200
400
600
800
1000
1200
DEC
DEC1
DEC2
DEC3
DEC4 BT
0BT
1BT
2BT
3BT
4 N0
N1
N2
N3
N4 BP DBF
ACY
ACN F F1 F2 F3
ANT
PHN
PA1
PA2
PA3
PA4
RET
DBT0
DBT1
DBT2
DBT3
DBT4
CARB FL
ABB
FPY
RFP
1FP
2FP
3FP
4N
BTN
BT1
NBT
2N
BT3
NBT
4BA
A C0 C1 C2 C3 C4 BBF
BJKF BA
FBE
PBA
PPE
R IPDA
HA
BGH
IP
mg/
kgBAR-1709-1
TPAH7,291 Hopane138
0
500
1000
1500
2000
2500
C9 C10
C11
C12
C13
1380 C1
414
70 C15
C16
Npr
isC1
7Pr
isC1
8Ph
yC1
9C2
0C2
1C2
2C2
3C2
4C2
5C2
6C2
7C2
8C2
9C3
0C3
1C3
2C3
3C3
4C3
5C3
6C3
7C3
8C3
9C4
0
mg/
kg
BAR-1709-1
TSHC31,252
0
50
100
150
200
250
300
T4 T5 T6 T6a
T6b
T6c T7 T8 T9 T10 Ts
TR30
aTR
30b
Tm 14a
14b
T15
T16
T17
T18 OL
T19
T20
T21
T22
Gam
mT2
6T2
7T3
0T3
1T3
2T3
3T3
4T3
5 S4 S5 S8DI
A29S
DIA2
9R S18
S19
S20
S24
S25
S28
S14
S15
S22
S23
S26
S27
Preg
MPr
egEP
regA
EPre
gBTA
S0TA
S1TA
S2TA
S3TA
S4TA
S5TA
S6M
AS1
MAS
2M
AS3
MAS
4M
AS5
MAS
6M
AS7
MAS
8M
AS9
MAS
10M
AS11
MAS
12
mg/
kg
BAR-1709-1

8
Pre-spill Conditions Routine LTEMP monitoring samples collected in early July 2017 showed expected trace background signatures both near the terminal and across the Port at the GOC reference site (Figure 5). These patterns do not appear to be from the degraded oil discharges of the Ballast Water Treatment Facility (BWTF) (Payne and Driskell, 2017; and 2018 in preparation). Instead, these are low-concentration background patterns, all similar, in which the PAH reflect primarily dissolved-phase (parent-dominated) naphthalenes (N), phenanthrene/anthracenes (P/A), fluoranthene/pyrenes (FP) and traces of particulate-phase combustion products.
Figure 5. Representative PAH and biomarker profiles from July 2017 mussel collections at Saw Island, Jackson Point, and Gold Creek (LTEMP stations: AMT, JAP and GOC, respectively). The dotted red line shows the expected scaled profiles from the fresh spill oil (Figure 4) normalized to hopane. Note that the triaromatic steranes and newly added biomarkers do not appear in tissue samples because they are removed during L/C chromatography to separate lipids.
As confirmed by the dissimilarity to fresh spill-oil patterns (indicated by the red dotted line), neither the PAH or biomarker patterns show any solid evidence of ANS crude oil. Instead, the background, dissolved-phase patterns and concentrations at AMT and JAP are essentially the same as those measured in July 2016 (Payne and Driskell 2017). During the July 2016 sampling at GOC there was evidence of a localized diesel spill (Payne and Driskell,
0
0.2
0.4
0.6
0.8
1
1.2
1.4
1.6
N N1 N2 N3 N4 BIAC
YAC
N F F1 F2 F3 F4 A Ph PA1
PA2
PA3
PA4
RET
DBT
DBT1
DBT2
DBT3
DBT4 BB
F Fl Py FP1
FP2
FP3
FP4
NBT
NBT1
NBT2
NBT3
NBT4
BAA C C1 C2 C3 C4 BBF
BKF
BAF
BEP
BAP
PER
INDP
DAHA
BGHI
µg/K
g
AMT-B-17-2-11707006-01
7Tissue TPAH7/8/2017
0
0.05
0.1
0.15
0.2
0.25
0.3
0.35
0.4
0.45
T4 T5 T6TR
25b
T6a
T6b
T6c T7 T8 T9 T10
T11
T11a
T11b T1
2T1
4aT1
4b T15
T16 X
T17
T18
T19
Nor3
0H T20
T21
T22
T22A T2
6T2
7T3
0T3
1T3
2T3
3T3
4T3
5S2
2 S4 S5 S8 S12
S17
S18
S19
S20
S24
S25
S28
S14
S15
S22
S23
S26
S27
TAS1
TAS2
TAS3
TAS4
µg/K
g
AMT-B-17-2-17/8/2017
0
0.2
0.4
0.6
0.8
1
1.2
1.4
N N1 N2 N3 N4 BIAC
YAC
N F F1 F2 F3 F4 A Ph PA1
PA2
PA3
PA4
RET
DBT
DBT1
DBT2
DBT3
DBT4 BB
F Fl Py FP1
FP2
FP3
FP4
NBT
NBT1
NBT2
NBT3
NBT4
BAA C C1 C2 C3 C4 BBF
BKF
BAF
BEP
BAP
PER
INDP
DAHA
BGHI
µg/K
g
JAP-B-17-2-11707006-07
6Tissue TPAH7/8/2017
0
0.1
0.2
0.3
0.4
0.5
0.6
T4 T5 T6TR
25b
T6a
T6b
T6c T7 T8 T9 T10
T11
T11a
T11b T1
2T1
4aT1
4b T15
T16 X
T17
T18
T19
Nor3
0H T20
T21
T22
T22A T2
6T2
7T3
0T3
1T3
2T3
3T3
4T3
5S2
2 S4 S5 S8 S12
S17
S18
S19
S20
S24
S25
S28
S14
S15
S22
S23
S26
S27
TAS1
TAS2
TAS3
TAS4
µg/K
g
JAP-B-17-2-17/8/2017
0
0.2
0.4
0.6
0.8
1
1.2
1.4
1.6
1.8
N N1 N2 N3 N4 BIAC
YAC
N F F1 F2 F3 F4 A Ph PA1
PA2
PA3
PA4
RET
DBT
DBT1
DBT2
DBT3
DBT4 BB
F Fl Py FP1
FP2
FP3
FP4
NBT
NBT1
NBT2
NBT3
NBT4
BAA C C1 C2 C3 C4 BBF
BKF
BAF
BEP
BAP
PER
INDP
DAHA
BGHI
µg/K
g
GOC-B-17-2-11707006-04
7Tissue TPAH7/8/2017
0
0.1
0.2
0.3
0.4
0.5
0.6
T4 T5 T6TR
25b
T6a
T6b
T6c T7 T8 T9 T10
T11
T11a
T11b T1
2T1
4aT1
4b T15
T16 X
T17
T18
T19
Nor3
0H T20
T21
T22
T22A T2
6T2
7T3
0T3
1T3
2T3
3T3
4T3
5S2
2 S4 S5 S8 S12
S17
S18
S19
S20
S24
S25
S28
S14
S15
S22
S23
S26
S27
TAS1
TAS2
TAS3
TAS4
µg/K
g
GOC-B-17-2-17/8/2017

9
2017), but that, too, had disappeared by July 2017 when the background pattern at GOC more closely matched those at the other two Port Valdez locations (Figure 5).
Post-Berth 5 Oil Spill Signatures Mussel samples collected at SAW and JAC just over a week after the Berth 5 spill show weathered PAH and biomarker patterns associated with the released ANS oil (Figure 6). At GOC, however, there was no evidence that the oil or sheen had migrated across the Port. Only traces of background PAH and biomarkers were observed (not matching any known source). Note that the newly added triaromatic steranes and extended biomarkers do not appear in tissue samples because they are removed during HPLC clean-up of the extracts to eliminate lipid interference. The additional components added by the lab are of primary interest for oil sample characterizations.
Figure 6. PAH and Biomarker patterns at SAW, JAC, and GOC collected on 29 September 2017, just over a week after the spill. The dotted red lines represent the anticipated profiles from the collected spill oil (Figure 4) normalized to hopane. Profiles from all three replicates at each site are shown in Appendix 1.
In agreement with observations and photographic evidence obtained during the spill response, the PAH and biomarker concentrations also confirm that most of the released oil migrated to the west, impacting the adjacent
0
5
10
15
20
25
30
35
40
45
50
DEC
DEC1
DEC2
DEC3
DEC4 BT
0BT
1BT
2BT
3BT
4 N0 N1 N2 N3 N4 BP DBF
ACY
ACN F F1 F2 F3
ANT
PHN
PA1
PA2
PA3
PA4
RET
DBT0
DBT1
DBT2
DBT3
DBT4
CARB FL
ABB
FPY
RFP
1FP
2FP
3FP
4NB
TNB
T1NB
T2NB
T3NB
T4BA
A C0 C1 C2 C3 C4 BBF
BJKF BA
FBE
PBA
PPE
R IPDA
HABG
HIP
ug/k
g
SAW-1709-1
TPAH158 Hopane6.17
0
1
2
3
4
5
6
7
8
9
T4 T5 T6 T6a
T6b
T6c T7 T8 T9 T10 Ts
TR30
aTR
30b
Tm 14a
14b
T15
T16
T17
T18 OL T19
T20
T21
T22
Gam
mT2
6T2
7T3
0T3
1T3
2T3
3T3
4T3
5 S4 S5 S8DI
A29S
DIA2
9R S18
S19
S20
S24
S25
S28
S14
S15
S22
S23
S26
S27
Preg
MPr
egEP
regA
EPre
gBTA
S0TA
S1TA
S2TA
S3TA
S4TA
S5TA
S6M
AS1
MAS
2M
AS3
MAS
4M
AS5
MAS
6M
AS7
MAS
8M
AS9
MAS
10M
AS11
MAS
12
ug/k
g
SAW-1709-1
0
2
4
6
8
10
12
14
16
18
DEC
DEC1
DEC2
DEC3
DEC4 BT
0BT
1BT
2BT
3BT
4 N0 N1 N2 N3 N4 BP DBF
ACY
ACN F F1 F2 F3
ANT
PHN
PA1
PA2
PA3
PA4
RET
DBT0
DBT1
DBT2
DBT3
DBT4
CARB FL
ABB
FPY
RFP
1FP
2FP
3FP
4NB
TNB
T1NB
T2NB
T3NB
T4BA
A C0 C1 C2 C3 C4 BBF
BJKF BA
FBE
PBA
PPE
R IPDA
HABG
HIP
ug/k
g
JAC-1709-1
TPAH21 Hopane2.26
0
1
2
3
4
5
6
7
8
T4 T5 T6 T6a
T6b
T6c T7 T8 T9 T10 Ts
TR30
aTR
30b
Tm 14a
14b
T15
T16
T17
T18 OL T19
T20
T21
T22
Gam
mT2
6T2
7T3
0T3
1T3
2T3
3T3
4T3
5 S4 S5 S8DI
A29S
DIA2
9R S18
S19
S20
S24
S25
S28
S14
S15
S22
S23
S26
S27
Preg
MPr
egEP
regA
EPre
gBTA
S0TA
S1TA
S2TA
S3TA
S4TA
S5TA
S6M
AS1
MAS
2M
AS3
MAS
4M
AS5
MAS
6M
AS7
MAS
8M
AS9
MAS
10M
AS11
MAS
12
ug/k
g
JAC-1709-1
0
0.5
1
1.5
2
2.5
3
3.5
DEC
DEC1
DEC2
DEC3
DEC4 BT
0BT
1BT
2BT
3BT
4 N0 N1 N2 N3 N4 BP DBF
ACY
ACN F F1 F2 F3
ANT
PHN
PA1
PA2
PA3
PA4
RET
DBT0
DBT1
DBT2
DBT3
DBT4
CARB FL
ABB
FPY
RFP
1FP
2FP
3FP
4NB
TNB
T1NB
T2NB
T3NB
T4BA
A C0 C1 C2 C3 C4 BBF
BJKF BA
FBE
PBA
PPE
R IPDA
HABG
HIP
ug/k
g
GOC-1709-1
TPAH5 Hopane0.46
0
1
2
3
4
5
6
7
8
9
T4 T5 T6 T6a
T6b
T6c T7 T8 T9 T10 Ts
TR30
aTR
30b
Tm 14a
14b
T15
T16
T17
T18 OL T19
T20
T21
T22
Gam
mT2
6T2
7T3
0T3
1T3
2T3
3T3
4T3
5 S4 S5 S8DI
A29S
DIA2
9R S18
S19
S20
S24
S25
S28
S14
S15
S22
S23
S26
S27
Preg
MPr
egEP
regA
EPre
gBTA
S0TA
S1TA
S2TA
S3TA
S4TA
S5TA
S6M
AS1
MAS
2M
AS3
MAS
4M
AS5
MAS
6M
AS7
MAS
8M
AS9
MAS
10M
AS11
MAS
12
ug/k
g
GOC-1709-1

10
Saw Island site, as the TPAH concentrations were significantly higher at SAW compared to JAC (see further discussion below).
Spill Recovery Signatures By December (70 days post), hydrocarbon levels in the mussel samples at all three locations were reduced to near-background concentrations with patterns nearly identical to pre-spill conditions (Figure 7). Total PAH (TPAH) concentrations (Figure 8) also reflect the spilled-oil uptake and rapid depuration after the spill. Other studies have suggested that mussels can purge themselves fairly rapidly following short episodic oil exposures with the decreases in the hydrocarbon concentrations following an exponential curve. Early work reported a depuration half-life of less than a week (Lee, 1977 and Mason, 1988). Later work following the Prestige oil spill suggested more complex processes with two phases of depuration (Neito et al., 2006). A number of factors may affect depuration rates; oil composition, exposure period, water temperature, mussel size, maturity, body lipid content, stress, etc. The Berth 5 spill data are too limited to establish depuration rates but suffice to say, 70 days after the episodic event, the mussels were effectively clean.
Figure 7. PAH and Biomarker patterns at SAW, JAC, and GOC collected on 12 December 2017, just over 10 weeks (71 days) after the spill. The dotted red lines represent the anticipated profiles from the collected spill oil (Figure 4) normalized to hopane. Profiles from all three replicates at each site are shown in Appendix 1.
0
1
2
3
4
5
6
7
8
DEC
DEC1
DEC2
DEC3
DEC4 BT
0BT
1BT
2BT
3BT
4 N0
N1
N2
N3
N4 BP DBF
ACY
ACN F F1 F2 F3
ANT
PHN
PA1
PA2
PA3
PA4
RET
DBT0
DBT1
DBT2
DBT3
DBT4
CARB FL
ABB
FPY
RFP
1FP
2FP
3FP
4N
BTN
BT1
NBT
2N
BT3
NBT
4BA
A C0 C1 C2 C3 C4 BBF
BJKF BA
FBE
PBA
PPE
R IPDA
HA
BGH
IP
ug/k
g
SAW-1712-1
TPAH10 Hopane1.03
0
2
4
6
8
10
12
14
T4 T5 T6 T6a
T6b
T6c T7 T8 T9 T10 Ts
TR30
aTR
30b
Tm 14a
14b
T15
T16
T17
T18 OL
T19
T20
T21
T22
Gam
mT2
6T2
7T3
0T3
1T3
2T3
3T3
4T3
5 S4 S5 S8DI
A29S
DIA2
9R S18
S19
S20
S24
S25
S28
S14
S15
S22
S23
S26
S27
Preg
MPr
egEP
regA
EPre
gBTA
S0TA
S1TA
S2TA
S3TA
S4TA
S5TA
S6M
AS1
MAS
2M
AS3
MAS
4M
AS5
MAS
6M
AS7
MAS
8M
AS9
MAS
10M
AS11
MAS
12
ug/k
gSAW-1712-1
0
1
2
3
4
5
6
7
DEC
DEC1
DEC2
DEC3
DEC4 BT
0BT
1BT
2BT
3BT
4 N0
N1
N2
N3
N4 BP DBF
ACY
ACN F F1 F2 F3
ANT
PHN
PA1
PA2
PA3
PA4
RET
DBT0
DBT1
DBT2
DBT3
DBT4
CARB FL
ABB
FPY
RFP
1FP
2FP
3FP
4N
BTN
BT1
NBT
2N
BT3
NBT
4BA
A C0 C1 C2 C3 C4 BBF
BJKF BA
FBE
PBA
PPE
R IPDA
HA
BGH
IP
ug/k
g
JAC-1712-1
TPAH4 Hopane0.924
0
1
2
3
4
5
6
7
8
9
T4 T5 T6 T6a
T6b
T6c T7 T8 T9 T10 Ts
TR30
aTR
30b
Tm 14a
14b
T15
T16
T17
T18 OL
T19
T20
T21
T22
Gam
mT2
6T2
7T3
0T3
1T3
2T3
3T3
4T3
5 S4 S5 S8DI
A29S
DIA2
9R S18
S19
S20
S24
S25
S28
S14
S15
S22
S23
S26
S27
Preg
MPr
egEP
regA
EPre
gBTA
S0TA
S1TA
S2TA
S3TA
S4TA
S5TA
S6M
AS1
MAS
2M
AS3
MAS
4M
AS5
MAS
6M
AS7
MAS
8M
AS9
MAS
10M
AS11
MAS
12
ug/k
g
JAC-1712-1
0
1
2
3
4
5
6
7
DEC
DEC1
DEC2
DEC3
DEC4 BT
0BT
1BT
2BT
3BT
4 N0
N1
N2
N3
N4 BP DBF
ACY
ACN F F1 F2 F3
ANT
PHN
PA1
PA2
PA3
PA4
RET
DBT0
DBT1
DBT2
DBT3
DBT4
CARB FL
ABB
FPY
RFP
1FP
2FP
3FP
4N
BTN
BT1
NBT
2N
BT3
NBT
4BA
A C0 C1 C2 C3 C4 BBF
BJKF BA
FBE
PBA
PPE
R IPDA
HA
BGH
IP
ug/k
g
GOC-1712-1
TPAH4 Hopane0.83
0
1
2
3
4
5
6
7
8
9
10
T4 T5 T6 T6a
T6b
T6c T7 T8 T9 T10 Ts
TR30
aTR
30b
Tm 14a
14b
T15
T16
T17
T18 OL
T19
T20
T21
T22
Gam
mT2
6T2
7T3
0T3
1T3
2T3
3T3
4T3
5 S4 S5 S8DI
A29S
DIA2
9R S18
S19
S20
S24
S25
S28
S14
S15
S22
S23
S26
S27
Preg
MPr
egEP
regA
EPre
gBTA
S0TA
S1TA
S2TA
S3TA
S4TA
S5TA
S6M
AS1
MAS
2M
AS3
MAS
4M
AS5
MAS
6M
AS7
MAS
8M
AS9
MAS
10M
AS11
MAS
12
ug/k
g
GOC-1712-1

11
Figure 8. Average total PAH (TPAH) concentrations measured at the three collection sites between July 2017 and December 2017.
Table 1. TPAH values, means and std error of means for all samples.
Means SE of Means Date Saw Island Jackson Pt Gold Creek Saw Island Jackson Pt Gold Creek Saw Island Jackson Pt Gold Creek 7/8/2017 6.7 5.7 7.5 6.3 8.4 8.0 0.23 2.58 0.44 7/8/2017 6.0 5.9 7.7 7/8/2017 6.1 13.6 8.9 9/29/2017 157.7 21 5.5 150.2 26.2 5.1 21.86 2.64 0.38 9/29/2017 109.2 28.2 4.3 9/29/2017 183.8 29.5 5.4 12/7/2017 10.4 4.1 4.1 9.0 3.3 2.7 0.70 0.8 0.68 12/7/2017 8.2 4.1 2.1 12/7/2017 8.4 1.7 2 ng/g dry wt
These data also show the relative impacts based on the TPAH loadings in the western (Saw Island) versus eastern (Jackson Point) collection sites adjacent to the terminal. As noted above, these data support the prevailing surface oil/sheen transport to the west observed during the spill event.
Quality Control All sample results were validated by Alpha Laboratory QC personnel as meeting lab performance standards. Noted artifacts include the T26 biomarker interferant and below-MDL trace-level n-C23-n-C34 “haystack” patterns in the method blanks. That haystack pattern also appeared in all of the mussel samples collected in September and December 2017 (Figure 9) where the concentrations were all well above the sample-specific MDLs.
Table 2. Summary of surrogate analyte recoveries for field and QC samples (acceptable range 40-120%).
QC Recovery (%) Average Max Min Count
Naphthalene-d8 61.0 111 44 25
Phenanthrene-d10 76.0 105 60 25
Benzo[a]pyrene-d12 75.4 116 54 25
o-terphenyl 96.7 97 96 3
d50-Tetracosane 95.3 111 78 25
5B(H)Cholane 106.8 123 96 25
0
20
40
60
80
100
120
140
160
180
200
Jul-17 Aug-17 Sep-17 Oct-17 Nov-17 Dec-17
ng/g
dry
wt
Mussel Tissue TPAH
Saw Island avg
Jackson Pt avg
Gold Creek avg
SE of means

12
Mussel Tissue SHC – September 2017 Mussel Tissue SHC – December 2017
QC Method Blanks – September 2017 Samples QC Method Blanks – December 2017 Samples
Figure 9. SHC patterns in September and December 2017 mussel-tissue samples at all three sites with the red line denoting the sample-specific MDL (upper plots) and the laboratory method blanks (note at order-of-magnitude lower concentrations) analyzed with the September and December sample batches (lower plots). The n-C15, n-C17, and pristane observed in the tissues represent input from phytoplankton and zooplankton (Short, 2005) while the C23-C34 “haystack” likely derives from marine bacteria (Davis, 1968; Han and Calvin 1969; and NAS 1975).
0
0.002
0.004
0.006
0.008
0.01
0.012
C9 C10
C11
C12
C13
1380 C1
414
70 C15
C16
Npr
isC1
7Pr
isC1
8Ph
yC1
9C2
0C2
1C2
2C2
3C2
4C2
5C2
6C2
7C2
8C2
9C3
0C3
1C3
2C3
3C3
4C3
5C3
6C3
7C3
8C3
9C4
0
mg/
kg
WG1059598-1-BLANK
TSHC0
0
0.005
0.01
0.015
0.02
0.025
C9 C10
C11
C12
C13
1380 C1
414
70 C15
C16
Npr
isC1
7Pr
isC1
8Ph
yC1
9C2
0C2
1C2
2C2
3C2
4C2
5C2
6C2
7C2
8C2
9C3
0C3
1C3
2C3
3C3
4C3
5C3
6C3
7C3
8C3
9C4
0
mg/
kg
WG1078906-1-BLANK
TSHC0
0
0.05
0.1
0.15
0.2
0.25
0.3
0.35
C9 C10
C11
C12
C13
1380 C1
414
70 C15
C16
Npris C17
Pris
C18
Phy
C19
C20
C21
C22
C23
C24
C25
C26
C27
C28
C29
C30
C31
C32
C33
C34
C35
C36
C37
C38
C39
C40
mg/
kg
GOC-1709-1
TSHC2
0
0.05
0.1
0.15
0.2
0.25
0.3
C9 C10
C11
C12
C13
1380 C1
414
70 C15
C16
Npris C17
Pris
C18
Phy
C19
C20
C21
C22
C23
C24
C25
C26
C27
C28
C29
C30
C31
C32
C33
C34
C35
C36
C37
C38
C39
C40
mg/
kg
GOC-1709-2
TSHC2
0
0.05
0.1
0.15
0.2
0.25
0.3
0.35
C9 C10
C11
C12
C13
1380 C1
414
70 C15
C16
Npris C17
Pris
C18
Phy
C19
C20
C21
C22
C23
C24
C25
C26
C27
C28
C29
C30
C31
C32
C33
C34
C35
C36
C37
C38
C39
C40
mg/
kg
GOC-1709-3
TSHC2
0
0.1
0.2
0.3
0.4
0.5
0.6
C9 C10
C11
C12
C13
1380 C1
414
70 C15
C16
Npris C17
Pris
C18
Phy
C19
C20
C21
C22
C23
C24
C25
C26
C27
C28
C29
C30
C31
C32
C33
C34
C35
C36
C37
C38
C39
C40
mg/
kg
JAC-1709-1
TSHC4
0
0.05
0.1
0.15
0.2
0.25
0.3
C9 C10
C11
C12
C13
1380 C1
414
70 C15
C16
Npris C17
Pris
C18
Phy
C19
C20
C21
C22
C23
C24
C25
C26
C27
C28
C29
C30
C31
C32
C33
C34
C35
C36
C37
C38
C39
C40
mg/
kg
JAC-1709-2
TSHC2
0
0.05
0.1
0.15
0.2
0.25
0.3
C9 C10
C11
C12
C13
1380 C1
414
70 C15
C16
Npris C17
Pris
C18
Phy
C19
C20
C21
C22
C23
C24
C25
C26
C27
C28
C29
C30
C31
C32
C33
C34
C35
C36
C37
C38
C39
C40
mg/
kg
JAC-1709-3
TSHC2
0
0.02
0.04
0.06
0.08
0.1
0.12
0.14
0.16
0.18
C9 C10
C11
C12
C13
1380 C1
414
70 C15
C16
Npris C17
Pris
C18
Phy
C19
C20
C21
C22
C23
C24
C25
C26
C27
C28
C29
C30
C31
C32
C33
C34
C35
C36
C37
C38
C39
C40
mg/
kg
SAW-1709-1
TSHC2
0
0.02
0.04
0.06
0.08
0.1
0.12
0.14
0.16
0.18
C9 C10
C11
C12
C13
1380 C1
414
70 C15
C16
Npris C17
Pris
C18
Phy
C19
C20
C21
C22
C23
C24
C25
C26
C27
C28
C29
C30
C31
C32
C33
C34
C35
C36
C37
C38
C39
C40
mg/
kg
SAW-1709-2
TSHC2
0
0.05
0.1
0.15
0.2
0.25
C9 C10
C11
C12
C13
1380 C1
414
70 C15
C16
Npris C17
Pris
C18
Phy
C19
C20
C21
C22
C23
C24
C25
C26
C27
C28
C29
C30
C31
C32
C33
C34
C35
C36
C37
C38
C39
C40
mg/
kg
SAW-1709-3
TSHC2
0
0.02
0.04
0.06
0.08
0.1
0.12
0.14
0.16
C9 C10
C11
C12
C13
1380 C1
414
70 C15
C16
Npris C17
Pris
C18
Phy
C19
C20
C21
C22
C23
C24
C25
C26
C27
C28
C29
C30
C31
C32
C33
C34
C35
C36
C37
C38
C39
C40
mg/
kg
JAC-1712-1
TSHC1
0
0.02
0.04
0.06
0.08
0.1
0.12
0.14
0.16
C9 C10
C11
C12
C13
1380 C1
414
70 C15
C16
Npris C17
Pris
C18
Phy
C19
C20
C21
C22
C23
C24
C25
C26
C27
C28
C29
C30
C31
C32
C33
C34
C35
C36
C37
C38
C39
C40
mg/
kg
JAC-1712-2
TSHC1
0
0.05
0.1
0.15
0.2
0.25
0.3
C9 C10
C11
C12
C13
1380 C1
414
70 C15
C16
Npris C17
Pris
C18
Phy
C19
C20
C21
C22
C23
C24
C25
C26
C27
C28
C29
C30
C31
C32
C33
C34
C35
C36
C37
C38
C39
C40
mg/
kg
JAC-1712-3
TSHC1
0
0.02
0.04
0.06
0.08
0.1
0.12
0.14
0.16
0.18
C9 C10
C11
C12
C13
1380 C1
414
70 C15
C16
Npris C17
Pris
C18
Phy
C19
C20
C21
C22
C23
C24
C25
C26
C27
C28
C29
C30
C31
C32
C33
C34
C35
C36
C37
C38
C39
C40
mg/
kg
SAW-1712-1
TSHC1
0
0.02
0.04
0.06
0.08
0.1
0.12
0.14
0.16
0.18
C9 C10
C11
C12
C13
1380 C1
414
70 C15
C16
Npris C17
Pris
C18
Phy
C19
C20
C21
C22
C23
C24
C25
C26
C27
C28
C29
C30
C31
C32
C33
C34
C35
C36
C37
C38
C39
C40
mg/
kg
SAW-1712-2
TSHC1
0
0.05
0.1
0.15
0.2
0.25
0.3
C9 C10
C11
C12
C13
1380 C1
414
70 C15
C16
Npris C17
Pris
C18
Phy
C19
C20
C21
C22
C23
C24
C25
C26
C27
C28
C29
C30
C31
C32
C33
C34
C35
C36
C37
C38
C39
C40
mg/
kg
SAW-1712-3
TSHC2
0
0.02
0.04
0.06
0.08
0.1
0.12
C9 C10
C11
C12
C13
1380 C1
414
70 C15
C16
Npris C17
Pris
C18
Phy
C19
C20
C21
C22
C23
C24
C25
C26
C27
C28
C29
C30
C31
C32
C33
C34
C35
C36
C37
C38
C39
C40
mg/
kg
GOC-1712-1
TSHC1
0
0.02
0.04
0.06
0.08
0.1
0.12
0.14
0.16
0.18
C9 C10
C11
C12
C13
1380 C1
414
70 C15
C16
Npris C17
Pris
C18
Phy
C19
C20
C21
C22
C23
C24
C25
C26
C27
C28
C29
C30
C31
C32
C33
C34
C35
C36
C37
C38
C39
C40
mg/
kg
GOC-1712-2
TSHC1
0
0.02
0.04
0.06
0.08
0.1
0.12
0.14
0.16
0.18
C9 C10
C11
C12
C13
1380 C1
414
70 C15
C16
Npris C17
Pris
C18
Phy
C19
C20
C21
C22
C23
C24
C25
C26
C27
C28
C29
C30
C31
C32
C33
C34
C35
C36
C37
C38
C39
C40
mg/
kg
GOC-1712-3
TSHC1

13
SHC Artifacts
One intriguing aspect of the data analysis regarded the ubiquitous n-C23 to n-C34 “haystack” pattern observed in the SHC distributions for all the mussel samples reviewed (Figure 9 and Appendix 1). It was thought at first that they might be associated with the spill event because the pattern neatly fit beneath the spilled-oil, SHC fingerprint normalized to n-C27. But that couldn’t be because the pattern (based on m/z 85 ion data) also appeared in one of three AMT samples, two of three GOC samples, and at varying concentrations in two of three JAC samples from the July 2017 LTEMP collections before the Berth 5 spill (Payne and Driskell, 2018 in preparation). Note that SHC were not quantified in the mussel samples for 2016 LTEMP. The next potential source could possibly be laboratory or field contamination, but the lab blanks (while showing a similar pattern, but at an order-of-magnitude lower concentration – see Figure 9) seemed to rule that out. Field contamination was also unlikely because the July 2017 samples were collected by Payne and Janka as part of the LTEMP effort on the Auklet, while the September and December 2017 samples were collected by Austin Love using a water taxi out of Valdez. It seems highly unlikely that three separate field efforts completed by different personnel from different vessels over a six-month time frame would encounter the same contamination.
Review of pre-2017 LTEMP data generated by the NOAA Auke Bay Laboratory also showed the occasional presence of this n-C23 to n-C35 haystack (Payne et al., 2010). After further literature review, we believe that the haystack pattern can be traced to bacterial sources. NAS (1975, p 29) reports that an odd-to-even n-alkanes ratio of one in the C25-C33 range may not always be due to oil as some bacteria can generate alkanes with this distribution (Davis, 1968; Han and Calvin, 1969). For additional details on biogenic and petrogenic sources, see the LTEMP Oil Primer in Appendix A of our Final 2006-2008 LTEMP report (Payne, Driskell, Short, and Larsen, 2010).
Summary Pre-spill samples showed traces of hydrocarbons whose signatures could not be attributed to the degraded oil discharges of the Ballast Water Treatment Facility. In the week after the Berth 5 spill event, crude oil was present in the tissues from the adjacent Saw Island site and from Jackson Point. The reference site across the Port was unaffected. By December, all three locations had returned to near-background concentrations and to patterns, nearly identical to pre-spill patterns.
References Davis, J.B. 1968. Paraffin hydrocarbons in the sulfate-reducing bacterium Desulfovibrio desulfuricans. Chem. Geol. 155-160.
Driskell, W. B., and J.R. Payne. 2018. Development and application of phase-specific methods in oiled-water forensic studies. Chapter 14 in (S. Stout and Z. Wang, eds). Oil Spill Environmental Forensics Case Studies. Butterworth-Heinemann/Elsevier Publishers, Oxford, United Kingdom and Cambridge, Massachusetts. 2018: 289-323.
Han, J. and M. Calvin. 1969. Hydrocarbon distribution of algae and bacteria, and microbiological activity of sediments. Proc. Natl. Acad. Sci. 64: 436-455.
Lee, R.F. 1977. Accumulation and turnover of petroleum hydrocarbons in marine organisms. In: Fates and effects of petroleum hydrocarbons in the marine environment. Wolfe, DA (ed). New York: Pergammon Press.
Mason, R.P. 1988. Accumulation and depuration of petroleum hydrocarbons by black mussels. 1. Laboratory exposure trials, South African Journal of Marine Science, 6:1, 143-153, DOI: 10.2989/025776188784480582

14
National Academy of Sciences (NAS). 1975. Petroleum in the Marine Environment. Workshop on inputs, fates, and the effects of petroleum in the marine environment. May 21-25, 1973. Airlie House, Airlie, Virginia. 107 pp.
Neito, O., J. Aboigor, R. Buján, M. N’Diaye, J. Graña, L. Saco-Álvarez, Á. Franco, J.A. Soriano, R. Beiras. 2006. Temporal variation in the levels of polycyclic aromatic hydrocarbons (PAHs) off the Galician Coast after the Prestige oil spill. Marine Ecology Progress Series 328:41-49, DOI10.3354/meps328041
Payne, J.R. and W.B. Driskell. 2018. Macondo oil in northern Gulf of Mexico waters – Part 1: Assessments and forensic methods for Deepwater Horizon offshore water samples. Marine Pollution Bulletin 129(1): 399-411.
Payne, J.R. and Driskell, W.B. 2017a. Water-column measurements and observations from the Deepwater Horizon oil spill Natural Resource Damage Assessment. Proceedings of the 2017 Oil Spill Conference. American Petroleum Institute, Washington, DC. Paper No. 2017-167.
Payne, J.R. and W.B. Driskell. 2017b. Long-term environmental monitoring program: 2016 sampling results and interpretations. Report for PWSRCAC Contract No. 951.1.01. August 2017. 69 pp.
Payne, J.R., W.B. Driskell, J.W. Short, and M.L. Larsen. 2010. Long-Term Environmental Monitoring Program: Final 2006-2008 LTEMP Monitoring Report. PWSRCAC Contract Nos. 951.07.01 and 951.08.01. February 2010. 198 pp.
Payne, J.R., W.B. Driskell, J.W. Short, M.L. Larsen. 2008. Long term monitoring for oil in the Exxon Valdez spill region. Marine Pollution Bulletin 56: 2067-2081.
Short, J.W. 2005. Seasonal variability of pristane in mussels (Mytilus Trossulus) in Prince William Sound, Alaska. Ph.D. Thesis. University of Alaska, Fairbanks. 204 pp.

15
Appendix 1 – All analytic results
Source oil from spill collection barge. Here, the red overlay is also the source oil; highlighted biomarker is hopane.
0
200
400
600
800
1000
1200
DEC
DEC1
DEC2
DEC3
DEC4 BT
0BT
1BT
2BT
3BT
4 N0
N1
N2
N3
N4 BP DBF
ACY
ACN F F1 F2 F3
ANT
PHN
PA1
PA2
PA3
PA4
RET
DBT0
DBT1
DBT2
DBT3
DBT4
CARB FL
ABB
FPY
RFP
1FP
2FP
3FP
4N
BTN
BT1
NBT
2N
BT3
NBT
4BA
A C0 C1 C2 C3 C4 BBF
BJKF BA
FBE
PBA
PPE
R IPDA
HA
BGH
IP
mg/
kg
BAR-1709-1
TPAH7,291 Hopane138
0
500
1000
1500
2000
2500
C9 C10
C11
C12
C13
1380 C1
414
70 C15
C16
Npr
isC1
7Pr
isC1
8Ph
yC1
9C2
0C2
1C2
2C2
3C2
4C2
5C2
6C2
7C2
8C2
9C3
0C3
1C3
2C3
3C3
4C3
5C3
6C3
7C3
8C3
9C4
0
mg/
kg
BAR-1709-1
TSHC31,252
0
50
100
150
200
250
300
T4 T5 T6 T6a
T6b
T6c T7 T8 T9 T10 Ts
TR30
aTR
30b
Tm 14a
14b
T15
T16
T17
T18 OL
T19
T20
T21
T22
Gam
mT2
6T2
7T3
0T3
1T3
2T3
3T3
4T3
5 S4 S5 S8DI
A29S
DIA2
9R S18
S19
S20
S24
S25
S28
S14
S15
S22
S23
S26
S27
Preg
MPr
egEP
regA
EPre
gBTA
S0TA
S1TA
S2TA
S3TA
S4TA
S5TA
S6M
AS1
MAS
2M
AS3
MAS
4M
AS5
MAS
6M
AS7
MAS
8M
AS9
MAS
10M
AS11
MAS
12
mg/
kg
BAR-1709-1
16
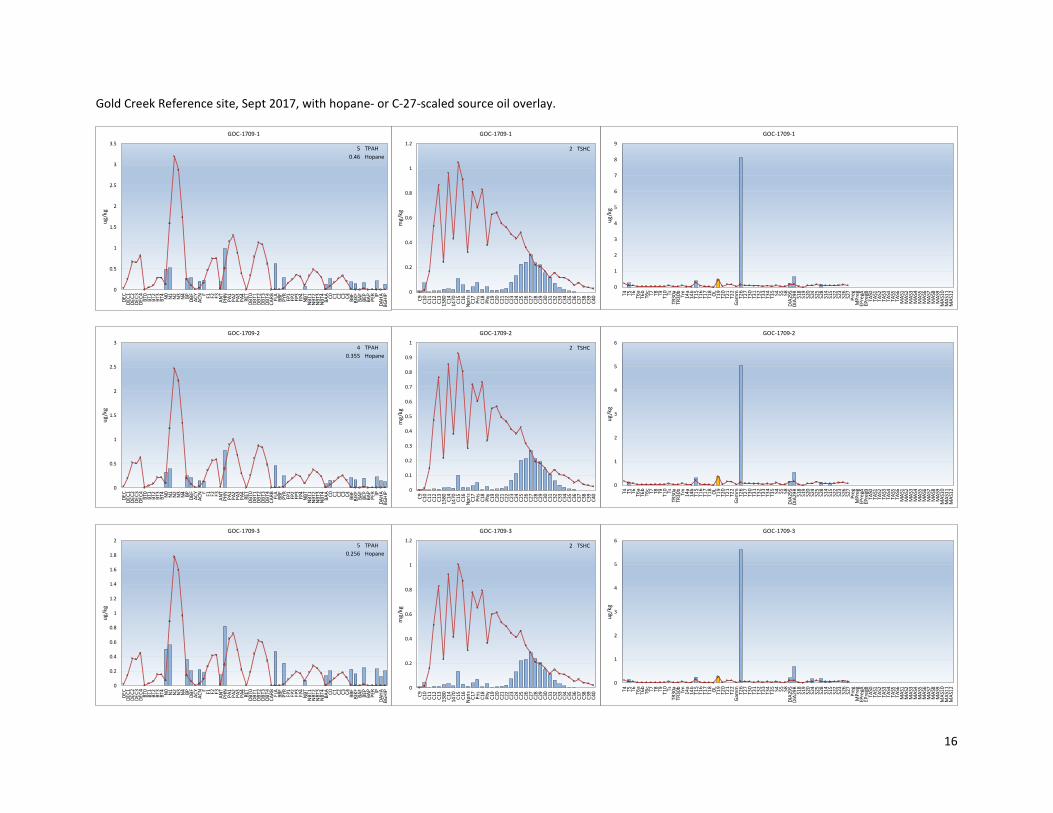
Gold Creek Reference site, Sept 2017, with hopane- or C-27-scaled source oil overlay.
0
0.5
1
1.5
2
2.5
3
3.5
DEC
DEC1
DEC2
DEC3
DEC4 BT
0BT
1BT
2BT
3BT
4 N0
N1
N2
N3
N4 BP DBF
ACY
ACN F F1 F2 F3
ANT
PHN
PA1
PA2
PA3
PA4
RET
DBT0
DBT1
DBT2
DBT3
DBT4
CARB FL
ABB
FPY
RFP
1FP
2FP
3FP
4N
BTN
BT1
NBT
2N
BT3
NBT
4BA
A C0 C1 C2 C3 C4 BBF
BJKF BA
FBE
PBA
PPE
R IPDA
HA
BGH
IP
ug/k
g
GOC-1709-1
TPAH5 Hopane0.46
0
0.2
0.4
0.6
0.8
1
1.2
C9 C10
C11
C12
C13
1380 C1
414
70 C15
C16
Npr
isC1
7Pr
isC1
8Ph
yC1
9C2
0C2
1C2
2C2
3C2
4C2
5C2
6C2
7C2
8C2
9C3
0C3
1C3
2C3
3C3
4C3
5C3
6C3
7C3
8C3
9C4
0
mg/
kg
GOC-1709-1
TSHC2
0
1
2
3
4
5
6
7
8
9
T4 T5 T6 T6a
T6b
T6c T7 T8 T9 T10 Ts
TR30
aTR
30b
Tm 14a
14b
T15
T16
T17
T18 OL
T19
T20
T21
T22
Gam
mT2
6T2
7T3
0T3
1T3
2T3
3T3
4T3
5 S4 S5 S8DI
A29S
DIA2
9R S18
S19
S20
S24
S25
S28
S14
S15
S22
S23
S26
S27
Preg
MPr
egEP
regA
EPre
gBTA
S0TA
S1TA
S2TA
S3TA
S4TA
S5TA
S6M
AS1
MAS
2M
AS3
MAS
4M
AS5
MAS
6M
AS7
MAS
8M
AS9
MAS
10M
AS11
MAS
12
ug/k
g
GOC-1709-1
0
0.5
1
1.5
2
2.5
3
DEC
DEC1
DEC2
DEC3
DEC4 BT
0BT
1BT
2BT
3BT
4 N0 N1 N2 N3 N4 BP DBF
ACY
ACN F F1 F2 F3
ANT
PHN
PA1
PA2
PA3
PA4
RET
DBT0
DBT1
DBT2
DBT3
DBT4
CARB FL
ABB
FPY
RFP
1FP
2FP
3FP
4NB
TNB
T1NB
T2NB
T3NB
T4BA
A C0 C1 C2 C3 C4 BBF
BJKF BA
FBE
PBA
PPE
R IPDA
HABG
HIP
ug/k
g
GOC-1709-2
TPAH4 Hopane0.355
0
0.1
0.2
0.3
0.4
0.5
0.6
0.7
0.8
0.9
1
C9 C10
C11
C12
C13
1380 C1
414
70 C15
C16
Npris C17
Pris
C18
Phy
C19
C20
C21
C22
C23
C24
C25
C26
C27
C28
C29
C30
C31
C32
C33
C34
C35
C36
C37
C38
C39
C40
mg/
kg
GOC-1709-2
TSHC2
0
1
2
3
4
5
6
T4 T5 T6 T6a
T6b
T6c T7 T8 T9 T10 Ts
TR30
aTR
30b
Tm 14a
14b
T15
T16
T17
T18 OL T19
T20
T21
T22
Gam
mT2
6T2
7T3
0T3
1T3
2T3
3T3
4T3
5 S4 S5 S8DI
A29S
DIA2
9R S18
S19
S20
S24
S25
S28
S14
S15
S22
S23
S26
S27
Preg
MPr
egEP
regA
EPre
gBTA
S0TA
S1TA
S2TA
S3TA
S4TA
S5TA
S6M
AS1
MAS
2M
AS3
MAS
4M
AS5
MAS
6M
AS7
MAS
8M
AS9
MAS
10M
AS11
MAS
12
ug/k
g
GOC-1709-2
0
0.2
0.4
0.6
0.8
1
1.2
1.4
1.6
1.8
2
DEC
DEC1
DEC2
DEC3
DEC4 BT
0BT
1BT
2BT
3BT
4 N0 N1 N2 N3 N4 BP DBF
ACY
ACN F F1 F2 F3
ANT
PHN
PA1
PA2
PA3
PA4
RET
DBT0
DBT1
DBT2
DBT3
DBT4
CARB FL
ABB
FPY
RFP
1FP
2FP
3FP
4NB
TNB
T1NB
T2NB
T3NB
T4BA
A C0 C1 C2 C3 C4 BBF
BJKF BA
FBE
PBA
PPE
R IPDA
HABG
HIP
ug/k
g
GOC-1709-3
TPAH5 Hopane0.256
0
0.2
0.4
0.6
0.8
1
1.2
C9 C10
C11
C12
C13
1380 C1
414
70 C15
C16
Npris C17
Pris
C18
Phy
C19
C20
C21
C22
C23
C24
C25
C26
C27
C28
C29
C30
C31
C32
C33
C34
C35
C36
C37
C38
C39
C40
mg/
kg
GOC-1709-3
TSHC2
0
1
2
3
4
5
6
T4 T5 T6 T6a
T6b
T6c T7 T8 T9 T10 Ts
TR30
aTR
30b
Tm 14a
14b
T15
T16
T17
T18 OL T19
T20
T21
T22
Gam
mT2
6T2
7T3
0T3
1T3
2T3
3T3
4T3
5 S4 S5 S8DI
A29S
DIA2
9R S18
S19
S20
S24
S25
S28
S14
S15
S22
S23
S26
S27
Preg
MPr
egEP
regA
EPre
gBTA
S0TA
S1TA
S2TA
S3TA
S4TA
S5TA
S6M
AS1
MAS
2M
AS3
MAS
4M
AS5
MAS
6M
AS7
MAS
8M
AS9
MAS
10M
AS11
MAS
12
ug/k
g
GOC-1709-3

17
Jackson Point impact site, Sept 2017, with hopane- or C-27-scaled source oil overlay.
0
2
4
6
8
10
12
14
16
18
DEC
DEC1
DEC2
DEC3
DEC4 BT
0BT
1BT
2BT
3BT
4 N0 N1 N2 N3 N4 BP DBF
ACY
ACN F F1 F2 F3
ANT
PHN
PA1
PA2
PA3
PA4
RET
DBT0
DBT1
DBT2
DBT3
DBT4
CARB FL
ABB
FPY
RFP
1FP
2FP
3FP
4NB
TNB
T1NB
T2NB
T3NB
T4BA
A C0 C1 C2 C3 C4 BBF
BJKF BA
FBE
PBA
PPE
R IPDA
HABG
HIP
ug/k
g
JAC-1709-1
TPAH21 Hopane2.26
0
0.2
0.4
0.6
0.8
1
1.2
1.4
1.6
1.8
2
C9 C10
C11
C12
C13
1380 C1
414
70 C15
C16
Npris C17
Pris
C18
Phy
C19
C20
C21
C22
C23
C24
C25
C26
C27
C28
C29
C30
C31
C32
C33
C34
C35
C36
C37
C38
C39
C40
mg/
kg
JAC-1709-1
TSHC4
0
1
2
3
4
5
6
7
8
T4 T5 T6 T6a
T6b
T6c T7 T8 T9 T10 Ts
TR30
aTR
30b
Tm 14a
14b
T15
T16
T17
T18 OL T19
T20
T21
T22
Gam
mT2
6T2
7T3
0T3
1T3
2T3
3T3
4T3
5 S4 S5 S8DI
A29S
DIA2
9R S18
S19
S20
S24
S25
S28
S14
S15
S22
S23
S26
S27
Preg
MPr
egEP
regA
EPre
gBTA
S0TA
S1TA
S2TA
S3TA
S4TA
S5TA
S6M
AS1
MAS
2M
AS3
MAS
4M
AS5
MAS
6M
AS7
MAS
8M
AS9
MAS
10M
AS11
MAS
12
ug/k
g
JAC-1709-1
0
2
4
6
8
10
12
14
16
18
DEC
DEC1
DEC2
DEC3
DEC4 BT
0BT
1BT
2BT
3BT
4 N0 N1 N2 N3 N4 BP DBF
ACY
ACN F F1 F2 F3
ANT
PHN
PA1
PA2
PA3
PA4
RET
DBT0
DBT1
DBT2
DBT3
DBT4
CARB FL
ABB
FPY
RFP
1FP
2FP
3FP
4NB
TNB
T1NB
T2NB
T3NB
T4BA
A C0 C1 C2 C3 C4 BBF
BJKF BA
FBE
PBA
PPE
R IPDA
HABG
HIP
ug/k
g
JAC-1709-2
TPAH28 Hopane2.33
0
0.1
0.2
0.3
0.4
0.5
0.6
0.7
0.8
0.9
1
C9 C10
C11
C12
C13
1380 C1
414
70 C15
C16
Npris C17
Pris
C18
Phy
C19
C20
C21
C22
C23
C24
C25
C26
C27
C28
C29
C30
C31
C32
C33
C34
C35
C36
C37
C38
C39
C40
mg/
kg
JAC-1709-2
TSHC2
0
1
2
3
4
5
6
7
8
9
T4 T5 T6 T6a
T6b
T6c T7 T8 T9 T10 Ts
TR30
aTR
30b
Tm 14a
14b
T15
T16
T17
T18 OL T19
T20
T21
T22
Gam
mT2
6T2
7T3
0T3
1T3
2T3
3T3
4T3
5 S4 S5 S8DI
A29S
DIA2
9R S18
S19
S20
S24
S25
S28
S14
S15
S22
S23
S26
S27
Preg
MPr
egEP
regA
EPre
gBTA
S0TA
S1TA
S2TA
S3TA
S4TA
S5TA
S6M
AS1
MAS
2M
AS3
MAS
4M
AS5
MAS
6M
AS7
MAS
8M
AS9
MAS
10M
AS11
MAS
12
ug/k
g
JAC-1709-2
0
2
4
6
8
10
12
14
16
DEC
DEC1
DEC2
DEC3
DEC4 BT
0BT
1BT
2BT
3BT
4 N0 N1 N2 N3 N4 BP DBF
ACY
ACN F F1 F2 F3
ANT
PHN
PA1
PA2
PA3
PA4
RET
DBT0
DBT1
DBT2
DBT3
DBT4
CARB FL
ABB
FPY
RFP
1FP
2FP
3FP
4NB
TNB
T1NB
T2NB
T3NB
T4BA
A C0 C1 C2 C3 C4 BBF
BJKF BA
FBE
PBA
PPE
R IPDA
HABG
HIP
ug/k
g
JAC-1709-3
TPAH29 Hopane2.13
0
0.2
0.4
0.6
0.8
1
1.2
C9 C10
C11
C12
C13
1380 C1
414
70 C15
C16
Npris C17
Pris
C18
Phy
C19
C20
C21
C22
C23
C24
C25
C26
C27
C28
C29
C30
C31
C32
C33
C34
C35
C36
C37
C38
C39
C40
mg/
kg
JAC-1709-3
TSHC2
0
1
2
3
4
5
6
7
T4 T5 T6 T6a
T6b
T6c T7 T8 T9 T10 Ts
TR30
aTR
30b
Tm 14a
14b
T15
T16
T17
T18 OL T19
T20
T21
T22
Gam
mT2
6T2
7T3
0T3
1T3
2T3
3T3
4T3
5 S4 S5 S8DI
A29S
DIA2
9R S18
S19
S20
S24
S25
S28
S14
S15
S22
S23
S26
S27
Preg
MPr
egEP
regA
EPre
gBTA
S0TA
S1TA
S2TA
S3TA
S4TA
S5TA
S6M
AS1
MAS
2M
AS3
MAS
4M
AS5
MAS
6M
AS7
MAS
8M
AS9
MAS
10M
AS11
MAS
12
ug/k
g
JAC-1709-3

18
Saw Island impact site, Sept 2017, with hopane- or C-27-scaled source oil overlay.
0
5
10
15
20
25
30
35
40
45
50
DEC
DEC1
DEC2
DEC3
DEC4 BT
0BT
1BT
2BT
3BT
4 N0 N1 N2 N3 N4 BP DBF
ACY
ACN F F1 F2 F3
ANT
PHN
PA1
PA2
PA3
PA4
RET
DBT0
DBT1
DBT2
DBT3
DBT4
CARB FL
ABB
FPY
RFP
1FP
2FP
3FP
4NB
TNB
T1NB
T2NB
T3NB
T4BA
A C0 C1 C2 C3 C4 BBF
BJKF BA
FBE
PBA
PPE
R IPDA
HABG
HIP
ug/k
g
SAW-1709-1
TPAH158 Hopane6.17
0
0.1
0.2
0.3
0.4
0.5
0.6
C9 C10
C11
C12
C13
1380 C1
414
70 C15
C16
Npris C17
Pris
C18
Phy
C19
C20
C21
C22
C23
C24
C25
C26
C27
C28
C29
C30
C31
C32
C33
C34
C35
C36
C37
C38
C39
C40
mg/
kg
SAW-1709-1
TSHC2
0
1
2
3
4
5
6
7
8
9
T4 T5 T6 T6a
T6b
T6c T7 T8 T9 T10 Ts
TR30
aTR
30b
Tm 14a
14b
T15
T16
T17
T18 OL T19
T20
T21
T22
Gam
mT2
6T2
7T3
0T3
1T3
2T3
3T3
4T3
5 S4 S5 S8DI
A29S
DIA2
9R S18
S19
S20
S24
S25
S28
S14
S15
S22
S23
S26
S27
Preg
MPr
egEP
regA
EPre
gBTA
S0TA
S1TA
S2TA
S3TA
S4TA
S5TA
S6M
AS1
MAS
2M
AS3
MAS
4M
AS5
MAS
6M
AS7
MAS
8M
AS9
MAS
10M
AS11
MAS
12
ug/k
g
SAW-1709-1
0
10
20
30
40
50
60
70
80
90
100
DEC
DEC1
DEC2
DEC3
DEC4 BT
0BT
1BT
2BT
3BT
4 N0 N1 N2 N3 N4 BP DBF
ACY
ACN F F1 F2 F3
ANT
PHN
PA1
PA2
PA3
PA4
RET
DBT0
DBT1
DBT2
DBT3
DBT4
CARB FL
ABB
FPY
RFP
1FP
2FP
3FP
4NB
TNB
T1NB
T2NB
T3NB
T4BA
A C0 C1 C2 C3 C4 BBF
BJKF BA
FBE
PBA
PPE
R IPDA
HABG
HIP
ug/k
g
SAW-1709-2
TPAH109 Hopane12.7
0
0.1
0.2
0.3
0.4
0.5
0.6
C9 C10
C11
C12
C13
1380 C1
414
70 C15
C16
Npris C17
Pris
C18
Phy
C19
C20
C21
C22
C23
C24
C25
C26
C27
C28
C29
C30
C31
C32
C33
C34
C35
C36
C37
C38
C39
C40
mg/
kg
SAW-1709-2
TSHC2
0
2
4
6
8
10
12
14
T4 T5 T6 T6a
T6b
T6c T7 T8 T9 T10 Ts
TR30
aTR
30b
Tm 14a
14b
T15
T16
T17
T18 OL T19
T20
T21
T22
Gam
mT2
6T2
7T3
0T3
1T3
2T3
3T3
4T3
5 S4 S5 S8DI
A29S
DIA2
9R S18
S19
S20
S24
S25
S28
S14
S15
S22
S23
S26
S27
Preg
MPr
egEP
regA
EPre
gBTA
S0TA
S1TA
S2TA
S3TA
S4TA
S5TA
S6M
AS1
MAS
2M
AS3
MAS
4M
AS5
MAS
6M
AS7
MAS
8M
AS9
MAS
10M
AS11
MAS
12
ug/k
g
SAW-1709-2
0
10
20
30
40
50
60
DEC
DEC1
DEC2
DEC3
DEC4 BT
0BT
1BT
2BT
3BT
4 N0 N1 N2 N3 N4 BP DBF
ACY
ACN F F1 F2 F3
ANT
PHN
PA1
PA2
PA3
PA4
RET
DBT0
DBT1
DBT2
DBT3
DBT4
CARB FL
ABB
FPY
RFP
1FP
2FP
3FP
4NB
TNB
T1NB
T2NB
T3NB
T4BA
A C0 C1 C2 C3 C4 BBF
BJKF BA
FBE
PBA
PPE
R IPDA
HABG
HIP
ug/k
g
SAW-1709-3
TPAH184 Hopane7.29
0
0.1
0.2
0.3
0.4
0.5
0.6
C9 C10
C11
C12
C13
1380 C1
414
70 C15
C16
Npris C17
Pris
C18
Phy
C19
C20
C21
C22
C23
C24
C25
C26
C27
C28
C29
C30
C31
C32
C33
C34
C35
C36
C37
C38
C39
C40
mg/
kg
SAW-1709-3
TSHC2
0
2
4
6
8
10
12
T4 T5 T6 T6a
T6b
T6c T7 T8 T9 T10 Ts
TR30
aTR
30b
Tm 14a
14b
T15
T16
T17
T18 OL T19
T20
T21
T22
Gam
mT2
6T2
7T3
0T3
1T3
2T3
3T3
4T3
5 S4 S5 S8DI
A29S
DIA2
9R S18
S19
S20
S24
S25
S28
S14
S15
S22
S23
S26
S27
Preg
MPr
egEP
regA
EPre
gBTA
S0TA
S1TA
S2TA
S3TA
S4TA
S5TA
S6M
AS1
MAS
2M
AS3
MAS
4M
AS5
MAS
6M
AS7
MAS
8M
AS9
MAS
10M
AS11
MAS
12
ug/k
g
SAW-1709-3

19
Gold Creek Reference Site, Dec 2017, with hopane- or C-27-scaled source oil overlay.
0
1
2
3
4
5
6
7
DEC
DEC1
DEC2
DEC3
DEC4 BT
0BT
1BT
2BT
3BT
4 N0 N1 N2 N3 N4 BP DBF
ACY
ACN F F1 F2 F3
ANT
PHN
PA1
PA2
PA3
PA4
RET
DBT0
DBT1
DBT2
DBT3
DBT4
CARB FL
ABB
FPY
RFP
1FP
2FP
3FP
4NB
TNB
T1NB
T2NB
T3NB
T4BA
A C0 C1 C2 C3 C4 BBF
BJKF BA
FBE
PBA
PPE
R IPDA
HABG
HIP
ug/k
g
GOC-1712-1
TPAH4 Hopane0.83
0
0.05
0.1
0.15
0.2
0.25
0.3
0.35
0.4
0.45
C9 C10
C11
C12
C13
1380 C1
414
70 C15
C16
Npris C17
Pris
C18
Phy
C19
C20
C21
C22
C23
C24
C25
C26
C27
C28
C29
C30
C31
C32
C33
C34
C35
C36
C37
C38
C39
C40
mg/
kg
GOC-1712-1
TSHC1
0
1
2
3
4
5
6
7
8
9
10
T4 T5 T6 T6a
T6b
T6c T7 T8 T9 T10 Ts
TR30
aTR
30b
Tm 14a
14b
T15
T16
T17
T18 OL T19
T20
T21
T22
Gam
mT2
6T2
7T3
0T3
1T3
2T3
3T3
4T3
5 S4 S5 S8DI
A29S
DIA2
9R S18
S19
S20
S24
S25
S28
S14
S15
S22
S23
S26
S27
Preg
MPr
egEP
regA
EPre
gBTA
S0TA
S1TA
S2TA
S3TA
S4TA
S5TA
S6M
AS1
MAS
2M
AS3
MAS
4M
AS5
MAS
6M
AS7
MAS
8M
AS9
MAS
10M
AS11
MAS
12
ug/k
g
GOC-1712-1
0
0.5
1
1.5
2
2.5
3
3.5
4
4.5
DEC
DEC1
DEC2
DEC3
DEC4 BT
0BT
1BT
2BT
3BT
4 N0 N1 N2 N3 N4 BP DBF
ACY
ACN F F1 F2 F3
ANT
PHN
PA1
PA2
PA3
PA4
RET
DBT0
DBT1
DBT2
DBT3
DBT4
CARB FL
ABB
FPY
RFP
1FP
2FP
3FP
4NB
TNB
T1NB
T2NB
T3NB
T4BA
A C0 C1 C2 C3 C4 BBF
BJKF BA
FBE
PBA
PPE
R IPDA
HABG
HIP
ug/k
g
GOC-1712-2
TPAH2 Hopane0.604
0
0.1
0.2
0.3
0.4
0.5
0.6
C9 C10
C11
C12
C13
1380 C1
414
70 C15
C16
Npris C17
Pris
C18
Phy
C19
C20
C21
C22
C23
C24
C25
C26
C27
C28
C29
C30
C31
C32
C33
C34
C35
C36
C37
C38
C39
C40
mg/
kg
GOC-1712-2
TSHC1
0
1
2
3
4
5
6
7
8
9
T4 T5 T6 T6a
T6b
T6c T7 T8 T9 T10 Ts
TR30
aTR
30b
Tm 14a
14b
T15
T16
T17
T18 OL T19
T20
T21
T22
Gam
mT2
6T2
7T3
0T3
1T3
2T3
3T3
4T3
5 S4 S5 S8DI
A29S
DIA2
9R S18
S19
S20
S24
S25
S28
S14
S15
S22
S23
S26
S27
Preg
MPr
egEP
regA
EPre
gBTA
S0TA
S1TA
S2TA
S3TA
S4TA
S5TA
S6M
AS1
MAS
2M
AS3
MAS
4M
AS5
MAS
6M
AS7
MAS
8M
AS9
MAS
10M
AS11
MAS
12
ug/k
g
GOC-1712-2
0
1
2
3
4
5
6
DEC
DEC1
DEC2
DEC3
DEC4 BT
0BT
1BT
2BT
3BT
4 N0 N1 N2 N3 N4 BP DBF
ACY
ACN F F1 F2 F3
ANT
PHN
PA1
PA2
PA3
PA4
RET
DBT0
DBT1
DBT2
DBT3
DBT4
CARB FL
ABB
FPY
RFP
1FP
2FP
3FP
4NB
TNB
T1NB
T2NB
T3NB
T4BA
A C0 C1 C2 C3 C4 BBF
BJKF BA
FBE
PBA
PPE
R IPDA
HABG
HIP
ug/k
g
GOC-1712-3
TPAH2 Hopane0.756
0
0.1
0.2
0.3
0.4
0.5
0.6
0.7
C9 C10
C11
C12
C13
1380 C1
414
70 C15
C16
Npris C17
Pris
C18
Phy
C19
C20
C21
C22
C23
C24
C25
C26
C27
C28
C29
C30
C31
C32
C33
C34
C35
C36
C37
C38
C39
C40
mg/
kg
GOC-1712-3
TSHC1
0
1
2
3
4
5
6
7
8
T4 T5 T6 T6a
T6b
T6c T7 T8 T9 T10 Ts
TR30
aTR
30b
Tm 14a
14b
T15
T16
T17
T18 OL T19
T20
T21
T22
Gam
mT2
6T2
7T3
0T3
1T3
2T3
3T3
4T3
5 S4 S5 S8DI
A29S
DIA2
9R S18
S19
S20
S24
S25
S28
S14
S15
S22
S23
S26
S27
Preg
MPr
egEP
regA
EPre
gBTA
S0TA
S1TA
S2TA
S3TA
S4TA
S5TA
S6M
AS1
MAS
2M
AS3
MAS
4M
AS5
MAS
6M
AS7
MAS
8M
AS9
MAS
10M
AS11
MAS
12
ug/k
g
GOC-1712-3

20
Jackson Point Impact Site, Dec 2017, with hopane- or C-27-scaled source oil overlay.
0
1
2
3
4
5
6
7
DEC
DEC1
DEC2
DEC3
DEC4 BT
0BT
1BT
2BT
3BT
4 N0 N1 N2 N3 N4 BP DBF
ACY
ACN F F1 F2 F3
ANT
PHN
PA1
PA2
PA3
PA4
RET
DBT0
DBT1
DBT2
DBT3
DBT4
CARB FL
ABB
FPY
RFP
1FP
2FP
3FP
4NB
TNB
T1NB
T2NB
T3NB
T4BA
A C0 C1 C2 C3 C4 BBF
BJKF BA
FBE
PBA
PPE
R IPDA
HABG
HIP
ug/k
g
JAC-1712-1
TPAH4 Hopane0.924
0
0.1
0.2
0.3
0.4
0.5
0.6
C9 C10
C11
C12
C13
1380 C1
414
70 C15
C16
Npris C17
Pris
C18
Phy
C19
C20
C21
C22
C23
C24
C25
C26
C27
C28
C29
C30
C31
C32
C33
C34
C35
C36
C37
C38
C39
C40
mg/
kg
JAC-1712-1
TSHC1
0
1
2
3
4
5
6
7
8
9
T4 T5 T6 T6a
T6b
T6c T7 T8 T9 T10 Ts
TR30
aTR
30b
Tm 14a
14b
T15
T16
T17
T18 OL T19
T20
T21
T22
Gam
mT2
6T2
7T3
0T3
1T3
2T3
3T3
4T3
5 S4 S5 S8DI
A29S
DIA2
9R S18
S19
S20
S24
S25
S28
S14
S15
S22
S23
S26
S27
Preg
MPr
egEP
regA
EPre
gBTA
S0TA
S1TA
S2TA
S3TA
S4TA
S5TA
S6M
AS1
MAS
2M
AS3
MAS
4M
AS5
MAS
6M
AS7
MAS
8M
AS9
MAS
10M
AS11
MAS
12
ug/k
g
JAC-1712-1
0
1
2
3
4
5
6
DEC
DEC1
DEC2
DEC3
DEC4 BT
0BT
1BT
2BT
3BT
4 N0 N1 N2 N3 N4 BP DBF
ACY
ACN F F1 F2 F3
ANT
PHN
PA1
PA2
PA3
PA4
RET
DBT0
DBT1
DBT2
DBT3
DBT4
CARB FL
ABB
FPY
RFP
1FP
2FP
3FP
4NB
TNB
T1NB
T2NB
T3NB
T4BA
A C0 C1 C2 C3 C4 BBF
BJKF BA
FBE
PBA
PPE
R IPDA
HABG
HIP
ug/k
g
JAC-1712-2
TPAH4 Hopane0.738
0
0.1
0.2
0.3
0.4
0.5
0.6
C9 C10
C11
C12
C13
1380 C1
414
70 C15
C16
Npris C17
Pris
C18
Phy
C19
C20
C21
C22
C23
C24
C25
C26
C27
C28
C29
C30
C31
C32
C33
C34
C35
C36
C37
C38
C39
C40
mg/
kg
JAC-1712-2
TSHC1
0
1
2
3
4
5
6
7
8
9
10
T4 T5 T6 T6a
T6b
T6c T7 T8 T9 T10 Ts
TR30
aTR
30b
Tm 14a
14b
T15
T16
T17
T18 OL T19
T20
T21
T22
Gam
mT2
6T2
7T3
0T3
1T3
2T3
3T3
4T3
5 S4 S5 S8DI
A29S
DIA2
9R S18
S19
S20
S24
S25
S28
S14
S15
S22
S23
S26
S27
Preg
MPr
egEP
regA
EPre
gBTA
S0TA
S1TA
S2TA
S3TA
S4TA
S5TA
S6M
AS1
MAS
2M
AS3
MAS
4M
AS5
MAS
6M
AS7
MAS
8M
AS9
MAS
10M
AS11
MAS
12
ug/k
g
JAC-1712-2
0
0.5
1
1.5
2
2.5
3
3.5
4
4.5
DEC
DEC1
DEC2
DEC3
DEC4 BT
0BT
1BT
2BT
3BT
4 N0 N1 N2 N3 N4 BP DBF
ACY
ACN F F1 F2 F3
ANT
PHN
PA1
PA2
PA3
PA4
RET
DBT0
DBT1
DBT2
DBT3
DBT4
CARB FL
ABB
FPY
RFP
1FP
2FP
3FP
4NB
TNB
T1NB
T2NB
T3NB
T4BA
A C0 C1 C2 C3 C4 BBF
BJKF BA
FBE
PBA
PPE
R IPDA
HABG
HIP
ug/k
g
JAC-1712-3
TPAH2 Hopane0.581
0
0.05
0.1
0.15
0.2
0.25
0.3
0.35
0.4
C9 C10
C11
C12
C13
1380 C1
414
70 C15
C16
Npris C17
Pris
C18
Phy
C19
C20
C21
C22
C23
C24
C25
C26
C27
C28
C29
C30
C31
C32
C33
C34
C35
C36
C37
C38
C39
C40
mg/
kg
JAC-1712-3
TSHC1
0
1
2
3
4
5
6
7
8
9
10
T4 T5 T6 T6a
T6b
T6c T7 T8 T9 T10 Ts
TR30
aTR
30b
Tm 14a
14b
T15
T16
T17
T18 OL T19
T20
T21
T22
Gam
mT2
6T2
7T3
0T3
1T3
2T3
3T3
4T3
5 S4 S5 S8DI
A29S
DIA2
9R S18
S19
S20
S24
S25
S28
S14
S15
S22
S23
S26
S27
Preg
MPr
egEP
regA
EPre
gBTA
S0TA
S1TA
S2TA
S3TA
S4TA
S5TA
S6M
AS1
MAS
2M
AS3
MAS
4M
AS5
MAS
6M
AS7
MAS
8M
AS9
MAS
10M
AS11
MAS
12
ug/k
g
JAC-1712-3

21
Saw Island Impact Site, Dec 2017, with hopane- or C-27-scaled source oil overlay.
0
1
2
3
4
5
6
7
8
DEC
DEC1
DEC2
DEC3
DEC4 BT
0BT
1BT
2BT
3BT
4 N0 N1 N2 N3 N4 BP DBF
ACY
ACN F F1 F2 F3
ANT
PHN
PA1
PA2
PA3
PA4
RET
DBT0
DBT1
DBT2
DBT3
DBT4
CARB FL
ABB
FPY
RFP
1FP
2FP
3FP
4NB
TNB
T1NB
T2NB
T3NB
T4BA
A C0 C1 C2 C3 C4 BBF
BJKF BA
FBE
PBA
PPE
R IPDA
HABG
HIP
ug/k
g
SAW-1712-1
TPAH10 Hopane1.03
0
0.05
0.1
0.15
0.2
0.25
0.3
0.35
0.4
C9 C10
C11
C12
C13
1380 C1
414
70 C15
C16
Npris C17
Pris
C18
Phy
C19
C20
C21
C22
C23
C24
C25
C26
C27
C28
C29
C30
C31
C32
C33
C34
C35
C36
C37
C38
C39
C40
mg/
kg
SAW-1712-1
TSHC1
0
2
4
6
8
10
12
14
T4 T5 T6 T6a
T6b
T6c T7 T8 T9 T10 Ts
TR30
aTR
30b
Tm 14a
14b
T15
T16
T17
T18 OL T19
T20
T21
T22
Gam
mT2
6T2
7T3
0T3
1T3
2T3
3T3
4T3
5 S4 S5 S8DI
A29S
DIA2
9R S18
S19
S20
S24
S25
S28
S14
S15
S22
S23
S26
S27
Preg
MPr
egEP
regA
EPre
gBTA
S0TA
S1TA
S2TA
S3TA
S4TA
S5TA
S6M
AS1
MAS
2M
AS3
MAS
4M
AS5
MAS
6M
AS7
MAS
8M
AS9
MAS
10M
AS11
MAS
12
ug/k
g
SAW-1712-1
0
0.5
1
1.5
2
2.5
3
3.5
DEC
DEC1
DEC2
DEC3
DEC4 BT
0BT
1BT
2BT
3BT
4 N0 N1 N2 N3 N4 BP DBF
ACY
ACN F F1 F2 F3
ANT
PHN
PA1
PA2
PA3
PA4
RET
DBT0
DBT1
DBT2
DBT3
DBT4
CARB FL
ABB
FPY
RFP
1FP
2FP
3FP
4NB
TNB
T1NB
T2NB
T3NB
T4BA
A C0 C1 C2 C3 C4 BBF
BJKF BA
FBE
PBA
PPE
R IPDA
HABG
HIP
ug/k
g
SAW-1712-2
TPAH8 Hopane0.459
0
0.05
0.1
0.15
0.2
0.25
0.3
0.35
0.4
C9 C10
C11
C12
C13
1380 C1
414
70 C15
C16
Npris C17
Pris
C18
Phy
C19
C20
C21
C22
C23
C24
C25
C26
C27
C28
C29
C30
C31
C32
C33
C34
C35
C36
C37
C38
C39
C40
mg/
kg
SAW-1712-2
TSHC1
0
1
2
3
4
5
6
7
T4 T5 T6 T6a
T6b
T6c T7 T8 T9 T10 Ts
TR30
aTR
30b
Tm 14a
14b
T15
T16
T17
T18 OL T19
T20
T21
T22
Gam
mT2
6T2
7T3
0T3
1T3
2T3
3T3
4T3
5 S4 S5 S8DI
A29S
DIA2
9R S18
S19
S20
S24
S25
S28
S14
S15
S22
S23
S26
S27
Preg
MPr
egEP
regA
EPre
gBTA
S0TA
S1TA
S2TA
S3TA
S4TA
S5TA
S6M
AS1
MAS
2M
AS3
MAS
4M
AS5
MAS
6M
AS7
MAS
8M
AS9
MAS
10M
AS11
MAS
12
ug/k
g
SAW-1712-2
0
1
2
3
4
5
6
7
DEC
DEC1
DEC2
DEC3
DEC4 BT
0BT
1BT
2BT
3BT
4 N0 N1 N2 N3 N4 BP DBF
ACY
ACN F F1 F2 F3
ANT
PHN
PA1
PA2
PA3
PA4
RET
DBT0
DBT1
DBT2
DBT3
DBT4
CARB FL
ABB
FPY
RFP
1FP
2FP
3FP
4NB
TNB
T1NB
T2NB
T3NB
T4BA
A C0 C1 C2 C3 C4 BBF
BJKF BA
FBE
PBA
PPE
R IPDA
HABG
HIP
ug/k
g
SAW-1712-3
TPAH8 Hopane0.902
0
0.1
0.2
0.3
0.4
0.5
0.6
0.7
C9 C10
C11
C12
C13
1380 C1
414
70 C15
C16
Npris C17
Pris
C18
Phy
C19
C20
C21
C22
C23
C24
C25
C26
C27
C28
C29
C30
C31
C32
C33
C34
C35
C36
C37
C38
C39
C40
mg/
kg
SAW-1712-3
TSHC2
0
2
4
6
8
10
12
14
T4 T5 T6 T6a
T6b
T6c T7 T8 T9 T10 Ts
TR30
aTR
30b
Tm 14a
14b
T15
T16
T17
T18 OL T19
T20
T21
T22
Gam
mT2
6T2
7T3
0T3
1T3
2T3
3T3
4T3
5 S4 S5 S8DI
A29S
DIA2
9R S18
S19
S20
S24
S25
S28
S14
S15
S22
S23
S26
S27
Preg
MPr
egEP
regA
EPre
gBTA
S0TA
S1TA
S2TA
S3TA
S4TA
S5TA
S6M
AS1
MAS
2M
AS3
MAS
4M
AS5
MAS
6M
AS7
MAS
8M
AS9
MAS
10M
AS11
MAS
12
ug/k
g
SAW-1712-3
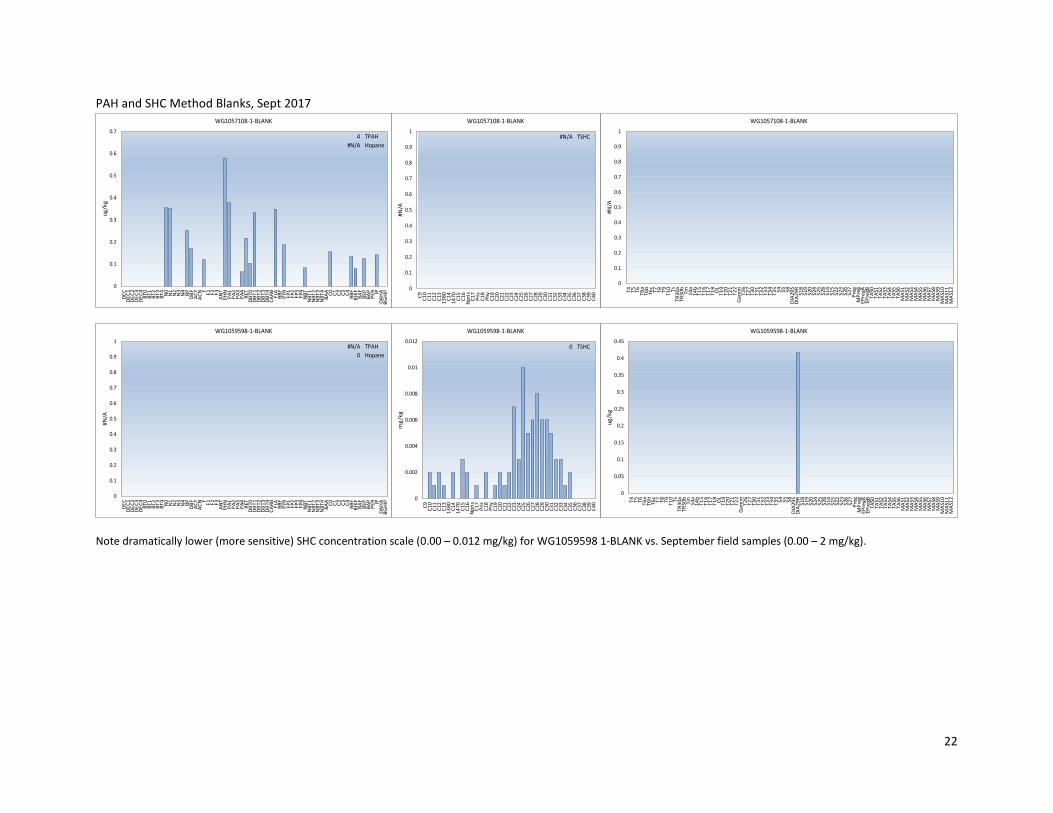
22
PAH and SHC Method Blanks, Sept 2017
Note dramatically lower (more sensitive) SHC concentration scale (0.00 – 0.012 mg/kg) for WG1059598 1-BLANK vs. September field samples (0.00 – 2 mg/kg).
0
0.1
0.2
0.3
0.4
0.5
0.6
0.7DE
CDE
C1DE
C2DE
C3DE
C4 BT0
BT1
BT2
BT3
BT4
N0
N1
N2
N3
N4 BP DBF
ACY
ACN F F1 F2 F3
ANT
PHN
PA1
PA2
PA3
PA4
RET
DBT0
DBT1
DBT2
DBT3
DBT4
CARB FL
ABB
FPY
RFP
1FP
2FP
3FP
4N
BTN
BT1
NBT
2N
BT3
NBT
4BA
A C0 C1 C2 C3 C4 BBF
BJKF BA
FBE
PBA
PPE
R IPDA
HA
BGH
IP
ug/k
g
WG1057108-1-BLANK
TPAH4 Hopane#N/A
0
0.1
0.2
0.3
0.4
0.5
0.6
0.7
0.8
0.9
1
C9 C10
C11
C12
C13
1380 C1
414
70 C15
C16
Npr
isC1
7Pr
isC1
8Ph
yC1
9C2
0C2
1C2
2C2
3C2
4C2
5C2
6C2
7C2
8C2
9C3
0C3
1C3
2C3
3C3
4C3
5C3
6C3
7C3
8C3
9C4
0
#N/A
WG1057108-1-BLANK
TSHC#N/A
0
0.1
0.2
0.3
0.4
0.5
0.6
0.7
0.8
0.9
1
T4 T5 T6 T6a
T6b
T6c T7 T8 T9 T10 Ts
TR30
aTR
30b
Tm 14a
14b
T15
T16
T17
T18 OL
T19
T20
T21
T22
Gam
mT2
6T2
7T3
0T3
1T3
2T3
3T3
4T3
5 S4 S5 S8DI
A29S
DIA2
9R S18
S19
S20
S24
S25
S28
S14
S15
S22
S23
S26
S27
Preg
MPr
egEP
regA
EPre
gBTA
S0TA
S1TA
S2TA
S3TA
S4TA
S5TA
S6M
AS1
MAS
2M
AS3
MAS
4M
AS5
MAS
6M
AS7
MAS
8M
AS9
MAS
10M
AS11
MAS
12
#N/A
WG1057108-1-BLANK
0
0.1
0.2
0.3
0.4
0.5
0.6
0.7
0.8
0.9
1
DEC
DEC1
DEC2
DEC3
DEC4 BT
0BT
1BT
2BT
3BT
4N
0N
1N
2N
3N
4 BP DBF
ACY
ACN F F1 F2 F3
ANT
PHN
PA1
PA2
PA3
PA4
RET
DBT0
DBT1
DBT2
DBT3
DBT4
CARB FL
ABB
FPY
RFP
1FP
2FP
3FP
4N
BTN
BT1
NBT
2N
BT3
NBT
4BA
A C0 C1 C2 C3 C4 BBF
BJKF BA
FBE
PBA
PPE
R IPDA
HA
BGH
IP
#N/A
WG1059598-1-BLANK
TPAH#N/AHopane0
0
0.002
0.004
0.006
0.008
0.01
0.012
C9 C10
C11
C12
C13
1380 C1
414
70 C15
C16
Npr
isC1
7Pr
isC1
8Ph
yC1
9C2
0C2
1C2
2C2
3C2
4C2
5C2
6C2
7C2
8C2
9C3
0C3
1C3
2C3
3C3
4C3
5C3
6C3
7C3
8C3
9C4
0
mg/
kg
WG1059598-1-BLANK
TSHC0
0
0.05
0.1
0.15
0.2
0.25
0.3
0.35
0.4
0.45
T4 T5 T6 T6a
T6b
T6c T7 T8 T9 T10 Ts
TR30
aTR
30b
Tm 14a
14b
T15
T16
T17
T18 OL
T19
T20
T21
T22
Gam
mT2
6T2
7T3
0T3
1T3
2T3
3T3
4T3
5 S4 S5 S8DI
A29S
DIA2
9R S18
S19
S20
S24
S25
S28
S14
S15
S22
S23
S26
S27
Preg
MPr
egEP
regA
EPre
gBTA
S0TA
S1TA
S2TA
S3TA
S4TA
S5TA
S6M
AS1
MAS
2M
AS3
MAS
4M
AS5
MAS
6M
AS7
MAS
8M
AS9
MAS
10M
AS11
MAS
12
ug/k
g
WG1059598-1-BLANK

23
PAH and SHC Method Blanks, Dec 2017
Note lower SHC (more sensitive) concentration scale (0.00 – 0.025 mg/kg) for WG1078906-1-BLANK vs. December field samples (0.00 – 0.7 mg/kg).
0
0.1
0.2
0.3
0.4
0.5
0.6
0.7
0.8
0.9DE
CDE
C1DE
C2DE
C3DE
C4 BT0
BT1
BT2
BT3
BT4
N0
N1
N2
N3
N4 BP DBF
ACY
ACN F F1 F2 F3
ANT
PHN
PA1
PA2
PA3
PA4
RET
DBT0
DBT1
DBT2
DBT3
DBT4
CARB FL
ABB
FPY
RFP
1FP
2FP
3FP
4N
BTN
BT1
NBT
2N
BT3
NBT
4BA
A C0 C1 C2 C3 C4 BBF
BJKF BA
FBE
PBA
PPE
R IPDA
HA
BGH
IP
ug/k
g
WG1077170-1-BLANK
TPAH3 Hopane#N/A
0
0.1
0.2
0.3
0.4
0.5
0.6
0.7
0.8
0.9
1
C9 C10
C11
C12
C13
1380 C1
414
70 C15
C16
Npr
isC1
7Pr
isC1
8Ph
yC1
9C2
0C2
1C2
2C2
3C2
4C2
5C2
6C2
7C2
8C2
9C3
0C3
1C3
2C3
3C3
4C3
5C3
6C3
7C3
8C3
9C4
0
#N/A
WG1077170-1-BLANK
TSHC#N/A
0
0.1
0.2
0.3
0.4
0.5
0.6
0.7
0.8
0.9
1
T4 T5 T6 T6a
T6b
T6c T7 T8 T9 T10 Ts
TR30
aTR
30b
Tm 14a
14b
T15
T16
T17
T18 OL
T19
T20
T21
T22
Gam
mT2
6T2
7T3
0T3
1T3
2T3
3T3
4T3
5 S4 S5 S8DI
A29S
DIA2
9R S18
S19
S20
S24
S25
S28
S14
S15
S22
S23
S26
S27
Preg
MPr
egEP
regA
EPre
gBTA
S0TA
S1TA
S2TA
S3TA
S4TA
S5TA
S6M
AS1
MAS
2M
AS3
MAS
4M
AS5
MAS
6M
AS7
MAS
8M
AS9
MAS
10M
AS11
MAS
12
#N/A
WG1077170-1-BLANK
0
0.1
0.2
0.3
0.4
0.5
0.6
0.7
0.8
0.9
1
DEC
DEC1
DEC2
DEC3
DEC4 BT
0BT
1BT
2BT
3BT
4N
0N
1N
2N
3N
4 BP DBF
ACY
ACN F F1 F2 F3
ANT
PHN
PA1
PA2
PA3
PA4
RET
DBT0
DBT1
DBT2
DBT3
DBT4
CARB FL
ABB
FPY
RFP
1FP
2FP
3FP
4N
BTN
BT1
NBT
2N
BT3
NBT
4BA
A C0 C1 C2 C3 C4 BBF
BJKF BA
FBE
PBA
PPE
R IPDA
HA
BGH
IP
#N/A
WG1078906-1-BLANK
TPAH#N/AHopane0
0
0.005
0.01
0.015
0.02
0.025
C9 C10
C11
C12
C13
1380 C1
414
70 C15
C16
Npr
isC1
7Pr
isC1
8Ph
yC1
9C2
0C2
1C2
2C2
3C2
4C2
5C2
6C2
7C2
8C2
9C3
0C3
1C3
2C3
3C3
4C3
5C3
6C3
7C3
8C3
9C4
0
mg/
kg
WG1078906-1-BLANK
TSHC0
0
0.02
0.04
0.06
0.08
0.1
0.12
0.14
T4 T5 T6 T6a
T6b
T6c T7 T8 T9 T10 Ts
TR30
aTR
30b
Tm 14a
14b
T15
T16
T17
T18 OL
T19
T20
T21
T22
Gam
mT2
6T2
7T3
0T3
1T3
2T3
3T3
4T3
5 S4 S5 S8DI
A29S
DIA2
9R S18
S19
S20
S24
S25
S28
S14
S15
S22
S23
S26
S27
Preg
MPr
egEP
regA
EPre
gBTA
S0TA
S1TA
S2TA
S3TA
S4TA
S5TA
S6M
AS1
MAS
2M
AS3
MAS
4M
AS5
MAS
6M
AS7
MAS
8M
AS9
MAS
10M
AS11
MAS
12
ug/k
g
WG1078906-1-BLANK