september 2020 issn: 1993-8233 doi: 10.5897/ajbm www
TRANSCRIPT

September 2020ISSN: 1993-8233
DOI: 10.5897/AJBMwww.academicjournals.org
O P EN A C C ESS
African Journal of
Business Management
About AJBM
The African Journal of Business Management (AJBM) is a peer reviewed open access journal. The
journal commenced publication in February 2007 as a monthly publication. The scope of the journal
covers all areas of business and management research. The journal welcomes submission of full-
length research articles, short communications and review articles. In addition, the journal also
welcomes letters and commentaries to the editor. Please see Instruction for Authors for complete
details. The journal is currently published monthly. Please see journal archive for all past issues or
see all published articles
Indexing
CNKI Scholar, Economics and Business Studies Database, Google Scholar, IBZ Online Database
Microsoft Academic, ResearchGate
Open Access Policy
Open Access is a publication model that enables the dissemination of research articles to the global
community without any form of restriction. All articles published under open access can be accessed
by anyone with internet connection.
The African Journal of Business Management is an Open Access journal. Abstracts and full texts of
all articles published in this journal are freely accessible to everyone immediately after publication
without any form of restriction.
Article License
All articles published by the African Journal of Business Management are licensed under the
Creative Commons Attribution 4.0 International License. This permits anyone to copy, redistribute,
remix, transmit and adapt the work provided the original work and source is appropriately cited.
Citation should include the article’s DOI. The article license is displayed both on the abstract page
and the full-text PDF of each article.
This article is published under the terms of the Creative Commons Attribution License 4.0
Please refer to https://creativecommons.org/licenses/by/4.0/legalcode for details about Creative
Commons Attribution License 4.0
Article Copyright
When an article is published in the journal, the author(s) of the article retain the copyright. Author(s)
may republish the article as part of a book or other materials.
A copyright statement is displayed both on the abstract page and the full-text PDF of each article.
Example: Copyright ©2016 Author(s) retains the copyright of this article.
Please see SHERPA/RoMEO
Self-Archiving Policy
In addition, the journal permits and encourages authors to archive the published version of their
articles on their institutional repositories and as well as other appropriate websites.
Please see Portico, SHERPA/RoMEO and The Keepers Registry
Digital Archiving Policy
The African Journal of Business Management is committed to the long-term preservation of its
content. All articles published by the journal are preserved by Portico.
Metadata Harvesting
The African Journal of Business Management encourages metadata harvesting of all its content.
The journal fully supports the Open Archives Initiative.

Memberships and Standards
Academic Journals strongly supports the Open Access initiative. Abstracts and full texts of all
articles published by Academic Journals are freely accessible to everyone immediately after
publication.
All articles published by Academic Journals are licensed under the Creative Commons Attribution
4.0 International License (CC BY 4.0). This permits anyone to copy, redistribute, remix, transmit and
adapt the work provided the original work and source is appropriately cited.
Crossref is an association of scholarly publishers that developed Digital Object Identification (DOI)
system for the unique identification published materials. Academic Journals is a member of Crossref
and uses the DOI system. All articles published by Academic Journals are issued DOI.
Similarity Check powered by iThenticate is an initiative started by CrossRef to help its members
actively engage in efforts to prevent scholarly and professional plagiarism. Academic Journals is a
member of Similarity Check.
CrossRef Cited-by Linking (formerly Forward Linking) is a service that allows you to discover how
your publications are being cited and to incorporate that information into your online publication
platform. Academic Journals is a member of CrossRef Cited-by.
Academic Journals is a member of the International Digital Publishing Forum (IDPF).
The IDPF is the global trade and standards organization dedicated to the
development and promotion of electronic publishing and content consumption.

Contact
Editorial Office: [email protected]
Help Desk: [email protected]
Website: http://www.academicjournals.org/journal/AJBM
Submit manuscript online http://ms.academicjournals.org
Academic Journals 73023 Victoria Island, Lagos, Nigeria
ICEA Building, 17th Floor, Kenyatta Avenue, Nairobi, Kenya.

Editors
Prof. João J. M. Ferreira Department of Management and Economics University of Beira Interior (UBI), 6200-209 Covilhã, Portugal. Dr. Amran Awang Faculty of Business Management, 02600 Arau, Perlis, Malaysia. Dr. Nebojsa Pavlovic Faculty of Hotel and Tourism University of Kragujevac, Kragujevac Serbia.
Editorial Board Members
Dr. Elisa Menicucci Department of Business Studies University of Roma Tre, Italy. Dr. Werbin Eliana Mariela Department of Accounting National University of Cordoba, Argentina. Dr. Aktham AlMaghaireh United Arab Emirates University Department of Economics & Finance United Arab Emirates. Prof. Simone Poli Department of Management, Università Politecnica delle Marche, Italy. Dr. Haretsebe Manwa Tourism Department Faculty of Human and Social Sciences North West University Private Bag X 2046 Mmabatho 2735, South Africa.
Dr. Reza Gharoie Ahangar Islamic Azad University of Babol, Iran. Dr. Sérgio Dominique Ferreira Polytechnic Institute of Cavado and Ave Campus IPCA, Lugar does Aldão, 4750-810. Vila Frescainha, Portugal. Prof. Ravinder Rena Department of Economics University of the Western Cape Private Bag: X17 Modderdam Road Bellville 7535 Cape town, South Africa Dr. Shun-Chung Lee Taiwan Institute of Economic Research No. 16-8, Dehuei Street, Jhongshan District, Taipei City 104, Taiwan. Dr. Gregory J. Davids University of the Western Cape Private Bag x17, Bellville 7535, South Africa. Dr. Maurice Oscar Dassah School of Management, IT and Governance University of KwaZulu-Natal Post Office Box X54001 Durban 4000 South Africa. Prof. Joseph Offiong Udoayang University of Calabar P.M.B 1115, Calabar. Cross River State, Nigeria. Prof. Robert Taylor University of KwaZulu-Natal Varsity Drive, Westville South Africa. Dr. Izah Mohd Tahir Universiti Sultan Zainal Abidin Gong Badak Campus, 21300 Kuala Terengganu, Malaysia.

Dr. V. Mahalakshmi Panimalar Engineering College 7-A,CID Quarters, Mandaveli,Chennai-600028, Tamilnadu, India Dr. Ata Allah Taleizadeh Iran University of Science and Technology Faculty of Industrial Engineering, Iran University of Science and Technology, Narmak, Tehran, Iran. Dr. José M. Merigó University of Barcelona Department of Business Administration, Av. Diagonal 690, Spain. Dr. Anton Sorin Gabriel Carol I Boulevard, No. 11, 700506, Iasi, Alexandru Ioan Cuza University Iasi, Romania. Dr. Aura Emanuela Domil 31 Horia Creanga, zip code 300253, Timisoara West University from Timisoara Faculty of Economics and Business Administration, Romania. Dr. Guowei Hua NO. 3 Shangyuancun, Haidian District, Beijing 100044, School of Economics and Management, Beijing Jiaotong University, China. Dr. Mehdi Toloo Technical University of Ostrava Ostrava, Czech Republic. Dr. Surendar Singh Department of Management Studies, Invertis University Invertis village, Bareilly - Lucknow Highway, N.H.-24, Bareilly (U.P.) 243 123, India. Dr. Colin J. Butler University of Greenwich Business School, University of Greenwich, Greenwich, SE10 9LS, London, UK.
Dr. Colin J. Butler University of Greenwich Business School, University of Greenwich, Greenwich, SE10 9LS, London, UK. Prof. Dev Tewari School of Economics and Finance Westville Campus University of Kwa-Zulu Natal (UKZN) Durban, 4001, South Africa. Dr. Paloma Bernal Turnes Universidad Rey Juan Carlos Dpto. Economía de la Empresa Pº de los Artilleros s/n Edif. Departamental, Desp. 2101 28032 Madrid, España. Dr. Jurandir Peinado Universidade Positivo Rua Silveira Peixoto, 306 Zip 80240-120 Curitiba – PR – Brazil. Dr. Abdelaziz Hakimi Management, Faculty of Law, Economics and Management of Jendouba, Tunisia. Dr. Henrique Reis Economics and Management, Higher School of Management - IPS, Portugal. Dr. Obed Ligate Independent researcher, University of North America (Alumni), United States. Dr. Roberto Bruni Department of Economics and Law, University of Cassino and Southern Lazio, Italy. Dr. Svetlana Saksonova Faculty of Management and Economics, University of Latvia, Latvia. Dr. Gaetano Matonti Faculty of Management and Economics, University of Latvia, Latvia.

Table of Content
Manifestation of emotional intelligence and Transformational leadership in virtual teams: Case study of Nairobi technology hub Lucas Ngigi Mburu
258
Social media, business capabilities and performance: A review of literature Mohammedhussen Mama Irbo and Abdulnasir Abdulmelike Mohammed
271
Co-operative and saving societies (SACCOS) and poverty reduction in Lango and Kigezi sub-regions of Uganda: A comparative empirical study Marus Eton, Benon C. Basheka and Fabian Mwosi
278
The impact of leadership styles on employee commitment in Madda Walabu University Tafesse Akinida Biza and Mohammedhussen Mama Irbo
291
Is a woman’s name worthless? An experiment related to the gender wage gap Thorlakur Karlsson, Margret Jonsdottir Njardvik and Holmfridur Vilhjalmsdottir
301

Vol. 14(9), pp. 258-270, September, 2020
DOI: 10.5897/AJBM2020.9026
Article Number: 101974A64691
ISSN: 1993-8233
Copyright© 2020
Author(s) retain the copyright of this article
http://www.academicjournals.org/AJBM
African Journal of Business Management
Full Length Research Paper
Manifestation of emotional intelligence and Transformational leadership in virtual teams: Case
study of Nairobi technology hub
Lucas Ngigi Mburu
Leadership Department, School of Business, Pan Africa Christian University, Kenya.
Received 22 April, 2020; Accepted 21 August, 2020
The dynamic nature of business and organizational operations in the 21st century as being influenced by tough economic times, globalization and need for higher effectiveness is forcing leaders to adopt more relevant approaches to management. One such adaptation is the use of virtual teams for international organization that have globally distributed offices and functions. This study provides insights into the role of emotional intelligence and leadership skills necessary for ensuring individual success and team effectiveness in a virtual team within Save the Children. The research followed a descriptive design utilizing non-probability sampling and data collected using online questionnaire where both open ended and structured questions were used. The main themes being assessed were manifestation of emotional intelligence in a virtual team and the relevance of transformational leadership skills in leading such teams. The study reveals significant presence of skills associated with emotional intelligence like self-awareness, empathy and social intelligence. There is also evidence that the individual members of the team under study have common expectations on the leadership skills required for successful management of a virtual team. Key words: Emotional intelligence, leadership, virtual teams, globalization.
INTRODUCTION With increased need for high efficiency and low cost of running operations, many organizations are being forced to explore innovative ways of remaining relevant and competitive. While non-governmental organizations (NGOs) are not primarily focused on making profits, being able to deliver quality programs at low cost remains a key area of focus. Some of the options being considered include use of virtual teams in strategic locations around the world, an idea being made possible
through use of advanced technology and effective leadership.
According to Gazor (2012), there are several problems that virtual teams face including ineffective communication, broken trust among members and with leadership especially and intercultural differences. On the other hand, numerous opportunities arise because of this strategic approach in using virtually distributed teams.
Global companies are using virtual teams to cut
Email: [email protected]. Tel: +254717969601.
Author(s) agree that this article remain permanently open access under the terms of the Creative Commons Attribution
License 4.0 International License

operational costs, as they are quick, agile and less costly to run as opposed to traditional teams concentrated in a single physical location. Ivancevich et al. (1990) offers that, times are changing and many organizations even in America are shifting away from traditional manufacturing oriented to service and knowledge based approach. In times such as these, work in 21st century organizations is best done through cross-functional and effective virtual teams. Statement of the problem In trying to establish the role of emotional intelligence on organizational effectiveness, the researcher undertook a study focusing on Nairobi Technology Hub, a unit under global IT department at Save the Children International. The technology hub was the only one of its kind within the entire organization at the time of this study and there were plans to set up other hubs in different parts of the world in future. Knowledge gathered from this research will be helpful in prepositioning leadership to support the setup of new hubs not just for Save the Children, but the aid sector in general. This will be by applying lessons learnt, adopting best practices relating to emotional intelligence and hiring of both effective employees and leaders. Purpose of the study The issue of virtual teams is relatively new in Kenya and specifically within the NGO sector which therefore calls for a process to examine the existing challenges and opportunities. Exploring how emotional intelligence and effective leadership work together to maximize the benefits of virtual teams and increase staff engagement is the focus of this research. Objectives of the study (i) To examine the significance of emotional intelligence on the success of virtual teams. (ii) To establish if individual team members have a common view on leadership qualities required in virtual teams. (iii) To explain the role of social intelligence in virtual teams. Research questions (i) How does emotional intelligence contribute to the success of virtual teams. (ii) What are the common leadership qualities desired in virtual teams.
Mburu 259 (iii) What is the role of social intelligence in globally distributed teams. Significance of the study There is scanty information on researches done in Kenya with specific regard to virtual teams run by international humanitarian organizations. Another reason that makes this study significant to Save the Children and other NGOs is that the virtual unit in Nairobi was at the time of research the only one under global IT structure though plans to establish similar units elsewhere were in the process. Data from this study would therefore be critical in informing the leadership of certain characteristics that will likely lead to success in other hubs from the point of knowledge as opposed to assumed perspectives. Scope of the study
The study aimed to establish the role of emotional intelligence in identifying challenges and opportunities that are experienced in virtual teams and targeting staff from Nairobi Technology Hub at Save the Children in Kenya. The area of coverage was Kenya Country Office headquarters in Nairobi where the technology hub is located. The total number of staff in the technology hub as at the time of this study was 24 and coming from diverse backgrounds, cultures, and mixed gender and all were reached out to for data collection.
Limitations of the study
It was envisioned that few challenges and limitations would be encountered during the study and these included but not limited to the following:
i) Some staff members not being able to take the surveys due to Internet link challenges at the time of filling in the survey. ii) It was also anticipated that some members of the technology hub would fail to fill in the survey if the timing found them on travel or in other work engagements outside the office. iii) The resources constraints in time required to carry out the study were insufficient and therefore made the choice of using online survey that reached as many staff as possible and with minimal cost.
Delimitations
The study did not cover general IT staff working for Save the Children offices in Nairobi due to the fact that the organizational structure for the technology hub recognizes the staff under it as part of the extended team

260 Afr. J. Bus. Manage. headquartered in London. While Kothari (2004) recommends the use of pilot studies when conducting questionnaires to test effectiveness, this study did not factor in the pilot process. This was due to limited time available to complete the study and the fact that the use of online survey makes it easy for respondents to answer closed questions based on Likert’s scale. Assumptions of the study This study presupposed that the following would be the case: (i) Willingness by the staff to respond to the survey questions without coercion; ii) That the staff would be honest in their responses; iii) Reliable connectivity sufficient to allow for online surveys to be filled.
LITERATURE REVIEW Regarding virtual teams, how they operate, their impact on effectiveness and how leadership styles affect them, Morley et al. (2015) offers that they are workgroups whose members are distributed across diverse geographical regions and organizational boundaries. They often undertake their activities using technology-assisted approaches and that partly is what enables them to execute their mission. It can then be argued that, one of the main characteristics of virtual teams is their ability to access and use technologies like the Internet and related collaboration tools as a means of communication. Indeed Morley et al. (2015) notes that despite a number of research on virtual teams and how they work, there seems to be no guide on how to implement and manage virtual teams. Nature of virtual teams There has been an increased interest to understand virtual teams and this has been necessitated by changing context in many organizations especially driven by globalization. Lilian (2014) notes that in globalized world with constant technological changes, leaders are faced with both opportunities and challenges in the course of trying to attain their goals. Some of the changes that leaders have to make include restructuring functions, redesigning organograms from hierarchical to flat or flexible ones. Clark and Polesello (2017) agree with this view by observing that globalization, immigration and technological changes have resulted in increased diversity in organizations and as a result, new demands in the workplace are encountered.
According to Germaine and McGuire (2014), policies and structures, cultural consideration, management
support, rewards and offering training to both leaders and workers during initial setup are some of the requirements for supporting virtual teams. Duran and Popescu (2014) add that information technology helps in the initial setup of virtual teams as they offer new working styles. Some of the areas in which virtual teams focus on include research, learning and development, knowledge management and marketing among others. Morley et al. (2015) suggests that given virtual teams operate differently from face to face setup, technology plays a key role in enabling communication and collaboration with people in diverse locations.
In this regard, Guinalíu and Jordan (2016) contends that due to the temporary and spatial distribution of members in virtual teams and the fundamental use of technology as the medium of communication, it is possible to work anywhere and anytime. Additionally, it makes it possible to hire the best talent irrespective of where they are thereby encouraging flexibility, creativity and encouraging knowledge sharing among members. This perspective is also supported by Clark and Polesello (2017) who notes that diversity in teams brings positive outcomes like innovation, and competitive edge. The individuals in virtual teams according to Pitts et al. (2012) communicate using computer technology and tools like chats, email and conferencing in order to achieve their work objectives. To add to the above observation, Pitts et al. (2012) note that due to lack of face to face cues for non-verbal communication, effectiveness of exchanging information mostly depend upon the individual emotional intelligence skills. This implies that such intelligence and social awareness play a major role in ensuring effective commitment in a virtual team. The inability to use face to face human aspects lowers the quality of communication in teams which eventually affects the performance of both individual staff and their respective teams.
Role of emotional intelligence in virtual teams
One of the fundamental questions in this context of intelligence would be to ask whether success in leadership is defined more by IQ or EQ. To answer this question, Goleman (2013) notes that they both matter. However, use of IQ is usually limited to categorizing people into various careers based on their mental capability but once they get into the professions, intellectual ability becomes less of a predictor for success. Goleman further adds that emotional intelligence skills like how well we manage our emotions and relationships with other people; helps distinguish high performers in organizations. Riggio and Reichard (2008) emphasize the importance of EQ by noting that it is a critical element of effective leadership. Batool (2013) reports that, leaders who have mastered most of the aspects of emotional intelligence consistently outperform their peers. In this regard, Hejase et al. (2017) adds that it is important to emphasize how managers can use EI to

get better performance and increase staff motivation.
Research by Brackett et al. (2011) indicates that emotional intelligence includes ability to identify emotions accurately and to use it for cognitive processes like reasoning, problem solving and interpersonal communication. In addition, Oginde (2011) also notes that leaders must have the ability to listen intelligently to those with whom they work, a skill that leads to positive impact on individuals and teams. On whether emotional intelligence leads to success or failure, Hess and Basigalupo (2013) offers that both aspiring and established leaders agree that behaviors related to emotional intelligence are characteristic of effective leaders. The effect of these behaviors is an influence on future leaders towards being more successful and Gupta and Bajaj (2017) supports this by suggesting that leader’s EI facilitates a conducive climate that promotes creativity.
Such behaviors according to Oginde (2011) include having room for opinions of others, providing space for innovation and encouraging positive feedback. This is further supported by Riggio and Reichard (2008) who noted that through training, accurate assessment of information and constructive feedback, emotional and social skills of leaders can be improved. In making reference to research, Kumar (2014) notes that when two groups with identical IQ are compared, the one with higher levels of EQ tends to outperform the one with low levels. This goes to show that emotional intelligence does have an impact on the life of a leader especially when issues of performance and effectiveness are concerned.
Specifically within the context of NGOs, Hess and Bacigalupo (2013) notes that consideration for emotional intelligence skills should be part of development strategy for leaders as it helps in assessing the impact of their decisions. Additionally, the skills also help in improving the quality and effectiveness of decision making process. According to Quisenberry (2018), managing teams has never been an easy task and with the virtual teams, it is even harder. Further, it is noted from research that employees with higher EQ tend to have the ability to perform at higher levels in team environments. According to Prati et al. (2003), emotional intelligence has a positive effect on relationship management, self-awareness, motivation and empathy, all of which contributes to team cohesion.
In regards to performance, Goleman (2013) indicates that professionally successful people have a high emotional intelligence in addition to their cognitive intelligence or specialized knowledge. To support the point on social skills, Goleman notes that managers who do not improve their emotional intelligence have difficulties building relationships with peers, juniors and even clients. Kannaiah and Shanthi (2015) suggest that team building is an on-going process that helps a group to evolve into a cohesive team. Members share task expectations, support and trust one another while respecting their individual differences.
Mburu 261 Hess and Bacigalupo (2013) observe that a lot of
research focus on theoretical explanations of the role of emotional intelligence and there is a gap in practical application of these skills in decision generally and more specifically by decision makers in the NGO sector. Quisenberry (2018) suggests that when checking to see if a potential staff member will be a good fit within a self-managed virtual team, use of emotional intelligence assessment can be a good tool. Kannaiah and Shanthi (2015) add that many people are disconnected from their emotions especially strong ones like anger, fear, sadness and joy. Unfortunately, unless people understand their emotions and how they affect others, they may not be able to have effective communication especially within the work setting.
On empathy, Nauman et al. (2006) suggests that members of different cultures may have different norms, values and beliefs that may lead to misunderstanding. It is therefore critical for one to respect those from different backgrounds, perspectives and seeing diversity as an opportunity is part emotional intelligence. Kannaiah and Shanthi (2015) note that empathy is the ability to sense other’s emotions, understanding their perspectives, and showing active interests in their concerns. Hess and Bacigalupo (2013) additionally observe that in settings where social and psychological expertise is relied upon, influence is best brought out through demonstration of empathy and compassion. How leadership affects virtual teams effectiveness Suggestions by Guinaliu and Jordan (2016) show that team management is a key factor in determining the success of an organization. According to Ambrose et al. (2009), there is a lot of research on traditional leadership but the applicability of the theories on virtual settings require a more in-depth research. Kannaiah and Shanthi (2015) offer that optimism is a culture that is nurtured by the leadership, sustained by everyone and it is powerfully motivational. It is the tendency to look at the bright side of things and expecting the best out of every situation. Furthermore, Lilian (2014) notes that leaders make a critical difference in the performance of teams and they motivate virtual team members to be flexible enough to respond to changing environments. This allows for adoption of adaptable working arrangement, use of latest knowledge and consideration for latest technologies.
Inspiration and motivation are some of the key factors that make leaders effective in leading teams and according to Savel and Munro (2016), as people move up the career ladder; they need to keep up the passion while learning to moderate our emotions. In addition, leaders should have a comprehensive understanding of their emotions and an ability to assess those of others in order to know when to motivate them. Goleman (2013) suggests that managers need to check their moods
262 Afr. J. Bus. Manage. because how they feel ultimately influences the way they communicate with others. Additionally, general mood does affect communication effectiveness in teams and this in turn influences the performance of an organization.
Transformation leaders as observed by Gomes (2014), impact others by introducing changes in their social and work environments, while also influencing the values and behaviour of their followers. Indeed, leadership definitions emphasize on the key role of leaders as being to influence others. In this regard, when organizations are dealing with competition, reduced resources and other challenges, leaders play a critical role in ensuring survival. Lilian (2014) notes the main reason virtual teams are formed is to overcome geographical limitations, cut costs in time, travel and office space. Virtual teams also help in unifying functions within a global organization while at the same time, providing opportunities to recruit people with the right skills across regions.
According to Bass et al. (2003), transformational leadership involves influencing, inspiring, motivating and mentally stimulating others. It is about leaders describing the goals to their followers in an attractive and convincing manner. Morales et al. (2008) add that transformational leaders influence the fundamental attitudes and assumptions of organization’s members, thus creating a common mentality of achieving the set goals. Furthermore, they suggest that such leaders manage organizations as a system where information and knowledge flows especially in the context of knowledge driven economies.
Another important observation on transformational leadership is by Chou et al. (2013) who notes that a team leader plays a central role in determining the performance of a group. This is the kind of leadership that creates valuable and positive changes in the lives of followers. This may happen through trust in leadership and a sense of collective efficacy which are critical success factors for leadership. Trust in this case is applicable to both the leader and colleagues leading to increased team engagement and cooperative behaviors. Moynihan et al. (2011) in their research discovered that indeed leadership matters in relation to performance but there are still gaps in determining how that happens. This observation is in part the reason for this exploratory study where in particular, the author intended to establish what other studies have discovered in relation to transformational leadership.
In his studies, Hogue (2015) citing Burns (1978) notes that transformational leadership focuses on uplifting the morale of employees and is firmly grounded on morals. This differs with transactional style, which mainly pays attention to exchange of work mainly for self-interests. He suggests that transformational leadership seeks to change organizational culture and influences values by going beyond rewards and incentives. In support of this view, Ahmad et al. (2014) observe that motivation is a
factor that internally and externally cause someone to enthusiastically engage in acts that lead to desired outcomes. Leadership style in this regard contributes a great deal in making it possible for employees to have that enthusiasm while executing work.
According to Morales et al. (2008), transformational leadership usually affect innovative behavior positively. This observation therefore connects well with the very objective of this study where upon the presumption is that leadership style influences performance and effectiveness of virtual teams and by extension, an expectation to be innovative. Ahmad et al. (2014) agrees with this perspective by adding that transformational leaders motivate staff in new ways, making them think creatively and encouraging good decision-making. Bosch (2013) indicates that transformational leadership encourages employees to solve problems independent of their leader and they constantly challenge them to interrogate their value system. Bass et al. (2003) concurs with this view by adding that leaders emphasize the importance of values at work and in regards to innovation, they allow staff to brainstorm on issues without criticism for mistakes. This approach allows individual perspectives to be captured while promoting active participation by all. Challenges and opportunities with virtual teams According to Gazor (2012), activities of most organizations have increasingly become more global and with competition from both local and international markets, the focus is now shifting from production towards service. Nydegger and Nydegger (2010) adds to this by noting that indeed many organizations are struggling and as such, trying to find new innovative ways of remaining competitive and efficient. In such situations then, consideration for use of information technologies becomes necessary. Guinalíu and Jordan (2016) notes that as a result of the advanced nature of these emerging technologies, organizations find solace in adopting them in order to allow for flexibility. The end result being that knowledge is created and shared with ease, and more skills built within virtual teams without the limitation of distances.
Integrating technology in management practices is one way of increasing efficiency and effectiveness in organizations. Based on research conducted in Sweden, Ask et al. (2012) observe that enterprise information systems like ERPs are the backbone of organizational value creation process but alone they are not enough to guarantee efficiency. As such, Hejase et al. (2014) offers that knowledge sharing is equally an important factor for consideration. Siebers et al. (2008) support this notion by observing that operational management focuses on systems like ICT, total quality management and lean production practices among other factors to increase

efficiency. However, Dube and Marnewick (2016) offers that even though there has been an increased interest in virtual project teams, there is not much data that shows how such team’s performance can be improved.
In order to promote creativity, Dul and Ceylan (2011) suggests that, organizations should set the right work environment and avoid limiting employees to strict regulations, formal structures, and routine tasks otherwise they will not be stimulated enough. Cekmecelioglu and Gunsel (2013) agree with this idea by suggesting that work climate has the potential to enhance or curtail innovativeness besides the characteristics of individual workers. Serrat (2017) adds that through communities of practice enabled by communications technologies, employees are offered collaborative opportunities to share ideas and experience intellectual challenges while fostering mutual trust. Technology as noted by Lilian (2014) allows staff from various units, functions, cultures and regions of the world to share ideas and exchange information on new technologies and best practices.
According to Guinalíu and Jordan (2016), virtual teams allow for various project phases to be relocated across regions while ensuring that members remain connected to the project progress irrespective of their geographical locations. Lilian (2014) supports this view but adding that communication technologies have enabled creation of new mechanisms of coordinating work, encouraging collaboration and good work practices. As suggested by Olariu and Aldea (2014), a business process management is a set of methods, tools and technologies used to design and control operational business processes. The process helps in interrelating tasks that transform inputs into outputs as executed by people or systems.
One of the challenges that come with use of virtual teams according to Guinalíu and Jordan (2016) is team leadership as it plays an important role in the success of a virtual team. However, he adds that issues of trust and communications barriers are fairly expected and leaders must adopt ways of dealing with such issues. Related to the challenges of communication in virtual teams, Gonclaves et al., 2014) observes that even though there are many communication tools used in virtual teams, there has not been many studies to confirm their global efficiency. The new challenge therefore for coping with the business requirements remains how to use the philosophy of effectiveness and efficiency. Other factors that affect communication as suggested by Yu (2015) includes leadership, trust, technology, culture, language, communication channel and frequency.
THEORETICAL FRAMEWORK
It is suggested by Imenda (2014) that a theory can be defined as a set of interrelated propositions and concepts
Mburu 263 that present a systematic point of view for relationships between variables. In this regard, a theoretical framework therefore refers to the theory or set of theories that a researcher chooses to guide his or her research. In this regard, a theoretical framework becomes a structure upon which researchers explain the data analysis and interpretation of key findings. Kothari (2004) notes that reviewing existing literature helps a researcher to establish if there are known gaps in existing theories, findings and how that affects the problem being studied. In this study, emotional intelligence and transformational leadership theories are considered in relation to how the two affect virtual teams’ effectiveness.
Burn’s theory of transformational leadership The theory of transformational leadership according to Burns (1978), describes an approach in which leaders work with teams to identify needed change, and guides the process through a vision and inspiration. It works by bringing about change through motivation and commitment by team members. According to Burns, transformational leadership is a process in which leaders and followers help each other to reach a higher level of morale and motivation. It is suitable for bringing about change. It helps to enhance organizational innovation by creating a compelling vision and providing an environment that supports exploration, experimenting and sharing of ideas. It is also as suggested by Ivancevich et al. (1990) about motivating followers to work towards goals as opposed to short-term satisfaction. Key to this theory is the leaders will to make changes to the structure and culture while allowing people to be creative through mental stimulation. Bass et al. (2003) describes the four main constructs of transformational leadership as idealized influence where leaders are admired, respected and trusted. Inspirational motivation where leaders behave in ways that motivate others, intellectual stimulation in which case leaders encourage followers to be innovative and learn to solve problems in new ways. Finally, individualized consideration where the leader acts as coach, mentor in creating new, and supportive opportunities.
Goleman’s emotional intelligence theory The theory by Goleman (2013) offers that emotional intelligence plays a bigger role in determining the success of a leader. He further adds that, people with a strong self-awareness are generally honest and understand how their emotions affect themselves and others. Goleman further defines emotional intelligence as the ability to identify, assess and control one’s own emotions, the emotions of others and those of groups. The five main components of emotional intelligence are

264 Afr. J. Bus. Manage. considered to be self-awareness, self-regulation, empathy, social skills and motivation. Furthermore, Salovey and Mayer (1990) suggest that emotional intelligence is a subset of social intelligence that involves the ability to monitor one’s own and others’ emotions and feelings, to discriminate among them and use it the information in guiding the thoughts and actions. METHODOLOGY
This research involved a mix approach of qualitative and quantitative methodologies. A qualitative method is according to Kothari (2004) applicable to phenomena that is concerned with quality. The mix approach makes it possible to measure outcomes in aspects like frequency and percentage of occurrence, attitudes and opinions about emotional intelligence and leadership. Kothari recommends that research designed to find out how people feel and think about a subject is qualitative and the assessment of behaviour is done through insights and impressions. On the other hand, Hejase and Hejase (2013) suggest that quantitative analysis using several Likert scale helps to quantify attitudinal and behavioural inputs so as to assess the concepts under study. This research therefore was guided by the aforementioned observations in seeking individual perspectives from technical experts through a survey which according to Leedy and Ormrod (2014), is considered part of a qualitative approach. On the other hand, according to A. Hejase and Hejase (2013), survey is also considered a quantitative research instrument.
Research design
The research followed a descriptive design involving qualitative and quantitative aspects of data collection and specifically following an embedded design as suggested by Leedy and Ormrod (2014). To collect the information accurately from the staff of Save the Children’s technology hub, an online questionnaire was administered through the internet. The method helped to reduce the cost of data collection while also factoring in the time constrains. Besides the low cost, Kothari (2004) notes that the approach is convenient and free from interviewer bias.
Target population, location and sampling
The target population included staff at Save the Children office in Nairobi and specifically those working at the technology hub, which was then, the only technical virtual team within the organization. Purposive sampling technique was therefore used due to the uniqueness of the team and the required data. The approach is supported by Etikan et al. (2016) who observes that purposive sampling as a non-probability technique is a deliberate choice of the researcher due to the qualities participants possess. The employees were reached out to without any gender, age, position and ethnic discrimination as per sample frame in Table 1.
This non-probability sampling approach is also based on a suggestion by Kothari (2004) that in purposive sampling, items for the sample are conveniently determined by the researcher according to appropriateness. For this reason, and based on suggestion by Etikan et al. (2016), the entire target population was considered as a sample given the small size of probable number of respondents. According to Mugenda and Mugenda (2003), respondents who meet certain criteria like age range, literacy level or other characteristics of value to the study may be considered.
Leedy and Ormrod (2014) further suggest that the ability to use computers and Internet systems is a key factor for consideration when considering use of online surveys. According to Etikan et al. (2016), non-random sampling techniques do not require underlying theories for sample size calculation and the researcher determines what is appropriate based participants knowledge and expertise. Therefore, the questionnaire link was sent out to the 24 staff of Save the Children’s Nairobi technology hub based in Kenya and valid feedback was only received from 19 respondents representing a 79% response rate. Data collection methods, types of data and procedures The research laid emphasis on primary data sources since there was lack of evidence that similar research involving Save the Children’s technology hub in Kenya had been carried out before. In support of this basis, Mugenda and Mugenda (2003) advises on discretionary judgment as determined by the appropriateness of the data being sought. Given that the study followed a descriptive design, the data was collected through online questionnaires to staff using Survey Monkey tool. According to Nagalakhmi and Trivedi (2015), online survey tools including survey monkey are suitable for both academic and market research since data collected can easily be exported to other formats for further analysis and translation. According to Regmi et al. (2016), with the increased access to the Internet, use of online data collection techniques has become popular. In comparison with other methods of collecting data where face to face interactions are required, Kothari (2004) notes that the friendliness of the interviewer and respondents is not required.
Descriptive research according to Mugenda and Mugenda (2003), determines and reports things as they are and in this case, describing values, characteristics, behaviours and attitudes. Furthermore, according to Hejase and Hejase (2013: 272), “descriptive statistics deals with describing a collection of data by condensing the amounts of data into simple representative numerical quantities or plots that can provide a better understanding of the collected data.” Therefore, this study analyzed data collected with descriptive statistics such as frequencies and percentages supported with diagrams for clarity. Ethical considerations Ethical considerations in research as advised by Mugenda and Mugenda (2003) were observed including confidentiality for information shared during data collection. The respondents involved were not required to disclose their identity by way of name, identity number or employee number. This was done to ensure anonymity and that their integrity in relation to information shared was not in any way compromised. Saunders et al. (2007) suggests that the design of any research should be in such a way that participants are not subjected to embarrassment. According to Lune and Berg (2017), confidentiality involves removing from the research records, any elements that might be used to positively identify subjects and in this case, there were not such particulars.
DATA ANALYSIS, FINDINGS AND DISCUSSION
The questionnaire used several types of questions including dyadic (Yes and No), multiple choice and 5-level Likert’s scale in order to get insights and perspectives from staff based on the main research objectives. This design of questionnaire is supported by

Mburu 265
Table 1. Sampling frame.
Location County of operation Target population Sample proportion (Staff on email) Sample size (%)
Nairobi Office Nairobi 24 24 100
Figure 1. Frequently used channels of communication. Source: Author (2018).
Barua (2013) who notes that Likert’s is a psychometric scale commonly used in research based on survey questionnaire. Willits et al. (2016) also supports the use of Likert’s scale noting that it is a common tool for measuring attitudes based on the degree to which participants agree or disagree with certain statement. To ensure feelings and opinions beyond the structured statements were captured, open-ended questions were also incorporated.
Data analysis Data analysis followed approaches recommended by Mugenda and Mugenda (2003) where information collected through unstructured questions was organized in themes and concepts. This helps to bring out perspectives following considerations for subjective opinions and attitudes. Mugenda and Mugenda adds that in qualitative approaches, data collection and analysis happen concurrently with computer tools only helping in organizing data sets. Analysis was done using both the
online survey tool capability and Excel as a software in order to produce descriptive and inferential statistics.
Results show that in terms of gender distribution, females constituted 31.58% (6 out of 19) of the respondents and 68.43% (13 out of 19) were male respondents. Concerning the frequently used mode of communication when engaging with business users, the results were as depicted in Figure 1. This figure shows that around 31% of the respondents used equally the Skype audio and emails while 38% used chat.
Social skills
From the analyzed data, of all the participants who were asked to indicate if they had encountered some level of miscommunication, 53% of all the respondents confirmed that they did encounter miscommunication while 43% did not. The staffs were also asked to rate their listening ability on a scale of five measures between very good and very poor. The results show that 94.74% of the respondents rated good to very good in their listening ability (Table 2).

266 Afr. J. Bus. Manage.
Table 2. Level of listening ability.
Scale Responses in % Number of respondents
Very good 52.63 10
Good 42.11 8
Acceptable 5.26 1
Poor 0.0 0
Very poor 0.0 0
Total 100 19
Figure 2. Role of diversity in virtual team success. Source: Author (2018).
Table 3. Likelihood of considering different opinions.
Scale Responses in % Number of respondents
Very likely 63.16 12
Likely 36.84 7
Neither likely nor unlikely 0.0 0
Unlikely 0.0 0
Very unlikely 0.0 0
Total 100 19
Empathy On whether members of the Nairobi technology hub considered diversity as beneficial to the success of the team, 74% strongly agreed, 21% agreed and 5% representing one participant was not sure. None disagreed on the role of diversity in the virtual team as depicted in Figure 2. Equally, in regards to whether the individual staff members would consider the opinions of
others even if they conflicted with their own, 100% of the respondents indicated they would either likely (36.84%) or very likely (63.16%) do as shown in Table 3. Self-awareness and self-regulation The participants were asked to rate their level of self-awareness on a scale of five with very good being

Mburu 267
Figure 3. Level of self-awareness. Source: Author (2018).
Figure 4. Sense of effectiveness as a member of virtual team. Source: Author (2018).
highest and very poor as lowest (Figure 3). About 93% of the respondents rated themselves as between good and very good with only one participant rating as acceptable as shown in Table 5. Overall, about 58% of all respondents indicated that they considered emotional intelligence as very important in their role, while 42% felt it is just important. None of the respondents however
expressed that they did not consider emotional intelligence as important in their role. In regards to the degree in which participants felt effective in being members of a virtual team, 68% indicated they felt highly effective while 32% stated they felt moderately effective (Figure 4). On the other hand, 31.55% of the respondents confirmed they encountered situations that challenged

268 Afr. J. Bus. Manage.
Table 4. Encounter with situations challenging self-control.
Answers Responses in % Number of respondents
Yes 31.58 6
No 68.42 13
Total 100 19
Table 5. Essential leadership skills for virtual teams.
Theme Key words Number of respondents Percentage
Communication
Good communication
14 73
Good communicator
Effective communication
Communication
Clear communication
Good listener
Listening
Character (About Self)
Honest
13 68
Accountable
Open
Trustworthy
Responsible
Integrity
Character (About Others)
Empowering
11 57
Motivating
Inspiring
Delegating
Engaging
Guiding
their self-control as shown in Table 4. Leadership qualities desired in virtual teams The participants were asked to state some of the leadership skills they considered essential for running a virtual team and the results were analyzed in themes as shown in Table 5. Conclusion From the analyzed data, it is clear that slightly over 52% of staff working in the Nairobi technology hub, a virtual team within Save the Children had encountered mis-communication with technology users in the course of their work. As suggested by Guinalíu and Jordan (2016), this then goes to show that people working in virtual teams especially where they interact with others remotely,
are prone to communication challenges. There is also compelling evidence that emotional intelligence is important for members of virtual teams as demonstrated through the results where all the research subjects indicated that they either agreed or strongly agreed.
In regards to specific aspects of emotional intelligence like empathy, social skills, self-awareness and self-regulation, the feelings expressed by majority of the participants were in favor of the fact that the skills positively affected their effectiveness and satisfaction. In this regard, up to 68% expressed that they felt more effective being part of a virtual team and that 73% strongly held a view that diversity was instrumental to the success of the team. Pertaining leadership, the key skills mentioned as being essential to the running of a virtual team were categorized into themes. It was observed that strong communication skills appeared to be a must have for leadership with 73% of respondents mentioning it as a key skill. This aligns well with an earlier observation noted from research by Gonclaves et al. (2014) that one

of the major challenges virtual teams face is lack of effective communication since there is little or none face to face interaction.
Generally, all the critical leadership skills mentioned pointed towards strong character and values like honesty, openness, integrity, accountability and responsibility. Others were inspiring, motivating, guiding, engaging and empowering all of which are associated with transformational leadership style. This observation is in agreement with the theory of transformational leadership by Burns where Stewart (2006) notes that transformative leaders tend to motivate, encourage and inspire their followers.
Even though findings from previous research by other scholars was limited in demonstrating what makes virtual teams effective, the results of this study demonstrates that emotional intelligence plays a role in the individual members of such a team. Those surveyed also strongly indicated that the emotional intelligence and transformational leadership skills are also relevant for overall success of a virtual team. These observations are in line with an argument by Goleman (2013) that emotional intelligence serves as a differentiating factor for performance and effectiveness.
RECOMMENDATIONS
Given that just about half of the staff surveyed indicated that they had faced miscommunication in the course of their work, there is a fair chance that people working in virtual teams would highly benefit from capacity building on effective communication skills. Training to upscale the self-awareness skills for those working in virtual team would be another potential area that needs to be given attention. This is arrived at by the observation that close to 40% of those studied had their self-awareness at between acceptable to good indicating there is a room for improvement. Areas for further research This study did not investigate the extent to which gender and length of experience may be affected by emotional intelligence and leadership styles leading to effectiveness in a virtual team setting. Besides a good number of staff having indicated that they encountered situations that challenged their self-control, their ability to handle the situation was not explored. This provides room for further research on how to establish the virtual team member’s capability to manage conflicts related to self-control as the study only assessed the level of awareness.
CONFLICT OF INTERESTS The author has not declared any conflict of interests.
Mburu 269 REFERENCES Ahmad F, Abbas T, Latif S, Rasheed A (2014). Impact of
transformational leadership on employee motivation in telecommunication sector. Journal of Management Policies and Practices 2(2):11-25.
Ambrose P, Chenoweth J, Mao E (2009). Leadership in virtual teams: The case for emotional intelligence. Americas Conference on Information Systems 2009 Proceedings 626. Available at: https://aisel.aisnet.org/cgi/viewcontent.cgi?article=1602&context=amcis2009
Ask U, Magnusson J, Frisk E (2012). Improving effectiveness and efficiency in large Swedish firms through AIS. Available at: https://www.cfa.handels.gu.se/digitalAssets/1438/1438614_mmw-project.pdf
Barua A (2013). Methods for decision making in survey questionnaires based on Likert scale. Journal of Asian Scientific Research 3(1):33-38.
Bass B, Avolio B, Jung D, Berson Y (2003). Predicting unit performance by assessing transformational and transactional leadership. Journal of Applied Psychology 88(2):207-218.
Batool B (2013). Emotional intelligence and effective leadership. Journal of Business Studies Quarterly 4(3):84-94.
Bosch D (2013). The impact of transformational leadership on leader-follower work value congruence. International Journal of Business and Social Research 3(8):17-31.
Brackett M, Rivers S, Salovey P (2011). Emotional intelligence: Implications for personal, social, academic, and workplace success. Social and Personality Psychology Compass 5(1):88-103.
Burns JM (1978). Leadership. New York, USA: Harper & Row. Cekmecelioglu H, Gunsel A (2013). The effects of individual creativity
and organizational climate on firm innovativeness. Social and Behavioral Sciences 99(9):257-264.
Chou H, Lin Y, Chang H, Chuang W (2013). Transformational leadership and team performance: the mediating roles of cognitive trust and collective efficacy. Sage Open 3(3):2158244013497027
Clark J, Polesello D (2017). Emotional and cultural intelligence in diverse workplaces: getting out of the box. Industrial and Commercial Training 49(7/8):337-349.
Dube S, Marnewick C (2016). A conceptual model to improve performance in virtual teams. South African Journal of Information Management 18(1):1-10.
Dul J, Ceylan C (2011). Work environments for employee creativity. Ergonomics 54(1):12-20.
Duran V, Popescu A (2014). The challenge of multicultural communication in virtual teams. Social and Behavioral Sciences 109:365-369.
Etikan I, Musa S, Alkassim R (2016). Comparison of convenience sampling and purposive sampling. American Journal of Theoretical and Applied Statistics 5(1):1-4.
Gazor H (2012). A literature review on challenges of virtual team's leadership. Journal of Sociological Research 3(2):134-145.
Germaine ML, Mcguire D (2014). The role of swift trust in virtual teams and implications for human resource development. Advances in Developing Human Resources 16(3):356-370.
Goleman D (2013). What makes a leader: Why emotional intelligence matters. More than sound. Available at: https://cds.cern.ch/record/1692351
Gomes AR (2014). Transformational leadership: Theory, research and application to sports. pp. 53-114.
Gonclaves P, Ferreira L, Gonclaves J, Putnik G, Cruz-Cunha M (2014). Direct communication versus virtual communication in virtual teams. Procedia Technology 16:3-10.
Guinaliu M, Jordan P (2016). Building trust in the leader of virtual teams. Spanish Journal of Marketing 20:58-70.
Gupta R, Bajaj B (2017). The relationship between leader’s emotional intelligence and employee creativity: A conceptual framework of mechanism. Procedia Computer Science 122:471-477.
Hejase A, Hejase H (2013). Research Methods: A Practical Approach For Business Students (2 Ed.). Philadelphia, Pa: Masadir Incorporated, 2013.
Hejase H, Haddad Z, Hamdar B, Rola A, Hejase A, Beyrouti N (2014).
270 Afr. J. Bus. Manage.
Knowledge sharing: assessment of factors affecting employee motivation and behaviour in the Lebanese organizations. Journal of Scientific Research and Reports 3(12):1549-1593.
Hejase H, Hamdar B, Noureddin M, Hejase A, Nsouli F (2017). Assessment of the relationship between managers' emotional intelligence and employees' motivation. The Journal of Middle East and North Africa Sciences 3(4):27-47.
Hess JD, Bacigalupo AC (2013). Applying emotional intelligence skills to leadership and decision making in non-profit organizations. Administrative Sciences 3(4):202-220.
Hogue RT (2015). Transformational leadership for virtual teams in an information technology organization. Available at: http://scholarworks.waldenu.edu/cgi/viewcontent.cgi?article=2196&context=dissertations
Imenda S (2014). Is there a conceptual difference between theoretical and conceptual frameworks? Journal of Social Sciences 38(2):185-195.
Ivancevich JM, Matteson MT, Konopaske R (1990). Organizational behavior and management. Available at: http://www.academia.edu/download/61483596/book_10_edition20191211-121005-1yj6hma.pdf
Kannaiah D, Shanthi R (2015). A study on emotional intelligence at workplace. European Journal of Business and Management 7(24):147-154.
Kothari CR (2004). Research Methodology: Methods and Techniques. Jaipur: New Age International Publishers.
Kumar S (2014). Establishing linkage between emotional intelligence and transformational leadership. Industrial Psychology Journal 23(1):1-4.
Leedy P, Ormrod J (2014). Practical research planning and design. Essex: Pearson Education Limited.
Lilian S (2014). Virtual teams: opportunities and challenges for e-leaders. Social and Behavioral Sciences 110:1251-1261.
Lune H, Berg B (2017). Qualitative research methods for social sciences (9th Ed.). Essex, England: Pearson.
Morales V, Montes F, Jover A (2008). The effects of transformational leadership on organizational performance through knowledge and innovation. British Journal of Management 19:299-319.
Morley S, Cormican K, Folan P (2015). An analysis of virtual team characteristics: A model for virtual project managers. Journal of Technology Management and Innovation 10(1):188-203.
Moynihan D, Pandey S, Wright B (2011). Setting the table: How transformational leadership fosters performance information use. Journal of Public Administration Research and Theory 22:143-164.
Mugenda O, Mugenda A (2003). Research methods: Quantitative and qualitative approaches. Nairobi: Acts Press.
Nagalakhmi R, Trivedi M (2015). Utilization of online survey tools for academic research: A practical approach to survey monkey. The International Journal of Research Publications 4(3):21-28.
Nauman S, Elahi M, Bhatti Z, Khalid U (2006). Role of emotional intelligence in virtual project management. Paper presented at the Servant Leadership and Project Outcomes. Available at: Https://Www.Researchgate.Net/Publication/224679534
Nydegger R, Nydegger L (2010). Challenges in managing virtual teams. Journal of Business and Economics Research 8(3):69-82.
Oginde D (2011). Follower expectations of a leader: Most admired leader behaviours. International Leadership Journal 3(2):87-108.
Olariu C, Aldea CC (2014). Managing processes for Virtual Teams–A BPM approach. Procedia-Social and Behavioral Sciences 109:380-384.
Pitts V, Wright N, Harkabus L (2012). Communication in virtual teams:
the role of emotional intelligence. Journal of Organizational Psychology 12(3/4):21-34.
Prati M, Douglas C, Ferris G, Ammeter A, Buckley R (2003). Emotional intelligence, leadership effectiveness, and team outcomes. The International Journal of Organizational Analysis 11(1):21-40.
Quisenberry W (2018). Exploring how emotional intelligence contributes to virtual teams: Interpretive analysis of a phenomenological study. European Scientific Journal 14(5):19-39.
Regmi P, Waithaka E, Paudyal A, Simkhada P, Teijlingen E (2016). Guide to the design and application of online questionnaire surveys. Nepal Journal of Epidemiology 6(4):640-641.
Riggio R, Reichard R (2008). The emotional and social intelligences of effective leadership: An emotional and social skill approach. Journal of Managerial Psychology 23(2):169-185.
Salovey P, Mayer J (1990). Emotional Intelligence. Imagination, cognition and personality, 9(3):185-211.
Saunders M, Lewis P, Thornhill A (2007). Research Methods For Business Students (4th Ed.). Essex, England: Prentice Hall.
Savel R, Munro C (2016). Emotional Intelligence: For the leader in us all. American Journal of Critical Care 25(2):104-107.
Serrat O (2017). Harnessing creativity and innovation in the workplace. In Knowledge solutions. Springer, Singapore. pp. 903-910.
Siebers P, Aickelin U, Battisti G, Celia H, Clegg C, Fu X, Peixoto A (2008). Enhancing productivity: The role of management practices. Advanced Institute of Management Research Paper.
Stewart J (2006). Transformational leadership: An evolving concept examined through the works of burns, bass, avolio, and Leithwood. Canadian Journal of Educational Administration and Policy 54:1-29.
Willits F, Theodori G, Luloff A (2016). Another look at Likert scales. Journal of Rural Social Science 31(3):126-139.
Yu T (2015). Communication In Global Entrepreneurial Virtual Teams: A Systematic Literature Review. (Msc In Entrepreneurship), Aalto University, Aalto University. Available at: https://aaltodoc.aalto.fi/handle/123456789/18300
Vol. 14(9), pp. 271-277, September, 2020
DOI: 10.5897/AJBM2019.8825
Article Number: 9BAE2CF64693
ISSN: 1993-8233
Copyright© 2020
Author(s) retain the copyright of this article
http://www.academicjournals.org/AJBM
African Journal of Business Management
Review
Social media, business capabilities and performance: A review of literature
Mohammedhussen Mama Irbo* and Abdulnasir Abdulmelike Mohammed
Department of Management, College of Business and Economics, Madda Walabu University, Ethiopia.
Received 22 May, 2019; Accepted 19 November, 2019
Information communication technology has plenty of benefits to society. Social media being the product of information technology have become an essential tool for marketers at a very minimum investment. Social media have a positive impact on companies as well as customers. In today’s circumstances, customers judge companies based on their online presence, hence they can innovate and simultaneously create a strong social presence by always catering to their customers’ needs and concerns. Social media are used in day to day activities of several companies, including beginners of micro and small enterprises, medium and large sized business organizations. The purpose of this research is to explore and to analyze to what extent social media have an impact on organizational capabilities and business performance using the review of related literature as a method of this research. It was found out from the review of literature that social media increase the capabilities and performances of a business to a large extent. Key words: Social media, social networking, business capabilities, business Performance.
INTRODUCTION The development of social media is popularly used in today‘s business activities at all levels in terms of size, ranging from micro and small enterprises to medium and large-sized companies (Andriole, 2010; Bell and Loane, 2010). Current technologies have become known to enable business network cooperation among different businesses by serving as efficient tools (Bell and Loane, 2010) and the applications market is flourishing (Dutta, 2012). The companies which are already tied to one another with the help of current technologies are able to enjoy competitive advantages and outperform their competitors by the use of the latest social media
platforms. These help them register benefits of lowering cost and improving efficiencies (Harris and Rea, 2009). These would enable one to have a better understanding of the role of social media for the performances of a business (Wetzstein et al., 2011).
The impact of social media on business performances may be due to the effects of social media on management (Birkinshaw and Crainer, 2010), or due to the effects of social media on governance (De Hertog et al., 2011), or still due to the effects of social media on knowledge management (Schneckenberg, 2009), or its effect on strategic competitiveness (Liu and Liu, 2009).
*Corresponding author. E-mail: [email protected].
Author(s) agree that this article remain permanently open access under the terms of the Creative Commons Attribution
License 4.0 International License

272 Afr. J. Bus. Manage. The direct relationships between social media and business performances will indicate and support the use of Enterprise 2.0. This is a new business environment which enables business organizations to look at their benefits if they integrate social media suites into their day to day activities. Even though social media are extensively used here and there, little is known whether the technologies of social media have any specific impact on business performances (Denyer et al., 2011).
Even though social media have been recognized as the most powerful medium in business practice, there is a lack of understanding in terms of what social media benefits the organization (Parveen, 2012). Some reports argue against the use of social media inside companies as it is blamed for reducing the productivity of employees for long periods of time online and chatting unacceptably. Moreover, social media are considered as time wasters and security traps by some (Turban et al., 2011). The aim of this study was, therefore, to assess the extent to which businesses use social media tools in their business process in order to get connected with their customers and to analyze the impact of social media on the capabilities and performances of businesses (Bughin, 2009, 2011). RESEARCH METHODS The research questions in this paper are ‗‘to what extent do businesses use social media tools in their business process in order to get connected with their customers? ‗What are the impacts of social media on business performance and capabilities?‘ To answer the research questions, the researchers have gone through the existing literature. The review was based on common search engines/databases (Google scholar and Science direct) and keywords such as ―Social Media‖, ―Social Networking‖, ―Business Capabilities‖ and ―Business Performance‖ using combination of ―or‖ and ―and‖. The study reviewed 39 relevant articles and other research on social media and business performances. The data obtained from such reviews studies were analyzed in order to bring issues into the surface so the results generated from the research can help arrive at some conclusions which may be used by interested individuals or organizations. LITERATURE REVIEW According to Hartshorn (2010), social media is a new version of networking which individuals make use of it with the help of internet as a medium in the 21
stcentury. It
reaches large numbers of people all over the world without the limitation of distance. Hence, it has become a highly effective tool for businesses to communicate with
customers. Social media is a catchphrase that describes technology that facilitates interactive information, user-created content and collaboration (Elefant, 2011). Examples of social networks include Wikipedia (for reference), Facebook (for social activity), YouTube (for video sharing), and TripAdvisor (for travel networks).
According to Kaplan and Haenlein (2010), social media is defined as ―a group of Internet-based applications built on the ideological and technological foundations of Web 2.0‖. It allowed the production and exchange of the content generated by users. Web 2.0 is the software that is doing social purpose the value of whom is generated by the volumes of the people who make use of it in creating and sharing content collaboratively. The presence of an exact definition of the concept of social media would help realize a comprehensive list of tools that fall into this category. But the emphasis given to collaboration assisted the common consensus on the tools that belong to the Web 2.0 generation of Web development. Among these are weblogs, wikis, RSS technologies, social networks, mashups, podcasts, folksonomies, or virtual worlds.
The ways people communicate with one another have changed as a result of Social Media. In spite of the fact that social networking existed right from the onset of humanity, with the advancement of technology the concept of social networking has become similar to other innovations and it is sophisticated increasingly in today‘s world (Edosomwan et al., 2011). Social networking is the base of understanding of social media and it is impossible to learn about social media before understanding social networking. To make things simple, social media is the kind of communicating with the help of electronic media in which interested individuals generate and transfer information in the form of texts, pictures, audio and videos online. In fact, the telegraph was used to transmit messages over a long distance in the 1700s. This now has developed into the reality in which users communicate using networking tools such as Google buzz which help users to link, share photos, messages, videos and their views on a specific issue in ―conversations‖ and ‗‘visible in the user‘s inbox‘‘ (Ritholz, 2010). SOCIAL MEDIA FUNCTIONALITIES Kietzmann et al. (2011) contributed the base which helps to analyze the impact of Web 2.0 instruments on business by differentiating the seven functional elements which are used as building blocks of a Web 2.0 tool. According to Kietzman et al. (2011), the seven functional building blocks of Web 2.0 and their impacts on the capabilities of businesses are: 1) Identity: this is the extent to which users reveal

themselves and has the impact in the sense that the company‘s capacity to monitor the privacy of data and gives tools for branding at a personal level and help promoting one self. 2) Conversation: is the extent at which users make use of the tool to interact and assist the company to be able to control and monitor communication and to determine sufficient moments for beginning conversations. 3) Sharing: is the extent to which users exchange, distribute, and receive content and assist the company to be able to administrate content and determine the items which may have the potential for viruses. 4) Presence: is the extent to which users are aware of the presence of one another and enable the company to create and manage the context by analyzing user availability and location. 5) Relationship: is the extent to which users relate to one another and enable a company ability to administer the relationship with the network by examining how strong is the relations and the patterns of communication. 6) Reputation: is the extent to which people who use social media are aware of the social standing of other social media users and enable the company to identify a measure that evaluates how strong the sentiment of others is. 7) Group: is the extent to which users form communities but the problem is identifying the rules which guide membership and criteria for becoming a member of the group.
Networked business institutions enjoyed a competitive advantage as a result of the introduction of Web 2.0. This refers to companies which could effectively use social media instruments for making two-way communications, collaboration, and the process of business enhanced (Bradbury, 2010). Moreover, organizations are categorized into three on the basis of the type of network they are engaged in. They are organizations internally networked; organizations which are networked externally and organizations which are mixed in terms of the network (Bughin, 2011). Web 2.0 provides several benefits to networked businesses and other organizations such as lower costs, innovations and fast development of products. The analysis and quantification of the impacts of web 2.0 have been made with the help of several models which have been developed for this purpose (Andriole, 2010; Birkinshaw and Crainer, 2009; Bughin, 2011; Dutta, 2012).
It was assumed by Van Heck and Vervest (2007) that different sets of Web 2.0 functionalities in unity form an environment of capabilities that help the networking of businesses, the effects of network and increased performance. The authors assume that such effect of network and greater performance can only be possible if Networked Business Operating Logic is developed by the network. The connection between different actors can be carried out easily as well as linkages between business
Irbo and Abdulnasir 273 owners and the network processes and the available data can take place with the help of this logic. Surprisingly, the logic supports the network to be smart. This is because it creates the process of businesses to be able to rapidly pick, plug, and play to achieve a specific objective rapidly for instance, to respond to customer order. It is argued that the existence of Networked Business Operation Logic is mandatory if one wants to use web 2.0 resources effectively. The Web 2.0 ecosystem logic encompasses the abilities to connect many actors in an organization, supports business processes, and the flow of information to create network effects which would improve the effectiveness of business. These clearly indicate that a set of Web 2.0 tools help to improve the business process and its performance but require adequate business capabilities. SOCIAL MEDIA VERUS TRADITIONAL MEDIA User participation in social media marked the difference between social media and traditional media. Both social and traditional media are used to reach customers; with social media as the only media that allows customers to take part and disseminate their opinions. Research on social media shows that approximately 50% of adults who use the internet participate in social networking which indicates that this number has a significant implication on businesses. Marketing companies use customized data mining software that enables them to keep track of consumer behavior, spending pattern and satisfaction ratings. These findings are used to measure the effectiveness of marketing campaigns in terms of return on investment (ROI) and other performance indicators (Kasavana, 2008). THE IMPACT OF SOCIAL MEDIA ON BUSINESS CAPABILITIES Business capabilities play a great role in better performances of businesses. Andriole (2010) identifies six factors (business capabilities) that are influenced by using Web 2.0 tools, and ultimately affect business performance as indicated in Table 1.
These six factors relate to organizational capabilities, influenced by social media use. Based on the resource-based view of the firm, the use of social media technology resources may enhance organizational capabilities, and, ultimately, business performance. Martin and Serban (2013) conducted research on the impact of social media on business performance and found out that the study company uses a set of six tools to support all business processes among the 120 employees, the customers, and service providers. Interviews clearly indicate that together, the six tools form the social media ecosystem

274 Afr. J. Bus. Manage. Table 1. The six functional building blocks of social media and their impacts on business capabilities.
S/N Business capabilities Impacts on business capabilities
1 Collaboration and communication
Web 2.0 tools provide the capacity to enable organizations to communicate and collaborate within and among themselves making companies to rapidly internationalize and globalize in their operations (Bell and Loane, 2010). The four indicators related to ―collaboration and communication‖ include the capacity to: (1) integrate discussions, (2) address many people in a fast manner, (3) coordinate programs and tasks, and (4) check communication streams.
2 Rapid application development
Web 2.0 tools help ‗‘application development‘‘ by coordinating the services of third-party and adding technologies which already exist and applications into new businesses.
The tools help experts, customers, suppliers and the employees of the company in a similar manner in the efforts of developing a product which would help them speed. The involvement of customers in the product development process would significantly reduce the rate of failure (Bell and Loane, 2010). The three indicators are (1) the modification and fast developments of application, (2) easy support of an application, and (3) the capacity to improve modelling requirements.
3 Customer relationship management (CRM)
Web 2.0 tools support the reshipping of the conventional CRM processes, changing them into CRM 2.0, by tracing and giving solutions to customer service problems, using forums, wikis and others web 2.0 tools. The four indicators are the capability (1) of mining the data of customers in an effective manner, (2) of reaching several customers, (3) of asking feedback from customers, and (4) of communicating with customers effectively.
4 Innovation
The exchange of ideas among experts enhanced by the content produced by users and mass co-creation are the base of innovation, (Bell and Loane 2010). Web 2.0 tools contribute towards making innovation to be known among the public. It helps innovations which are created faster to be available on the market by enabling around the clock, communicating experts in the field all over boundaries in the world (Schneckenberg, 2009). Measures of innovation are the capacity of (1) grouping innovation, (2) improving the rate of success, (3) increasing the activities of innovation, and (4) producing efficiency in innovation.
5 Training
It affects training processes as users need to be the center of information and there is a transition of companies toward data sharing, the content generated by the user, and the experience. This makes training activities not limited to a limited place or a specific time frame: ‗‘webinars take place all over the world and blogs, forums, wikis, and podcasts may enhance the training experience‘‘. The impact of social media on training is measured as the capability to (1) support traditional training, (2) modify training content, (3) support asynchronous training, and (4) codify and distribute training content.
6 Knowledge management
Web 2.0 tools could improve knowledge management processes, the creation of knowledge, and knowledge exchange (Schneckenberg, 2009). Web 2.0 tools have two focuses on internal and external focuses. The internal focus could raise knowledge transfer between employees. The external one focuses on the two-way communications taking place between customers and suppliers. Knowledge management is measured as the capabilities to (1) Share, (2) Retrieve, (3) Organize, and (4) Leverage knowledge.
that enables the study company to run and coordinate its intra and inter-organizational business processes. All business processes in the study company are supported and coordination among processes is fully based on the wide set of functionalities offered by these tools. THE IMPACT OF SOCIAL MEDIA ON BUSINESS PERFORMANCE From the perspective of resource-based theory a set of resources that organizations get (such as human resource, information communication technology
infrastructure, and social media) are peculiar to the business, which rival cannot easily imitate. The specific mix of resources will create the basis for business competitive advantage and greater performance. The differences between resources and capabilities show that resources are the basic units of analyses, capabilities; on the other hand, are repeated outlines of action while using resources to create something of value, produce products, or provide value to a market for the business organization (Barney, 1991).
According to KPMG International (2011), the adoption of social media is widespread for businesses in the emerging markets of China, India and Brazil who on

average are 20 to 30 percent more likely to use social media than counterparts in the UK, Australia, Germany or Canada. This may be attributed to the emerging markets‘ lower dependence on ‗legacy systems‘ that – in more established markets – tends to bind organizations to their long-established channel strategies, as well as the rapidly declining cost of internet access and devices in the developing world. Emerging markets seem to be quickly finding that social networks offer yet another opportunity to leapfrog the competition in the developed markets.
KPMG International further indicated that the majority of businesses use social media to enhance their relationships with their customers. But more than half are also expanding their use of social media to drive innovation in their products and services and for recruitment. Companies are finding a wide variety of business uses for social media. Clearly, social media is rapidly moving up the boardroom agenda, regardless of an industry group or ownership structure. There seems to be little doubt that social media is widely seen as a viable and effective business tool.
Social media is also applied to marketing. Social media marketing consists of the attempt to use social media to persuade consumers that one's company, products and/or services are worthwhile. Social media marketing is marketing using online communities, social networks, blog marketing and more (Kaplan and Haenlein, 2010). Social networking websites allow individuals to interact with one another and build relationships. Social networking sites like Twitter, Facebook, Google Plus, YouTube and blogs allow individual followers to ―retweet‖ or ―repost‖ comments made by the product being promoted (Bajpai et al., 2012).
Dutta (2012) indicates that social media are changing the way we do business and how leaders are perceived, from lower to the higher management level. Interestingly, even though the best businesses are creating comprehensive strategies in this area, research suggests that few corporate leaders have a social media presence and that those who do not use it strategically. But in today's world, leaders must use social media for three reasons: 1) They provide a low-cost, highly accessible platform on which a personal brand can be built, and also communicate our identity within and outside the company. 2) They allow engaging rapidly and simultaneously with peers, employees, customers, and the broader public in order to leverage relationships, show commitment to a cause, and demonstrate a capacity for reflection. 3) Third, they give an opportunity to learn from instant information and unvarnished feedback.
Similarly, Hunt (2010) investigates the important role of social media in the recruitment of employees amongst companies. He further claims that in addition to socializing, social media could be used in hiring and
Irbo and Abdulnasir 275 introducing some information about the companies. He also mentions that business organizations which do not embrace social media such as ‗Facebook, LinkedIn, and Twitter‘ for recruitment purposes may lose competent candidates. Kaplan and Haenlein (2010) have the opinion that to identify the challenges and opportunities of social media, the concept of Social Media is top of the agenda for many business executives today.
According to Singh and Sinha (2017), the following are the major benefits of social media for business: 1) Improved customer insights: The business gets a better understanding of their customers and they can always share their insights as they are aware that the company is listening to them. 2) Better customer service: Social media allows businesses to respond to customers‘ grievances, questions and concerns almost instantaneously. 3) Cost efficient: using social media is the most cost-efficient way to market and promote the business. 4) Connectivity: The business will always be connecting to the customers in terms of changing preferences, lifestyles and resources and adapt to the changing interest of the consumers using social media. 5) Establishing Brand Awareness: it is possible to increase the brand awareness among customers as businesses can create awareness by building company image social media. 6) Sales: increased exposure to social media drives traffic into companies. This, in turn, converts the potential customers to actual customers.
According to Starkov and Mechoso (2008), social networking websites generate many special roles in the hospitality industry. The websites give a platform for calculating the rating system which can generate, monitor, and evaluate the image and reputation of the businesses in the hospitality industry. The credibility of information generated by consumers is perceived as high compared to the information released by the hospitality entity.
Kasavana and Teodosic (2010) found out that the participation of hospitality companies in social networking resulted in a cost-effective way of communicating and engaging with potential customers. The businesses get direct access to active users with the help of websites with no need to acquire additional hardware and software. A social networking site that is easily accessible, straightforward, and appealing enables participants to become engaged in unique ways.
A research conducted on ―Analyzing the Effects of Social Media on the Hospitality Industry‖ by Seth (2012) using a careful review of the literature on the use of social media among businesses shows that debate was made on how customers perceive social media in relation to marketing and brand formulation and management. The result indicated that the majority of hotel bookings are

276 Afr. J. Bus. Manage. made over the internet. Moreover, the number of reservations made via hotel owned websites has also increased briskly. Hotel branded websites went up from having 75% of internet reservations in 2005 to 81% in 2006 (Mintel International Group, 2007). Lanz et al. (2010) indicate that interactive marketing comprised 21% of all marketing expenditure by 2014, and social media represented 3 to 6% of the interactive marketing expenditure. Kasavana (2008) recommended that in order for better business outcomes companies need to continually use social media for monitoring, analyzing and evaluating customer reviews.
Singh and Sinha (2017) conducted research on The Impact of Social Media on Business Growth and Performance in India in which they concluded that many companies use Social media. Moreover, they use traditional media in order to market their products as well as to be connected to their customers. They further concluded that different from traditional media social media have the ability to reach out to many customers as well as be able to entertain customers‘ specific needs in a better way. These show that social media helps businesses do their job in an effective and efficient manner today and can have the ability to bring out innovative strategies which could assist companies to operate fast that used to be very monotonous.
Social media offer different values to firms, such as enhanced brand popularity (de Vries et al., 2012), facilitating word-of-mouth communication (Chen et al., 2011), increasing sales (Agnihotri et al., 2012), and sharing information in a business context (Lu and Hsiao, 2010).
Aula (2010) focuses on the problems associated with social media to the reputation of business organizations. He indicates the most popular and interesting social media services based on the corporate perspectives which include Facebook, MySpace, and Twitter. However, he states that social media propagates the scope of reputation risks and increases risk dynamics.
CONCLUSIONS
Social media have a positive impact on business growth and performance. From the review of available literatures, it can be concluded that social media enable companies to reach out to more customers and cater to their specific needs better For instance, for the majority of recruiters, LinkedIn, Twitter, Facebook, and employee referrals have officially surpassed traditional job boards as the preferred way to acquire talent for business organizations. Today‘s leaders must embrace social media for three reasons. First, they provide a low-cost, highly accessible platform on which a personal brand can be built, and also communicates our identity within and outside the company. Second, they allow engaging rapidly and simultaneously with peers, employees,
customers, and the broader public in order to leverage relationships, show commitment to a cause, and demonstrate a capacity for reflection. Third, they give an opportunity to learn from instant information and unvarnished feedback. Companies that are at the maturity stage in the product lifecycle can adopt social media to extend their business survival if they fail to do so, they are undoubtedly going downhill in the coming years.
The main limitation of this study was that it is conducted from the perspective of secondary data analysis based on the literature reviews. Since no primary data were collected from any of source, this study may not be able to indicate any quantifiable or tangible gains that they enjoy from choosing social media over traditional marketing methods. CONFLICT OF INTERESTS The authors have not declared any conflict of interests. REFERENCES Agnihotri R, Kothandaraman P, Kashyap R, Singh R (2012). Bringing
‗social‘ into sales: the impact of salespeople‘s social media use on service behaviors and value creation. Journal of Personal Selling and Sales Management 32(3):333-348.
Andriole SJ (2010). Business impact of Web 2.0 Technologies. CACM 53(12):67-79.
Aula P (2010). Social Media, Reputation Risk and Ambient Publicity Management, Strategy and Leadership 38(6):43-49.
Bajpai V, Pandey S, Shriwas S (2012). Social media marketing: Strategies & its impact. International Journal of Social Science and Interdisciplinary Research 1(7):214-223.
Barney J (1991). Firm resources and sustained competitive advantage. Journal of Management 17(1):99-120.
Bell J, Loane S (2010). New-wave‘ global firms: Web 2.0 and SME internationalisation. Journal of Marketing Management 26(3-4):213-229.
Birkinshaw J, Crainer S (2009). Using web 2.0 to create management 2.0. Business Strategy Review 20(2):20-23.
Bradbury D (2010). Web 2.0 beyond buzz words. Computer Weekly. https://www.computerweekly.com/news/2240080814/Web-20-beyond-the-buzz-words
Bughin J (2011). How Web2.0 pays off: the growth dividend enjoyed by networked enterprises. McKinsey Quarterly.
Bughin V (2009). Drainage et contention: adaptation aux enfants. Kinésithérapie Scientifique 504:23.
Chen Y, Fay S, Wang Q (2011). The role of marketing in social media: how online consumer reviews evolve. Journal of Interactive Marketing 25(2):85-94.
De Hertog S, Viaene S, Dedene G (2011). Governing Web 2.0. CACM 54(3):124-130.
De Vries L, Gensler S, Leeflang PS (2012). Popularity of brand posts on brand fanpages: an investigation of the effects of social media marketing. Journal of Interactive Marketing 26(2):83-91.
Denyer D Parry E, Flowers P (2011). Social, open, and participative? Exploring personal experiences and organisational effects of Enterprise2.0 use. Long Range Planning 44(5/6):375-396.
Dutta S (2012). Enterprise 2.0: let the revolution begin! Rotman Magazine pp. 66-71.
Edosomwan S, Prakasan SK, Kouame D, Watson J, Seymour T (2011). The history of social media and its impact on business. Journal of

Applied Management and Entrepreneurship 16(3):79-91. Elefant C (2011). The "power" of social media: Legal issues & best
practices for utilities engaging social media. Energy Law Journal 32(1):1-56.
Harris AL, Rea A (2009). Web 2.0 and virtual world technologies. Journal of IS Education 20(2):137-144.
Hartshorn S (2010). 5 Differences Between Social Media and Social Networking. Available at: http://www.socialmediatoday.com/SMC/194754
Hunt KG (2010). Finders keepers: Social media strategies help find top talent. Journal of Property Management 75(6):36-41.
Kaplan AM, Haenlein M (2010). Users of the world unite! The challenges and opportunities of social media. Business Horizon 53(1):59-68.
Kasavana ML, Nusair K, Teodosic K (2010). Online social networking: Redefining the human web. Journal of Hospitality and Tourism Technology 1(1):68-82.
Kasavana, M. L. (2008). The unintended consequences of social media and the hospitality industry. Hospitality Upgrade pp. 122-130.
Kietzmann JH, Hermkens K, McCarthy IP, Silvestre BS (2011). Social media? Get serious! Understanding the functional building blocks of social media. Business Horizons 54(3):241-251.
KPMG INTERNATIONAL (2011). Going Social. How businesses are making the most of social media, KPMG INTERNATIONAL, 2011 KPMG International Cooperative, Publication number: 111139
Lanz L, Fischhof B, Lee R (2010). How are Hotels Embracing Social Media in 2010? Examples of How to Start Engaging. New York: HVS Sales and Marketing Services.
Liu CH, Liu HZ (2009). Increasing competitiveness of a firm and supply chain with Web 2.0 initiatives. International Journal of Electronics Business Management 7(4):248-255.
Lu HP, Hsiao KL (2010). The influence of extro/introversion on the intention to pay for social networking sites. Information and Management 47(3):150-157.
Irbo and Abdulnasir 277 Martin S, Serban M (2013). The Impact of Social Media on Business
Performance. Proceedings of the 21st European Conference on Information Systems.
Mintel International Group (2007). Hotels and accommodations—US. Chicago, IL: Author.
Parveen F (2012). Impact Of Social Media Usage On Organizations. Department of Operations and Management Information Systems, Faculty of Business & Accountancy, University of Malaya, Malaysia.
Ritholz B (2010). History of social media. Available at: http://www.ritholtz.com/blog/2010/12/history-of-social-media/
Schneckenberg D (2009). Web 2.0 and the empowerment of the knowledge worker. Journal of Knowledge Management 13(6):509-520.
Seth G (2012). Analyzing the Effects of Social Media on the Hospitality Industry". UNLV Theses/Dissertations/ Professional Papers/Capstones. Paper 1346.
Singh TP, Sinha R (2017). The Impact Of Social Media On Business Growth And Performance In India. International Journal Of Research In Management & Business Studies 4(1):2348-6503.
Starkov M, Mechoso M (2008). Best Practices on Monitoring Hotel Review Sites, Hospitality eBusiness Strategies, New York, NY, August.
Turban E, Bolloju N, Liang TP (2011). Enterprise social Networking Opportunities, Adoption, and Risk mitigation. Journal of Organizational Computing and Electronic Commerce 21:202-220.
Wetzstein B, Leitner P, Rosenberg F, Dustdar S, Leymann, F (2011). Identifying influential factors of business process performance using dependency analysis. Enterprise 5(1):79-98.

Vol. 14(9), pp. 278-290, September, 2020
DOI: 10.5897/AJBM2020.9053
Article Number: D61786464749
ISSN: 1993-8233
Copyright© 2020
Author(s) retain the copyright of this article
http://www.academicjournals.org/AJBM
African Journal of Business Management
Full Length Research Paper
Co-operative and saving societies (SACCOS) and poverty reduction in Lango and Kigezi sub-regions of
Uganda: A comparative empirical study
Marus Eton1*, Benon C. Basheka2 and Fabian Mwosi3
1Department of Business, Faculty of Economics and Management Science, Kabale University, Kabale, Uganda.
2Department of Governance, Faculty of Arts and Social Sciences, Kabale University, Kabale Uganda.
3Department of Postgraduate Studies, Bishop Burham University College, Kabale Uganda.
Received 1 June, 2020; Accepted 14 August, 2020
The paper examines the contributions of co-operative and saving societies in poverty reduction in Lango and Kigezi sub-region. The study adopted a comparative and cross-sectional survey design where bivariate and multivariate data analyses were used to analyze the data. Specifically, correlation and regression analysis were done to determine the relationship between financial contribution by savings and credit co-operative (SACCOS), saving culture and poverty reduction. The findings established that low-income households had inadequate access to cheap and affordable credit. In the two regions, the available credits offered by SACCOS were not cheap per say and the SACCOS offered credit at 10% per month, which translated into 120% per annum. The study reveals that microcredits create long-term indebtedness among the rural poor, and yet households are not competent in managing their finances. The saving culture in Kigezi sub-region is associated with political motivations and support from politicians. In contrast, in Lango sub-region, saving culture is associated with response to government programs that were aimed at reconstructing northern Uganda after the two decades of insurgency. The provision of more financial services would contribute to poverty reduction and training of households on the utilization of financial credit. Key words: Cooperative and saving societies, savings and credit co-operative (SACCOS), financial services, poverty reduction.
INTRODUCTION Cooperative and saving societies have been acknowledged as a crucial means for poverty reduction, and that is why most developing nations have widely adopted it and promoted the growth of the co-operative movement since the colonial period. Develtere et al.
(2008) observed that the co-operative movement has been on the growth. Thus in every seven persons, one member belongs to a co-operative and saving group, and the total number of co-operatives have continued to grow. The first era of co-operative movement was taken up with
*Corresponding author. E-mail: [email protected], [email protected].
Author(s) agree that this article remain permanently open access under the terms of the Creative Commons Attribution
License 4.0 International License

strong stringent government control system through the creation of policies and legislation that supported co-operatives cooperatives as a drive to economic growth and development. The second eras have has been seen by relieving co-operatives from the state of enjoying autonomy and operate a business venture, which response to market demands. Accessing financial products and services are an essential tool in poverty reduction and alleviation at the community and individual level. Different models and approaches have been tried to improve the income levels of individuals, community and ultimately, the government. The introduction of Cooperative and saving societies in the country has recently regained immense consideration as one of the most critical strategies for poverty reduction and alleviation. Arguably, it is assumed that this approach achieves developmental programs with citizens or community participation, and it is seen as a key requirement, which is likely to create a better development outcome through addressing poverty. The Ministry of Trade and Industry in Uganda by 30 August 2012 had registered 13,179cooperatives, which comprised in the areas of savings and credit co-operative (SACCOS), Agriculture and Marketing, Diary, Transport, Housing, Fishing, Multipurpose, and Others. SACCOS was 40%, and Diary was 2% respectively, and for this study, it will concentrate on SACCOS. In a developing country like Uganda, access to credit to the poor in the rural areas is through microfinance schemes (Peace, 2011). The increase in the demand for financial services has brought a need for changes to co-operative societies as a factor in financial inclusion and deepening. Reports have tended to suggest that poverty has been reportedly falling in Africa, but not as rapidly as in South and East Asia. Africa Progress Panel (2014) indicated that Africa's share of global poverty increased from 22.0% in 1990 to 33.0 % in 2010. Over the years, concerned people have neglected the income inequality issue out rightly. Time series data has been documented citing the changes in poverty level, economic growth and macroeconomic drivers of poverty. The performance of the rural economy primarily determines the poverty-alleviating situation. Poverty has continued to receive global attention by international organizations, donor agencies, and civil societies among others in developing countries where the rate is already alarming despite efforts directed towards curbing the problem. Uganda has registered some important success in poverty reduction strategy with the proportion of those living in poverty whether measured using the international or national poverty line shows that more than half still live below the poverty line. According to the national poverty line, the proportion of the population living in poverty line declined from 56.4% in 1993 to 19.7% in 2013, despite the low level of the national poverty line. Uganda has experienced a remarkable decline in poverty and Lango Sub-region experienced the highest decline in poverty levels in
Eton et al. 279 Northern Uganda, showing a reduction from 43.7% in 2012/2013 to 32.5% in 2016/2017 (UBOS, 2018). While poverty incidence remained higher in rural areas at 31%, compared to urban areas at 15%, poverty estimate in Uganda has been further disaggregated by region. In their study, Daniels and Minot (2015) observes that in the last ten years Uganda has shown a great reduction in poverty amongst the citizens living under $1.25 and this has shown it as faster than any other country in Sub-Saharan Africa (World Bank, 2015). The poverty trends in Kigezi and Lango regions are not any different from that of other rural areas in the country.
THEORETICAL FRAMEWORK
The principle-agency theory has also been used to explain the dynamics in co-operatives. This theory postulates that Principal-agent problems arise because the objectives of the agent are usually not the same as those of the principal, and thus the agent may not always best represent the interests of the principal (Alchian and Demsetz, 1972; Sykuta and Chaddad, 1999). The terms of an agency relationship are typically defined in a contract between the agent and the principal. Because contracts are generally incomplete, "there are opportunities for shirking due to moral hazard and imperfect observability" (Royer, 1999: 50). Richards et al. (1998: 32) pointed to various studies which argued that co-operatives experienced more significant principal-agent problems than proprietary firms due to "the lack of capital market discipline, a clear profit motive, and the transitive nature of ownership.” Cook (1995) developed a five-stage co-operative life cycle that sought to explain the formation, growth and eventual decline of a co-operative. As the co-operative matures and the members become increasingly aware of the inherent problems, as well as the cooperating benefits that may be lost if operations ceased, members and their leadership will have to consider their long-term strategic options (tradeoffs between the benefits and costs) and decide whether to exit, continue, or convert into another business form.
PROBLEM STATEMENT AND RESEARCH QUESTIONS
The global poverty incidence is still high and the developing countries have registered a rising trend, which is worrying (The World Bank Global Findex, 2019). It is noted that every five persons living in developing economies live on less than $ 1.25per day (World Bank, 2018a). Sub-Saharan Africa is highly affected where the proportion of people living below $ 1.25 is 28% followed by Southern Asia at 30% except India at 22%.SACCOS have played a major role in providing financial products and services to the low-income earners in rural and urban

280 Afr. J. Bus. Manage. areas who are financially excluded by formal financial institutions in many countries (Dibissa, 2015). Savings and Credit cooperatives have played a unique and significant role in providing various financial services in rural areas. The performance of rural SACCOS in mobilizing saving and the provision of credit to their clients have not been satisfactory and these have created a gap in financial mobilizations (Kifle, 2012). Uganda uses SACCOS as a strategy to poverty reduction and or alleviation in the community; however, it has not performed credibly well and therefore it has not played to the expected vital and vibrant role in poverty reduction. While performance reports from different government agencies allude to improvements in poverty levels and hail the number of SACCOS that have increased, not much has been reported about cooperative savings and their capacity to improve poverty. Moreover, no such studies have attempted to compare two distant regions of the country. UBOS (2018) observes that poverty level in Lango stood at 17.6% while the Kigezi sub-region stood at 19.5%.Despite the increasing number of Cooperative and saving societies (SACCOS) in Uganda, Lango and Kigezi sub-regions, the majority of the populations in the two regions are still below the poverty line (UBOS, 2018); thus, necessitating an empirical study to be conducted. The following research questions guided the study (i) How do financial services provided by cooperative and saving societies contribute to poverty reduction in Lango and Kigezi sub-region? (ii) Does the saving culture adopted by members of the SACCOS contribute to poverty reduction in Lango and Kigezi sub-region? (iii) Is there a relationship between Cooperative and saving societies and poverty reduction in Lango and Kigezi sub-region? LITERATURE REVIEW The concept of savings and credit co-operatives societies The SACCOS also referred to as a credit union is a co-operative financial institution whose ownership and members own control and they operate purposely with the primary objective of providing credits with lower interest rates and providing services to its members (Ikua, 2015). SACCOS operating within the society play a significant role in bringing about broad-based development agenda in poverty alleviation (Tesfay and Tesfay, 2013). The financial products and services provided by conventional banks and micro lenders are facing constraints such as ever-increasing transaction cost, institutional weaknesses, harsh collateral
requirements, limited infrastructure and low returns (Mashigo and Schoeman, 2011). Most co-operatives are located both in rural and urban areas with the vast majority only having one branch with membership drawn from the local community (Brown et al., 2015). SACCOS ensure that microfinance service provision expands to include a large number of clients and should introduce entrepreneurial training to all members for effective poverty reduction (Kihwele and Gwahula, 2015). SACCOS offer several financial products and services such as welfare fund, loans, risk management fund, credit facilities to the population (Momanyi and Njiru, 2016). The study conducted by World Bank (2013) notes that citizens are aware of the availability of the several financial products and services provided by multiple financial institutions which meet the needs of the population. Pearlman (2012) notes that additional income sources generated from the micro-credit programs can be used for education, expenditure and saving purpose to address the economic vulnerability.
World Bank (2014) observes that poor households benefited from savings, basic payments and insurance services and notes that microcredit experiences a mixed opinion about the significance of microfinance products and services, which targets a specific group of the population. Bateman (2017) notes that those who get multiple loans from both formal and informal sources to pay off the previous or the running loans end into over-indebtedness or become heavily indebted. Begajo (2018) asserts that SACCOS face several challenges such as shortage of physical capital, irregular savings by members, weak recovery of loans, no collaborations amongst financial institutions and limited support from government. Aniodoh (2018) points out that the government should encourage co-operative professionals to make it a point to educate the public more on their activities and its importance to the national development of the economy. Elem (2019) observes that governments should establish co-operative institutions where rural cooperators could have access to co-operative education programs and training in co-operative management. Mashigo and Kabir (2016) argue that village banks create financial accessibility to the poor households by offering those financial products and services, which are sustainable through mutual agreement, accountability and personal relationships.
The World Bank Global Findex (2019) which assessed financial inclusion worldwide, routinely finds that unaffordability and inaccessibility are the most cited reasons for people not operating a formal savings account (Demirguc-Kunt and Klapper, 2012). Mobilizing funds outside the banking system opens a large stream of additional resources for investment (Porter, 2015). Churk (2015) notes that SACCOS should develop strategies which address the root cause of poverty such as limited capital, insufficient finance, inadequate human resources and other support services that meet the

demands of the rural population other than concentrating in only business.
Olga et al. (2017) posit that most critical challenges facing co-operatives among others include lack of concessionary credit facilities by financial institutions and lack of standardized accounting standards. Aregawi (2014) notes that co-operatives could not generate an adequate substantial amount of profit in their operations. Tumwine et al. (2015) argue that all stakeholders should be involved in the review of the loan terms, and such terms should be adequately communicated to all stakeholders. Members should be allowed to withdraw from their savings when need arises and leave minimum balance as required. Chowa et al. (2010) argue that wealth, proximity to financial institutions, financial education and financial incentives may have an impact on higher savings performance. Further challenges are inadequate infrastructure, enormous documentation requirements and high account fees are associated with lower levels of savings culture (Beck et al., 2008). Evidence indicates very poor savings and investment culture in developing economies relative to most developed economies. However, Chowa et al. (2012) note that despite the barriers, poor people in sub-Saharan Africa, including those in rural areas still save. Banerjee et al. (2010) establish that family planning policies have contributed to an increase in household saving and wealth accumulation for retirement. Alesina and Giuliano (2010) demonstrate that differences in family ties can help explain how a family can have and adopt a saving culture, which would supplement household income in future. Thus stronger family ties could lead to more saving, and the reverse is true.
Fraczek (2011) notes that interest rates motivate and lure one into saving culture. Interest rates on savings are based upon the stated period; fixed deposit has higher interest rates, which can also be negotiated, while ordinary savings pays lower interest rates (Thomas, 2007). A proportionate loan amount that matches with the client needs, reasonable interest rate and adequate savings, regular and consistent repayment of loans and achievement of the scale can lead to sustainability (Nabulya, 2007). Credits enable the population to expand the generation of income activities and support payments of the necessities, which included health, food and education. Urassa and Kwai (2015) argue that the provision of investment advisory services and small loan are some of the financial services offered by formal financial institutions. Access to financial products and services plays a significant role in the fight against poverty. Formal financial institutions take customers‟ saving history seriously while advancing any loan to a client (CGAP, 2010). Cheruiyot et al. (2012) observe that the primary objective of SACCOS is the promotion of the economic interest of the welfare of the members of the community by providing borrowings that supports the production and thus reflects the various products offered
Eton et al. 281 by SACCOS. Ksoll et al. (2016) found out that access to microcredit facilities through village savings and loan associations improved on the welfare of its members through improved food security and strengthened household income indicators. Poverty reduction Reducing poverty requires one to understand poverty and its various dimensions. Nussbaum and Sen (1993) argued that any definition of poverty should be based on people‟s capabilities, while Townsend (1979) gave a broader definition of poverty not limited only to subsistence needs. He described poverty as the inability of a person to participate in society due to lack of resources. This resource-based definition of poverty focusing on basic needs has resulted in the “one dollar a day” definition of poverty. It has been criticized for not including non-material elements and also seen as being confined to areas of life where participation or consumption in society are determined by command over financial resources (Lister, 2004). World Bank (2014) describes poverty as “hunger, lack of shelter, being sick and unable to see a doctor, inability to read and write and lack of access to school, high infant mortality, maternal mortality, lack of job and fear of the future. Poverty has become a multidimensional problem in developing and underdeveloped countries. World Bank (2018b) observes that 2.4 billion people live in deplorable conditions spending less than US$ 1.90 each day. These poor low-income households are unable to invest in any meaningful venture due to inadequate access to cheap and affordable credit and financial support.
FAO (2017) notes that the extremely poor people are often located in remote or isolated rural areas, which are poorly connected with the surrounding rural areas. However, investments in infrastructure and basic services often do not reach the more isolated areas, which tend to be more disaster-prone, thus lowering the poverty reduction effect on income growth for more marginalized areas (Barbier and Hochard, 2014). While most countries world over would want to achieve the Sustainable Development Goals to end poverty around the globe, the problem seems to be persistent in developing countries (Elem, 2018). Multidimensional poverty measures are excellent complements of income and consumption because poverty measures provide more in-depth insight into the degrees of deprivation and vulnerability of the extreme poor. OPHI (2018) observes that traditional income-based poverty is measured by capturing the severe deprivations faced by individuals in terms of health, education and living standards.
Khan et al. (2017) point out that micro-credit and training programs cannot reach the poorest and three- quarters of the low-income households do not benefit from any forms of assistance from development partners.
282 Afr. J. Bus. Manage. Wichterich (2017) argues that micro-credit creates indebtedness that can cause long-term poverty. Panigrahi (2017) observes that inadequate training programs negatively affect the way households utilize their credits due to incompetence in managing their finance. Lack of capacity and week capital base often force most grassroots SACCOS to offer minimal product range, thereby leaving them unattractive to a broad segment of the rural population (CRDB Microfinance, 2015). SACCOS seem unevenly distributed and have difficulties attracting savings deposits from their members; consequently; lack of saving remains a significant blockage to growth for SACCOS (Distler and Schmidt, 2011). Similarly, (Banturaki, 2012) argues that frauds such as corruption, embezzlement, mis-appropriation of funds and theft of assets result in high administrative cost, which is detrimental to SACCOS‟ growth. Anania et al. (2015) note the need to promote good governance practices among SACCOS, provide education and training, increase capacity; ensure proper financial management, better accounting practices, keep records properly and networking.
Eton et al. (2019b) reveal the need for a comprehensive analysis on the current poverty reduction models and their impact on the very poor, in terms of production capacity, owning productive assets and living a meaningful life. Fadun (2014) observes that continuous efforts on the part of stakeholders in a financial sector are necessary to decrease the number of people that are excluded from financial services, thereby alleviating poverty and facilitate income redistribution in developing countries. Rutten and Mwangi (2012) argue that the redistribution of wealth affects the overall level of poverty within countries, although it is difficult to trace the society's segments affected. While it is not the only factor behind growth and poverty reduction, Mmolainyane and Ahmed (2015) consider it as one of the sources, in addition to factors like regulatory issues, governance, law, zero tolerance to corruption and competition are behind raising poverty. Most governments and development partners have changed their focus mainly in the areas of improving welfare, general living standards of the citizens, and economic development to targeting wealth creation, employment generation and poverty reduction (CBN, 2018).
Financial services
Financial service refers to the process involved in acquiring a financial good such as buying a house, a car or a piece of land. In this case, a mortgage loan to acquire a house and an insurance policy to cover a car constitute financial services (Asmundson, 2011; Turkekole, 2015). A report by World Economic Forum (2015) identifies six financial services: payments, market provision, investment management, insurance, deposit and lending, and capital raising. While the services are
critical to poverty reduction, deposit and lending, and capital raising have inclinations to rural consumers. Access to affordable financial services, which is a characteristic of developed financial systems, is critical to poverty reduction. The use of basic financial services improves household incomes, increases resilience and lives (Pazarbasioglu et al., 2020). Access to financial services is critical to reducing persistent income inequality. However, the mechanism remains a challenge to many governments, especially in Africa, where one out of five households lack formal access to financial services (Beck et al., 2009). Financial services like banking, saving and investment, debt and equity financing protect the public from uncertainty (Turkekole, 2015). Innovations in financial services focus on adopting mobile banking and internet to improve consumer satisfaction (Mohammad, 2016). However, the adoptions are contextually productive in developed than developing economies. A study by Daze and Dekens (2016) focused on financial services and climate risk management in Uganda. They found that access to savings and credit supports credit risk management especially by diversifying livelihood and sources of income. While banks cater to wealthier clients, poverty reduction requires lending to individuals and entrepreneurs who lack a credit history or official income records (World Bank, 2009). The majority of the populations live outside urban centers and lack access to infrastructure like banking, transport, electricity and roads. This leaves them to one financial service competitor: the mobile money, yet majority of the rural customers lack proper training and interaction with the service (Scharwatt et al., 2014). Alongside infrastructural limitations, customers suffer risks associated to use of financial services. Customers, especially from rural communities encounter difficulty in judging the appropriateness and quality of financial products (Ennew and Sekhon, 2007). There are gaps in the way financial services institutions inspire trust in rural consumers. This seems to justify the role of informal institutions in providing financial services to Uganda‟s rural population. Informal financial institutions serve approximately 12% of the rural population in Uganda (Kironde, 2015).
Cooperative and saving societies and poverty reduction
Ramath and Preethi (2014) observe that SACCOS provide small loans and savings facilities to financially excluded individuals from commercial services, and this help develops a key strategy in poverty reduction throughout the world. Bwana and Mwakujonga (2013) note that SACCOS contribute to Gross Domestic Products, leaving most citizens deriving their livelihood through co-operative movements. The establishment of co-operative societies centered on economic growth and development programs that aim at poverty reduction
through access to financial services to the micro-entrepreneurs, low-income earners and poor citizens that cannot access similar services from formal banking institutions would be a better strategy (Edeme and Nkalu, 2019). SACCOS play their share of bringing about broad-based development and poverty alleviation (Tesfay and Tesfay, 2013). Urassa and Kwai (2015) find a significant impact of SACCOS on poverty reduction. Microfinance initiatives can effectively address material poverty, the physical deprivation of goods, services, and the income to attain them (Micro Finance Africa, 2018). A Microfinance is known as microcredit with a low-interest rate with a potential tool to encourage the existing and new business opportunities that can subsequently create employment, extra income, and individual monthly income for all as well as the poor (Kaboski and Townsend, 2012). The poor needs access to a variety of financial services such as deposit accounts, credit, and microfinance and payment/transfer accounts. These products can provide households with consumption smoothing and prevent income fluctuation (Akpandjar et al., 2013). Most notably microfinance borrowers often take business loans and use it for other purpose but not limited to medical cost, school fees, Land purchase, burial expenses and others, which makes them venerable (Chan and Lin, 2013).
Providing financial access to the poor is believed to reduce the level of poverty and inequality amongst the community (Miled and Rejeb, 2018). Macroeconomic stability and a sustainable balance of payments should be able to reduce poverty through a trickle-down effect, primarily through job creation. Garon (2013) in his study found out that many countries that have introduced public saving banks are also ranked amongst the highest savings countries today. Awojobi (2019) establishes that while microcredit was a strategy for poverty reduction, some challenges hinder the accessibility to microcredit. Eton et al. (2019a) note that poverty-related problems can be solved as long as citizens are in a position to access cheap capital. This would call for government interventions to review its microcredit policy. Hussaini and Chibuzo (2018) observes that for financial inclusion to be more robust in the rural areas and to make microfinance a more effective means in poverty reduction other services such as education loan, technological support loan, skills training and housing appliance loan should be included in microfinance services. Financial inclusion is a tool that promotes growth and stability while reducing poverty (Soederberg, 2013). Modern economic growth is not possible without a well-functioning monetary and financial system (Suri et al., 2012). Access to finance is an integral part of the mainstream thinking on economic development based on a countries strategy. Omoro and Omwange (2013) observe that the utilization of microfinance loans results in improved household consumption, the standard of living and leading to earning of extra income as well as reduction of
Eton et al. 283 unemployment. Also, Alio et al. (2017) note that the government should invest more in SACCOS since they serve to improve the welfare of especially rural households and improve their income. METHODOLOGY The study adopted a cross-sectional survey design. In a cross-sectional study, the researcher collects participants‟ opinions, attitude and trend on a given phenomenon at one point in time. In the present study, the researchers adopted a cross-sectional design to allow for gathering unbiased and independent data from participants on SACCOs and poverty reduction. The study took a quantitative approach that formed a background for reasoning and debating participants‟ opinions. Both primary and secondary information were consulted in developing and designing self-administered questionnaires. The study was conducted in the districts of Lira, Apac and Dokolo in Lango sub-region Northern Uganda and Kabale, Kisoro and Rukungiriin Kigezi sub-region southwestern Uganda. The choice of the districts under study was because the revival of co-operatives had taken shape in those districts. Thirty registered co-operatives were selected from the chosen districts (Ministry of trade, industry and Cooperatives 2017). A target population of 1900 with 320 participants constituting the study sample. The sample size was determined using the Morgan 1970 table. Registered members in registered SACCOs in the selected districts constituted the unit of analysis. From the chosen districts, registered saving groups were chosen to determine the number of respondents needed. We adopted a probability proportional to determine the sample size for each of the Cooperative and saving societies. The categories of participants included executive members, ordinary members, employees and co-operative officers, who were selected purposively. Ordinary members, employees and cooperative officers were randomly selected while executive members were purposively selected (Amin, 2005). Descriptive, Bivariate and Multivariate data analysis was used. Chi-square test was conducted where the correlation of the emerging factor components under co-operative societies was determined, and those of poverty reduction was examined in order to establish the strength of the relationship between co-operatives and saving societies and poverty reduction in Lango and Kigezi sub-region. Regression analysis was used to provide a linear prediction of the study.
RESULTS AND DISCUSSION
The researchers summarized participants' demographic characteristics on the frequency table. Frequency tables helped to bring out nature and unique attributes embedded in these characteristics. Table 1 summarizes the demographic characteristics of participants. Participation by gender indicates that females dominated the study than men from both regions. In Lango sub-region, 76.9% were female, while 23.1% were male. In Kigezi, 69.7% were female, while 30.03% were male. The dominance of females is associated with the fact that women have less economic assets to present to formal financial institutions as collateral security compared to men. Men in both communities majorly own such assets like land, land titles and cows, which women lack. This implies that women are likely to join co-operative

284 Afr. J. Bus. Manage. Table 1. Demographic characteristics.
District Gender Age bracket Marital Status Highest Level of Education
Categories Male Female 21 - 30 31 – 40 41 – 50 >50 Single Married Others Primary Secondary Tertiary
Lira 6.3 48.3 14.0 29.4 11.2
3.5 30.1 21.0 11.2 39.2 4.2
Dokolo 11.2 13.3 14.0 9.1 1.4
2.8 16.1 5.6 5.6 18.2 0.7
Apac 5.6 15.4 9.8 11.2
2.8 15.4 2.8 7.7 12.6 0.7
Total (N=143) 23.1 76.9 37.8 49.7 12.6
9.1 61.5 29.4 24.5 69.9 5.6
Kabale 11.5 43.0 20.6 21.8 4.8 7.3 12.7 29.7 12.1 15.8 36.4 2.4
Rukungiri 13.3 17.6 16.4 12.7 0.6 1.2 10.9 12.7 7.3 9.7 18.8 2.4
Kisoro 5.5 9.1 8.5 4.2 1.8
5.5 6.7 2.4 1.8 11.5 1.2
Total (N=165) 30.3 69.7 45.5 38.8 7.3 8.5 29.1 49.1 21.8 27.3 66.7 6.1
Source: Field data (2019).
associations than their male counterparts. Secondly, most of the co-operative associations aim at empowering the poor, of which women are amongst the poorest of Uganda's poverty-stricken population (UBOS, 2018). Therefore, recognizable participation of women in the study comes as no surprise.
In Lango sub-region, most of the women (48.3%) came from Lira district while in Kigezi sub-region; most of the women (43.0%) came from Kabale district. The dominance of these districts owes from the fact that Lira and Kabale are Municipalities, with more economic and financial attractions than the rest of the districts under investigation. Secondly, the level of financial inclusion in Lira and Kabale is relatively higher than the other districts in which the study was conducted. The implication of financial inclusion justifies the rate of participation among these districts. In Lango sub-region, Dokolo district had the highest percentage of men (11.2%) who took part in the study‟ while Kigezi sub-region, Rukungiri district had the highest percentage of male participants (13.3%).
In respect to age brackets of participants, majority participants from Lango sub-region fell within 31 -40 years (49.7%), while in Kigezi sub-region, majority of the participants fell within 21-30 years (45.5%). The statistics in Lango might relate to higher dependency burden and the need to survive independent of men, while in Kigezi, the statistics are partly due to financial knowledge and partly due to lack of land for cultivation, which pushes women into accessing credit to set-up income-generating projects. The statistics indicate that no participants older than 50 years came from Lango sub-region. In contrast, at least 8.5% of the same age bracket came from Kigezi sub-region, and particularly from Rukungiri and Kabale districts. Perhaps the older persons in Kigezi are empowered economically more than those from Lango sub-region, who survive on the UGX 25,000 per month from the Social Assistant Grant for Elders (SAGE) project.
In respect to marital status, Lango sub-region had more of the married participants (61.5%) than the Kigezi sub-region (49.1%). These statistics might relate to
differences in the level of early marriages in both regions. Among the single participants, however, 29.1% came from Kigezi sub-region; while only 9.1% came from Lango sub-region. Perhaps the level of financial literacy is higher among the youths from Kigezi sub-region than from Lango sub-region. The study does not reveal significant differences in the percentage of participants who indicated the 'others' option. However, most of the participants from the two regions who indicated the 'others' option pointed to 'separated' followed by divorce and widowhood.
In respect to education, most of the participants from Lango sub-region (69.9%) and Kigezi sub-region (66.7%) indicated 'secondary' as their highest level of education compared to 'tertiary', which was the least. In practice, most of the educated individuals among which tertiary graduates belong tend to bank with formal financial institutions than with co-operative associations. They consider saving with banks to be more secure and safe than with savings and co-operative associations. The study employed descriptive statistics to portray the status of co-operatives and poverty reduction in Lango and Kigezi sub-region. The researchers adopted the following range of scores to interpret mean scores for financial services, saving culture or poverty reduction: If 0.0 < mean < 2.0, financial services, saving culture or poverty reduction is „irrelevant.‟ If 2.0< mean < 3.0, financial services, saving culture, or poverty reduction is 'moderate.' If 3.0 < mean < 4.0, financial services, saving culture or poverty reduction is „relevant.‟ If 4.0 < mean < 5.0, financial services, saving culture, or poverty reduction is 'very high.' (Table 2). The study considered the financial services provided by co-operatives in Lango sub-region (mean = 3.674; Std. = 0.528) and Kigezi sub-region (mean = 3.098; Std. =0.531) to be relevant to peoples' lives and the economy of Uganda. The standard deviations further indicate that participants' opinions were consistent and therefore,
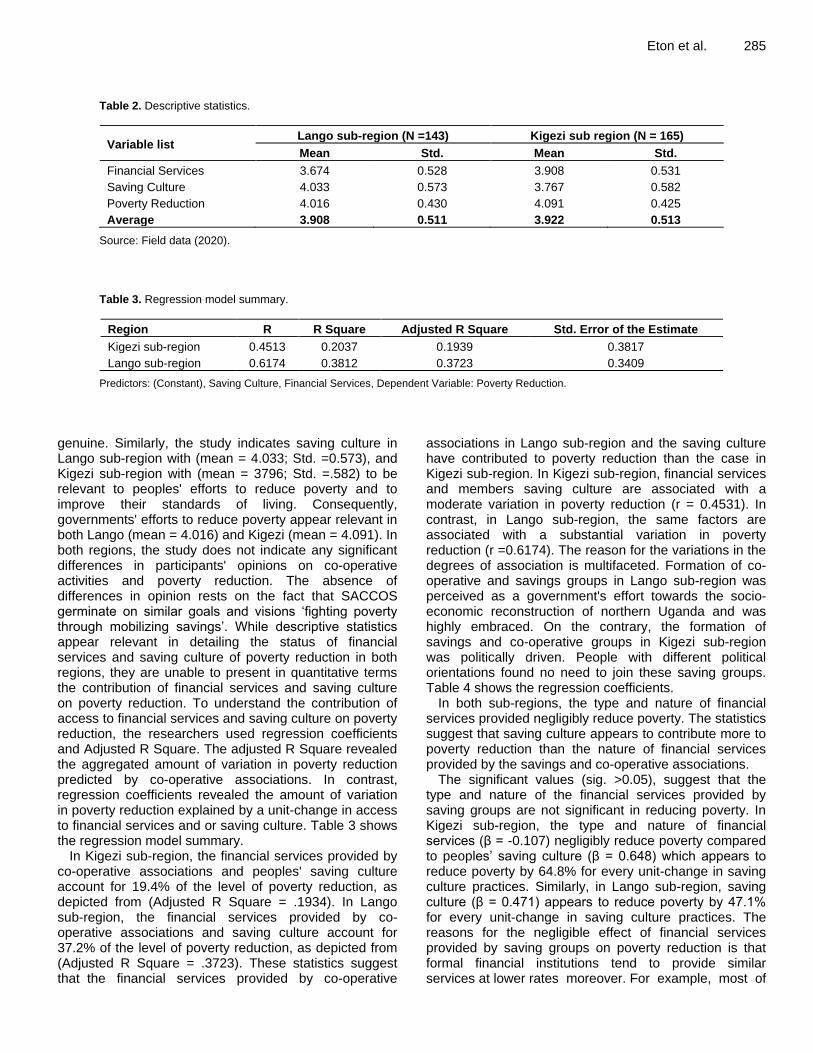
Eton et al. 285
Table 2. Descriptive statistics.
Variable list Lango sub-region (N =143) Kigezi sub region (N = 165)
Mean Std. Mean Std.
Financial Services 3.674 0.528 3.908 0.531
Saving Culture 4.033 0.573 3.767 0.582
Poverty Reduction 4.016 0.430 4.091 0.425
Average 3.908 0.511 3.922 0.513
Source: Field data (2020).
Table 3. Regression model summary.
Region R R Square Adjusted R Square Std. Error of the Estimate
Kigezi sub-region 0.4513 0.2037 0.1939 0.3817
Lango sub-region 0.6174 0.3812 0.3723 0.3409
Predictors: (Constant), Saving Culture, Financial Services, Dependent Variable: Poverty Reduction.
genuine. Similarly, the study indicates saving culture in Lango sub-region with (mean = 4.033; Std. =0.573), and Kigezi sub-region with (mean = 3796; Std. =.582) to be relevant to peoples' efforts to reduce poverty and to improve their standards of living. Consequently, governments' efforts to reduce poverty appear relevant in both Lango (mean = 4.016) and Kigezi (mean = 4.091). In both regions, the study does not indicate any significant differences in participants' opinions on co-operative activities and poverty reduction. The absence of differences in opinion rests on the fact that SACCOS germinate on similar goals and visions „fighting poverty through mobilizing savings‟. While descriptive statistics appear relevant in detailing the status of financial services and saving culture of poverty reduction in both regions, they are unable to present in quantitative terms the contribution of financial services and saving culture on poverty reduction. To understand the contribution of access to financial services and saving culture on poverty reduction, the researchers used regression coefficients and Adjusted R Square. The adjusted R Square revealed the aggregated amount of variation in poverty reduction predicted by co-operative associations. In contrast, regression coefficients revealed the amount of variation in poverty reduction explained by a unit-change in access to financial services and or saving culture. Table 3 shows the regression model summary.
In Kigezi sub-region, the financial services provided by co-operative associations and peoples' saving culture account for 19.4% of the level of poverty reduction, as depicted from (Adjusted R Square = .1934). In Lango sub-region, the financial services provided by co-operative associations and saving culture account for 37.2% of the level of poverty reduction, as depicted from (Adjusted R Square = .3723). These statistics suggest that the financial services provided by co-operative
associations in Lango sub-region and the saving culture have contributed to poverty reduction than the case in Kigezi sub-region. In Kigezi sub-region, financial services and members saving culture are associated with a moderate variation in poverty reduction (r = 0.4531). In contrast, in Lango sub-region, the same factors are associated with a substantial variation in poverty reduction (r =0.6174). The reason for the variations in the degrees of association is multifaceted. Formation of co-operative and savings groups in Lango sub-region was perceived as a government's effort towards the socio-economic reconstruction of northern Uganda and was highly embraced. On the contrary, the formation of savings and co-operative groups in Kigezi sub-region was politically driven. People with different political orientations found no need to join these saving groups. Table 4 shows the regression coefficients.
In both sub-regions, the type and nature of financial services provided negligibly reduce poverty. The statistics suggest that saving culture appears to contribute more to poverty reduction than the nature of financial services provided by the savings and co-operative associations.
The significant values (sig. >0.05), suggest that the type and nature of the financial services provided by saving groups are not significant in reducing poverty. In Kigezi sub-region, the type and nature of financial services (β = -0.107) negligibly reduce poverty compared to peoples‟ saving culture (β = 0.648) which appears to reduce poverty by 64.8% for every unit-change in saving culture practices. Similarly, in Lango sub-region, saving culture (β = 0.471) appears to reduce poverty by 47.1% for every unit-change in saving culture practices. The reasons for the negligible effect of financial services provided by saving groups on poverty reduction is that formal financial institutions tend to provide similar services at lower rates moreover. For example, most of
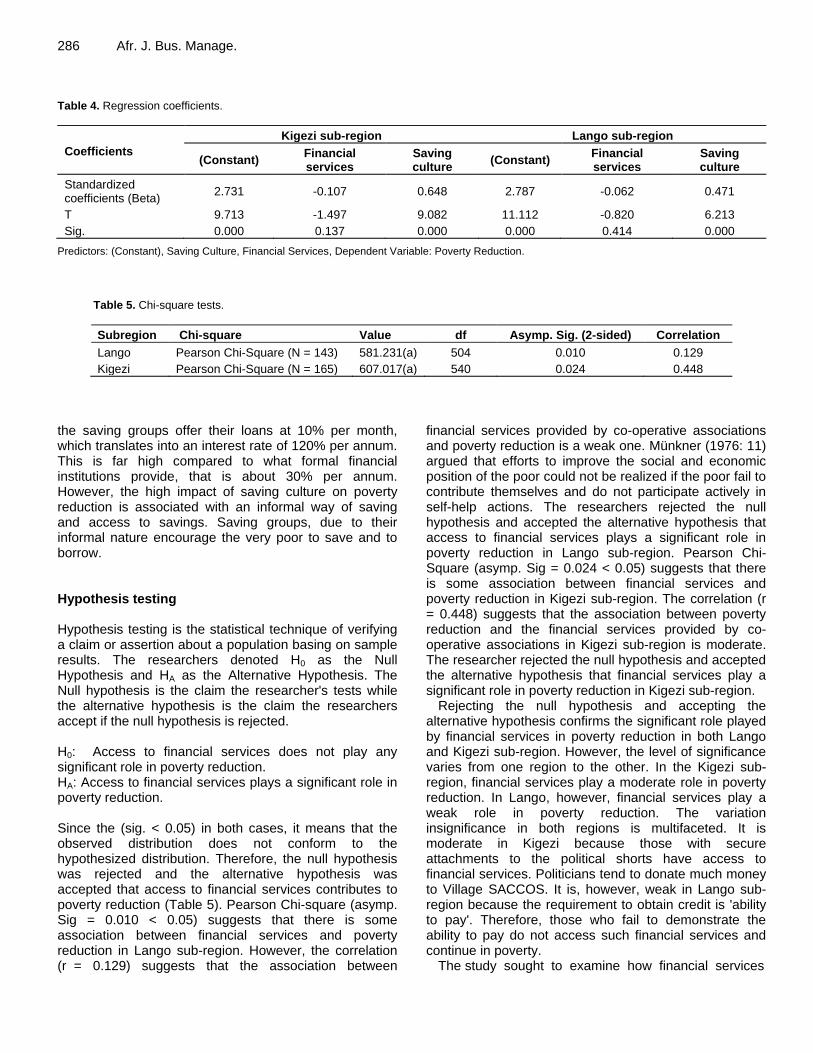
286 Afr. J. Bus. Manage. Table 4. Regression coefficients.
Coefficients
Kigezi sub-region Lango sub-region
(Constant) Financial services
Saving culture
(Constant) Financial services
Saving culture
Standardized coefficients (Beta)
2.731 -0.107 0.648 2.787 -0.062 0.471
T 9.713 -1.497 9.082 11.112 -0.820 6.213
Sig. 0.000 0.137 0.000 0.000 0.414 0.000
Predictors: (Constant), Saving Culture, Financial Services, Dependent Variable: Poverty Reduction.
Table 5. Chi-square tests.
Subregion Chi-square Value df Asymp. Sig. (2-sided) Correlation
Lango Pearson Chi-Square (N = 143) 581.231(a) 504 0.010 0.129
Kigezi Pearson Chi-Square (N = 165) 607.017(a) 540 0.024 0.448
the saving groups offer their loans at 10% per month, which translates into an interest rate of 120% per annum. This is far high compared to what formal financial institutions provide, that is about 30% per annum. However, the high impact of saving culture on poverty reduction is associated with an informal way of saving and access to savings. Saving groups, due to their informal nature encourage the very poor to save and to borrow. Hypothesis testing Hypothesis testing is the statistical technique of verifying a claim or assertion about a population basing on sample results. The researchers denoted H0 as the Null Hypothesis and HA as the Alternative Hypothesis. The Null hypothesis is the claim the researcher's tests while the alternative hypothesis is the claim the researchers accept if the null hypothesis is rejected. H0: Access to financial services does not play any significant role in poverty reduction. HA: Access to financial services plays a significant role in poverty reduction. Since the (sig. < 0.05) in both cases, it means that the observed distribution does not conform to the hypothesized distribution. Therefore, the null hypothesis was rejected and the alternative hypothesis was accepted that access to financial services contributes to poverty reduction (Table 5). Pearson Chi-square (asymp. Sig = 0.010 < 0.05) suggests that there is some association between financial services and poverty reduction in Lango sub-region. However, the correlation (r = 0.129) suggests that the association between
financial services provided by co-operative associations and poverty reduction is a weak one. Münkner (1976: 11) argued that efforts to improve the social and economic position of the poor could not be realized if the poor fail to contribute themselves and do not participate actively in self-help actions. The researchers rejected the null hypothesis and accepted the alternative hypothesis that access to financial services plays a significant role in poverty reduction in Lango sub-region. Pearson Chi-Square (asymp. Sig = 0.024 < 0.05) suggests that there is some association between financial services and poverty reduction in Kigezi sub-region. The correlation (r = 0.448) suggests that the association between poverty reduction and the financial services provided by co-operative associations in Kigezi sub-region is moderate. The researcher rejected the null hypothesis and accepted the alternative hypothesis that financial services play a significant role in poverty reduction in Kigezi sub-region.
Rejecting the null hypothesis and accepting the alternative hypothesis confirms the significant role played by financial services in poverty reduction in both Lango and Kigezi sub-region. However, the level of significance varies from one region to the other. In the Kigezi sub-region, financial services play a moderate role in poverty reduction. In Lango, however, financial services play a weak role in poverty reduction. The variation insignificance in both regions is multifaceted. It is moderate in Kigezi because those with secure attachments to the political shorts have access to financial services. Politicians tend to donate much money to Village SACCOS. It is, however, weak in Lango sub-region because the requirement to obtain credit is 'ability to pay'. Therefore, those who fail to demonstrate the ability to pay do not access such financial services and continue in poverty.
The study sought to examine how financial services

provided by co-operative associations contribute to poverty reduction in the two regions. The study established a non-significant contribution of financial services on poverty reduction in both regions. The finding is in agreement with World Bank (2007), where it was established that low-income households have inadequate access to cheap and affordable credit and financial support. Consequently, they are unable to invest in meaningful ventures that help them come out of poverty. In line with Kigezi and Lango sub-regions, the available credit offered by SACCOS is not cheap per say. For instance, most of the savings and co-operative groups offer credit at 10% per month, which translates into 120% per annum. This rate is far above the 30% per annum, which is offered by commercial banks. While the rate at which SACCOS offer credit appears 'cheap' theoretically, it is practically expensive and therefore inadequate to help households overcome poverty. This observation supports Wichterich (2017) who concludes that micro-credit creates long-term indebtedness among rural households. Contrary to the rate at which SACCOS provide interest, the very nature of households in terms of managing their finance renders financial services inadequate in poverty reduction. Without exception of whether in Kigezi or Lango sub-regions, rural households, who are the targets of SACCOS, are incompetent in managing finances. This observation is supported by Panigrahi (2017) who observes that most grassroots SACCOS lack adequate programs that train households on how to utilize financial credit. Real cases of incompetence in financial management at household level reveal how many rural households borrow money for a business start-up but channel it to acquiring household assets and consumption.
The study determined if saving culture contributes to poverty reduction in Lango and Kigezi sub-region. The findings established a significant contribution of saving culture on poverty reduction, with a slightly higher contribution of savings culture on poverty reduction in Kigezi than in Lango. The findings is supported Pearlman (2012) who established that the incomes generated from micro-credit could be used in education, expenditure and addressing economic vulnerability. In reality, if members can put to the right use of their savings, they are likely to reduce their financial vulnerability and shocks. Saving culture in Kigezi sub-region is associated to political motivations and backing while in Lango sub-region, saving culture is associated with responding to government programs that were aimed at reconstructing northern Uganda after the two decades of insurgency. The difference in the two places, however, is associated with political drivers. In Kigezi sub-region, SACCOS have the support of the ruling government, which motivates savers. In Lango sub-region, most of the politicians are opposition supporters, which affect financial support from the ruling government. Consequently, the low inflow of financial resources from the ruling government translates
Eton et al. 287 into low savings and low poverty reduction.
The findings, however, disagree with (Begajo, 2018) who observed that savings might not contribute to poverty reduction due to irregular savings by members and lack of collaboration between savers and financial institutions. More than often, savers tend to divert savings from economic to non-economic goals. The findings disagrees with that of Bateman (2017), who observed that those who get involved in multiple loans become heavily indebted, and such actions do not reduce poverty. The researcher finds that though actions on the part of savers may not contribute to poverty reduction, some actions on the part of saving associations do not contribute to poverty reduction. For instance, some co-operatives lack concessionary credit facilities and standardized accounting standards (Olga et al., 2017), have limited capital, insufficient finance, inadequate human resources and support services (Churk, 2015). These practices handicap SACCOS from contributing to poverty reduction in Uganda.
The study sought to establish the relationship between co-operatives and savings and poverty reduction in the two regions of Kigezi and Lango. The relationship between co-operative associations and poverty reduction in Kigezi and Lango was moderate and vigorous, respectively. The findings agrees with (Ramath and Preethi, 2014), who established that SACCOS provide small loans and saving facilities to those who are financially excluded from commercial services. The poor can use these loans and savings to establish income-generating projects for their households. The findings agree with (Bwana and Mwakujonga, 2013; Edeme and Nkalu, 2019) who assert that SACCOS contribute to GDP since citizens derive their livelihood and provide access to financial services to micro-entrepreneurs, low-income earners and poor citizens. The researcher‟s findings maintain that the way individuals use finance from SACCOS determines how such finances contribute to poverty reduction. Access to financial services from SACCOS has coupled with improper use does not contribute to poverty reduction. The study also tested the hypothesis that access to financial services does not play any significant role in poverty reduction. The researchers rejected the null hypothesis and accepted the alternative hypothesis that access to financial services plays a significant role in poverty reduction in both Lango and Kigezi sub-region. The findings is supported Urassa and Kwai (2015) as well as Miled and Rejeb (2018) who found a significant impact of SACCOS in poverty reduction. CONCLUSION AND IMPLICATIONS The study examined the contribution of co-operative and saving societies on poverty reduction, drawing reference to Lango and Kigezi sub-region. The study established a

288 Afr. J. Bus. Manage. moderate association between co-operative activities and poverty reduction in Kigezi sub-region, and a strong association in Lango sub-region. The introduction of SACCOS in Lango sub-region followed a government program to reconstruct northern Uganda after the Lord's Resistance Army (LRA) war that lasted close to two decades. Consequently, several rural poor from the north embraced SACCOS as a fight against poverty. In Kigezi, however, SACCOS were politically introduced and popularized under the multiparty system. Consequently, their economic effect on the poor Bakiga took a political propensity. These conclusions appear to contradict our hypothetical conclusion, in which we accepted the claim that access to financial services plays a moderate and significant role in poverty reduction in Kigezi sub-region, and a weak role in Lango sub-region. The researchers maintain that individuals with secure attachments to politically backed SACCOS in Kigezi sub-region have access to financial services and are likely to take strides in poverty reduction than those who do not have. In Lango sub-region, however, individuals with 'the ability to pay' have access to financial services and are likely to take strides in poverty reduction than their counterparts who do not have. In effect, a good number of older persons in Kigezi sub-region appear to be economically empowered. At the same time, their counterparts from Lango sub-region survive on UGX 25,000 under the SAGE program. The contribution of saving culture to poverty reduction is likely to be higher than access to financial services because SACCOS promote informal savings, which are characteristic of the rural poor in both Kigezi and Lango sub-region. The fact that financial services play a significant role in poverty reduction confirms the relevancy of the principal-agency theory in explaining the dynamics in co-operatives and offers an extension to its adoption in explaining government interventions in uplifting the welfare of its citizenry. These findings offer foundations to policy reviews and designs in poverty reduction in especially in Uganda, where the overall vision and mission of promoting SACCOS stands in a mess. The government, through the ministry of co-operatives, should revise the tenets upon which co-operative movements were built. This will shape the functioning of SACCOS to the benefit of those who are incapacitated due to poverty. The researchers found that more women than men are members of SACCOS, which relates to the ownership of commercial assets (land and cows). Accordingly, women cannot access financial services from formal institutions, which require collateral security and guarantors. Government, through the Ministry of Gender, should continue prioritizing women economic empowerment to empower women socially and economically. The researchers found that most of the participants from the two regions had 'secondary' as the highest level of education. Government and district leaders should sensitize girls to join tertiary education, which can help them to be economically empowered. The
study established that financial services contribute to poverty reduction but to smaller degrees than saving culture. Future researchers should consider examining the limiting factors to access to financial services and their effect on poverty reduction in Uganda.
CONFLICT OF INTERESTS
The authors declared no conflict of interest in the work.
REFERENCES Africa Progress Panel (2014). Grain Fish Money: Financing Africa's
Green and Blue Revolutions: Africa Progress Report 2014. Africa Progress Panel.
Akpandjar GM, Quartey P, Abor J (2013). Demand for financial services by households in Ghana. International Journal of Social Economics 40(5):439-457.
Alchian AA, Demsetz H (1972). Production, information costs, and economic organization. American Economic Review 62(5):777-795.
Alesina A, Giuliano P (2010). The Power of the Family. Journal of Economic Growth 15(2):93-125.
Alio D, Okiror JJ, Agea JG, Matsiko FB, Ekere W (2017). Determinants of credit utilization among SACCO members in Soroti District, Uganda. African Journal of Rural Development 2(3):381-388.
Amin ME (2005). Social Science Research Methods: Conception, Methodology and Analysis, Makerere University, Kampala. Available at: https://www.scirp.org/(S(oyulxb452alnt1aej1nfow45))/reference/ReferencesPapers.aspx?ReferenceID=1118650
Anania P, Gikuri A, Hall JN (2015). SACCOS and members‟ expectations: Factors affecting SACCOS capacity to meet members‟ expectations. In A Paper Presented to the Co-operative Research Workshop held on 24th March, 2015 at JK Nyerere Hall, Moshi Co-operative University (MoCU).
Aniodoh AN (2018). The effect of Cooperative Professionals in National Development: A Study of selected Co-operatives in Enugu State. International Journal of Academic Research in Economics and Management Sciences 7(3):441-456.
Aregawi GT (2014). Financial performance of rural saving and credit cooperatives in Tigray, Ethiopia. Research Journal of Finance and Accounting 5(17):63-74.
Asmundson I (2011). Back to Basics-What are financial services? How consumers and businesses acquire financial goods such as loans and insurance. Finance and Development-English Edition 48(1):46-47.
Awojobi ON (2019). Microcredit as a strategy for poverty reduction in Nigeria: a systematic review of literature. Global Journal of Social Sciences 18(1):53-64.
Banerjee A, Meng X, Qian N (2010). The Life Cycle Model and Household Savings: Evidence from Urban China. mimeo, Yale University (New Haven: Yale University).
Banturaki JA (2012). Tanzania co-operatives: their role in socio- economic development. Perspectives for Co-operatives in East Africa. Kampala.
Barbier EB, Hochard JP (2014). Poverty and the spatial distribution of rural population. The World Bank. Available at: https://elibrary.worldbank.org/doi/abs/10.1596/1813-9450-7101
Bateman M (2017). Post-War reconstruction and development in Cambodia and the destruction role of microcredit. Paper presented at the 8
th International Scientific Conference” Future World by 2050”,
Pula Croatia, June 1-3rd
, 2017. Beck T, Demirguc-Kunt A, Honohan P (2009). Access to financial
services: Measurement, impact and policies. World Bank Observer. Beck T, Demirguc-Kunt A, Peria MS (2008). Banking Services for
everyone?Barriers to bank access and use around the world. World Bank Economic Review 22:397-430.

Begajo MK (2018). The Role of Saving and Credit Cooperatives in
Improving Rural Micro Financing: The Case of Bench Maji, Kaffa, Shaka Zones.
Brown A, Mackie P, Smith A (2015). Microfinance and economic growth: Rwanda. Inclusive Growth: Rwanda Country Report, Cardiff School of Geography and Planning.
Bwana K, Mwakujonga J (2013). Issues in SACCOS Development in Kenya and Tanzania. The Historical and Development Perspectives. Developing Countries Studies 1(3):5.
Central Bank of Nigeria (CBN) (2018). A Quarterly Publication of the Financial Secretariat 2
nd Quarter. Central Bank of Nigeria Financial
Inclusion Newsletter. 2018 CGAP (2010). Advancing Saving Services: Resource Guide for
Funders. Available at: https://www.cgap.org/research/publication/advancing-savings-services-resource-guide-funders
Chan SH, Lin JJ (2013). Financing of Micro and Small enterprises in China: An exploratory study. Strategic Change 22:431-446.
Cheruiyot TK, Kimeli CM, Ogendo SM (2012). Effect of saving and Credit Co-operative Societies Strategies on Members‟ Saving Mobilization in Nairobi, Kenya. International Journal of Business and Commerce 1(11):40-63.
Chowa GA, Massa RD, Sherraden M (2012). Wealth effects of an asset-building intervention among rural households in sub-Saharan Africa. Journal of the Society for Social Work and Research 3:329-345.
Chowa GAN, Ansong D, Masa R (2010). Assets and Child well-being in developing countries: A research review. Children and Youth Services Review 32:1508-1519.
Churk JP (2015). Contributions of savings and credit co-operative society on Improving Rural Livelihood in Makungu Ward Iringa, Tanzania. Proceedings of the second European Academic Research Conference on Global Business, Economics, Finance and Banking (EAR15Swiss Conference). Zurich-Switzerland, 3-5 July 2015 Paper ID: Z550
Cook ML (1995). The future of U.S. agricultural co-operatives: A neo-institutional approach. American Journal of Agricultural Economics 77(5):1153-1159.
CRDB Microfinance (2015). Common Problems Faced by Grassroots Financial Intermediaries.
Daniels L, Minot N (2015). Is Poverty Reduction Over Stated in Uganda? Evidence from Alternative Poverty Measures. Social Indicators Research 121:115-133.
Daze A, Dekens J (2016). Financial services for climate-resilient value chains: The case of the Centenary Bank in Uganda. International Institute for Sustainable Development (IISD).
Demirguc-Kunt A, Klapper L (2012). Measuring Financial Inclusion: The Global FindexDatabase. Policy Research Working Papers, Washington, DC: The World Bank.
Develtere P, Pollet I, Wanyama F (2008). Cooperating out of poverty: The renaissance of the African co-operative movement. Dar es Salaam, ILO, World Bank Institute.
Dibissa N (2015). Determinants of Savings and Credit Cooperatives Societies (SACCOs) outreach in Addis Ababa. Addis Ababa University, Ethiopia.
Edeme RK, Nkalu CN (2019). Reducing inequality in developing countries through microfinance: Any correlation so far? In handbook research on micro-financial impacts on women empowerment, Poverty and Inequality IGI Global, 2019, 281-301
Elem EO (2018) Sustainable Security in Nigeria through poverty reduction: Issues and Challenges. South East Journal of Political Science 4(2):265-277.
Elem EO (2019). Co-operatives and Eradication of Poverty and Hunger in Rural Communities in South-East Nigeria through Inclusive Sustainable Agricultural Development: Issues and Challenges. United Nations Inter-Agency Task Force on Social and Solidarity Economy.
Ennew C, Sekhon H (2007). Measuring trust in financial services: the Trust Index. Consumer Policy Review 17(2):62-68.
Eton M, Ayiga N, Agaba M, Mwosi F, Ogwel BP (2019a). Small Medium Enterprises (SMEs), Environmental Management and Poverty Reduction in Western Uganda. Available at: http://idr.kab.ac.ug/handle/20.500.12493/178
Eton et al. 289 Eton M, Odubuker PE, Ejang M, Ogwel BP, Mwosi F (2019b). Financial
Accessibility and Poverty Reduction in Northern Uganda, Lango Sub-Region. Available at: http://idr.kab.ac.ug/handle/20.500.12493/159
Food and Agriculture Organization (FAO) (2017). The state of food and agriculture. Leverage food systems for inclusive rural transformation. Rome, FAO. 160p.
Fadun SO (2014). Financial inclusion, tool for poverty alleviation and income redistribution in developing countries: Evidences from Nigeria. Academic Research Journal International 5(3):137-146.
Fraczek B (2011). The factors affecting the level of household savings and their influence on economy development. 8th International Scientific Conference Financial Management of Firms and Financial Institutions. Ostrava: VSB_TU Ostrava.
Garon SM (2013). Promoting Savings and Financial Literacy: Historical and Global Perspectives on the Institutional Framework. Proceedings of the OECD/Infe/Gflec Global Policy Research Symposium To Advance Financial Literacy. Available at: https://www.oecd.org/daf/fin/financial-education/Proceedings_OECD_GFLEC_1st_Symposium_Paris_2013.pdf
Hussaini U, Chibuzo IC (2018). The effects of financial inclusion on Poverty reduction: The moderating effects of microfinance. International Journal of Multidisciplinary Research and Development 5(12):188-198.
Ikua KS (2012). Effect of Credit Management practices on financial Performance of Savings and credit co-operative societies in Hospitality Industry in Nairobi. Masters Thesis, University of Nairobi.
Kaboski JP, Townsend RM (2012). The impact of credit on Village Economies. American Economic Journal: Applied Economics 4(2):98-133.
Khan IH, Bibi S, Javaid A (2017). Solving Poverty through Management: Experience in Pakistan. European Online Journal of Natural and Social Sciences 6:637-645.
Kifle TS (2012). The Impact of Savings and Credit Cooperatives in Ofla Wereda Tigray Region of Ethiopia. European Journal of Business and Management 4(3):78-89.
Kihwele EA, Gwahula R (2015). Impact of Saving and Credit Cooperative Societies in Poverty Reduction. Empirical Evidence from Tanzania. European Journal of Business Management 7(23):104-110.
Kironde SI (2015). Overview of the financial sector in Uganda. Kampala: Bank of Uganda.
Ksoll C, Lilleør HB, Lønborg JH, Rasmussen OD (2013). Impact of Village Savings and Loan Associations: Evidence from a cluster randomized trial. Journal of Development Economics 120:70-85.
Lister R (2004). Poverty. Loughborough University. Mashigo MP, Schoeman CH (2011). Micro credit and the transforming
of uncertainty since 1976: international lessons for South Africa. New Contree 62:149-176.
Mashigo P, Kabir H (2016). Village banks: A Financial Strategy for Developing the South African Poor Households. Banks and bank System 11(2):8-13.
Miled KBH, Rejeb JEB (2018). Can Microfinance Help to reduce poverty? A Review of Evidence from developing countries. Journal of Knowledge Economy 9(2):613-635.
Ministry of Trade, Industry and Cooperatives- Uganda (2017). Sustainable cooperatives, competitive trade and world class industrial products and services. Available at: https://www.devex.com/organizations/ministry-of-trade-industry-and-cooperatives-uganda-60339
Mmolainyane KK, Ahmed AD (2015). The impact of financial integration in Botswana. Journal of Policy Modeling 37(5):852-874.
Mohammad GN (2016). Research on financial services innovations: A quantitative review and future research directions. International Journal of Bank Marketing 34(7):1042-1068.
Momanyi OJ, Njiru A (2016). Financial Risk Management and Performance of Savings and Credit Co-operative Societies in Nakuru East Sub-County, Kenya. International Journal of Research in Business Management 4(4):56-66.
Münkner H (1976). Co-operatives for the Rich or for the Poor? With Special Reference to Co-operative Development and Co-operative Law in Asia. Asian Economies 17:32-54.

290 Afr. J. Bus. Manage. Nabulya J (2007). Loan Terms and Clients Retention. Research report
submitted to school of Postgraduate studies Ndeje University Kampala Uganda.
Nussbaum M, Sen A (1993). The quality of life. Clarendon Press. Olga A, Gladys A, Anyango W (2017). Factors affecting the financial
performance of savings and credit co-operative society in Kenya: A Case of Mwalimu Saving and Credit co-operative society. Imperial Journal of Interdisciplinary Research 3(4):1476-1487.
Omoro NO, Omwange AM (2013). The utilization of microfinance loans and household welfare in the emerging markets. European International Journal of Science 2013:59-78.
Oxford Poverty and Human Development Initiative (OPHI) (2018). Global Multidimensional poverty index 2018. Oxford, UK. Available at: https://ophi.org.uk/wp-content/uploads/G-MPI_2018_2ed_web.pdf
Panigrahi RK (2017). Role of self-help group on Poverty Alleviation: A Study in Western Odisha. International Journal of Research in Business Studies 2:127-136.
Pazarbasioglu C, Mora AG, Uttamchandani M, Natarajan H, Feyen E, Saal M (2020). Digital Financial Services, World Bank Group. Available at: http://pubdocs.worldbank.org/en/230281588169110691/Digital-Financial-Services.pdf
Peace K (2011). Small Savings and Credit Schemes and Financial Accessibility in Rural areas: A Case study of Mitaaana SACCO in Rukungiri District. Master Thesis, Makerere University, Kampala.
Pearlman S (2012). Too Vulnerable for Microfinance? Risk and vulnerability as determinants of microfinance selection in Lima. The Journal of Development Studies 48:1342-1359.
Porter B (2015). A means to an end: The post-2015 future of financial inclusion. New York: UNCDF.
Ramath P, Preethi (2014). Microfinance in India- for Poverty Reduction. International Journal of Research and Development-A Management Review 2(4):20-23. Available at: http://www.irdindia.in/journal_ijrdmr/pdf/vol2_iss4/5.pdf
Richards TJ, Klein KK, Walburger A (1998). Principal-agent relationships in agricultural cooperatives: An empirical analysis from rural Alberta. Journal of Cooperatives 13:21-33.
Royer JS (1999). Co-operative organizational strategies: A neo-institutional digest. Journal of Cooperatives 14:44-67.
Rutten M, Mwangi M (2012). Mobile Cash for Nomadic Livestock Keepers: The Impact of the Mobile phone money innovation (M-pesa) on Maasai pastoralist in Kenya. Transforming Innovations in Africa: explorative studies on appropriations in African Societies, Leiden: Brill. pp. 79-102.
Scharwatt C, Katakam A, Frydrych J, Murphy A, Naghavi N (2014). State of the Industry: Mobile Financial Services for the Unbanked. Retrieved November, 7, 2015.
Soederberg S (2013). Universalizing Financial Inclusion and the Securitization of Development. Third World Quarterly 34(4):593-612
Suri T, Jack W, Stoker TM (2012). Documenting the birth of a Financial Economy. Proceedings of the National Academy of Science 109(26):10257-10262.
Sykuta ME, Chaddad FR (1999). Putting theories of the firm in their place: A supplemental digest of the new institutional economics. Journal of Cooperatives 14:68-76.
Tesfay H, Tesfay A (2013). Relative efficiency of rural saving and credit cooperatives: An application of data envelopment analysis. International Journal of Cooperative Studies 2(1):16-25.
The World Bank Global Findex (2019). Global Financial Development Report 2019 / 2020: Bank Regulation and Supervision a Decade after the Global Financial Crisis. Washington, DC. World Bank. Available at: https://www.worldbank.org/en/events/2019/11/06/global-financial-development-report-2019-2020
The World Bank (2013). The New Microfinance Handbook: A Financial Market System Perspective. 2013. International Bank for Reconstruction and Development/ the World Bank 1818 H Street NW, Washington DC.
Thomas JS (2007). SACCO saving product development training guide:
USAID funded project. Chemonics International Inc. Townsend P (1979). Poverty in United Kingdom. A survey of household
resources and standards of living. Los Angeles: University of California Press.
Tumwine F, Mbabazi M, Jaya S (2015). Savings and Credit Co-operatives (SACCOs) Services Terms and Members Economic Development in Rwanda: A Case study of Zigama SACCO Ltd International Journal of International Journal of Community and Cooperative Studies 3(2):1-56.
Türkeköle T (2015). Strategic Approach to Financial Services Industry. Available at: https://www.researchgate.net/profile/Tuerker_Tuerkekoele/publication/286777573_Strategic_Approach_to_Financial_Services_Industry/links/566da7a408ae430ab5000f53.pdf
UBOS (2018). Uganda National Household Survey 2016/2017. Kampala, Uganda: UBOS. Available at: https://sun-connect-ea.org/wp-content/uploads/2018/12/2017_UNHS_26092017-Final_Presentation.pdf
Urassa KJ, Kwai DM (2015). The contribution of SACCOs to income Poverty Reduction. A Case Study of Mbozi District, Tanzania. Available at: http://www.suaire.sua.ac.tz:8080/xmlui/handle/123456789/2210
Wanyama FO, Develtere P, Pollet I (2008). Encountering the evidence: cooperatives and poverty reduction in Africa. Working Papers on Social and Co-operative Entrepreneurship WP-SCE, 08-02. Available at: https://papers.ssrn.com/sol3/papers.cfm?abstract_id=1330387
Wichterich C (2017). Microcredits, Returns and Gender: Of Reliable Poor Women and Financial Inclusion in South Asia. In Work, Institutions and Sustainable Livelihood. Palgrave Macmillan, Singapore. pp. 275-301.
World Bank. (2007). World Development Report. Agriculture fore Development. Washington, DC: World Bank.
World Bank (2009). Financial Access 2009: Measuring access to financial services around the world. Washington, DC: Consultative Group to Assist the Poor/world Bank.
World Bank (2013). World Bank Annual Report 2013. Washington, DC. World Bank.
World Bank (2014). Global Financial Development Report 2014: Financial Inclusion. Washington, DC. @ World Bank. IGO
World Bank (2015) Uganda Systematic Country Diagnostic: Boosting Growth and Accelerating Poverty Reduction. 4 December 2015
World Bank (2018a). Poverty and Equity Database. In: The World Bank Online Washington, DC.
World Bank (2018b). Understanding Poverty. Available at: http://www.worldbank.org/en/topic/poverty/overview
World Economic Forum (2015). The future of financial services: How disruptive innovations are shaping the way financial services are structured, provisioned and consumed, s.l.: World Economic Forums

Vol. 14(9), pp. 291-300, September, 2020
DOI: 10.5897/AJBM2018.8603
Article Number: FED5DD464781
ISSN: 1993-8233
Copyright© 2020
Author(s) retain the copyright of this article
http://www.academicjournals.org/AJBM
African Journal of Business Management
Full Length Research Paper
The impact of leadership styles on employee commitment in Madda Walabu University
Tafesse Akinida Biza* and Mohammedhussen Mama Irbo
Department of Management, College of Business and Economics, Madda Walabu University, Bale Robe, Ethiopia.
Received 3 July, 2018; Accepted 23 May, 2019
Effective leaders are able to contribute directly by enabling competent and committed employees through encouraging them to perform well. Studies in the area of organizational behavior literatures have indicated that among the major factors affecting organizational success and failure are leadership styles and employee commitment. The aim of this paper was to examine the impact of leadership styles on academic staffs’ commitments in Madda Walabu University (MWU). The total academic staffs in the two campuses (Robe and Goba) were 914. The sample of the study consists of 231 persons, included 209 academic staffs and 22 leaders. Two separate instruments namely, multifactor leadership questionnaire (MLQ) and organizational commitment questionnaire (OCQ), were used to measure the impact of leadership styles on employees’ organizational commitment respectively. Data were analyzed using both descriptive and inferential statistics. There is a significant positive relationship between transformational leadership behavior and organizational commitments. There is weak, but positive and significant relationship between transactional leadership style with continuance commitment and normative commitment, and there is no relationship for transactional leadership style with affective commitment. Significant and positive correlation exists between laissez-faire leadership style and continuance commitment, but insignificant and negative relation with weak correlation between laissez-faire leadership style and affective commitment; however, the one that does not have any statistically significant correlation of normative commitment with laissez-faire leadership style. Key words: Leadership styles, employee commitment, MWU.
INTRODUCTION
At the beginning of the twenty-first century, we are experiencing a rapidly changing environment with various shifts in every domain of human activity (Lok and Crawford, 2004). Life at work place continues to change in many ways by different factors. For example, competition among organizations is getting stiff, demographically, workforces are diversifying and
technology is rapidly changing. The changes in the work place are so fast and require the highest quality of product and service. In order to be competent in these pressures, employee commitment is crucial. As cited by Teshome (2013), researchers indicate that the commitment of employee (Brockner et al., 1992; Meyer et al., 2004; Allen and Myer, 1990) and leadership style
*Corresponding author. E-mail: [email protected].
Author(s) agree that this article remain permanently open access under the terms of the Creative Commons Attribution
License 4.0 International License
292 Afr. J. Bus. Manage.
style (Bass, 1997; Bass et al., 2003; Trottier et al., 2008) are the major factors affecting the success or failure of an organization. Allen and Myer (1990) also argue that employee commitment can result in the effectiveness of leadership, employee performance improvements, reduce turnover and absenteeism if properly managed. Many organizations have good understanding for the value of enhancing employees’ commitment and the importance of understanding its antecedents that employees are committed to those jobs where they are happiest. People who are jovial at work place find their occupation more meaningful and more interesting; they are more in tune with the purpose of their organization, they feel more attractive felling (Lantos and Craton, 2012) and Job satisfaction, and some of its facets are found as significant predictors of organizational commitment (Boles et al., 2007). In fact, several factors affect commitment of employees to a company or an organization. Among the many factors which could enhance employee organizational commitment are recognitions, promotional opportunities, pay raises and chances for cross-training and advancement.
Human resource is one of the most important assets of an organization which increases the efficiency and the effectiveness of the organization; and also, it acts as a pure source of competitive advantage which is inimitable (Beheshtifar and Herat, 2013). According to Rafiq Awan and Mahmood (2009), employee commitment shows that quality of leadership exists within an organization. From the different sources, it is possible to argue that there is a significant relationship between leadership style and employee commitment. A number of research papers indicate that the relationship between the style of leadership and employee commitment is positive. One of the most important things to create committed employees is leadership style. The case in MWU academic staff is different. The sense of belongingness is very less, which has increased high turnover and absenteeism. Therefore, the researchers are encouraged to study on the impacts of leadership styles (transformational, transactional and laissez-faire leadership) on employee commitment of instructors (affective, normative and continuance) in MWU academic staff.
The objectives of this research are: 1. To identify the employees’ perceptions about leadership styles and employee commitment dimensions in MWU academic staffs. 2. To examine the relationship between transformational, transactional and laissez-faire leadership styles and employee commitment dimensions at MWU academic staffs. 3. To examine the impacts of leadership styles (transformational, transactional and laissez-faire) on employee commitment dimensions in MWU academic staff.
The study is expected to contribute to different bodies in many ways. First the findings of this study will add to
the wealth of knowledge in other leadership and employee commitment studies. It could also be helpful for individuals who want to conduct further studies in related topics and other organizations those face similar problems.
Inevitably, this study will contribute to the growing body of research on the impacts of leadership styles on organizational commitment by examining the three important leadership styles and their impact on organizational commitment. It is believed that this study will add value to the literatures on supervisors’ leadership styles, especially in the Ethiopian settings, since there were limited literatures done on similar settings. The results of the study will also help MWU to practice leadership style that will develop organizational commitment, and will also contribute a lot to anyone who is interested by providing information on the relationship between leadership styles and organizational commitment.
LITERATURE REVIEW
This part of the paper deals with the review of literatures on leadership styles, employee commitment and their relationships.
The concept of leadership
Leadership can be defined as a complex social process, rooted in aspects of values, skills, knowledge as well as ways of thinking of both leaders and followers. Thus, it is all about the continuous process of establishing and maintaining a connection between who aspire to lead and those who are willing to follow (Hersey et al., 2007). James and Collins (2008) and Leavy and Mckiernan (2009) state that the fact that organizations face several challenges as a result of constant changes of external environments, such as changes in technology, economy, stiff competition, social, political and political legal conditions and internal environment, call for flexibility in resource utilization and in the encouraging of continuous learning. As a result of these, leaders are expected to make the right decision apart from contributing in terms of generating new ideas and knowledge in organizations in order to respond to the changes. Leadership styles are considered in the following sections as transactional, transformational and laissez-faire leadership styles.
Transactional leadership style
Bolden et al. (2003) argue that this approach focuses on getting some sorts of benefits from the relationships created between leaders and followers in the process of leadership. The benefits drive from a contract which realizes rewards for followers in return for commitment the leaders need from followers to make an organization successful. It focuses on the role of supervision,

organization and group performance. This shows that the theory bases leadership on a formula of rewards and punishments (Bass and Avolio, 1993). Transformational leadership style The connection formed between leaders and followers is the focus of this theory. Transformational leaders have the concern for motivating and inspiring followers by showing group members to understand that the accomplishment of the task is utmost good. Transformational leaders focus on the group members’ performance; however, they also have the intention of making each individual utilizes his or her maximum potential. High ethical and moral standards are what leaders with this style value the most. The central concept here is change and the role of leadership in envisioning and implementing the transformation of organizational performance (Bolden et al., 2003). Laissez-faire leadership style The two leadership styles which were considered above are said to actively interfere and try to prevent problems by making use of different approaches. Research findings indicate that they are contrasted with the third leadership style, known as laissez-faire leadership style (Bass, 1990) as cited in Bučiūnienė and Škudienė (2008). James and Collins (2008) state the laissez-faire leader as an extremely passive leader who is reluctant to influence subordinates of higher level of freedom can reach the stage of handing over one’s responsibilities as a whole. Employee commitment A variety of antecedents and outcomes about commitment have been identified in the past thirty years (Shore and Tetrick, 1991; Hunt and Morgan, 1994). According to Batemen and Strasser (1984) as cited in Lok and Crawford (1999), organizational commitments are studied for the following reasons: 1. Employee behavior such as performance and effectiveness. 2. Attitudinal, affective and cognitive as job satisfaction, the nature of employee’s job. 3. Role such as responsibility. 4. Personal characteristics of the employee such as age and job tenure. Dimensions of employee commitment There are three dimensions of employee commitment;
Biza and Irbo 293 affective, continuance and normative commitment (Allen and Meyer, 1990).
Affective commitment is related to the forming of emotional adherence to an organization, identifying oneself with, and having to desire keeping membership to an organization. Therefore, affective commitment shows the need of employees to remain with an organization willingly (Allen and Meyer, 1990; Meyer et al., 2004).
Continuance commitment emanates from employees desire to remain with an organization taking into account the costs of leaving an organization. The knowledge about costs associated to employee leave and the willingness to remain with the organization as a result of investment already made. In this dimension of commitment such factors as years of service and unique benefits which employees may get from an organization are included (Hunt and Morgan, 1994).
Lastly, normative commitment considers a feeling of personal obligation to continue to serve an organization. High levels of normative commitment makes employees stay with an organization as they feel they must remain (Allen and Meyer, 1990). It was argued that normative commitment is only natural due to the way we are raised in the society. Commitments in marriage, family and religion may explain normative commitment. Commitment to place of employment makes employee feel like they have a moral obligation to the organization (Meyer et al., 2004). The relationship between leadership styles and employee commitment Organizational management literatures reported the existence of relationships between leadership styles and commitment (Wu, Tsai, Fey, and Wu 2006). The relationships between leadership styles and employee commitment were found to be positive by many studies. For example, it was concluded by Lo et al. (2010) that the styles of leadership in supervising employees are useful dimensions as they can design followers’ organizational commitment in many important ways. Similarly, Ponnu and Tennakoon (2009) found out that the behavior of leadership in an ethical manner has a positive effect on followers’ organizational commitment as well as subordinates’ trust in leaders.
Similarly, the study conducted on the employees’ perceptions of leadership style among Malaysian managers and its impact on organizational commitment by Marmaya et al. (2011) found out that leadership tends to be more transformational than transactional. Contrary to the above results, a study conducted by Rafiq and Mahmood (2009) on the relationship among leadership style, organizational culture and employee commitment in university libraries indicate that the leadership style, particularly autocratic and laissez-faire has no impact on the commitment of subordinates (Rafiq and Mahmood

294 Afr. J. Bus. Manage.
2009). However, positive relationship between employees’ organizational commitment dimensions and leadership styles was found in the study conducted by Bučiūnienė and Škudienė (2008). The findings of the research specifically found positive relationships between normative and affective employee commitments and a transformational leadership style. Different from this, a laissez-faire leadership style was negatively related to employees’ affective commitment.
Similarly, the research result showed consistent manifestation in that transformational leadership style influence organizational outcome positively. For example, lower employee turnover and high organizational citizenship behavior were resulted by transformational leadership style (Dvir et al., 2002 as cited in Mannheim and Halamish (2008)); hence, high commitment of employees (Bučiūnienė and Škudienė, 2008). Moreover, Bycio et al. (1995) as cited in Ponnu and Tennakoon (2009) found that affective, continuance and normative commitments are explained by transformational leadership style in a research targeted at examining on how transformational leadership and transactional leadership affected employee levels of affective, continuance and normative commitments.
According to Avolio et al. (2004), contrary to the previous research, transformational leadership at the indirect senior level had a more positive relationship with employees' organizational commitment as compared to the relationship between commitment and ratings of transformational leadership of the followers' immediate supervisor. The findings of Brown (2003) as cited in Bučiūnienė and Škudienė (2008) found out a strong correlation between transformational leadership style and affective, a weaker but still strong positive relation with normative and no relationship with continuance commitments, respectively. The study conducted by Brown and Dodd (1999) show that the relationships between transactional leadership dimensions and affective and normative commitments were found, but the relationship was a statistically significant one with that of normative commitment. Mannheim and Halamish (2008) argued that the enactment of transformational leadership resulted in employees start to consider organizational interest to come first to their own interest.
Employee commitments can be improved by management style. For instance, Eisenberger et al. (1990) as cited in Avolio et al. (2004) have the view that rewards and support obtained from managers as the perceived supports and rewards increases more trust of the organization. The authors further claim that employees who feel they are cared for by managers show the necessary commitment with knowledge of their responsibilities, higher involvement in their organization, and with greater innovation.
To conclude, leadership styles and employee commitments are considered by a number of literatures from several perspectives. One can see a number of articles repeating the same issues surrounding the topics
and findings, and the authors show that the results are similar but from different perspectives. Many studies indicate that there was a strong relationship between leadership styles and employee commitment (Lo et al., 2009; Lo et al., 2009; Bučiūnienė and Škudienė, 2008; Rafiq and Mahmood, 2009; Ponnu and Tennakoon, 2009). RESEARCH METHODS
The research approach that the researchers determined to be effective for this research was quantitative research approach as the research questions require such approach. Based on the information obtained from the human resource department of MWU (2016), the total number of academic staffs was 914. This number was thought to be considered as the population of the study. The researchers considered 551 academicians who were actually working in MWU during the study periods; however, because of time and budget constraints, the study did not consider expatriate teachers (82) and academic staffs who are on leave for 2nd and 3rd degree (281). Purposive, stratified and simple random sampling techniques were used to select samples, while purposive, stratified and simple random sampling methods, and stratified and simple random sampling techniques were used for leaders and employees (academic staffs), respectively.
Primary data were considered for this study and were collected with the help of structured questionnaires. The questions in the questionnaires were closed ended questions and two data collection tools were used, namely multifactor leadership questionnaire (MLQ) and organizational commitment questionnaire (OCQ), to gather quantitative data on leadership styles and employees’ organizational commitment, respectively. Descriptive statistics such as frequency, percentages, mean and standard deviations were used to analyze the data. Moreover, inferential statistics such as correlation, t-test and regression analysis were used to determine the relationship between variables and to analyze impacts of leadership style on academic staff commitment in MWU.
RESULTS AND DISCUSSION
The study was targeted at two campuses of the university which consists of seven colleges, one school and Goba referral hospital. The sample plan of this study was composed of 22 leaders who are college deans, department heads and 209 academic staffs (instructors). Though a total of 231 questionnaires were distributed to the respondents, only 192 questionnaires were successfully completed and returned of which 22 were from leaders and 170 were from instructors. The total response rate was 83.12%, and the analysis of this research is based on the number of questionnaires collected.
The data in table 1 above indicate that, from the total respondents about 72.7% are males and 27.3% are females. From the age group, the majority’s age was between 26 to 35 years (54.5%), but there is no leader whose age is under 26 showing that the entire leaders’ ages are above 26 years.
Most of the leader respondents are above 6 year work in current organizations (54.5%). Significant numbers of

Biza and Irbo 295
Table 1. Summary of deans and department heads (Leaders) profile.
Variable Frequency Percent
Sex Male 16 72.7
Female 6 27.3
Job title
Assistant Lecturer 0 0.0
Lecturer 18 81.8
Assistant professor 4 18.2
Worked on the current organization
1 to 3 years 3 13.6
3 to 6 years 7 31.8
Above 6 years 12 54.5
Worked on the current position
6 month to 1 years 11 50.0
1 to 2 years 8 36.4
Above 2 years 3 13.6
Previous work experience Yes 8 36.4
No 14 63.6
Age group
Less than 26 years 0 0.0
26 to 35 years 12 54.5
35 to 45 years 7 31.8
Above 45 years 3 13.6
Level of education
Bachelor degree 0 0.0
Master’s degree 18 81.8
Doctorate degree 4 18.2
Marital status Married 14 63.6
Single 8 36.4
leader respondents have 6 months to 1 year work experience in the current position (50%). Meanwhile, the majority of the leaders (63.6%) have no previous work experience in the same position, and (36.4%) have work experience in the same position elsewhere. Regarding the current educational level, the majority of the leaders were Master’s degree holders (81.8%). Most of the leaders are married (63.6%) whereas the remaining (36.4%) are single.
The data in Table 2 above shows that from the total academic staffs (employee) profile, from the total employee respondents, 87.1% are males and 12.9% are females. From the employee (instructor), the majority lie between 26 to 35 years (61.2%). From work on current organization employee (instructor) respondents, 3 to 6 year worked in current organizations (37.1%). Regarding educational level, the majority of the leaders were Master’s degree holders (72.4%). From the total employee (instructor), 53.5% are single whereas the remaining (46.5%) are married.
The number of respondents for all leadership styles
variables was 192 while all organizational commitment respondents were 170. Based on organizational commitment questionnaires, leaders did not rate themselves on their perceptions because the objectives of the study were only targeted to determine the employees’ perception about the leadership styles, and the dimension of organizational commitment not to examine the perception of leaders about themselves.
In Table 3, each subscales of transformational leadership’s mean and standard deviation value was found to be between 2.96 to 3.61, and 1.007 -0.629, respectively. While each subscale of transactional leadership was found to be between 2.95 to 3.21 and1.04 to 0.719, respectively. The mean and standard deviation for laissez-faire is 2.93 and 0.770 respectively.
These indicate that some leaders were using ideal levels of transformational leadership styles at the study area. Therefore, the ultimate goal of transformational leadership behaviors were achieved, some of these are instilling pride, coaching or training, stimulating a common vision, communicating positively and enhancing employee

296 Afr. J. Bus. Manage.
Table 2. Summary of academic staffs (employee) profile.
Variable Frequency Percent
Sex Male 148 87.1
Female 22 12.9
Jobs title
Lab assistance 18 10.6
Assistant Lecturer 16 9.4
Lecturer 124 72.9
Assistance professor 12 7.1
Worked on the current organization
6 month to 3 years 49 28.8
3 to 6 years 63 37.1
Above 6 years 58 34.1
Age group
Less than 26 years 26 15.3
26 to 35 years 104 61.2
35 to 45 years 33 19.4
Above 45 years 7 4.1
Level of education
Bachelor degree 35 20.6
Master’s degree 123 72.4
Doctorate degree 12 7.1
Marital status Married 79 46.5
Single 91 53.5
creativity. But the overall transactional leadership and laissez- faire styles mean scores for this study were extremely above the range of Bass and Avolio (1997) suggestion. This shows that some leaders demonstrated greater level of transactional and laissez- faire leadership styles at MWU. These behaviors here entail clarifying exchange rewards for performance for contingent reward, taking corrective actions prior mistakes to occur for management-by exception (active), failure to search for mistakes for management by exception (passive) and avoidance of intervention for laissez-faire.
Generally, the findings of this study shows that respondents perceived leadership style to be slightly more transformational (M=3.33) than to that of transactional (M=3.07) and laissez-faire (M=2.93). Therefore, this supports the findings of Trottier et al. (2008) that shows transformational leadership variables are slightly more important in terms of their overarching concept of leadership effectiveness in followers’ perceptions of importance.
According to the results shown in Table 4, except idealized influence (behaviors), inspirational motivation, management by exception (active) and transactional leadership, there is significant difference between the two groups in all leadership dimensions because the values in the Sig (2-tailed) columns are all less than 0.05. Thus, it is an evident the main difference between leadership
styles that are being practiced and behaviors that are being perceived by the employees. The relationships between transformational leadership style and employee commitment The correlation result between transformational leadership style with affective commitment shows (0.413**), that of continuance commitment (0.401**) and normative commitment (0.374**) are moderate, positive and significant relationship with the same P value. The P value = 0.000, suggest that there is significant positive relations of transformational leadership on three employee commitment dimension. As leaders behave to build trust, team spirit, encourage creativity, act as mentors and coaches, emphasize development and recognize accomplishments, employees feel emotionally attached to their organization. The relationships between transactional leadership style and employee commitment The result of this study further demonstrates that there is weak but positive and significant relationship between transactional leadership style with continuance and

Biza and Irbo 297
Table 3. Mean score and standard deviation of employees.
Dimension N Mean Std. Deviation
Idealized influence attributed 170 2.96 1.007
Idealized influence behavior 170 3.46 0.699
Inspirational motivation 170 3.61 0.629
Intellectual stimulation 170 3.30 0.764
Individualized consideration 170 3.35 0.587
Transformational 170 3.33 0.552
Contingent reward 170 3.21 0.719
Management by exception(active) 170 3.05 0.779
Management by exception(passive) 170 2.95 1.040
Transactional 170 3.07 0.53
Laissez-faire 170 2.93 0.770
Affective commitment 170 3.13 0.926
Continuance commitment 170 2.70 0.798
Normative commitment 170 2.71 0.705
Table 4. T-test results for equality of mean scores by the two samples on MLQ.
Variable T- test for equality of means T Df Sig. (2 tailed)
Idealized influence attributed Equal variances assumed -3.436 190 0.001
Equal variances not assumed -4.052 30.022 0.000
Idealized influence behavior Equal variances assumed -0.923 190 0.357
Equal variances not assumed -0.960 27.381 0.345
Inspirational motivation Equal variances assumed -0.754 190 0.452
Equal variances not assumed -0.722 26.111 0.476
Intellectual stimulation Equal variances assumed -3.597 190 0.000
Equal variances not assumed -4.064 29.001 0.000
Individualized consideration Equal variances assumed -2.983 190 0.003
Equal variances not assumed -3.164 27.729 0.004
Contingent reward Equal variances assumed -3.435 190 0.001
Equal variances not assumed -3.227 25.840 0.003
Management by exception (active) Equal variances assumed 1.959 190 0.052
Equal variances not assumed 1.698 24.899 0.102
Management by exception (passive) Equal variances assumed 3.750 190 0.000
Equal variances not assumed 4.567 30.887 0.000
Laissez-faire Equal variances assumed 6.782 190 0.000
Equal variances not assumed 7.499 28.542 0.000
Transformational Equal variances assumed -3.304 190 0.001
Equal variances not assumed -3.906 30.091 0.000
Transactional Equal variances assumed 1.797 190 0.074

298 Afr. J. Bus. Manage.
Table 5. Pearson correlation matrix between leadership styles and employee commitment dimensions.
Variable Test Affective
commitment Continuance commitment
Normative commitment
Total employee commitment
Transformational
Pearson/Corl 0.413** 0.401** 0.374** 0.484**
Sig. (2-tailed) 0.000 0.000 0.000 0.000
N 170 170 170 170
Transactional
Pearson/Corl 0.095 0.296** 0.224** 0.241**
Sig. (2-tailed) 0.217 0.000 0.003 0.002
N 170 170 170 170
Laissez-Faire
Pearson /Corl -0.124** 0.230** 0.026 0.043
Sig. (2-tailed) 0.106 0.003 0.738 0.575
N 170 170 170 170
Note: ** Correlation is significant at the p<0.01(1 %) level (2-tailed), n=170.
normative commitments (0.296
**) and (0.224
**)
respectively, but transactional leadership style does not have statistically significant relation with affective commitment (0.095). The positive correlation between transactional leadership style with continuance and normative commitments indicates leadership behaviors involve rewards, showing problems and the need for positive reinforcement with respect to how employees perceive should remain with the organization (Bass and Avolio, 1993). However, the non-existence of relationships between transactional leadership style and affective commitment indicate leadership behaviors to involve make rewards available in exchange to satisfy agreed objectives, indicating problems, may not be related to how employees feel about wanting to stay and need to stay with the organization. The relationships between laissez-faire leadership style and employee commitment The result of this study indicates that there is weak but positive and significant correlation between laissez-faire leadership style and continuance commitment (0.230
**),
but there is insignificant and negative relationships between laissez-faire leadership style and affective commitment (-0.124**). However, laissez-faire leadership style does not have relationship with normative commitment (0.026). These show that the leadership behaviors involve leaving problems without taking any action, displaying in difference, and not taking care of achievements. But insignificant and negative with weak relation between laissez-faire leadership style and affective commitment indicates strong negative effect on the affective commitment. In summary, leadership behaviors that ignore problems, show neutral positions and overlook successes are negatively correlated to affective commitments of employees in MWU.
As shown in Table 5, the greatest amount of variance
in continuance commitment explained by all independent variables (transformational, transactional and laissez-faire) was 23%. It is clear from the regression analysis that the transformational leadership style has strong impact on continuance organizational commitment. This is because this variable made a good unique contribution to explaining the dependent variables with beta value (ß = 0.403) at significant level p<0.000, whereas the rest independent variables (transactional and laissez-faire) made less contribution with beta values (0.0870 and 0.258) at insignificant levels (0.257 and 0.443) respectively. Meanwhile, transformational leadership significantly (ß = 0.481, p<0.000) explained variance in the affective commitment. Like in continuance commitment, the transactional (ß= -0.37, p<0.645) and laissez-faire (ß = 0.062, p<0.408) styles insignificantly explained variance in the affective commitment. As we have seen in the Table 6 above, the independent leadership styles predicted affective commitment (R
2 =
16.2%). On the other hand, the transformational (ß = 0.348, p<0.000), affected normative commitment significantly but transactional (ß = 0.089, p<0.275) and laissez-faire (ß 0.047, p<0.541) affected normative commitment insignificantly and almost no contribution in predicting this dependent variable. Conclusions Achievement of organization’s goals requires effective leaders and dedicated and committed employees. The main objective of this paper was to investigate the impact of leadership styles on employee commitment in MWU. Based on the results of this study, the researchers concluded that leaders were demonstrating ideal levels of transformational leadership style. On the other hand, the results indicated that leaders perform at greater level using transactional and laissez-faire leadership behaviors.
Further conclusions can be made that leaders and
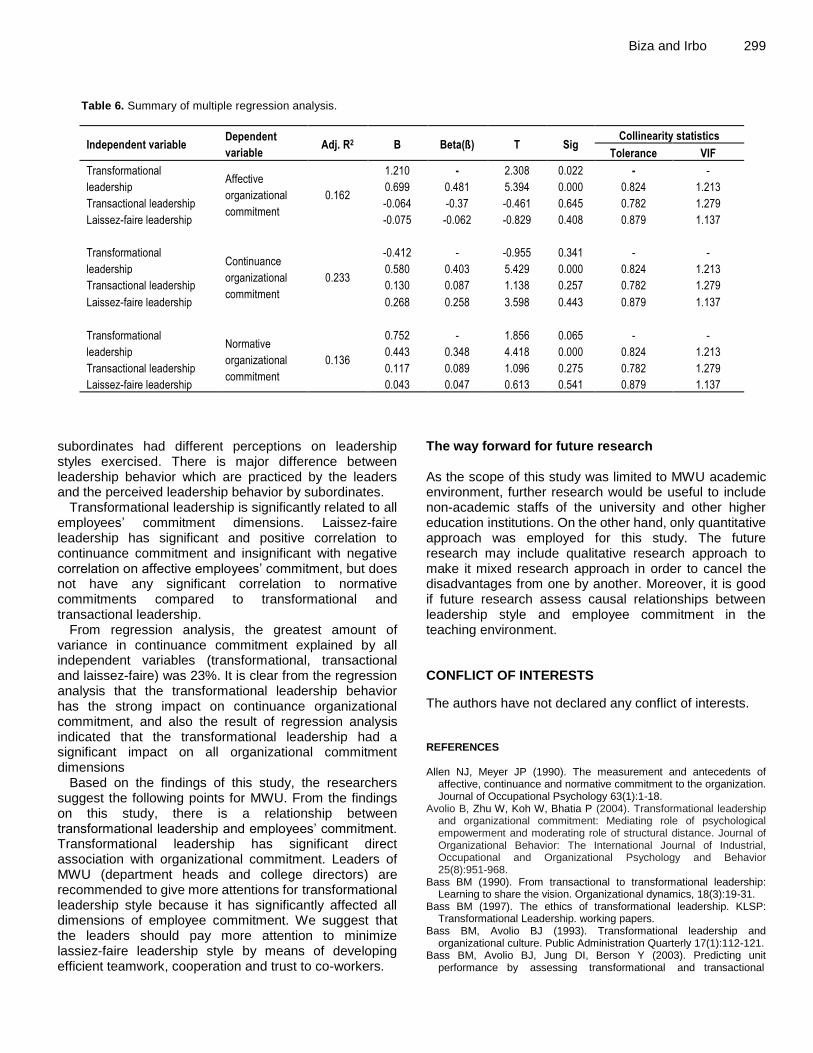
Biza and Irbo 299
Table 6. Summary of multiple regression analysis.
Independent variable Dependent
variable Adj. R2 B Beta(ß) T Sig
Collinearity statistics
Tolerance VIF
Transformational
leadership Affective
organizational
commitment
0.162
1.210 - 2.308 0.022 - -
0.699 0.481 5.394 0.000 0.824 1.213
Transactional leadership -0.064 -0.37 -0.461 0.645 0.782 1.279
Laissez-faire leadership -0.075 -0.062 -0.829 0.408 0.879 1.137
Transformational
leadership Continuance
organizational
commitment
0.233
-0.412 - -0.955 0.341 - -
0.580 0.403 5.429 0.000 0.824 1.213
Transactional leadership 0.130 0.087 1.138 0.257 0.782 1.279
Laissez-faire leadership 0.268 0.258 3.598 0.443 0.879 1.137
Transformational
leadership Normative
organizational
commitment
0.136
0.752 - 1.856 0.065 - -
0.443 0.348 4.418 0.000 0.824 1.213
Transactional leadership 0.117 0.089 1.096 0.275 0.782 1.279
Laissez-faire leadership 0.043 0.047 0.613 0.541 0.879 1.137
subordinates had different perceptions on leadership styles exercised. There is major difference between leadership behavior which are practiced by the leaders and the perceived leadership behavior by subordinates.
Transformational leadership is significantly related to all employees’ commitment dimensions. Laissez-faire leadership has significant and positive correlation to continuance commitment and insignificant with negative correlation on affective employees’ commitment, but does not have any significant correlation to normative commitments compared to transformational and transactional leadership.
From regression analysis, the greatest amount of variance in continuance commitment explained by all independent variables (transformational, transactional and laissez-faire) was 23%. It is clear from the regression analysis that the transformational leadership behavior has the strong impact on continuance organizational commitment, and also the result of regression analysis indicated that the transformational leadership had a significant impact on all organizational commitment dimensions
Based on the findings of this study, the researchers suggest the following points for MWU. From the findings on this study, there is a relationship between transformational leadership and employees’ commitment. Transformational leadership has significant direct association with organizational commitment. Leaders of MWU (department heads and college directors) are recommended to give more attentions for transformational leadership style because it has significantly affected all dimensions of employee commitment. We suggest that the leaders should pay more attention to minimize lassiez-faire leadership style by means of developing efficient teamwork, cooperation and trust to co-workers.
The way forward for future research As the scope of this study was limited to MWU academic environment, further research would be useful to include non-academic staffs of the university and other higher education institutions. On the other hand, only quantitative approach was employed for this study. The future research may include qualitative research approach to make it mixed research approach in order to cancel the disadvantages from one by another. Moreover, it is good if future research assess causal relationships between leadership style and employee commitment in the teaching environment. CONFLICT OF INTERESTS
The authors have not declared any conflict of interests. REFERENCES Allen NJ, Meyer JP (1990). The measurement and antecedents of
affective, continuance and normative commitment to the organization. Journal of Occupational Psychology 63(1):1-18.
Avolio B, Zhu W, Koh W, Bhatia P (2004). Transformational leadership and organizational commitment: Mediating role of psychological empowerment and moderating role of structural distance. Journal of Organizational Behavior: The International Journal of Industrial, Occupational and Organizational Psychology and Behavior 25(8):951-968.
Bass BM (1990). From transactional to transformational leadership: Learning to share the vision. Organizational dynamics, 18(3):19-31.
Bass BM (1997). The ethics of transformational leadership. KLSP: Transformational Leadership. working papers.
Bass BM, Avolio BJ (1993). Transformational leadership and organizational culture. Public Administration Quarterly 17(1):112-121.
Bass BM, Avolio BJ, Jung DI, Berson Y (2003). Predicting unit performance by assessing transformational and transactional

300 Afr. J. Bus. Manage.
leadership. Journal of Applied Psychology 88(2):207. Batemen T, Strasser S (1984). A longitudinal analysis of the
antecedents of organizational commitment. Academy of Management Journal 21:95-112.
Bycio P, Hackett RD, Allen JS (1995). Further assessments of Bass’s (1985) conceptualization of transformational and transactional leadership. Journal of Applied Psychology 80:468-478.
Beheshtifar M, Herat BH (2013). To promote employees commitment via perceived organizational support. International Journal of Academic Research in Business and Social Sciences 3(1):306-307.
Bolden R, Gosling J, Marturano A, Dennison P (2003). A review of leadership theory and competency frameworks. Centre for leadership studies, University of Exeter. Available at: https://ore.exeter.ac.uk/repository/handle/10036/17494
Boles J, Madupalli R, Rutherfor R (2007). The relationship of facets of salesperson job satisfaction with affective organizational commitment. Journal of Business and Industrial Marketing 22(5):311-321.
Brown BB (2003). Employees' organizational commitment and their perceptions of supervisors' relations-oriented and task-oriented leadership behaviors (Doctoral dissertation, Virginia Tech).
Brown FW, Dodd NG (1999). Rally the troops or make the trains run on time: The relative importance and interaction of contingent reward and transformational leadership. Leadership and Organization Development Journal 20(6):291-299.
Brockner J, Tyler TR, Cooper-Schneider R (1992). The influence of prior commitment to an institution on reactions to perceived unfairness: The higher they are, the harder they fall. Administrative Science Quarterly 37(2):241-261.
Bučiūnienė I, Škudienė V (2008). Impact of leadership styles on employees' organizational commitment in Lithuanian manufacturing companies. South East European Journal of Economics and Business 3(2):57-66.
Eisenberger R, Fsolo P. Lamastro VD (1990). Perceived Organizational Support and Employee Dilligence, Commitment and Innovation. Journal of Applied Psychology 82:812-820.
Hersey P, Blanchard KH (1984). Utilizing Human Resources: Management of Organizational Behavior.
Hunt SD, Morgan RM (1994). Organizational commitment: one of many commitments or key mediating construct?. Academy of Management Journal 37(6):1568-1587.
James KT, Collins J (2008). Leadership perspectives: Knowledge into action. Springer.
Lantos GP, Craton LG (2012). A model of consumer response to advertising music. Journal of Consumer Marketing 29(1):22-42.
Leavy B, McKiernan P (2009). Strategic leadership: Governance and renewal. Palgrave Macmillan.
Lo M, Ramayah T, Min H (2009). Leadership styles and organizational commitment: a test on Malaysia manufacturing industry. African Journal of Marketing Management 1(6):133-139.
Lo M, Ramayahb T, Minc H, Songand P (2010). The relationship between leadership styles and organizational commitment in Malaysia: role of leader–member exchange. Asia Pacific Business Review 16(1-2):79-103.
Lok P, Crawford J (1999). The relationship between commitment and organizational culture, subculture, leadership style and job satisfaction in organizational change and development. Leadership and Organization Development Journal 20(7):365-374.
Lok P, Crawford J (2004). The effect of organizational culture and leadership style on job satisfaction and organizational commitment: A cross-national comparison. Journal of Management Development 23(4):321-338.
Mannheim B, Halamish H (2008). Transformational leadership as
related to team outcomes and contextual moderation. Leadership and Organization Development Journal 29(7):617-630.
Marmaya NH, Torsiman MHNM, Balakrishnan BK (2011). Employees perceptions of Malaysian managers leadership styles and organizational commitment. African Journal of Business Management 5(5):1584-1588.
Meyer JP, Becker TE, Vandenberghe C (2004). Employee commitment and motivation: a conceptual analysis and integrative model. Journal of Applied Psychology 89(6):991.
Ponnu CH, Tennakoon G (2009). The association between ethical leadership and employee outcomes-the Malaysian case. EJBO-Electronic Journal of Business Ethics and Organization Studies 14:21-32.
Rafiq Awan M, Mahmood K (2009). Relationship among leadership style, organizational culture and employee commitment in university libraries. Library Management 31(4/5):253-266.
Shore LM, Tetrick LE (1991). A construct validity study of the Survey of Perceived Organizational Support. Journal of Applied Psychology 76:637-643.
Teshome T (2013). The relationship between leadership styles and employee commitment in private higher education institutions at Addis Ababa City. Master’s thesis, Addis Ababa University, School of Business and Public administration.
Trottier T, Van Wart M, Wang X (2008). Examining the nature and significance of leadership in government organizations. Public Administration Review 68(2):319-333.
Wu TF, Tsai MH, Fey YH, Wu RT (2006). A study of the relationship between manager’s leadership style and organizational commitment in Taiwan’s international tourist hotels. Asian Journal of Management and Humanity Sciences 1(3):434-452.

Vol. 14(9), pp. 301-308, September, 2020
DOI: 10.5897/AJBM2020.9048
Article Number: 0D6E35064866
ISSN: 1993-8233
Copyright© 2020
Author(s) retain the copyright of this article
http://www.academicjournals.org/AJBM
African Journal of Business Management
Full Length Research Paper
Is a woman’s name worthless? An experiment related to the gender wage gap
Thorlakur Karlsson1*, Margret Jonsdottir Njardvik2 and Holmfridur Vilhjalmsdottir3
1Department of Psychology, School of Business, Reykjavík University, Reykjavík, Iceland.
2Mundo, Hringbraut 98, 101 Reykjavik, Iceland.
3Laufasborg, Laufasvegi 53-55, 101 Reykjavik, Iceland.
Received 26 May, 2020; Accepted 7 August, 2020
On average, women earn less than men. This is evident in countries with the largest economies of the world. The purpose of this research is to discover whether a woman’s name rather than that of a man contributes to this difference. In an experiment involving 281 employees from several companies, participants were asked to pretend that they were human resource managers. They were required to offer a salary to a female or male applicant for a sales representative or manager’s job, and to also suggest a salary for a niece or nephew for similar jobs. Participants received identical curriculum vitae (CV) for each job, but half who were randomly selected received a female name on the CV and the other half a male name. On five measures for both jobs, all female applicants and nieces “received” lower salaries than male applicants and nephews, irrespective of their gender, age, or position. Key words: Gender, wage gap, salaries, experiment, differences.
INTRODUCTION In countries from all the habitable continents of the world, women on average earn less than men. These include all the major economic areas of the world, that is, the United States (Kim, 2013; Konstantopoulos and Constant, 2008), China (Chen et al., 2013), Japan (Miyoshi, 2008), India (Rendall, 2012), Russia (Semykina and Linz, 2007), and all member countries of the European Union (European Commission, 2014). This is also true for several other countries, such as Australia (Meagher, 2012), Brazil (tourism industry) (Guimarães and Silva, 2016), Iceland (Velferdarraduneytid, 2014), Indonesia (Hallward-Driemeier et al., 2015), Korea (Cho, 2007),
Mexico (Popli, 2013), Norway (Barth and Dale-Olsen, 2009), Thailand (Nakavachara, 2010), Turkey (Akhmedjonov, 2012), as well as in the capital cities of seven West-African countries: Benin, Burkina Faso, Ivory Coast, Mali, Niger, Senegal, and Togo (Nordman et al., 2011). No reports were found of women receiving the same or a higher salary than men.
Most studies on the gender wage gap have focused on attributes related to employees and few have utilized the experimental method. Therefore, the present research focuses on those who offer salaries and those who advise others on what salaries to ask for and accept by
*Corresponding author. Email: [email protected]. Tel: +354 825 6420.
Author(s) agree that this article remain permanently open access under the terms of the Creative Commons Attribution
License 4.0 International License

302 Afr. J. Bus. Manage. employing an experimental method. LITERATURE REVIEW The difference in the earnings of women and men can, for example, be measured in terms of hourly wages or monthly salaries, and whether overtime and bonuses are included. Whereas the earnings of women are often shown as a percentage of what men earn (Harris, 2015; ILO, 2016; Velferdaraduneytid, 2014), account is sometimes not taken of the amount of work that is delivered, work experience, education, or the type of work. Generally, the gender wage gap is persistent to a varying degree, regardless of how it is calculated or controlled for. In a report by the International Labour Organization (ILO, 2016), Women at work: Trends 2016, in which the gender wage gap in about 50 countries worldwide is reviewed, it is stated that “gender wage gaps can be substantial but appear to be showing signs of a moderate reduction over time.” (p. 28). According to the report, the worldwide gap is estimated at 23% in 2016, women receiving on average 77% of what men earn, but without controlling for variables such as hours worked, work experience, education, or the type of work (ILO, 2016: 28).
The gender wage gap tends to widen proportionally in higher-paid jobs, which has been referred to as the “glass ceiling” effect. Research conducted in the Czech Republic (Jurajda and Paligorova, 2009) and the US (Konstantopoulos and Constant, 2008) supports this finding. In the latter country, the glass ceiling effect was evident for Black, Hispanic, and White Americans alike. Spanish research (Navarro-Gómez and Rueda-Narváez, 2014) also reveals the glass ceiling effect and the gender wage gap increasing with higher education levels.
According to a Harris (2015), which was conducted in the United States, Canada, United Kingdom, France, Germany, the Netherlands, and Switzerland, 89% of employed adults believed that women and men should be paid equally. In a report by the European Commission (2014), Tackling the gender pay gap in the European Union, it is stated that closing the gender wage gap would be good for business and the economy, and that employers would thereby avoid complaints and litigation, which would save time and money. Relatively higher salaries should in general also contribute to women becoming more independent. Evidence from the US shows that a relative increase in the salaries of women increased their bargaining power in the US and reduced domestic violence to which they were exposed (Aizer, 2010). Living conditions in turn being improved for children. Amongst the other examples of problems associated with the gender wage gap are increased levels of depression and anxiety experienced by women (Platt et al., 2016), including a higher mortality rate (Kawachi et al., 1999).
Most research on the reasons for the gender wage gap focus on employees and the employee environment, work experience (Cho, 2007; Miyoshi, 2008), education (Miki and Yuval, 2011; Miyoshi, 2008; Nakavachara, 2010), productivity (Chen et al., 2013; Petersen et al., 2007), type of occupation (Furnham and Wilson, 2011; Mandel, 2016; Petersen et al., 2007), percentage of women in the occupation (de Ruijter and Huffman, 2003; Grönlund and Magnusson, 2013), having children (Brown et al., 2011; Cukrowska-Torzewska and Lovasz, 2016; Erosa et al., 2002), and other family obligations (Petersen et al., 2007) being some examples.
Other less obvious explanations for the gender wage gap include the type of housework performed. The time spent on “female” tasks at home, such as preparing meals and cleaning, had a greater impact on the wage gap than time spent on other household duties (Noonan, 2004). Women often being younger than men in marriage limited their mobility and increased the wage gap (Elul et al., 2002). When minimum wages are prescribed as in Indonesia, the gender gap decreases (Hallward-Driemeier et al., 2015).
Part of the gender wage gap has been explained by Semykina and Linz (2007) in terms of personality traits-women being more likely to exhibit external locus of control in their work, while men exhibit internal locus of control and a need to be challenged. Other findings include that there was a lower gender wage gap in jobs where more injury risks are prevalent (Razzolini et al., 2014), women being less likely to use and benefit from negotiations than men (Roche, 2014), women that experienced childhood sexual abuse tend to earn lower wages and more likely than men to be abused (Robst, 2008), and woman as a boss decreasing the gender wage gap (Cohen and Huffman, 2007; Maume and Ruppanner, 2015).
A feature of almost all research on the gender wage gap is that it is non-experimental; it is often difficult to draw causal inferences about the results. Such an experiment could, for example, directly compare salaries offered to a woman and a man irrespective of other factors than gender like education, type of job, or experience. And, in that way can make causal inference about the wage gap. Rationale for the present experiment As previously mentioned, most of the research on the gender wage gap has focused on attributes related to employees and their environment. However, when wages are negotiated, the opinion or attitude of an employer is important in terms of how much a woman’s work is worth compared to that of a man. In the present experiment, this is tested by asking participants to offer a salary to an applicant for a job. There is also the fact that those starting out with their career may seek guidance from
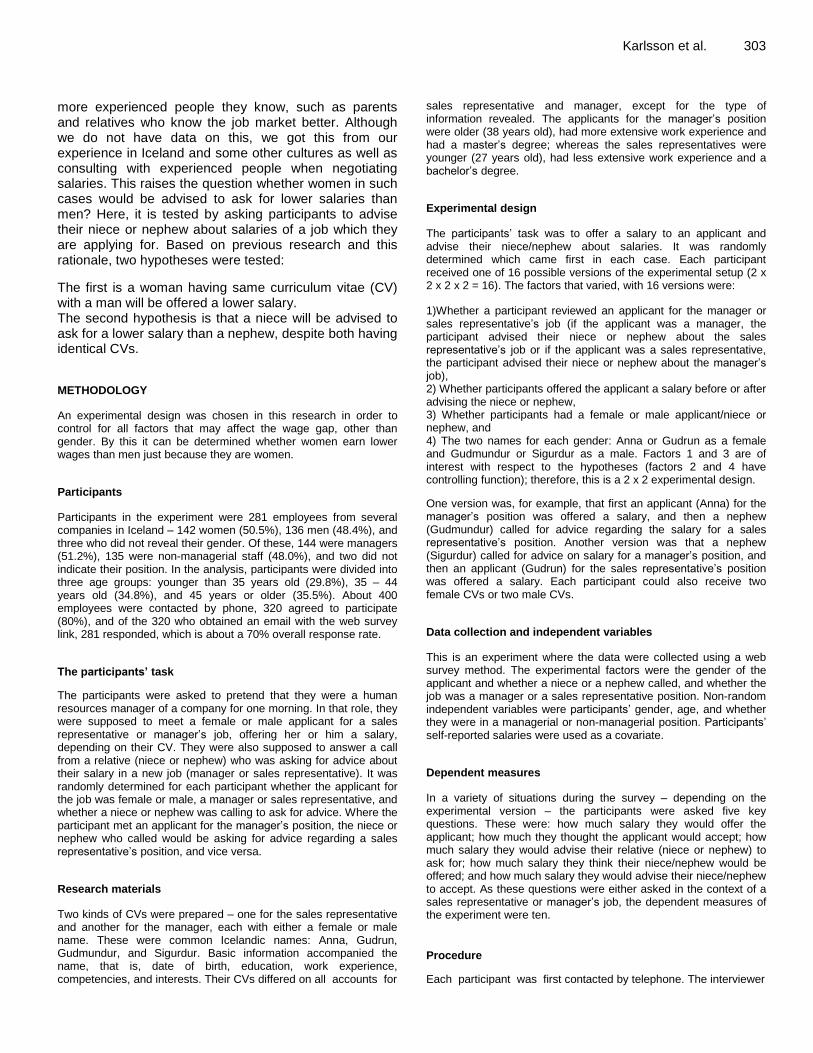
more experienced people they know, such as parents and relatives who know the job market better. Although we do not have data on this, we got this from our experience in Iceland and some other cultures as well as consulting with experienced people when negotiating salaries. This raises the question whether women in such cases would be advised to ask for lower salaries than men? Here, it is tested by asking participants to advise their niece or nephew about salaries of a job which they are applying for. Based on previous research and this rationale, two hypotheses were tested:
The first is a woman having same curriculum vitae (CV) with a man will be offered a lower salary. The second hypothesis is that a niece will be advised to ask for a lower salary than a nephew, despite both having identical CVs. METHODOLOGY
An experimental design was chosen in this research in order to control for all factors that may affect the wage gap, other than gender. By this it can be determined whether women earn lower wages than men just because they are women.
Participants
Participants in the experiment were 281 employees from several companies in Iceland – 142 women (50.5%), 136 men (48.4%), and three who did not reveal their gender. Of these, 144 were managers (51.2%), 135 were non-managerial staff (48.0%), and two did not indicate their position. In the analysis, participants were divided into three age groups: younger than 35 years old (29.8%), 35 – 44 years old (34.8%), and 45 years or older (35.5%). About 400 employees were contacted by phone, 320 agreed to participate (80%), and of the 320 who obtained an email with the web survey link, 281 responded, which is about a 70% overall response rate.
The participants’ task
The participants were asked to pretend that they were a human resources manager of a company for one morning. In that role, they were supposed to meet a female or male applicant for a sales representative or manager’s job, offering her or him a salary, depending on their CV. They were also supposed to answer a call from a relative (niece or nephew) who was asking for advice about their salary in a new job (manager or sales representative). It was randomly determined for each participant whether the applicant for the job was female or male, a manager or sales representative, and whether a niece or nephew was calling to ask for advice. Where the participant met an applicant for the manager’s position, the niece or nephew who called would be asking for advice regarding a sales representative’s position, and vice versa.
Research materials
Two kinds of CVs were prepared – one for the sales representative and another for the manager, each with either a female or male name. These were common Icelandic names: Anna, Gudrun, Gudmundur, and Sigurdur. Basic information accompanied the name, that is, date of birth, education, work experience, competencies, and interests. Their CVs differed on all accounts for
Karlsson et al. 303 sales representative and manager, except for the type of information revealed. The applicants for the manager’s position were older (38 years old), had more extensive work experience and had a master’s degree; whereas the sales representatives were younger (27 years old), had less extensive work experience and a bachelor’s degree.
Experimental design
The participants’ task was to offer a salary to an applicant and advise their niece/nephew about salaries. It was randomly determined which came first in each case. Each participant received one of 16 possible versions of the experimental setup (2 x 2 x 2 x 2 = 16). The factors that varied, with 16 versions were:
1)Whether a participant reviewed an applicant for the manager or sales representative’s job (if the applicant was a manager, the participant advised their niece or nephew about the sales representative’s job or if the applicant was a sales representative, the participant advised their niece or nephew about the manager’s job), 2) Whether participants offered the applicant a salary before or after advising the niece or nephew, 3) Whether participants had a female or male applicant/niece or nephew, and 4) The two names for each gender: Anna or Gudrun as a female and Gudmundur or Sigurdur as a male. Factors 1 and 3 are of interest with respect to the hypotheses (factors 2 and 4 have controlling function); therefore, this is a 2 x 2 experimental design.
One version was, for example, that first an applicant (Anna) for the manager’s position was offered a salary, and then a nephew (Gudmundur) called for advice regarding the salary for a sales representative’s position. Another version was that a nephew (Sigurdur) called for advice on salary for a manager’s position, and then an applicant (Gudrun) for the sales representative’s position was offered a salary. Each participant could also receive two female CVs or two male CVs.
Data collection and independent variables
This is an experiment where the data were collected using a web survey method. The experimental factors were the gender of the applicant and whether a niece or a nephew called, and whether the job was a manager or a sales representative position. Non-random independent variables were participants’ gender, age, and whether they were in a managerial or non-managerial position. Participants’ self-reported salaries were used as a covariate.
Dependent measures
In a variety of situations during the survey – depending on the experimental version – the participants were asked five key questions. These were: how much salary they would offer the applicant; how much they thought the applicant would accept; how much salary they would advise their relative (niece or nephew) to ask for; how much salary they think their niece/nephew would be offered; and how much salary they would advise their niece/nephew to accept. As these questions were either asked in the context of a sales representative or manager’s job, the dependent measures of the experiment were ten.
Procedure
Each participant was first contacted by telephone. The interviewer

304 Afr. J. Bus. Manage.
Table 1. Mean salaries and standard deviation in thousand ISK, and number of respondents for each measure by the gender of sales representative and manager.
CV Female/Niece Male/Nephew % mean
n M a (SD) n M (SD) p
b diff.
c
Sales representative’s CV
Offer applicant 59 273 (58) 60 293 (48) 0.021 7.3
Applicant accepts 57 268 (62) 59 316 (60) < 0.001 17.9
Relative should ask for 58 303 (61) 61 335 (59) 0.001 10.6
Relative will be offered 57 249 (56) 61 281 (53) < 0.001 12.9
Relative should accept 58 276 (56) 61 309 (53) < 0.001 12.0
Mean 274 307 12.0
Manager’s CV
Offer applicant 58 520 (144) 61 540 (126) 0.276 3.8
Applicant accepts 58 496 (146) 61 558 (134) 0.013 12.5
Relative should ask for 60 585 (170) 60 625 (178) 0.065 6.8
Relative will be offered 60 475 (118) 59 529 (143) 0.004 11.4
Relative should accept 60 540 (144) 60 574 (155) 0.053 6.3
Mean 523 565 8.0 aAdjusted means for participants’ self-reported salaries.
bp-values are one-tailed and based on ANCOVA with participants’ self-reported salaries
as a covariate. cThe per cent difference shows how much women have to increase in salaries in order to obtain the same as men.
introduced herself; said that she was calling from Reykjavik University and asked the interviewee to participate in a survey about human resource issues. Those who accepted provided their email address and then received a link to the survey through that email. The survey software (Outcome) presented the scenarios of “a morning in a human resources manager’s life”, asked the questions, and recorded and saved the responses. Respondents were informed that they were neither obliged to answer the survey as a whole nor specific questions, and that their answers would be anonymous. Those who did not respond were reminded up to three times in a follow-up email, that they had accepted to participate in a survey about human resource issues and referred them to the initial email with the link to the survey. The Data Protection Agency in Iceland was notified about the survey, in accordance with Icelandic laws.
Data analysis
Descriptive analyses were performed to show means and standard deviation for the five dependent measures, which were salaries in the Icelandic currency, króna (ISK), broken down by the experimental factors, that is whether the applicant was female or male (niece or nephew), for both the manager and sales representative’s job.
The data were analysed for significant differences between the salaries of female and male applicants, nieces and nephews, and for each type of job, with the participants’ self-reported salary as a covariate (analysis of covariance, ANCOVA). The two hypotheses being directional, significance tests were one-tailed. Thereafter, the effects of the non-experimental variables (participants’ gender, age, and position) were calculated, also using ANCOVA. Two indicators for effect size were calculated. These were per cent differences between what women and men were offered or suggested in terms of salaries and partial eta squared (η2).
Finally, in order to test the assumption of equality of error variances, the Levene’s test was conducted. It was not significant in
any of the ten comparison cases, five measures for sales representative and five for manager, indicating that the error variance of the dependent measures was about the same in the experimental groups.
RESULTS
The main results of the experiment are presented in Table 1. In all cases, that is, in the five measures for sales representative and five for manager’s job, lower salaries were suggested when the CV had a female name opposed to a male name. This held true both when the participants were “dealing with” applicants’ salaries and when they were providing consultation on salaries for their niece or nephew. The difference was statistically significant in seven out of ten cases, and twice the p-value for the non-significant cases was marginal (.065 and .053). Only when salaries for the manager’s position were offered was the p-value well above the .05 significance level.
As it is customary to talk about the gender difference in salaries in terms of percentages, this is presented in the column to the far right in Table 1. There, it can be seen that in order to obtain the same salaries as men, women needed 3.8 to 17.9% increases in salaries. The average was 12% for sales representative’s measures and 8% for manager’s measures; therefore, 10% overall. Partial eta squared (η
2) ranged from very low, .003 in the case of
offering manager salaries, to .139 in the case of what the sales representative would accept. The gender of the name on the CV statistically explained 13.9% of the variability in the salaries in the latter case.

Karlsson et al. 305
Table 2. Mean Salaries in Thousand ISK for each Measure by the Gender of Sales Representative and Manager and by Participants’ Gender.
CV
Female participant Male participant
Female Male % Female Male %
Niece Nephew diff.a Niece Nephew diff.
Sales representative’s CV
Offer applicant 287b 292 1.7 258 296 14.7
Applicant accepts 280 321 14.6 255 311 22.0
Relative should ask for 303 337 11.2 304 334 9.9
Relative will be offered 248 284 14.5 251 276 10.0
Relative should accept 272 316 16.2 282 300 6.4
Mean 278 310 11.5 270 303 12.4
Manager’s CV
Offer applicant 522 541 3.6 517 542 4.8
Applicant accepts 498 567 13.9 494 551 11.5
Relative should ask for* 540 590 9.3 635 670 5.5
Relative will be offered* 444 498 12.2 510 571 12.0
Relative should accept* 500 543 8.6 585 613 6.4
Mean 501 548 9.4 548 589 7.5
Note. aThe per cent difference shows how much women have to increase in salaries in order to have the same as men.
bAdjusted means for
respondents’ self-reported salaries in all cases. *p <0.01, female participants named lower salaries than male participants, irrespective of relative’s gender.
Table 1 also shows that when the CV had a female name, participants wanted to offer her higher salaries on average than they thought she would accept – both in the case of the sales representative and manager. The reverse holds true for the male CV, the man being offered lower salaries than the participants thought he would, on average, accept for both the sales representative and manager positions. In the case of the participants’ relative, niece or nephew, the highest salaries suggested were what the relative should ask for, then what they should accept and the lowest suggestion was what the participants thought the relative would be offered. The same pattern was found here for niece and nephew.
Table 2 shows that on all 10 measures, both female and male participants suggest lower salaries for women than they did for men. This was significant in more than half of the cases, despite considerably less power due to half the size of degrees of freedom, as the significance test was performed for female and male participants separately (not shown in the table). On average, female participants suggested slightly lower salaries for the sales representative’s measures than male participants did (11.5% and 12.4% respectively) and higher for the manager’s measures (9.5% and 7.5% respectively). In no case was the interaction between participants’ gender and the gender of the CV significant; that is there was no difference between female and male participants in terms of differentially suggesting or evaluating salaries for female and male applicants, or nieces and nephews.
Participants’ gender had significant effects on salary measures in three cases when employing ANCOVA (Table 2). Women suggested lower salaries than men in all cases when a relative (niece or nephew) asked for a consultation when applying for the manager’s job. That is, how much salary they would advise their niece or nephew to ask for, how much salary they thought their niece or nephew would be offered, and how much salary they would advise their niece or nephew to be satisfied with or accept. This significant difference between female and male participants was evident for both nieces and nephews.
As Table 3 shows, the applicants’ position did not have much effect on salaries offered. On all measures, both non-managerial staff and managers suggested lower salaries on average when the CV had a female name as opposed to a male name. The difference was significant in half of the 20 cases, that is, where the difference in percentages was over 10%. Also, as with participants’ gender, the interaction between participants’ position and the gender of the CV was never significant, that is, there was no difference between non-managerial staff and managers in terms of differentially suggesting or evaluating salaries for female and male applicants or nieces and nephews. In one measure, that is, how much salary participants thought the applicant would accept for the manager’s position, non-managerial staff suggested significantly lower salaries than managers for both female and male applicants.

306 Afr. J. Bus. Manage. Table 3. Mean salaries in thousand ISK for each measure by the gender of sales representative and manager and by participants’ position.
CV
Non-managerial staff Managers
Female Male % Female Male %
Niece Nephew diff.a Niece Nephew diff.
Sales representative’s
Offer applicant 280b 296 5.7 265 291 9.8
Applicant accepts 267 323 21.0 268 310 15.7
Relative should ask for 296 326 10.1 309 343 11.0
Relative will be offered 241 271 12.4 256 289 12.9
Relative should accept 271 303 11.8 282 313 11.0
Mean 271 304 12.1 276 309 12.0
Manager’s CV
Offer applicant 485 504 3.9 553 572 3.4
Applicant accepts* 451 524 16.2 538 589 9.5
Relative should ask for 562 610 8.5 612 637 4.1
Relative will be offered 442 498 12.7 515 555 7.8
Relative should accept 517 554 7.2 568 592 4.2
Mean 491 538 9.5 557 589 5.7 aThe percent difference shows how much women have to increase in salaries in order to have the same as men.
bAdjusted means for respondents’
self-reported salaries in all cases. *p = 0.054, which means that non-managerial staff thought that the applicant would accept lower salaries than managers thought, irrespective of applicant’s gender.
As with participants’ gender and position, participants in all age groups suggested lower salaries for women than men on all 10 measures (results not shown in a table). In addition, there was no significant interaction between participants’ age and the gender of the CV, which means that there are not differential effects of age in terms of suggesting salaries to women or men – women “obtained” lower salaries on average from all age groups. Participants’ age had significant effects on salary
measures in three cases. These dealt with how much salary they would offer the applicant (p = 0.006) and how much they thought the applicant would accept (p = 0.002) for the sales representative’s job, and how much salary they thought their niece/nephew would be offered for the manager’s position (p = 0.045). In the first two cases, the oldest participants (45 years or older) suggested higher salaries than the younger ones, and in the last case, older participants suggested lower salaries than the youngest (younger than 35 years old). DISCUSSION Female applicants were both offered a lower salary than male applicants, and participants thought that female applicants would accept a lower salary than male applicants for both the sales representative and manager’s job, irrespective of participants’ gender, age, or position. Participants also suggested lower salaries for nieces than nephews on all three salary measures, that is, 1) what participants recommended nieces or nephews
to ask for in salaries, 2) what they thought nieces or nephews would be offered, and 3) how much salary participants recommended nieces or nephews to accept – all three also irrespective of participants’ gender, age, or position. Therefore, both hypotheses were supported: that a woman will be offered a lower salary than a man, despite having identical CVs; and that a niece will be advised to ask for a lower salary than a nephew, again despite having identical CVs.
This difference in salaries offered and suggested, which was 10% on average, is only due to the fact that participants either saw a CV with a female or male name. Features of the names other than the gender, e.g. peculiarities of the names, strangeness, or specific associations are highly unlikely, as the names are very common in Iceland – Anna, Gudrun, Gudmundur, and Sigurdur. It is very likely that each participant knew at least a few people with these names or had seen characters with those names in movies, books, or TV series. Therefore, the names on the CVs should not have evoked specific positive or negative attitudes from the participants, only an indication of gender.
These results of the differential salaries of women and men in the present experiment are not surprising, as research shows that women earn less than men in every part of the world (e.g. European Commission, 2014; ILO, 2016). In prior research on the reasons for the gender wage gap, the focus has been on issues such as work experience (Cho, 2007; Miyoshi, 2008), education (Miki and Yuval, 2011; Miyoshi, 2008; Nakavachara, 2010), and family obligations (Petersen et al., 2007), to name

only a few. There has also been research focus on less obvious reasons, such as personality traits (Semykina and Linz, 2007), negotiations (Roche, 2014), childhood sexual abuse (Robst, 2008), and having a woman as a boss (Cohen and Huffman, 2007; Maume and Ruppanner, 2015). All of these studies, except the two on having a woman as a boss, focused on reasons or attributes related to the employee or the working environment. The present research expands the focus to those who offer salaries or advice on them, yielding comparable results to the studies cited above. That is, women are offered lower salaries than men and are advised to ask and accept lower salaries than men.
As with the present experiment, the studies conducted by Cohen and Huffman (2007) and Maume and Ruppanner (2015) both focused on the boss, that is, the person who can affect the wages by, for example, negotiating the salaries. Both showed that having a woman as a boss tends to decrease the wage gap. That was, however, not supported in this experiment – female participants wanting to offer women lower salaries than men, just as did male participants. A possible reason for this discrepancy might be that in the present experiment, participants were not directly comparing women and men in terms of salaries – the difference being due to their unconscious attitudes regarding the worth of women’s and men’s work. On the other hand, a female manager dealing with both women and men for months or years in an organisation, might consciously try to correct the salary difference.
When taking their first steps into the job market, many will negotiate their salaries or accept or deny salaries that are offered when applying for a job. Consultation with more experienced relatives or other important figures can be important for young people in this regard, which has often been experienced by the authors in Iceland and in some other cultures as well. The present experiment gives indications that those important figures advise women to ask for and accept lower salaries than they would suggest to men. This might in turn contribute to maintaining the gender wage gap. The facts established by this experiment – all else being equal, women are offered less and advised to accept less – might partially explain the gender wage gap observed throughout the world. The related measures in this experiment, that is, that participants thought that female applicants would accept and be offered lower salaries than male applicants, support the observed difference in how highly women's and men's work are valued. This difference is also supported by the fact that the effect was found both in the case of the sales representative and manager’s positions. The latter does not, however, support the glass ceiling effect (that is, the gender wage gap is relatively greater at higher salaries) found in some of the previous research (Jurajda and Paligorova, 2009; Konstantopoulos and Constant, 2008; Navarro-Gómez and Rueda-Narváez, 2014; Popli, 2013).
Karlsson et al. 307 Furthermore, present results show that the gender wage gap was independent of three major background variables of the participants: their gender, age, and position. This poses a problem in finding possible causes of why people will offer or recommend lower salaries for women than men. Presuming that a woman’s work is worth the same as a man’s work and that people are not born with the notion that a woman’s work is worth less, the possible explanation must be sought in the environment. Therefore, one of the important next steps in research in this area would be to investigate the age at which this difference starts to emerge in the life of adolescents or even children. Important research questions would be how adolescents or children value typical female and male work in addition to jobs where there is a gender balance, and what factors in the upbringing of adolescents and children affect their evaluation of the worth of a woman and man’s work. These are important questions that need to be answered in our long journey towards bridging the gender wage gap.
A limitation of the present experiment is that it was conducted in a simulated environment. The participants were supposed to pretend that they were a human resources manager for one morning. In that regard, it is worth pointing out that despite the simulation participants were put into, differences in salaries between women and men were consistently obtained on several measures for two positions, and these differences were found in all background groups related to the participants. This simulated situation was a strength at the same time, as it made the experimental design possible, allowing stronger causal inferences that the difference in terms of salaries must have happened because people were dealing either with salaries for a woman or man. Another strength is that people in different jobs in several companies of different sizes and in all major industries were contacted, the high response rate of about 70% adding to the generality of the results.
Conclusion
The results of this experiment reveal the fact that women seem to be looked upon as being worth less than men in the job market, employees with very different backgrounds on five measures for two different jobs suggesting lower salaries on average when a CV had a female name opposed to a male name. Future research needs to look for answers in the adolescent environment, children needing to answer the question of why a woman’s name is worth less than that of a man. CONFLICT OF INTERESTS
The authors have not declared any conflict of interests.
308 Afr. J. Bus. Manage. ACKNOWLEDGEMENTS The authors are grateful to Dr. Leifur Geir Hafsteinsson for valuable advice on the experimental design and also appreciate Dr. Jack James, Dr. Kristjan Kristjansson, and Sarah Dearne for their insightful comments and suggestions on drafts of this paper. FUNDING This work was supported by a grant from The Equal Rights Research Foundation of The Prime Minister’s Office in Iceland. The Equal Rights Research Foundation had no involvement in the study. REFERENCES Aizer A (2010). The gender wage gap and domestic violence. The
American Economic Review 100:1847-1859. Akhmedjonov A (2012). New evidence on pay gap between men and
women in Turkey. Economics Letters 117:32-34. Barth E, Dale-Olsen H (2009). Monopsonistic discrimination, worker
turnover, and the gender wage gap. Labour Economics 16:589-597. Brown S, Roberts J, Taylor K (2011). The gender reservation wage gap:
Evidence from British panel data. Economics Letters 113:88-91. Chen Z, Ge Y, Lai H, Wan C (2013). Globalization and gender wage
inequality in China. World Development 44:256-266. Cho D (2007). Why is the gender earnings gap greater in Korea than in
the United States? Journal of the Japanese and International Economies 21:455-469.
Cohen PN, Huffman ML (2007). Working for the woman? Female managers and the gender wage gap. American Sociological Review 72:681-704.
Cukrowska-Torzewska E, Lovasz A (2016). Are children driving the gender wage gap? Economics of Transition 24:259-297.
de Ruijter JMP, Huffman ML (2003). Gender composition effects in the Netherlands: A multilevel analysis of occupational wage inequality. Social Science Research 32:312-334.
Elul R, Silva-Reus J, Volij O (2002). Will you marry me? A perspective on the gender gap. Journal of Economic Behavior and Organization 49:549-572.
Erosa A, Fuster L, Restuccia D (2002). Fertility decisions and gender differences in labor turnover, employment, and wages. Review of Economic Dynamics 5:856-891.
European Commission (2014). Tackling the gender pay gap in the European Union. Available at: https://op.europa.eu/en/publication-detail/-/publication/12106bd8-f56c-4c42-80ee-f80fd3e035d5
Furnham A, Wilson E (2011). Gender differences in estimated salaries: A UK study. The Journal of Socio-Economics 40:623-630.
Grönlund A, Magnusson C (2013). Devaluation, crowding or skill specificity? Exploring the mechanisms behind the lower wages in female professions. Social Science Research 42:1006-1017.
Guimarães CRFF, Silva JR (2016). Pay gap by gender in the tourism industry of Brazil. Tourism Management 52:440-450.
Hallward-Driemeier M, Rijkers B, Waxman A (2015). Can minimum wages close the gender wage gap? Evidence from Indonesia. The Review of Income and Health 61:1-25.
Harris P (2015). Global gender pay gap survey for Glassdoor. https://media.glassdoor.com/pr/press/pdf/GD_Survey_GlobalGenderPayGap.pdf
International Labour Organization (ILO) (2016). Women at work: Trends 2016. Available at: http://www.ilo.org/wcmsp5/groups/public/---dgreports/---dcomm/---publ/documents/publication/wcms_457317.pdf
Jurajda Š, Paligorova T (2009). Czech female managers and their
wages. Labour Economics 16:342-351. Kawachi I, Kennedy BP, Gupta V, Prothrow-Stith D (1999). Women's
status and the health of women and men: A view from the States. Social Science and Medicine 48:21-32.
Kim M (2013). Policies to end the gender wage gap in the United States. Review of Radical Political Economics 45:278-283.
Konstantopoulos S, Constant A (2008). The gender gap reloaded: Are school characteristics linked to labor market performance? Social Science Research 37:374-385.
Mandel H (2016). The role of occupational attributes in gender earnings inequality, 1970-2010. Social Science Research 55:122-138.
Maume DJ, Ruppanner L (2015). State liberalism, female supervisors, and the gender wage gap. Social Science Research 50:126-138.
Meagher G (2012). Recognition at last: Care work and the equal remuneration case. The Journal of Industry Relations 54:377-385.
Miki M, Yuval F (2011). Using education to reduce the wage gap between men and women. The Journal of Socio-Economics 40:412-416.
Miyoshi K (2008). Male–female wage differentials in Japan. Japan and the World Economy 20:479-496.
Nakavachara V (2010). Superior female education: Explaining the gender earnings gap trend in Thailand. Journal of Asian Economics 21:198-218.
Navarro-Gómez ML, Rueda-Narváez MF (2014). Sexual-based wage discrimination when educational outcomes are endogenous: The Spanish case. Procedia Social and Behavioral Sciences 116:1869-1874.
Noonan MC (2004). The impact of domestic work on men’s and women’s wages. Journal of Marriage and Family 63:1134-1145.
Nordman CJ, Robilliard A-S, Roubaud F (2011). Gender and ethnic earnings gaps in seven West African cities. Labour Economics 18:132-145 (Supplement: Labour markets in developing countries).
Petersen T, Snartland V, Meyersson Milgrom EM (2007). Are female workers less productive than male workers? Research in Social Stratification and Mobility 25:13-37.
Platt J, Prins S, Bates L, Keyes K (2016). Unequal depression for equal work? How the wage gap explains gendered disparities in mood disorders. Social Science and Medicine 149:1-8.
Popli GK (2013). Gender wage differentials in Mexico: A distributional approach. Journal of the Royal Statistical Society: Series A (Statistics in Society) 176:295-319.
Razzolini T, Leombruni R, Mastrobuoni G, Pagliero M (2014). Beneath the surface: The decline in gender injury gap. Labour Economics 30:282-288.
Rendall M (2012). Structural change in developing countries: Has it decreased gender inequality? World Development 45:1-16.
Robst J (2008). Childhood sexual abuse and the gender wage gap. Economics Letters 99:549-551.
Roche K (2014). An active-learning exercise on learning negotiation as a way to mitigate the gender wage gap for introductory microeconomics. International Review of Economics Education 15:32-42.
Semykina A, Linz SJ (2007). Gender differences in personality and earnings: Evidence from Russia. Journal of Economic Psychology 28:387-410.
Velferdarraduneytid (Ministry of Welfare) (2014). Launarannsóknir og átaksverkefni um launajafnrétti á vinnumarkaði (Wage research and initiatives of equal pay in the labor market). Available at: https://www.velferdarraduneyti.is/media/rit-og-skyrslur-2014/Adgerdahopur_vinnuskyrsla_LOKA300114.pdf

www.academicjournals.org
OP EN A C C ESS
OP EN A C C ESS
OP EN A C C ESS
OP EN A C C ESS
OP EN A C C ESS
OP EN A C C ESS
OP EN A C C ESS
OP EN A C C ESS
Journal of Accounting and Taxation
Journal of
Economics and International Finance
African Journal of
Marketing Management
African Journal of Business Management
OP EN A C C ESS
International Journal ofPeace and Development Studies
International Journal of
Sociology and Anthropology
Journal of Geography and Regional Planning
Journal of Hospitality Management and Tourism
Journal of Public Administration and
Policy Research