september kinross gold corporation 2017...
TRANSCRIPT

1www.kinross.com
1
KINROSS GOLD CORPORATIONTasiast Phase Two and Round Mountain Phase W feasibility study results
September
2017

2www.kinross.com
2
CAUTIONARY STATEMENT ON FORWARD-LOOKING INFORMATION
All statements, other than statements of historical fact, contained or incorporated by reference in or made in giving this presentation and responses toquestions, including but not limited to any information as to the future performance of Kinross, constitute “forward looking statements” within the meaning ofapplicable securities laws, including the provisions of the Securities Act (Ontario) and the provisions for “safe harbor” under the United States PrivateSecurities Litigation Reform Act of 1995 and are based on expectations, estimates and projections as of the date of this presentation. Forward-lookingstatements contained in this presentation include those statements on slides with, and statements made under, the headings “Attractive DevelopmentProjects”, “Tasiast Mill Expansion”, and “Round Mountain Phase W”, and include without limitation statements with respect to mine life extensions, costs andtiming of development activities, future production, production costs of sales, all-in sustaining cost and capital expenditures, continuous improvement andother cost savings opportunities, as well as references to other possible events include, without limitation, possible events; opportunities; statements withrespect to possible events or opportunities; estimates (including, without limitation, gold / mineral resources, gold / mineral reserves and mine life) and therealization of such estimates; future development, mining activities, production and growth, including but not limited to cost and timing; success of explorationor development of operations; the results of any studies including, without limitation, feasibility studies; the future price of gold and silver; currencyfluctuations; expected capital requirements; government regulation; and environmental risks. The words “anticipate”, “assumption”, “budget”, “enhancing”,“estimate”, “expect”, “feasibility”, “flexibility”, “forecast”, “forward”, “future”, “goal”, “growth”, “guidance”, “indicate”, “liquidity”, “momentum”, “objective”, “ontrack”, “opportunity”, “option”, “outlook”, “phased”, “plan”, “positive”, “possible”, “potential”, “progressing”, “project”, “risk”, or “study”, or variations of or similarsuch words and phrases or statements that certain actions, events or results may, can, could, would, should, might, indicates, or will be taken, and similarexpressions identify forward looking statements. Forward-looking statements are necessarily based upon a number of estimates and assumptions that, whileconsidered reasonable by Kinross as of the date of such statements, are inherently subject to significant business, economic and competitive uncertaintiesand contingencies. Statements representing management’s financial and other outlook have been prepared solely for purposes of expressing their currentviews regarding the Company’s financial and other outlook and may not be appropriate for any other purpose. Many of these uncertainties and contingenciescan affect, and could cause, Kinross’ actual results to differ materially from those expressed or implied in any forward looking statements made by, or onbehalf of, Kinross. There can be no assurance that forward looking statements will prove to be accurate, as actual results and future events could differmaterially from those anticipated in such statements. All of the forward looking statements made in this presentation are qualified by these cautionarystatements, and those made in our filings with the securities regulators of Canada and the U.S., including but not limited to those cautionary statementsmade in the “Risk Factors” section of our most recently filed Annual Information Form, the “Risk Analysis” section of our FYE 2016 and Q2 2017Management’s Discussion and Analysis, and the “Cautionary Statement on Forward-Looking Information” in our news release dated September 18, 2017, towhich readers are referred and which are incorporated by reference in this presentation, all of which qualify any and all forward‐looking statements made inthis presentation. These factors are not intended to represent a complete list of the factors that could affect Kinross. Kinross disclaims any intention orobligation to update or revise any forward‐looking statements or to explain any material difference between subsequent actual events and suchforward‐looking statements, except to the extent required by applicable law.
Other information
Where we say "we", "us", "our", the "Company", or "Kinross" in this presentation, we mean Kinross Gold Corporation and/or one or more or all of itssubsidiaries, as may be applicable.
The technical information about the Company’s mineral properties contained in this presentation has been prepared under the supervision of Mr. John Sims,an officer of the Company who is a “qualified person” within the meaning of National Instrument 43-101.

3www.kinross.com
3
ATTRACTIVE DEVELOPMENT PROJECTS
DECISION TO PROCEED WITH TASIAST PHASE TWO AND ROUND MOUNTAIN PHASE W PROJECTS• Completed the Phase Two and Phase W feasibility studies with positive results• Reaffirmed Phase Two’s potential to transform Tasiast into a world-class operation,
with significant production, low all-in sustaining costs and a long estimated mine life• Pending permitting approval, Phase W is expected to generate solid returns and
extend mining at one of our most consistent US operations
3

4www.kinross.com
4
BALANCE SHEET STRENGTH
SOLID FINANCIAL POSITION
$1.1B
$1.4B
Cash & cash equivalents Undrawn credit facilities
LIQUIDITY POSITION
Strong financial position to finance Tasiast Phase 2 and Round Mountain Phase W projects with existing liquidity
FINANCIAL FLEXIBILITY
• Cash and cash equivalents of $1.1 billion as at June 30, 2017
Increase of $240 million since Q1 2017 resulting from sale of non-core assets
• Net debt to EBITDA as at June 30, 2017: 0.6x
• No debt maturities prior to 2021
As at June 30
$2.5B

5www.kinross.com
5TASIAST MILL EXPANSIONATTRACTIVE DEVELOPMENT PROJECTS 5

6www.kinross.com
6
$0
$200
$400
$600
$800
$1,000
$1,200
0
100
200
300
400
500
600
700
800
Historical operation Phase One Phase Two
Production Cost of sales
ATTRACTIVE DEVELOPMENT PROJECTS
TASIAST TWO-PHASED EXPANSIONPhase Two expected to transform Tasiast into a world-class mine with costs amongst the
lowest in our portfolio
(i) Average for the past 5 years (2012 to 2016)(ii) Per results of the Phase One feasibility study. Annual averages for the period 2018 to 2027.(iii) Per the result of the Phase Two feasibility study. Annual averages for the period 2020 to 2024.
Prod
uctio
n (th
ousa
nd o
unce
s)
Cos
t of s
ales
($/o
z.)
(i) (ii) (iii)
7www.kinross.com
7
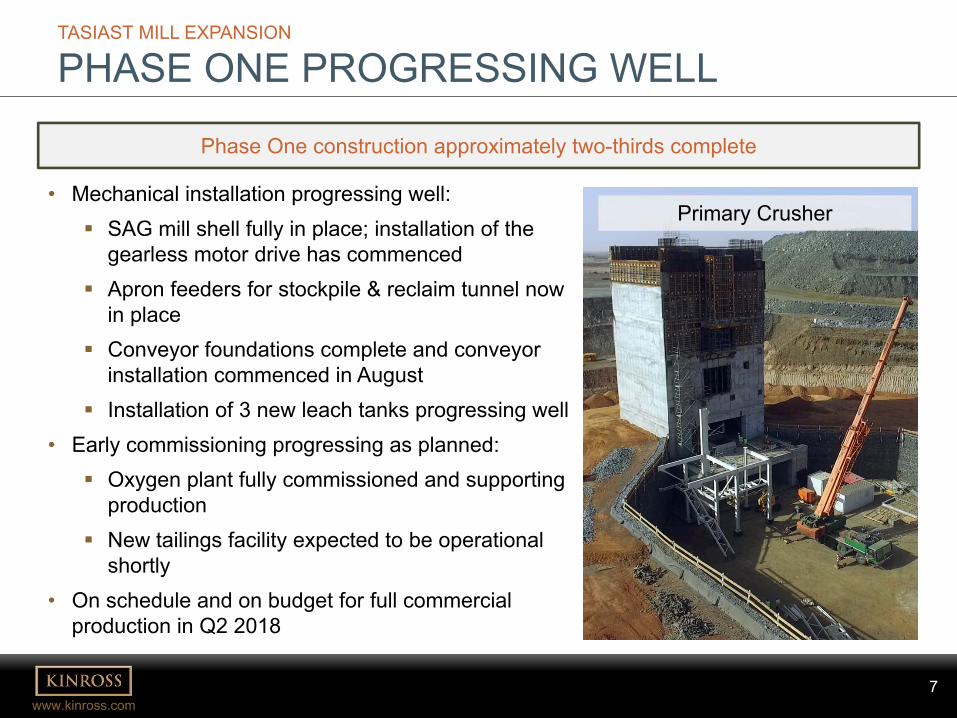
TASIAST MILL EXPANSION
PHASE ONE PROGRESSING WELL
• Mechanical installation progressing well: SAG mill shell fully in place; installation of the
gearless motor drive has commenced Apron feeders for stockpile & reclaim tunnel now
in place Conveyor foundations complete and conveyor
installation commenced in August Installation of 3 new leach tanks progressing well
• Early commissioning progressing as planned: Oxygen plant fully commissioned and supporting
production New tailings facility expected to be operational
shortly• On schedule and on budget for full commercial
production in Q2 2018
Phase One construction approximately two-thirds complete
Primary Crusher

8www.kinross.com
8
TASIAST MILL EXPANSION
PHASE ONE PROGRESSING WELL
Phase One on schedule & on budget with full commercial production expected in Q2 2018
Reclaim tunnelSAG mill
Leach tanks Oxygen plant

9www.kinross.com
9
Phase Two expansion expected to transform Tasiast into a world-class mine with low costs and a long estimated mine life
TASIAST MILL EXPANSION
PHASE TWO FEASIBILITY STUDY RESULTS
Combined Phase One and Phase TwoAverage annual production (2020-2024) 812,000 ounces
Production cost of sales (2020-2024) $440 per ounce
All-in sustaining cost (2020-2024) $655 per ounce
Capitalized stripping (non-sustaining) (2016-H1 2020) $560 million
Mine life 2029
Net present value(i)(ii) $1.43 billion
Phase Two Stand-AloneInitial capital expenditures $590 million
Internal rate of return(i) 24%
Note: figures on this slide reflect a $1,200 per ounce gold price assumption.(i) January 1, 2018 forward(ii) After tax, 5% discount rate.

10www.kinross.com
10
Study estimates(ii)Study estimates(ii)
$25.46
$22.84 $22.24
$15.16 $14.40
2015 2016 H1 2017 PFS FS
$2.18$2.05 $1.96
$2.37$2.25
2015 2016 H1 2017 PFS FS
TASIAST MILL EXPANSION
OPERATING EFFICIENCIES ENHANCING PROJECT
Recent operating and processing enhancements have positively benefitted both Phase One and Phase Two expansion projects
• Recent performance outperforming study estimates
• Further reduction in processing costs expected as Phase Two increases throughput to 30,000 t/d
Mining costs($ per tonne mined)
Processing costs($ per tonne milled)(i)
(i) Excludes processing costs associated with the dump leach.(ii) 30k t/d scenario. Estimated average for the period 2020-2030.

11www.kinross.com
11
TASIAST MILL EXPANSION
ADVANCING PHASE TWO
• Project owner’s team established
• Finalizing commercial terms for EPCM package
• Currently advancing critical packages
• Initial construction expected to begin early 2018
Construction activities to ramp up following Phase One commissioning
• Phase Two expected to reach commercial production in Q3 2020
Phase Two expansion expected to reach commercial production in Q3 2020

12www.kinross.com
12
ATTRACTIVE DEVELOPMENT PROJECTS
TASIAST PHASE TWO• Expected to transform Tasiast into a world-class operation, offering a rare
combination of production scale, low costs and relatively low project execution risk
12

13www.kinross.com
13ROUND MOUNTAIN PHASE WATTRACTIVE DEVELOPMENT PROJECTS 13
14www.kinross.com
14
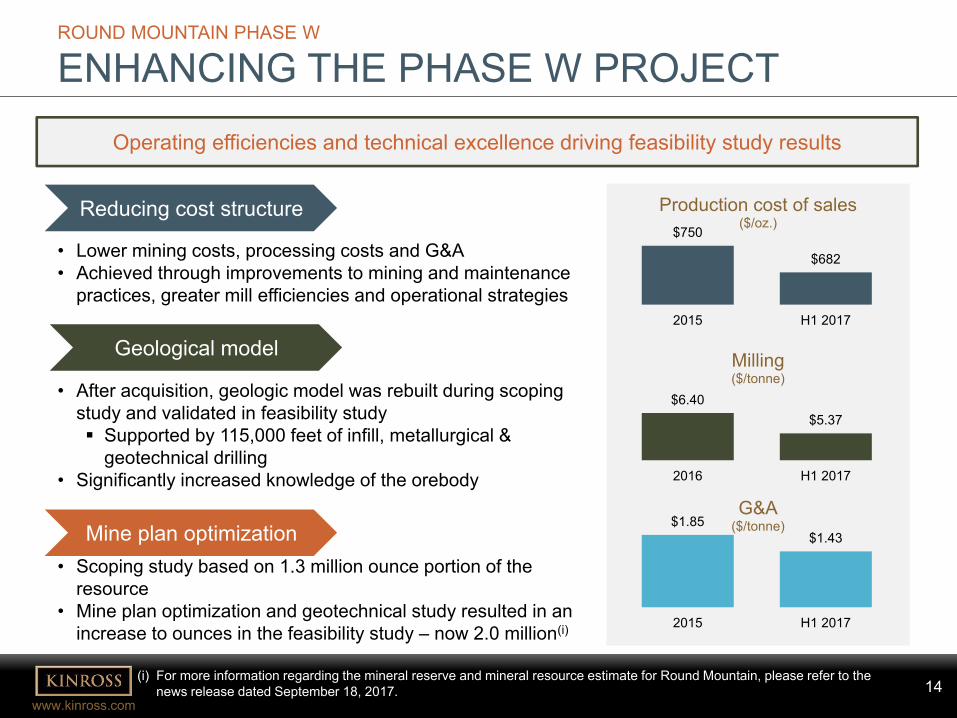
ROUND MOUNTAIN PHASE W
ENHANCING THE PHASE W PROJECTOperating efficiencies and technical excellence driving feasibility study results
Reducing cost structure
• Lower mining costs, processing costs and G&A• Achieved through improvements to mining and maintenance
practices, greater mill efficiencies and operational strategies
Geological model
• After acquisition, geologic model was rebuilt during scoping study and validated in feasibility study Supported by 115,000 feet of infill, metallurgical &
geotechnical drilling• Significantly increased knowledge of the orebody
Mine plan optimization• Scoping study based on 1.3 million ounce portion of the
resource• Mine plan optimization and geotechnical study resulted in an
increase to ounces in the feasibility study – now 2.0 million(i)
$750
$682
2015 H1 2017
Production cost of sales($/oz.)
$6.40$5.37
2016 H1 2017
Milling($/tonne)
$1.85$1.43
2015 H1 2017
G&A($/tonne)
(i) For more information regarding the mineral reserve and mineral resource estimate for Round Mountain, please refer to the news release dated September 18, 2017.

15www.kinross.com
15
ROUND MOUNTAIN PHASE W
PHASE W OVERVIEWPhase W is a large zone of mineralization at depth and to west of the open-pit
• With completion of the feasibility study, 2.0 million ounces upgraded to proven and probable gold reserves(i)
Gold resource in line with 2016 year-end estimates: added ~2.0 million ounces of new Indicated mineral resources, replenishing ounces that were converted to reserves
(i) For more information regarding the mineral reserve and mineral resource estimate for Round Mountain, please refer to the news release dated September 19, 2017.

16www.kinross.com
16
ROUND MOUNTAIN PHASE W
FEASIBILITY STUDY RESULTSProject expected to generate a 13% IRR at an assumed gold price of $1,200 per ounce
Current mine plan + Phase WAverage annual production (2018-2024) 341,000 gold ounces
Production cost of sales (2018-2024) $765 per gold equivalent ounce
All-in sustaining cost (2018-2024) $905 per gold equivalent ounce
Mine lifeMining – 2024
Stockpile milling – 2025Residual leach – 2027
Phase W Stand AloneTotal ounces recovered 1.5 million ounces
Initial capital expenditures $230 million
Capitalized stripping (non-sustaining) $215 million
Internal rate of return(i) 13%
Net present value(i) (ii) $135 million
Note: figures on this slide reflect a $1,200 per ounce gold price assumption.(i) January 1, 2018 forward.(ii) After tax, 5% discount rate.
17www.kinross.com
17
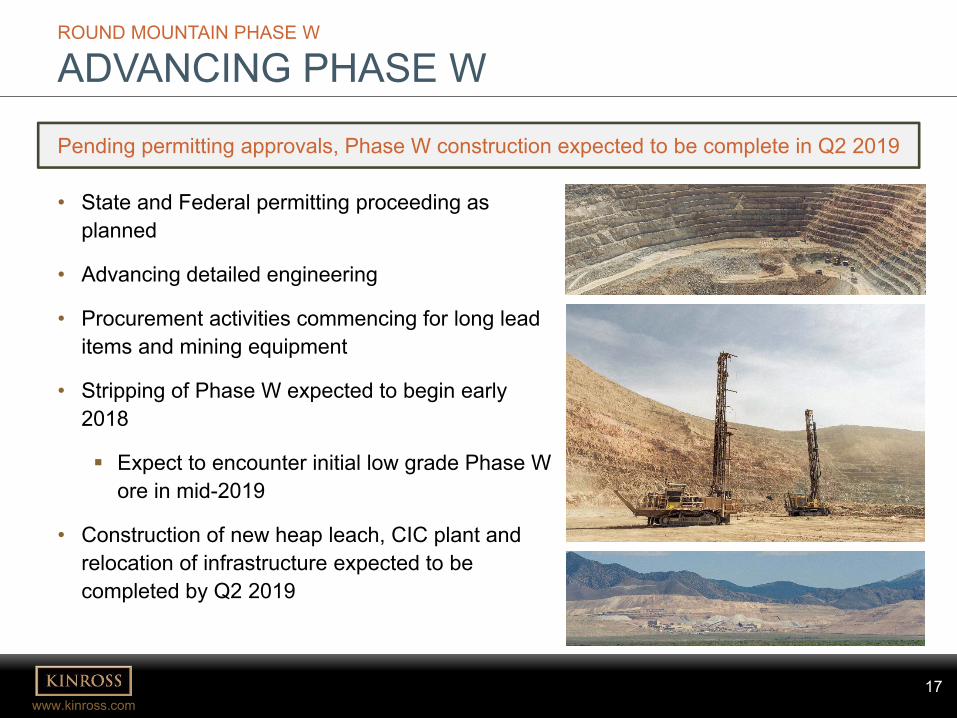
ROUND MOUNTAIN PHASE W
ADVANCING PHASE W
• State and Federal permitting proceeding as planned
• Advancing detailed engineering
• Procurement activities commencing for long lead items and mining equipment
• Stripping of Phase W expected to begin early 2018
Expect to encounter initial low grade Phase W ore in mid-2019
• Construction of new heap leach, CIC plant and relocation of infrastructure expected to be completed by Q2 2019
Pending permitting approvals, Phase W construction expected to be complete in Q2 2019

18www.kinross.com
18Building Momentum for the Future
18
DeliveredRECORD production
2016 Expecting a stronger year at BALD MOUNTAIN
2017 TASIASTPHASE ONE expected to be completed
2018 Expected completion of PHASE W construction
2019 Expected start-up ofTASIAST PHASE TWO
2020

19www.kinross.com
19APPENDIXTASIAST PHASE TWO AND ROUND MOUNTAIN PHASE W FEASIBILITY STUDY RESULTS 19

20www.kinross.com
20
TASIAST EXPANSION PROJECT
PHASE ONE: EXPANSION TO 12,000 T/D
PHASE ONE FLOW SHEET
• Leverages existing mill infrastructure to increase throughput to 12,000 t/d from 8,000 t/d
• Includes installation of an oversized 40’ SAG mill and gyratory crusher
• Enhances processing of the harder, higher grade West Branch ore
Gyratory crusher
Ore stockpile
Oversized SAG mill
Existing ball mills
Leaching Refining
New Existing

21www.kinross.com
21
• Installation of an incremental 18,000 t/d of throughput capacity for a total combined capacity of 30,000 t/d
• Project consists of: • Replacing two 14’ ball mills with a new, larger 27’ ball mill• Expansion of power generation capacity by 35• Adding new leaching, thickening and refining capacity• Additions to mining fleet• Upgrades to water supply infrastructure
TASIAST EXPANSION PROJECT
PHASE TWO: EXPANSION TO 30,000 T/D
PHASE TWO FLOW SHEET
Gyratory crusher
Ore stockpile
SAG mill New, larger ball mill
Additional leaching capacity
Thickening
New Existing

22www.kinross.com
22
Timeline Operational Metric Estimate
2020-2024(First 5 years of Phase Two
operation)
Total tonnes mined 438 millionStrip ratio 6.4Average CIL grade processed 2.5 grams per tonneAverage annual production 812,000 ouncesAverage mining cost $2.05 per tonneAverage processing cost $14.50 per tonneProduction cost of sales $440 per ounceAll-in sustaining cost $655 per ounce
2025-2029(Remaining life
of mine)
Total tonnes mined 141 million tonnesStrip ratio 4.8Average CIL grade processed 1.5 grams per tonneAverage annual production 457,000 ouncesAverage mining and re-handle cost $2.75 per tonneAverage processing cost $14.30 per tonneProduction cost of sales $680 per ounceAll-in sustaining cost $835 per ounce
2020-2029(Life of project)
Total tonnes mined 579 million tonnesStrip ratio 5.9Average CIL grade processed 2.0 grams per tonneAverage recovery 93%Average annual production 634,000 ouncesAverage mining cost $2.25 per tonneAverage processing cost $14.40 per tonneProduction cost of sales $530 per ounceAll-in sustaining cost $720 per ounce
TASIAST EXPANSION PROJECT
SUMMARY OF FEASIBILITY STUDY RESULTS
Estimated Initial Capital Cost
Operating Estimates (Phase One & Two combined)
Estimate ($ millions)
Processing plant 137
Power supply 76
Water supply 50
Mining fleet 49
EPCM 27
Indirect, owner’s cost and taxes 120
Contingency 79
Miscellaneous 52
Total $590
Standalone Phase Two Estimates
Estimate
Initial capital $590 million
Internal rate of return 24%

23www.kinross.com
23
GOLD PRICE SENSITIVITY ESTIMATES
TASIAST EXPANSION PROJECT
SENSITIVITIES
$1,100 $1,200 $1,300 $1,400IRR (Phase Two Standalone)(calculated January 1, 2018 forward)
19% 24% 28% 31%
NPV (Phase One and Two Combined)(after-tax, 5% discount; calculated January 1, 2018 forward)
$977M $1.43B $1.83B $2.22B
OIL PRICE SENSITIVITY ESTIMATES
$45/bbl $50/bbl $55/bbl $60/bbl $65/bbl
IRR (Phase Two Standalone)(calculated January 1, 2018 forward)
24.9% 24.6% 24.2% 23.9% 23.5%
NPV (Phase One and Two Combined)(after-tax, 5% discount; calculated January 1, 2018 forward)
$1.49B $1.46B $1.43B $1.39B $1.36B

24www.kinross.com
24
Timeline Operational Metric Estimate
2018-2024(Mining)
Strip ratio 2.9Average grade processed 0.7 grams per tonneAverage annual production(i) 341,000 ouncesAverage mining cost $2.00 per tonneAverage processing cost $4.60 per tonneProduction cost of sales $765 per Au eq. oz.All-in sustaining cost $905 per Au eq. oz.
2025-2027(Stockpile milling/ residual leach)
Strip ratio N/AAverage grade processed 0.46 grams per tonneAverage annual production 46,000 ouncesAverage re-handle cost $1.80 per tonneAverage processing cost $14.70 per tonneProduction cost of sales $720 per Au eq. oz.All-in sustaining cost $785 per Au eq. oz.
2018-2027(Life of project)
Strip ratio 2.9Average grade processed 0.7 grams per tonneAverage annual production 253,000 ouncesAverage mining cost $2.00 per tonneAverage processing cost $4.80 per tonneProduction cost of sales $765 per Au eq. oz.All-in sustaining cost $900 per Au eq. oz.
ROUND MOUNTAIN PHASE W
SUMMARY OF FEASIBILITY STUDY RESULTS
Estimated Phase W Initial Capital Cost
Operating Estimates (current mine plan + Phase W)
Estimate ($ millions)Mining fleet 73Infrastructure 65Heap leach pad 21Process facilities 17Tailings 9Indirect and owner’s cost 18Contingency 27Total $230
Standalone Phase W EstimatesEstimate
Life of mine production 1.5 million ouncesLife of mine ore processed 77.6 million tonnesAverage grade processed 0.8 grams per tonneStrip ratio 4.0Initial capital costs $230 millionCapitalized stripping (non-sustaining) $215 millionInternal rate of return 13%NPV $135 million
(i) Includes years with large variances from the forecast average of up to +/- 150,000 ounces.(ii) Proven mineral reserve estimates include reserve stockpiles of 24,281k tonnes at 0.40 g/t for a total stockpile of 312koz. Au.
Gold Reserve & Resource Estimates (as at July 31, 2017)
Tonnes(kt)
Grade(g/t)
Ounces(koz.)
Proven & Probable Reserves(ii) 137,204 0.70 3,107Measured & Indicated Resources 79,015 0.78 1,969Inferred Resources 63,822 0.83 1,700

25www.kinross.com
25
$1,100 $1,200 $1,300 $1,400
IRR (calculated January 1, 2018 forward)
7% 13% 17% 20%
NPV (after-tax, 5% discount; calculated January 1, 2018 forward)
$31M $135M $216M $295M
GOLD PRICE SENSITIVITY ESTIMATES
ROUND MOUNTAIN PHASE W
SENSITIVITIES
KEY ASSUMPTIONS:• Oil price: $55/bbl• Royalty: 6.35% for existing Round Mountain production and 4.0% for incremental Phase W production
(at $1,200/oz. gold)
OIL PRICE SENSITIVITY ESTIMATES
$45/bbl $55/bbl $60/bbl $65/bbl
IRR (calculated January 1, 2018 forward)
14.1% 12.7% 12.0% 11.3%
NPV (after-tax, 5% discount; calculated January 1, 2018 forward)
$159M $135M $123M $111M

26www.kinross.com
26
KINROSS GOLD CORPORATION 25 York Street, 17th Floor │Toronto, ON │ M5J 2V5www.kinross.com