sequelae of foodborne illness caused by 5 pathogens
TRANSCRIPT

Emerging Infectious Diseases • www.cdc.gov/eid • Vol. 20, No. 11, November 2014 1865
In Australia circa 2010, 4.1 million (90% credible interval [CrI] 2.3–6.4 million) episodes of foodborne gastroenteritis occurred, many of which might have resulted in sequelae. We estimated the number of illnesses, hospitalizations, and deaths from Guillain-Barré syndrome, hemolytic uremic syndrome, irritable bowel syndrome, and reactive arthritis that were associated with contaminated food in Australia. Data from published studies, hospital records, and mortality reports were combined with multipliers to adjust for differ-ent transmission routes. We used Monte Carlo simulation to estimate median estimates and 90% CrIs. In Australia, circa 2010, we estimated that 35,840 (90% CrI 25,000–54,000) illnesses, 1,080 (90% CrI 700–1,600) hospitalizations, and 10 (90% CrI 5–14) deaths occurred from foodborne gastro-enteritis–associated sequelae. Campylobacter spp. infec-tion was responsible for 80% of incident cases. Reducing the incidence of campylobacteriosis and other foodborne diseases would minimize the health effects of sequelae.
Foodborne gastroenteritis is a major source of illness in Australia, causing an estimated 4.1 million (90% cred-
ible interval [CrI] 2.3–6.4 million) illnesses, 30,600 (90% CrI 28,000–34,000) hospitalizations, and 60 (90% CrI 53–63) deaths each year (1). In addition to the direct ef-fects of these illnesses, infection with some pathogens can result in sequelae, which can be severe, require multiple hospitalizations, and be costly to society (2). We report on the effects of sequelae associated with Guillain-Barré syn-drome (GBS), hemolytic uremic syndrome (HUS), irritable bowel syndrome (IBS), and reactive arthritis (ReA) from 5 pathogens acquired from contaminated food in Australia.
Each of these 4 sequel illnesses are preceded by differ-ent gastrointestinal infections and have unique character-istics. GBS, a rare but serious autoimmune illness, affects the nervous system and causes acute flaccid paralysis. GBS can occur as a sequel to Campylobacter spp. infection 10 days–3 weeks after gastrointestinal illness (3,4). HUS is characterized by acute renal failure, hemolytic anemia, and thrombocytopenia and can result from infection with Shiga
toxin–producing Escherichia coli (STEC) ≈4–10 days after onset of gastroenteritis (5,6). IBS is a gastrointestinal dis-order that causes abdominal pain and bowel dysfunction. It is not life threatening, but it can cause substantial health effects after illness with Campylobacter spp., nontyphoidal Salmonella enterica serotypes (hereafter referred to as non-typhoidal Salmonella spp.), or Shigella spp. (7,8). ReA is a type of spondyloarthritis that can develop up to 4 weeks after an enteric infection from Campylobacter spp., nonty-phoidal Salmonella spp., Shigella spp., or Yersinia entero-colitica (9). We estimated the number of illnesses, hospi-talizations, and deaths resulting from GBS, HUS, IBS, and ReA from selected foodborne pathogens in Australia in a typical year circa 2010.
MethodsWe estimated the effects of foodborne sequelae ac-
quired in Australia circa 2010 using data from multiple sources in Australia and from international peer-reviewed literature. We defined foodborne sequelae as illnesses oc-curring after bacterial gastroenteritis caused by eating con-taminated food. Sequelae were defined as the secondary adverse health outcomes resulting from a previous infec-tion by a microbial pathogen and clearly distinguishable from the initial health event (10). Illness can be acute, such as with HUS, or chronic (lasting for many years), as with IBS. We estimated incidence, hospitalizations, and deaths with uncertainty bounds using Monte Carlo simulation in @Risk version 6 (http://www.palisade.com/), which incor-porates uncertainty in both data and inputs. Each stage of our calculation was represented by a probability distribu-tion, and our final estimates of incidence, hospitalizations, and deaths were summarized by the median and 90% CrI. Similar to a recent study in the United States (11), we used empirical distributions for source distributions, such as the number of hospitalizations or deaths, to avoid assumptions about the expected shape of these distributions. All other inputs were modeled by using the PERT (project evalua-tion and review technique) distribution, which enables the input of a minimum, maximum, and modal value, or 3 per-centile points, such as a median value and 95% bounds. We used this distribution widely in our analyses because
Sequelae of Foodborne Illness Caused by 5 Pathogens,
Australia, Circa 2010Laura Ford, Martyn Kirk, Kathryn Glass, and Gillian Hall
Author affiliation: Australian National University, Canberra, Australian Capital Territory, Australia
DOI: http://dx.doi.org/10.3201/eid2011.131316
RESEARCH
1866 Emerging Infectious Diseases • www.cdc.gov/eid • Vol. 20, No. 11, November 2014
it enables asymmetric distributions and can be produced from many data sources, including expert elicitation data. The Australian National University Human Research Eth-ics Committee approved the study.
Incidence of SequelaeSeveral pathogens are associated with the develop-
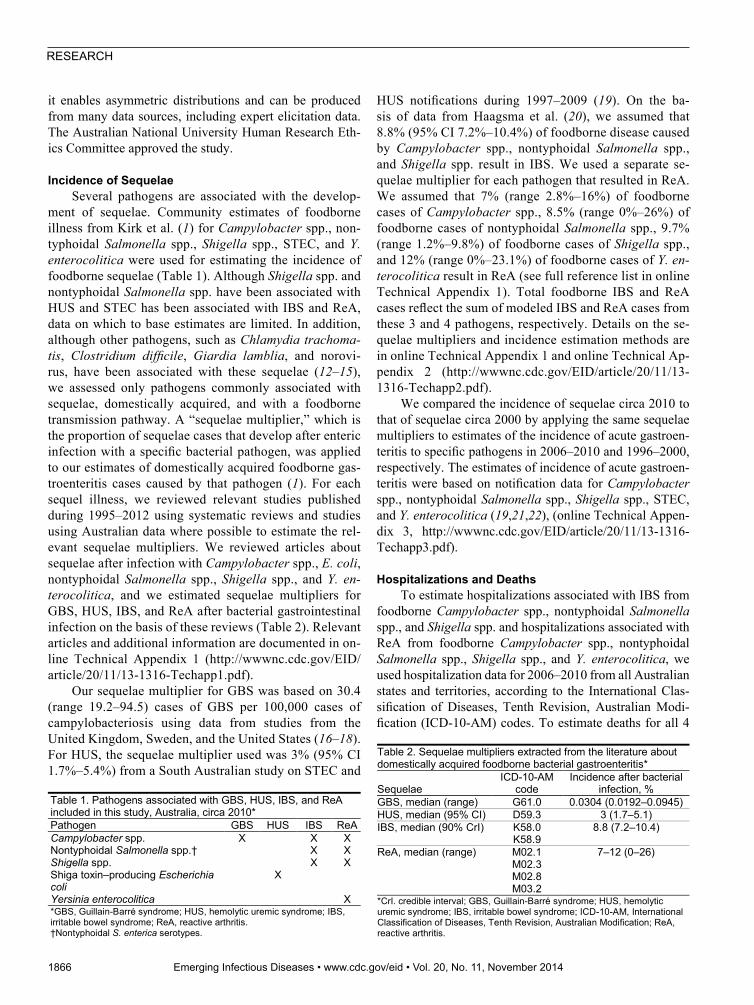
ment of sequelae. Community estimates of foodborne illness from Kirk et al. (1) for Campylobacter spp., non-typhoidal Salmonella spp., Shigella spp., STEC, and Y. enterocolitica were used for estimating the incidence of foodborne sequelae (Table 1). Although Shigella spp. and nontyphoidal Salmonella spp. have been associated with HUS and STEC has been associated with IBS and ReA, data on which to base estimates are limited. In addition, although other pathogens, such as Chlamydia trachoma-tis, Clostridium difficile, Giardia lamblia, and norovi-rus, have been associated with these sequelae (12–15), we assessed only pathogens commonly associated with sequelae, domestically acquired, and with a foodborne transmission pathway. A “sequelae multiplier,” which is the proportion of sequelae cases that develop after enteric infection with a specific bacterial pathogen, was applied to our estimates of domestically acquired foodborne gas-troenteritis cases caused by that pathogen (1). For each sequel illness, we reviewed relevant studies published during 1995–2012 using systematic reviews and studies using Australian data where possible to estimate the rel-evant sequelae multipliers. We reviewed articles about sequelae after infection with Campylobacter spp., E. coli, nontyphoidal Salmonella spp., Shigella spp., and Y. en-terocolitica, and we estimated sequelae multipliers for GBS, HUS, IBS, and ReA after bacterial gastrointestinal infection on the basis of these reviews (Table 2). Relevant articles and additional information are documented in on-line Technical Appendix 1 (http://wwwnc.cdc.gov/EID/article/20/11/13-1316-Techapp1.pdf).
Our sequelae multiplier for GBS was based on 30.4 (range 19.2–94.5) cases of GBS per 100,000 cases of campylobacteriosis using data from studies from the United Kingdom, Sweden, and the United States (16–18). For HUS, the sequelae multiplier used was 3% (95% CI 1.7%–5.4%) from a South Australian study on STEC and
HUS notifications during 1997–2009 (19). On the ba-sis of data from Haagsma et al. (20), we assumed that 8.8% (95% CI 7.2%–10.4%) of foodborne disease caused by Campylobacter spp., nontyphoidal Salmonella spp., and Shigella spp. result in IBS. We used a separate se-quelae multiplier for each pathogen that resulted in ReA. We assumed that 7% (range 2.8%–16%) of foodborne cases of Campylobacter spp., 8.5% (range 0%–26%) of foodborne cases of nontyphoidal Salmonella spp., 9.7% (range 1.2%–9.8%) of foodborne cases of Shigella spp., and 12% (range 0%–23.1%) of foodborne cases of Y. en-terocolitica result in ReA (see full reference list in online Technical Appendix 1). Total foodborne IBS and ReA cases reflect the sum of modeled IBS and ReA cases from these 3 and 4 pathogens, respectively. Details on the se-quelae multipliers and incidence estimation methods are in online Technical Appendix 1 and online Technical Ap-pendix 2 (http://wwwnc.cdc.gov/EID/article/20/11/13-1316-Techapp2.pdf).
We compared the incidence of sequelae circa 2010 to that of sequelae circa 2000 by applying the same sequelae multipliers to estimates of the incidence of acute gastroen-teritis to specific pathogens in 2006–2010 and 1996–2000, respectively. The estimates of incidence of acute gastroen-teritis were based on notification data for Campylobacter spp., nontyphoidal Salmonella spp., Shigella spp., STEC, and Y. enterocolitica (19,21,22), (online Technical Appen-dix 3, http://wwwnc.cdc.gov/EID/article/20/11/13-1316-Techapp3.pdf).
Hospitalizations and DeathsTo estimate hospitalizations associated with IBS from
foodborne Campylobacter spp., nontyphoidal Salmonella spp., and Shigella spp. and hospitalizations associated with ReA from foodborne Campylobacter spp., nontyphoidal Salmonella spp., Shigella spp., and Y. enterocolitica, we used hospitalization data for 2006–2010 from all Australian states and territories, according to the International Clas-sification of Diseases, Tenth Revision, Australian Modi-fication (ICD-10-AM) codes. To estimate deaths for all 4
Table 1. Pathogens associated with GBS, HUS, IBS, and ReA included in this study, Australia, circa 2010* Pathogen GBS HUS IBS ReA Campylobacter spp. X X X Nontyphoidal Salmonella spp.† X X Shigella spp. X X Shiga toxin–producing Escherichia coli
X
Yersinia enterocolitica X *GBS, Guillain-Barré syndrome; HUS, hemolytic uremic syndrome; IBS, irritable bowel syndrome; ReA, reactive arthritis. †Nontyphoidal S. enterica serotypes.
Table 2. Sequelae multipliers extracted from the literature about domestically acquired foodborne bacterial gastroenteritis*
Sequelae ICD-10-AM
code Incidence after bacterial
infection, % GBS, median (range) G61.0 0.0304 (0.0192–0.0945) HUS, median (95% CI) D59.3 3 (1.7–5.1) IBS, median (90% CrI) K58.0 8.8 (7.2–10.4) K58.9 ReA, median (range) M02.1 7–12 (0–26) M02.3 M02.8 M03.2 *CrI. credible interval; GBS, Guillain-Barré syndrome; HUS, hemolytic uremic syndrome; IBS, irritable bowel syndrome; ICD-10-AM, International Classification of Diseases, Tenth Revision, Australian Modification; ReA, reactive arthritis.

Sequelae of Foodborne Illness
Emerging Infectious Diseases • www.cdc.gov/eid • Vol. 20, No. 11, November 2014 1867
sequelae illnesses resulting from the respective foodborne pathogens, we used national death data for 2001–2010 from the Australian Bureau of Statistics, using ICD-10-AM codes (online Technical Appendix 4, http://wwwnc.cdc.gov/EID/article/20/11/13-1316-Techapp4.pdf). Princi-pal diagnosis and additional diagnoses were included for hospitalizations, and underlying and contributing causes were included for deaths. Because we had only 1 year of hospitalization data for Victoria and 2 years for New South Wales, we extrapolated from these data to derive a distri-bution of the number of hospitalizations across all states, which was modeled as an empirical distribution. For these states, we assumed the same number of hospitalizations each year to adjust for missing data. Because of the sever-ity of GBS and HUS, hospitalization estimates for these illnesses were not modeled, and all persons with estimated incident cases from contaminated food were considered to have been hospitalized.
We estimated incidences of hospitalization and death using a statistical model that incorporates uncertainty in case numbers and in multipliers using probability distribu-tions (Figure), which is adjusted from the hospitalization estimation flow chart in Kirk et al. (1). We assumed that all estimated incident foodborne Campylobacter-associ-ated GBS and STEC-associated HUS case-patients were hospitalized, so those cases were not modeled; however, multipliers were still needed for GBS and HUS to estimate deaths. Sequelae-associated deaths were estimated by us-ing the same methods as for hospitalizations (Figure). Input data arose from the data sources discussed above or from multipliers that are discussed below.
Domestically Acquired MultiplierThe “domestically acquired multiplier” adjusted for
the proportion of case-patients who acquired their infec-tion in Australia. We estimated domestically applied mul-tipliers for the antecedent bacterial gastrointestinal patho-gens using notifiable surveillance data from each state, extrapolated to give national estimates (1). We adopted the domestically acquired multiplier for Campylobacter spp. of 0.97 (90% CrI 0.91–0.99) for GBS and the do-mestically acquired multiplier for STEC 0.79 (90% CrI 0.73–0.83) for HUS (1). For IBS and ReA, a combined domestically acquired multiplier for Campylobacter spp., nontyphoidal Salmonella spp., and Shigella spp. for IBS and Campylobacter spp., nontyphoidal Salmonella spp., Shigella spp. and Y. enterocolitica for ReA was calculated as a weighted average of the domestically acquired mul-tipliers for each pathogen, weighted by the total number of IBS and ReA cases for each pathogen, respectively (online Technical Appendix 4; online Technical Appen-dix 5, http://wwwnc.cdc.gov/EID/article/20/11/13-1316-Techapp5.pdf).
Proportion Foodborne MultiplierFor each of the 4 sequelae, we calculated the proportion
of hospitalizations and deaths from foodborne pathogens using 2 multipliers: a “bacterial multiplier” to attribute the proportion of overall cases of each of the sequelae illnesses to specific pathogens and a “foodborne multiplier” to attri-bute illnesses to foodborne exposure. The bacterial multi-plier, which was the proportion of sequel cases attributable to their antecedent bacterial pathogen, was extracted from systematic reviews for GBS and HUS (4,23) and multiplied by the foodborne proportion for Campylobacter spp. and STEC, respectively. For IBS and ReA, from the literature we extracted a midpoint and range of the proportion of cas-es that resulted from infectious gastroenteritis (12,20,24). The IBS bacterial multiplier was then further multiplied by a foodborne multiplier for Campylobacter spp., nontyphoi-dal Salmonella spp., and Shigella spp., which was calcu-lated as a weighted average of the foodborne multipliers for each pathogen, weighted by the total number of IBS cases for each pathogen. The ReA bacterial multiplier was then also multiplied by the foodborne multiplier for Campylo-bacter spp., nontyphoidal Salmonella spp., Shigella spp., and Y. enterocolitica by using a weighted average of the foodborne multipliers for each pathogen as was done for IBS (online Technical Appendices 4 and 5).
Figure. Flow chart for the approach used to calculate the estimated annual number of hospitalizations for sequelae associated with foodborne illness caused by 5 pathogens, Australia, circa 2010.

1868 Emerging Infectious Diseases • www.cdc.gov/eid • Vol. 20, No. 11, November 2014
Results
IncidenceWe estimated that, circa 2010 in Australia, 70 (90%
CrI 30–150) new cases of Campylobacter-associated GBS, 70 (90% CrI 25–200) new cases of STEC-associated HUS, 19,500 (90% CrI 12,500–30,700) new cases of Campylo-bacter-, nontyphoidal Salmonella– and Shigella-associated IBS, and 16,200 (90% CrI 8,750–30,450) new cases of Campylobacter-, nontyphoidal Salmonella-, Shigella-, and Y. enterocolitica–associated ReA were domestically ac-quired and caused by contaminated food (Table 3). We es-timated that 35,840 (90% CrI 25,000–54,000) domestically acquired sequel illnesses resulted from foodborne gastroen-teritis—an incidence rate of 1,620 (90% CrI 1,150–2,450) sequelae cases per million population. Campylobacter spp. infection resulted in the largest number of sequelae cases annually; ≈80% of the 36,000 sequel illnesses were attrib-utable to Campylobacter spp. alone.
Comparison with Estimates Circa 2000Using data circa 2000, we estimated that 50 GBS cas-
es, 55 HUS cases, 14,800 IBS cases, and 12,500 ReA cases occurred each year. Elsewhere, we estimated that the rate of foodborne campylobacteriosis was approximately 13% higher in 2010 than 2000 (1); this increase led to a 13% increase in Campylobacter-associated GBS in 2010 over 2000. Similarly, we estimated that the rate of foodborne salmonellosis was 24% higher in 2010 than in 2000 (1). These factors combine to explain much of the increase in IBS and ReA. The rate of STEC-associated HUS remained about the same in 2000 and 2010 (online Technical Ap-pendix 3).
Hospitalizations and DeathsWe estimated that, circa 2010 in Australia, 1,080 (90%
CrI 700–1,600) hospitalizations for sequelae illnesses oc-curred from domestically acquired foodborne gastroenteri-tis, equating to 50 (90% CrI 30–70) hospitalizations per million population per year (Table 4). We estimated a total of 10 (90% CrI 5–14) deaths from sequelae to domestically acquired foodborne gastroenteritis—a rate of 0.5 (90% CrI 0.2–0.6) deaths per million population per year (Table 4).
DiscussionOur study demonstrates that foodborne gastroenteritis
in Australia results in substantial severe and disabling se-quelae. We estimated a yearly rate of 1,620 incident cases of sequelae illnesses, 50 hospitalizations, and 0.5 deaths per million population circa 2010. In addition, a compari-son with estimates recalculated for 2000 indicates an in-crease in the rates of GBS, IBS, and ReA since 2000, which is consistent with and directly related to rising levels of
antecedent foodborne illnesses caused by Campylobacter spp. and nontyphoidal Salmonella spp. during this period (1). This increase highlights the importance of quantifying sequelae when estimating the effects of foodborne disease and provides further impetus for reducing illness from foodborne bacterial pathogens.
The impact of Campylobacter spp. infection in the community is high. Approximately 179,000 cases of food-borne campylobacteriosis occur in Australia each year (1), and Campylobacter spp. was responsible for 80% of the foodborne sequelae illness estimated in this study. The reported rate of infection from Campylobacter spp. in Australia has increased since 2010 (1) and is higher than in many other industrialized countries. For example, the rate of Campylobacter spp. for Australia was ≈10 times higher than that for the United States (25), double that for the Netherlands (26), and slightly higher than that for the United Kingdom (27). In the Netherlands, a lower rate of acute Campylobacter spp. gastroenteritis has contributed to lower estimates of rates of sequel illnesses than our esti-mates for GBS, IBS, and ReA (26).
In New Zealand, food safety interventions have been effective in lowering campylobacteriosis rates and se-quelae. In 2006, high campylobacteriosis notification rates (>3,800 cases per million population) prompted increased research on Campylobacter spp., which resulted in the introduction of food safety and poultry industry interven-tions, including Campylobacter spp. performance targets at primary processing plants and promotion of freezing all fresh poultry meat (28). By 2008, the rate of campylobac-teriosis notifications decreased by 54% to 1,615 cases per million population (28). In addition, after these interven-tions in New Zealand, the rate of GBS hospitalizations de-creased by 13% (29). The less dramatic decrease in GBS than in campylobacteriosis might be explained by the fact that Campylobacter spp. is not the only cause of GBS. If Australia were to experience decreases similar to those in New Zealand, we would expect the rate of foodborne campylobacteriosis in the community to drop from approx-imately 8,400 to 3,864 cases per million population. Se-quelae would decrease from 1,620 to 870 cases per million population per year. Furthermore, total GBS-associated hospitalizations, including GBS from all causes and read-missions, would decrease from ≈73 to 63 hospitalizations per million population annually.
A comparison of our foodborne Campylobacter-as-sociated GBS incidence estimates with raw hospitaliza-tion data showed many more hospitalizations than incident cases. This finding probably is attributable to repeat hos-pitalizations. We took a conservative approach by basing incidence estimates on community estimates of campy-lobacteriosis and assuming that all persons with incident cases were hospitalized. A yearly median of 1,536 (range
RESEARCH

Sequelae of Foodborne Illness
Emerging Infectious Diseases • www.cdc.gov/eid • Vol. 20, No. 11, November 2014 1869
1,428–1,632) primary and additional GBS diagnoses oc-curred in Australian hospitals during 2006–2010 (includ-ing GBS from all causes and readmissions) and equates to a median rate of 73.1 (range 64.7–77.4) GBS-associated hospitalizations per million population each year. This rate is within the range from a New Zealand study, which found a median rate of 56.3 (range 42.1–75.9) GBS-associated hospitalizations during a 13-year period, with ≈41% of case-patients being readmitted, resulting in 23.2 (range 15.3 29.3) incident GBS hospitalizations per million popu-lation each year (29). If we assume that 41% of Australia’s 1,536 GBS hospitalizations are readmissions and apply the domestically acquired multiplier and foodborne proportion multiplier used to estimate GBS-associated deaths (online Technical Appendix 4), we would estimate 170 (90% CrI 60–265) incident foodborne Campylobacter-associated GBS hospitalizations. This point estimate is higher than our current estimate of 70, although the credible interval in-cludes our estimate. A validation study of medical records of persons with GBS would enable us to better characterize readmissions for GBS.
Our approach has several limitations. First, our com-parison of sequelae estimates for 2000–2010 assumes a constant rate of sequelae illness after gastrointestinal infec-tion over time. Although our methods provide an indirect method of assessing changes in sequelae incidence over time, the approach is useful because it enables comparison
of the population-level effect of sequelae at these 2 time points. Second, our study measured incidence and not prevalence of sequelae. We estimated the number of new cases every year and did not quantify the long-term effects of these sequelae. Third, our study does not estimate all sequelae illness from foodborne disease pathogens. We did not include sequelae, such as end-stage renal disease, inflammatory bowel disease, and encephalitis, in our esti-mates. We chose GBS, HUS, IBS, and ReA for this study because they were known, well studied, and well character-ized in available data sources. These provide a good basis to begin to understand the effects of foodborne sequelae and the policy implications of reducing illness from pre-ceding bacterial pathogens.
Our estimates for GBS, HUS, IBS, and ReA incidence relied heavily on the quality of the literature we reviewed. We used Australian data and systematic reviews wherever possible. The Australian hospitalization and deaths data we used were of high quality and included both principal and additional diagnoses from all states. However, because data were missing from some states in some years, we extrapo-lated from these data to the remaining years. Finally, ICD-10 and ICD-10-AM coding can be problematic when co-morbid conditions are present, when hospital transfers occur, or when diagnostic criteria are inconsistent. Therefore, our estimates for sequelae hospitalizations and deaths may be conservative because they do not account for these coding errors.
Table 3. Estimated number of sequelae illnesses resulting from domestically acquired foodborne bacterial gastroenteritis, Australia, circa 2010* Sequelae, pathogen Median no. Illnesses (90% CrI) Median rate (90% CrI)† GBS, Campylobacter spp. 70 (30–150) 3.1 (2–6) HUS, STEC 70 (25–200) 3.3 (1–9) IBS Campylobacter spp 15,600 (9,000–26,500) 915 (570–1,440) Nontyphoidal Salmonella spp.‡ 3,500 (1,900–6,500) Shigella spp. 30 (10–80) Total§ 19,500 (12,500–30,700) ReA Campylobacter spp. 12,500 (5,500–25,500) 765 (415–1,375) Nontyphoidal Salmonella spp.‡ 3,250 (700–9,000) Shigella spp. 29 (10–75) Yersinia enterocolitica 150 (50–300) Total§ 16,200 (8,500–30,000) Total 35,840 (25,000–54,000) 1,620 (1,150–2,450) *CrI, credible interval; GBS, Guillain-Barré syndrome; HUS, hemolytic uremic syndrome; IBS, irritable bowel syndrome; ReA, reactive arthritis; STEC, Shiga toxin–producing Escherichia coli. †No. cases per million population. ‡i.e., nontyphoidal S. enterica serotypes. §Simulated values, which might not add to total because of rounding and variation over simulations.
Table 4. Estimated number of sequelae-associated hospitalizations and deaths caused by domestically acquired foodborne bacterial gastroenteritis, Australia, circa 2010*
Sequelae Hospitalizations Deaths
Median no. (90% CrI) Rate (90% CrI)† Median no. (90% CrI) Rate (90% CrI)† GBS 70 (30–150) 3.1 (2–6) 6 (2–10) 0.3 (0.1–0.5) HUS 70 (25–200) 3.3 (1–9) 2 (1–3) 0.1 (0.03–0.12) IBS 915 (550–1,400) 43 (25–70) 2 (1–2) 0.1 (0.05–0.11) ReA 25 (20–40) 1 (1–2) 0 0 Total 1,080 (700–1,600) 50 (30–70) 10 (5–14) 0.5 (0.2–0.6) *CrI, credible interval. GBS, Guillain-Barré syndrome; HUS, hemolytic uremic syndrome; IBS, irritable bowel syndrome; ReA, reactive arthritis; STEC, Shiga toxin–producing Escherichia coli. †Cases per million population.

1870 Emerging Infectious Diseases • www.cdc.gov/eid • Vol. 20, No. 11, November 2014
The sequelae estimates from this study showed that the impact of foodborne Campylobacter spp., nontyphoidal Sal-monella spp., Shigella spp., STEC, and Y. enterocolitica was much greater then when consideration is given simply to the initial acute illness. Campylobacter spp. infection, in partic-ular, was highlighted as an increasing problem in Australia. Our estimates provide a basis for costing studies, which can be useful for developing food safety policies and interven-tions. Finally, our study highlights the need for better data from large population-based studies in Australia to further characterize sequelae, as well as foodborne pathogens.
AcknowledgmentsWe thank John Bates, Kathryn Brown, Duncan Craig, Mar-
garet Curran, Patricia Desmarchelier, Gerard Fitszimmons, Ka-tie Fullerton, Joy Gregory, David Jordan, Tony Merritt, Jennie Musto, Nevada Pingault, Jane Raupach, Craig Shadbolt, Martha Sinclair, Lisa Szabo, Hassan Vally, and Mark Veitch for their as-sistance with this study. We also thank the OzFoodNet network, public health laboratories, and health department staff in Australia for the robust collection of data on foodborne diseases.
This project was funded by the Australian Government De-partment of Health and Ageing, Food Standards Australia New Zealand and New South Wales Food Authority.
Ms Ford is a research assistant in the infectious disease and modelling group at the National Centre for Epidemiology and Population Health at the Australian National University. Her re-search interests include infectious diseases.
References 1. Kirk M, Ford L, Glass K, Hall G. Foodborne illness, Australia, circa
2000 and circa 2010. Emerg Infect Dis. 2014;20:1852–9. 2. Abelson P, Potter Forbes M, Hall G. The annual cost of foodborne
illness in Australia. Canberra (Australia): Commonwealth Depart-ment of Health and Ageing; 2006.
3. Hughes RA, Rees JH. Clinical and epidemiological features of Guillain-Barré syndrome. J Infect Dis. 1997;176(Suppl2):S92–8. http://dx.doi.org/10.1086/513793
4. Poropatich KO, Walker CL, Black RE. Quantifying the association between Campylobacter infection and Guillain-Barré syndrome: a systematic review. J Health Popul Nutr. 2010;28:545–52.
5. Elliott EJ, Robins-Browne RM. Hemolytic uremic syndrome. Curr Probl Pediatr Adolesc Health Care. 2005;35:310–30. http://dx.doi.org/10.1016/j.cppeds.2005.06.002
6. López EL, Contrini MM, Glastein E, Ayala SG, Santoro R, Ezcurra G, et al. An epidemiologic surveillance of Shiga-like toxin-producing Escherichia coli infection in Argentinean children: risk factors and serum Shiga-like toxin 2 values. Pediatr Infect Dis J. 2012;31:20–4. http://dx.doi.org/10.1097/INF.0b013e31822ea6cf
7. Thabane M, Kottachchi DT, Marshall JK. Systematic review and meta-analysis: the incidence and prognosis of post-infectious irritable bowel syndrome. Aliment Pharmacol Ther. 2007;26:535–44. http://dx.doi.org/10.1111/j.1365-2036.2007.03399.x
8. Dai N, Cong Y, Yuan H. Prevalence of irritable bowel syn-drome among undergraduates in southeast China. Dig Liver Dis. 2008;40:418–24. http://dx.doi.org/10.1016/j.dld.2008.01.019
9. Kim PS, Klausmeier TL, Orr DP. Reactive arthritis: a review. J Adolesc Health. 2009;44:309–15. http://dx.doi.org/10.1016/ j.jadohealth.2008.12.007
10. Parkin R, Davies-Cole J, Balbus J. A definition for chronic sequel-ae applied to campylobacter and Guillian-Barré syndrome (GBS). Ann Epidemiol. 2000;10:473. http://dx.doi.org/10.1016/S1047-2797(00)00108-3
11. Scallan E, Hoekstra RM, Angulo FJ, Tauxe RV, Widdowson MA, Roy SL, et al. Foodborne illness acquired in the United States—major pathogens. Emerg Infect Dis. 2011;17:7–15. http://dx.doi.org/10.3201/eid1701.P11101
12. Hannu T. Reactive arthritis. Best Pract Res Clin Rheumatol. 2011;25:347–57. http://dx.doi.org/10.1016/j.berh.2011.01.018
13. Alvarado AS, Brodsky SV, Nadasdy T, Singh N. Hemolytic uremic syndrome associated with Clostridium difficile infection. Clin Nephrol. 2014;81:302–6. http://dx.doi.org/10.5414/CN107691
14. D’Anchino M, Orlando D, De Feudis L. Giardia lamblia infections become clinically evident by eliciting symptoms of irritable bowel syndrome. J Infect. 2002;45:169–72. http://dx.doi.org/10.1016/S0163-4453(02)91038-8
15. Marshall JK, Thabane M, Borgaonkar MR, James C. Postinfectious irritable bowel syndrome after a food-borne outbreak of acute gastro-enteritis attributed to a viral pathogen. Clin Gastroenterol Hepatol. 2007;5:457–60. http://dx.doi.org/10.1016/j.cgh.2006. 11.025
16. Tam CC, Rodrigues LC, Petersen I, Islam A, Hayward A, O’Brien SJ. Incidence of Guillain-Barré syndrome among pa-tients with Campylobacter infection: a general practice research database study. J Infect Dis. 2006;194:95–7. http://dx.doi.org/10.1086/504294
17. McCarthy N, Giesecke J. Incidence of Guillain-Barré syndrome following infection with Campylobacter jejuni. Am J Epidemiol. 2001;153:610–4. http://dx.doi.org/10.1093/aje/153.6.610
18. Allos BM. Association between Campylobacter infection and Guillain-Barré syndrome. J Infect Dis. 1997;176(Suppl 2):S125–8. http://dx.doi.org/10.1086/513783
19. Vally H, Hall G, Dyda A, Raupach J, Knope K, Combs B, et al. Epidemiology of Shiga toxin producing Escherichia coli in Austra-lia, 2000–2010. BMC Public Health. 2012;12:63–71. http://dx.doi.org/10.1186/1471-2458-12-63
20. Haagsma JA, Siersema PD, De Wit NJ, Havelaar AH. Disease bur-den of post-infectious irritable bowel syndrome in the Netherlands. Epidemiol Infect. 2010;138:1650–6. http://dx.doi.org/10.1017/S0950268810000531
21. Government of Australia. National Notifiable Disease Surveillance System (NNDSS). [cited 2013 Apr 5]. http://www9.health.gov.au/cda/source/cda-index.cfm
22. Hall G, Kirk M. Foodborne illnesses in Australia: annual incidence circa 2000. Canberra (Australia): Commonwealth Department of Health and Ageing; 2005 April. report no. 0642825769.
23. Walker CL, Applegate JA, Black RE. Haemolytic-uraemic syn-drome as a sequela of diarrhoeal disease. J Health Popul Nutr. 2012;30:257–61. http://dx.doi.org/10.3329/jhpn.v30i3.12288
24. Schwille-Kiuntke J, Frick JS, Zanger P, Enck P. Post-infectious irritable bowel syndrome—a review of the literature. Z Gastroenterol. 2011;49:997–1003. http://dx.doi.org/10.1055/s-0031-1281581
25. Vally H, Hall G, Scallan E, Kirk MD, Angulo FJ. Higher rate of culture-confirmed Campylobacter infections in Australia than in the USA: is this due to differences in healthcare-seeking behaviour or stool culture frequency? Epidemiol Infect. 2009;137:1751–8. http://dx.doi.org/10.1017/S0950268809990161
26. Havelaar AH, Haagsma JA, Mangen MJ, Kemmeren JM, Verhoef LP, Vijgen SM, et al. Disease burden of foodborne patho-gens in the Netherlands, 2009. Int J Food Microbiol. 2012;156:231–8. http://dx.doi.org/10.1016/j.ijfoodmicro.2012.03.029
27. Tam CC, Rodrigues LC, Viviani L, Dodds JP, Evans MR, Hunter PR, et al. Longitudinal study of infectious intestinal disease in the UK (IID2
RESEARCH

Emerging Infectious Diseases • www.cdc.gov/eid • Vol. 20, No. 11, November 2014 1871
study): incidence in the community and presenting to general practice. Gut. 2012;61:69–77. http://dx.doi.org/10.1136/gut.2011.238386
28. Sears A, Baker MG, Wilson N, Marshall J, Muellner P, Campbell DM, et al. Marked campylobacteriosis decline after interventions aimed at poultry, New Zealand. Emerg Infect Dis. 2011;17:1007–15. http://dx.doi.org/10.3201/eid/1706.101272
29. Baker MG, Kvalsvig A, Zhang J, Lake R, Sears A, Wilson N. De-clining Guillain-Barré syndrome after campylobacteriosis control,
New Zealand, 1988–2010. Emerg Infect Dis. 2012;18:226–33. http://dx.doi.org/10.3201/eid1802.111126
Address for correspondence: Martyn Kirk, National Centre for
Epidemiology and Population Health, The Australian National University,
Canberra, ACT 0200, Australia; email: [email protected]
Find emerging infectious diseaseinformation on
http://www.facebook.com
Sequelae of Foodborne Illness

Page 1 of 14
Article DOI: http://dx.doi.org/10.3201/eid2011.131316
Sequelae of Foodborne Illness Caused by 5 Pathogens, Australia, Circa 2010
Technical Appendix 1
Sequelae Incidence after Bacterial Gastroenteritis: The Sequelae Multiplier
For each sequel, a multiplier was used that estimated the proportion of bacterial
gastroenteritis cases that developed into chronic sequelae. This appendix summarizes the
relevant studies published during 1995–2012, which we selected for review, as well as the
sequelae multipliers that were estimated for Guillain-Barré syndrome (GBS), hemolytic uremic
syndrome (HUS), irritable bowel syndrome (IBS), and reactive arthritis (ReA).
GBS
A few studies have quantified the incidence of GBS illness following Campylobacter
spp. infection by using large cohorts of patients or the literature (online Technical Appendix 1
Table 1). In a population-based cohort study in the United Kingdom, including 2 months of
follow-up, 3 cases of GBS occurred among 15,587 Campylobacter spp. cases. This yielded a rate
of 19.2 cases of GBS per 100,000 cases of campylobacteriosis (1). In Sweden, 0.03% of a cohort
of 29,567 persons with laboratory-confirmed C. jejuni infection developed GBS illness after 2
months of follow-up, yielding an annual incidence of 30.4 cases of GBS per 100,000 cases (95%
CI 13.9–57.8) of C. jejuni infection (2). In a literature review, Allos (3) estimated that in the
United States, GBS develops in 1 of every 1,058 cases, or 94.5 per 100,000 cases, of C. jejuni
infection. Baker et al. (4) performed a study of hospital records in New Zealand, which found a
rate of 414 cases of GBS per 100,000 Campylobacter spp. hospitalizations.
For the sequelae multiplier, a midpoint of 30.4 cases of GBS per 1000,000 cases of
campylobacteriosis was taken from the study by McCarthy and Gieseke (2) using a minimum
value of 19.2 per 100,000 from the UK study and a maximum value of 94.5 per 100,000 from the
study by Allos (3). Although the study by Baker et al. (4) is a valuable one, we excluded it from

Page 2 of 14
the calculation of our sequelae multiplier because persons hospitalized with Campylobacter spp.
infection may not be representative of Campylobacter spp. cases in the community.
Technical Appendix 1 Table 1. Incidence of GBS after infection with Campylobacter spp.*
Reference Study years Type of study Country No. GBS cases/Campylobacter spp.
patients Incidence per 100,000
(95% CI) Baker et al. (4) 1995–2008 Cohort New Zealand 35/8,448 hospitalizations 414 (373–459) Tam et al. (1) 1991–2001 Cohort UK 3/15,587 cases 19.2 (17.1–21.5) McCarthy and Giesecke (2)
1987–1995 Cohort Sweden 9/29,563 cases 30.4 (13.9–57.8)
Allos (3) 1964–1996† Review and estimation
Global/USA 1/1058 cases 94.5 (2.4–525)
*GBS, Guillain-Barré syndrome. †Years of reviewed studies.
HUS
A variety of organisms, drugs and conditions can initiate the symptoms of HUS, but the
majority of HUS cases are post-diarrheal—usually caused by Shiga toxin–producing Escherichia
coli (STEC) (5). In developed communities, STEC is the most commonly implicated organism in
HUS (6), and in children, 90% of HUS cases are due to STEC (5). HUS is also associated with
Shigella dysenteria serotype 1, particularly in less developed communities (6); however, a recent
systematic review was unable to find an adequate number of studies to quantify the association
between S. dysenteria serotype 1 and HUS (7). In addition, in a few studies, HUS has been
associated with Clostridium difficile and Salmonella enterica serotype Typhi, but the evidence is
limited (8–10). Therefore we estimated food-related HUS cases as a sequel to STEC, which may
create an underestimation of HUS if there are food-related HUS cases in Australia from other
organisms.
Several sources have reported that 3%-7% of sporadic STEC infections develop into
HUS (11–14). Australian studies support this estimate range. Vally et al. (15) examined South
Australian surveillance data and identified 14 HUS cases and 460 STEC cases, resulting in an
estimate of 3% of STEC cases developing into HUS. Sixty percent of HUS case-patients were
<15 years of age. In addition, in a case–control study in 6 Australian jurisdictions, 113 STEC
case-patients were identified, 44 of whom were infected with O157 and 66 who were infected
with non-O157 (14). Eight (7%) of all the STEC cases, 1 (2%) case-patient with O157, and 7
(10%) case-patients infected with non-O157 developed HUS (14). Although STEC O157 is more
commonly associated with HUS worldwide (6), data on geographic differences in STEC
serotypes suggest that in Australia, “non-O157:H7 STEC strains predominate,” and STEC
O157:H7 is not as frequently implicated in “diarrhea-associated HUS” (16).
Page 3 of 14
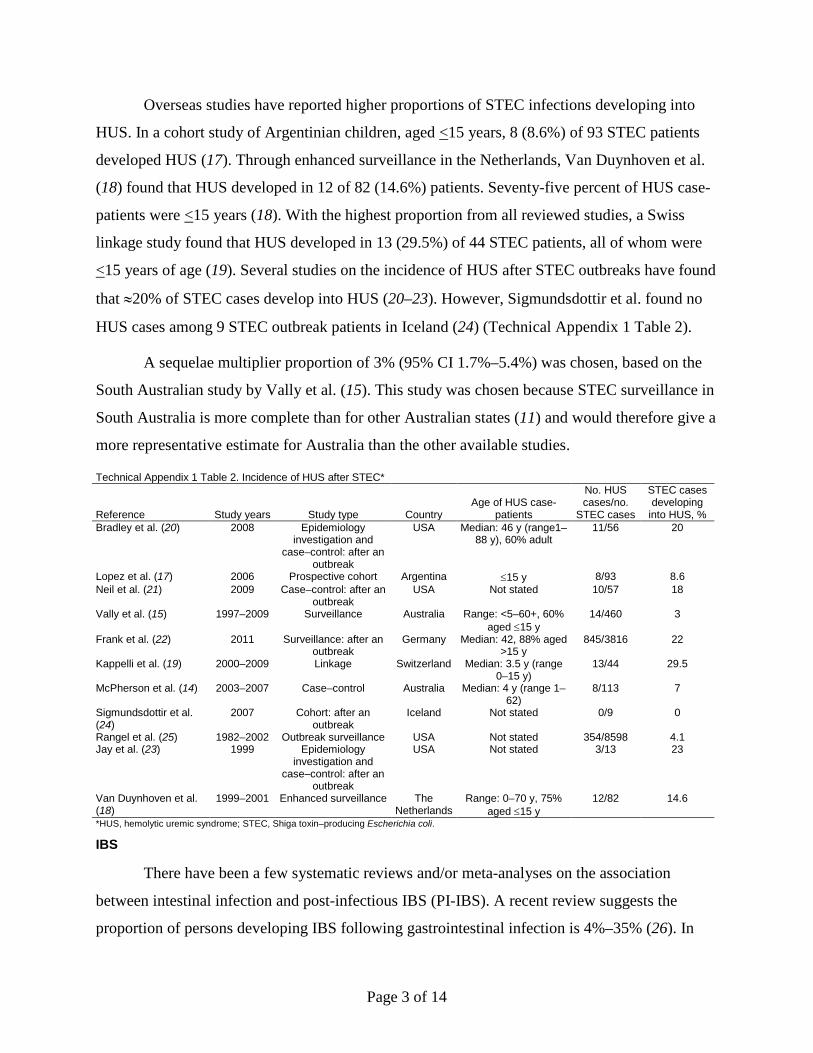
Overseas studies have reported higher proportions of STEC infections developing into
HUS. In a cohort study of Argentinian children, aged <15 years, 8 (8.6%) of 93 STEC patients
developed HUS (17). Through enhanced surveillance in the Netherlands, Van Duynhoven et al.
(18) found that HUS developed in 12 of 82 (14.6%) patients. Seventy-five percent of HUS case-
patients were <15 years (18). With the highest proportion from all reviewed studies, a Swiss
linkage study found that HUS developed in 13 (29.5%) of 44 STEC patients, all of whom were
<15 years of age (19). Several studies on the incidence of HUS after STEC outbreaks have found
that ≈20% of STEC cases develop into HUS (20–23). However, Sigmundsdottir et al. found no
HUS cases among 9 STEC outbreak patients in Iceland (24) (Technical Appendix 1 Table 2).
A sequelae multiplier proportion of 3% (95% CI 1.7%–5.4%) was chosen, based on the
South Australian study by Vally et al. (15). This study was chosen because STEC surveillance in
South Australia is more complete than for other Australian states (11) and would therefore give a
more representative estimate for Australia than the other available studies.
Technical Appendix 1 Table 2. Incidence of HUS after STEC*
Reference Study years Study type Country Age of HUS case-
patients
No. HUS cases/no.
STEC cases
STEC cases developing
into HUS, % Bradley et al. (20) 2008 Epidemiology
investigation and case–control: after an
outbreak
USA Median: 46 y (range1–88 y), 60% adult
11/56 20
Lopez et al. (17) 2006 Prospective cohort Argentina ≤15 y 8/93 8.6 Neil et al. (21) 2009 Case–control: after an
outbreak USA Not stated
10/57 18
Vally et al. (15) 1997–2009 Surveillance Australia Range: <5–60+, 60% aged ≤15 y
14/460 3
Frank et al. (22) 2011 Surveillance: after an outbreak
Germany Median: 42, 88% aged >15 y
845/3816 22
Kappelli et al. (19) 2000–2009 Linkage Switzerland Median: 3.5 y (range 0–15 y)
13/44 29.5
McPherson et al. (14) 2003–2007 Case–control Australia Median: 4 y (range 1–62)
8/113 7
Sigmundsdottir et al. (24)
2007 Cohort: after an outbreak
Iceland Not stated 0/9 0
Rangel et al. (25) 1982–2002 Outbreak surveillance USA Not stated 354/8598 4.1 Jay et al. (23) 1999 Epidemiology
investigation and case–control: after an
outbreak
USA Not stated 3/13 23
Van Duynhoven et al. (18)
1999–2001 Enhanced surveillance The Netherlands
Range: 0–70 y, 75% aged ≤15 y
12/82 14.6
*HUS, hemolytic uremic syndrome; STEC, Shiga toxin–producing Escherichia coli.
IBS
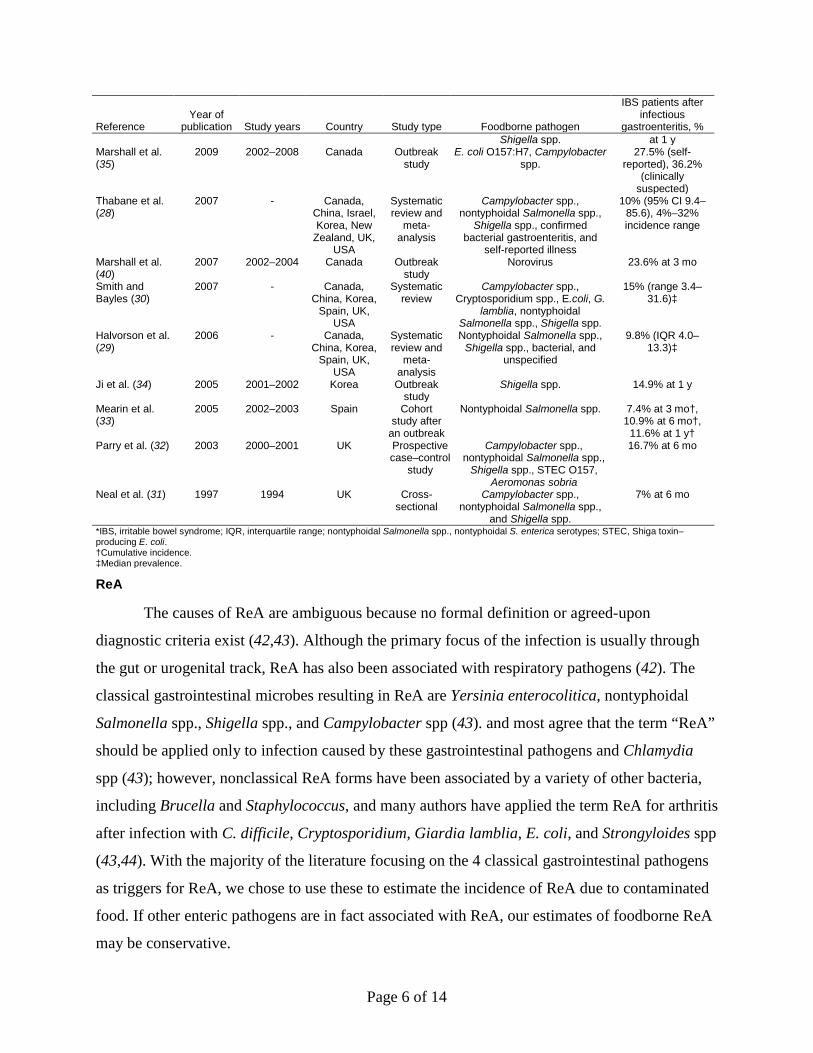
There have been a few systematic reviews and/or meta-analyses on the association
between intestinal infection and post-infectious IBS (PI-IBS). A recent review suggests the
proportion of persons developing IBS following gastrointestinal infection is 4%–35% (26). In

Page 4 of 14
2010, Haagsma et al. (27) found that 1 year after infection from nontyphoidal S. enterica
serotypes (hereafter referred to as nontyphoidal Salmonella spp.), nontyphoidal Salmonella spp.,
Shigella spp., or Campylobacter spp., IBS developed in 9% (95% CI 7.2–10.7) of patients.
Similarly, in a systematic review of 18 studies, Thabane et al. (28) found a pooled incidence of
PI-IBS of 10% (95% CI 9.4–85.6). Comparably, Halvorson et al. (29) reviewed 8 studies on
nontyphoidal Salmonella spp., Shigella spp., bacterial unspecified, or unspecified, and their
association with IBS, and calculated a median prevalence of IBS of 9.8% (interquartile range
4.0–13.3) in the exposed group and 1.2% Interquartile rate range 0.04–1.8) in the control group.
A review by Smith and Bayles (30) found a mean prevalence of PI-IBS of 15% from 15 studies,
with species of Campylobacter, nontyphoidal Salmonella spp., and/or Shigella as the most
common agents of infection.
In the United Kingdom, Neal et al. (31) performed a postal survey and found that 25% of
subjects had persistently altered bowel habits after bacterial gastroenteritis from nontyphoidal
Salmonella spp., Shigella spp., or Campylobacter spp.; however, only 7% met the Rome criteria
for new IBS. Also in the United Kingdom, Parry et al. (32) looked at the relationship between
IBS and bacterial gastroenteritis from Campylobacter spp., nontyphoidal Salmonella spp.,
Shigella spp., E. coli O157, and Aeromonas sobria, and calculated an incidence of new IBS of
16.7% in the exposed group and 1.9% in the control group.
Studies looking at singular pathogens have also found an association between infectious
gastroenteritis outbreaks and IBS. After an outbreak in 2002 in Spain, Mearin et al. (33) noted
that before the outbreak, the prevalence of IBS was similar in case-patients and controls (2.9%
vs. 2.3%); however, 3 months after the outbreak, IBS prevalence in case-patients had increased
(9.2% vs. 1.7%), and 12 months after the outbreak, prevalence in case-patients remained higher
(10.2% vs. 0.7%). The cumulative incidence was 7.4% at 3 months, 10.9% at 6 months, and
11.6% at 12 months. In Korea, 12 months after a Shigella spp. outbreak, Ji et al. (34) found that
IBS had developed in 15 (14.9%) of 101 case-patients and 6 of 102 (5.9%) controls. In Canada,
2–3 years after an outbreak of E. coli O157:H7 and Campylobacter spp., 27.5% of 904 subjects
with self-reported gastroenteritis reported IBS, and 36.2% of 464 subjects with clinically
suspected gastroenteritis reported IBS (35). In a pediatric cohort from the Canadian outbreak, the
cumulative incidence of PI-IBS for exposed subjects was 10.5% vs. a cumulative incidence in
controls of 2.5% (36).

Page 5 of 14
There have been studies on the association of G. lamblia with IBS; however, these have
produced inconsistent results. While Wensaas et al. (37) found a high prevalence of IBS in
exposed patients 2 years after acute giardiasis, Penrose et al. (38) found no linear association
between G. lamblia and IBS, and a study by D’Anchino et al. (39) concluded that G. lamblia
infection is a trigger for exacerbating preexisting IBS but could not conclude that G. lamblia
causes IBS. PI-IBS has also been shown to develop after norovirus. Marshall et al. (40)
performed a 2-year study after a norovirus outbreak; of the 89 respondents who reported an acute
enteric illness during the outbreak and did not have preexisting IBS, 23.6% reported symptoms
consistent with PI-IBS at 3 months versus 3.4% who reported symptoms but remained well
during the outbreak. However, at 6, 12, and 24 months, the prevalence of IBS did not differ
statistically among exposed and unexposed individuals, suggesting that PI-IBS might be more
transient after viral gastroenteritis than it is after bacterial dysentery (40) (Technical Appendix 1
Table 3).
The meta-analysis by Haagsma et al. (27), which suggests that IBS develops in ≈9%
(95% CI 7.2%–10.7%) of Campylobacter spp., nontyphoidal Salmonella spp., and Shigella spp.
case-patients at 10–12 months of follow-up was chosen as the sequelae multiplier to simulate the
plausible proportion of these bacterial pathogens that cause IBS using an alternate PERT
distribution. While studies of multiple pathogens have found different rates of PI-IBS depending
on etiology, this proportion was chosen for all 3 pathogens because it is a pooled rate that comes
from a recent meta-analysis and is similar to PI-IBS rates after bacterial gastroenteritis that were
reported in other studies (28,29,41).
Technical Appendix 1 Table 3. Incidence of IBS after infection with enteric pathogens, Australia, circa 2010*
Reference Year of
publication Study years Country Study type Foodborne pathogen
IBS patients after infectious
gastroenteritis, % Koh et al. (41) 2012 2008–2010 Korea Prospective
cohort Nontyphoidal Salmonella spp.,
Shigella spp., STEC O157, Vibrio cholerae
9.2% at 3 mo†, 12.3% at 6 mo†
Wensaas et al. (37)
2012 2007–2008 Norway Historic cohort
Giardia lamblia 46.1% at 3 y
Schwille-Kiuntke et al. (26)
2011 - Global Systematic review
Campylobacter spp., Escherichia coli, G. lamblia,
norovirus, nontyphoidal Salmonella spp, Shigella sp., Trichinella britovi; bacterial,
viral, and parasitic gastroenteritis and travelers’
diarrhea
4%–36% Incidence range
Thabane et al. (36)
2010 2002–2008 Canada Outbreak study
E. coli O157:H7, Campylobacter spp.
10.5%†
Haagsma et al. (26)
2010 - The Netherlands
Meta-analysis
Campylobacter spp., nontyphoidal Salmonella spp.,
9% (95% CI 7.2–10.7)
Page 6 of 14
Reference Year of
publication Study years Country Study type Foodborne pathogen
IBS patients after infectious
gastroenteritis, % Shigella spp. at 1 y
Marshall et al. (35)
2009 2002–2008 Canada Outbreak study
E. coli O157:H7, Campylobacter spp.
27.5% (self-reported), 36.2%
(clinically suspected)
Thabane et al. (28)
2007 - Canada, China, Israel, Korea, New
Zealand, UK, USA
Systematic review and
meta-analysis
Campylobacter spp., nontyphoidal Salmonella spp.,
Shigella spp., confirmed bacterial gastroenteritis, and
self-reported illness
10% (95% CI 9.4–85.6), 4%–32% incidence range
Marshall et al. (40)
2007 2002–2004 Canada Outbreak study
Norovirus 23.6% at 3 mo
Smith and Bayles (30)
2007 - Canada, China, Korea,
Spain, UK, USA
Systematic review
Campylobacter spp., Cryptosporidium spp., E.coli, G.
lamblia, nontyphoidal Salmonella spp., Shigella spp.
15% (range 3.4–31.6)‡
Halvorson et al. (29)
2006 - Canada, China, Korea,
Spain, UK, USA
Systematic review and
meta-analysis
Nontyphoidal Salmonella spp., Shigella spp., bacterial, and
unspecified
9.8% (IQR 4.0–13.3)‡
Ji et al. (34) 2005 2001–2002 Korea Outbreak study
Shigella spp. 14.9% at 1 y
Mearin et al. (33)
2005 2002–2003 Spain Cohort study after
an outbreak
Nontyphoidal Salmonella spp. 7.4% at 3 mo†, 10.9% at 6 mo†,
11.6% at 1 y† Parry et al. (32) 2003 2000–2001 UK Prospective
case–control study
Campylobacter spp., nontyphoidal Salmonella spp.,
Shigella spp., STEC O157, Aeromonas sobria
16.7% at 6 mo
Neal et al. (31) 1997 1994 UK Cross-sectional
Campylobacter spp., nontyphoidal Salmonella spp.,
and Shigella spp.
7% at 6 mo
*IBS, irritable bowel syndrome; IQR, interquartile range; nontyphoidal Salmonella spp., nontyphoidal S. enterica serotypes; STEC, Shiga toxin–producing E. coli. †Cumulative incidence. ‡Median prevalence.
ReA
The causes of ReA are ambiguous because no formal definition or agreed-upon
diagnostic criteria exist (42,43). Although the primary focus of the infection is usually through
the gut or urogenital track, ReA has also been associated with respiratory pathogens (42). The
classical gastrointestinal microbes resulting in ReA are Yersinia enterocolitica, nontyphoidal
Salmonella spp., Shigella spp., and Campylobacter spp (43). and most agree that the term “ReA”
should be applied only to infection caused by these gastrointestinal pathogens and Chlamydia
spp (43); however, nonclassical ReA forms have been associated by a variety of other bacteria,
including Brucella and Staphylococcus, and many authors have applied the term ReA for arthritis
after infection with C. difficile, Cryptosporidium, Giardia lamblia, E. coli, and Strongyloides spp
(43,44). With the majority of the literature focusing on the 4 classical gastrointestinal pathogens
as triggers for ReA, we chose to use these to estimate the incidence of ReA due to contaminated
food. If other enteric pathogens are in fact associated with ReA, our estimates of foodborne ReA
may be conservative.

Page 7 of 14
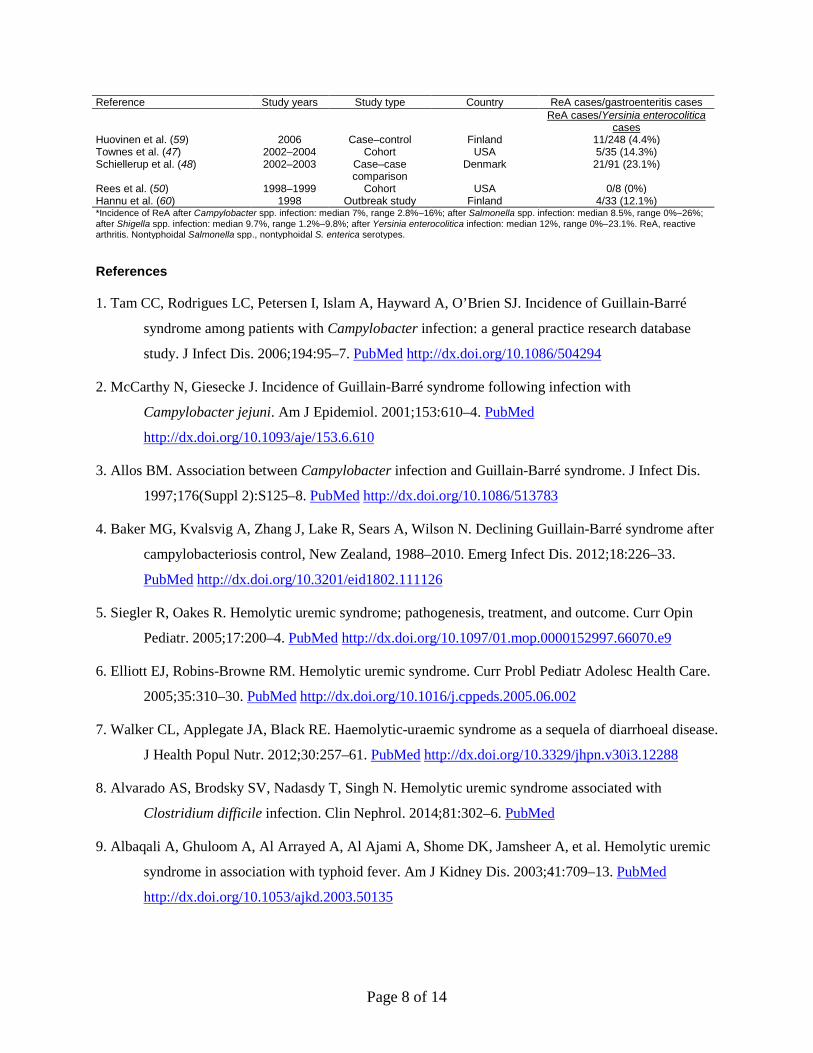
We were unable to find any published systematic reviews that report a global incidence
rate for ReA after infection with the bacterial pathogens Campylobacter spp., nontyphoidal
Salmonella spp., Shigella spp., and Y. enterocolitica. Because there are no diagnostic criteria for
ReA, the case definition and the resulting incidences vary (42). The literature suggests that the
incidence of ReA as a sequel to bacterial gastroenteritis varies by the enteric pathogen. For each
of the bacterial enteric pathogens that precede ReA, we compiled papers that reported the
proportion of cases that developed into ReA published in 2000 or later where all enteric cases
were confirmed by a laboratory (Technical Appendix 1 Table 4). Because there is still quite a bit
of variation in incidence in studies by pathogen, the median and range for Campylobacter spp.,
nontyphoidal Salmonella spp., Shigella spp., and Y. enterocolitica from the studies in Technical
Appendix 1 Table 4 were calculated for the sequelae multiplier and used to simulate a
distribution of the plausible proportion of cases that result in this sequel using an alternate PERT
or PERT distribution, respectively. From the literature, we assume that 7% (range 2.8%-16%) of
foodborne Campylobacter spp., 8.5% (range 0%-26%) of foodborne nontyphoidal Salmonella
spp., 9.7% (range 1.2%-9.8%) of foodborne Shigella spp., and 12% (range 0%-23.1%) of
foodborne Y. enterocolitica result in ReA. These distributions were then applied to the estimates
of domestically acquired foodborne cases for each of the preceding bacterial pathogens.
Technical Appendix 1 Table 4. ReA incidence* by foodborne pathogen, Australia, 2010 Reference Study years Study type Country ReA cases/gastroenteritis cases ReA cases/Campylobacter spp.
cases Schonberg-Norio et al. (45) 2002 Cross sectional Finland 8/201 (4.0%) Doorduyn et al. (46) 2005 Case–control The Netherlands 20/434 (4.6%) Townes et al. (47) 2002–2004 Cohort USA 302/2384 (12.7%) Schiellerup et al. (48) 2002–2003 Case–case
comparison Denmark 131/1003 (13.1%)
Pope et al. (49) 1966–2006 Review Europe 1%–5% Rees et al. (50) 1998–1999 Cohort USA 9/324 (2.8%) Hannu (51) 1997–1998 Cohort Finland 45/609 (7.4%) Locht and Krogfelt (52) 1997–1999 Cohort Denmark 27/173 (15.6%) ReA cases/nontyphoidal
Salmonella spp. cases Arnedo-Pena et al. (53) 2005 Outbreak study Spain 6/67 (9%) Doorduyn et al. (46) 2005 Case–control The Netherlands 8/181 (4.4%) Townes et al. (47) 2002–2004 Cohort USA 204/1356 (15.0%) Schiellerup et al. (48) 2002–2003 Case–case
comparison Denmark 104/619 (16.8%)
Lee et al. (54) 1999 Outbreak study Australia 38/261 (14.6%) Rees et al. (50) 1998–1999 Cohort USA 2/100 (2.0%) Buxton et al. (55) 1999–2000 Case–control Canada 17/66 (25.7%) Hannu et al. (56) 1999 Outbreak study Finland 5/63 (7.9%) Rudwaleit et al. (57) 1998 Outbreak study Germany 0/286 (0%) (children only) Urfer et al. (58) 1993 Outbreak study Switzerland 1/156 (0.6%) ReA cases/Shigella spp. cases Townes et al. (47) 2002–2004 Cohort USA 29/298 (9.7%) Schiellerup et al. (48) 2002–2003 Case–case
comparison Denmark 10/102 (9.8%)
Rees et al. (50) 1998–1999 Cohort USA 1/81 (1.2%)
Page 8 of 14
Reference Study years Study type Country ReA cases/gastroenteritis cases ReA cases/Yersinia enterocolitica
cases Huovinen et al. (59) 2006 Case–control Finland 11/248 (4.4%) Townes et al. (47) 2002–2004 Cohort USA 5/35 (14.3%) Schiellerup et al. (48) 2002–2003 Case–case
comparison Denmark 21/91 (23.1%)
Rees et al. (50) 1998–1999 Cohort USA 0/8 (0%) Hannu et al. (60) 1998 Outbreak study Finland 4/33 (12.1%) *Incidence of ReA after Campylobacter spp. infection: median 7%, range 2.8%–16%; after Salmonella spp. infection: median 8.5%, range 0%–26%; after Shigella spp. infection: median 9.7%, range 1.2%–9.8%; after Yersinia enterocolitica infection: median 12%, range 0%–23.1%. ReA, reactive arthritis. Nontyphoidal Salmonella spp., nontyphoidal S. enterica serotypes.
References
1. Tam CC, Rodrigues LC, Petersen I, Islam A, Hayward A, O’Brien SJ. Incidence of Guillain-Barré
syndrome among patients with Campylobacter infection: a general practice research database
study. J Infect Dis. 2006;194:95–7. PubMed http://dx.doi.org/10.1086/504294
2. McCarthy N, Giesecke J. Incidence of Guillain-Barré syndrome following infection with
Campylobacter jejuni. Am J Epidemiol. 2001;153:610–4. PubMed
http://dx.doi.org/10.1093/aje/153.6.610
3. Allos BM. Association between Campylobacter infection and Guillain-Barré syndrome. J Infect Dis.
1997;176(Suppl 2):S125–8. PubMed http://dx.doi.org/10.1086/513783
4. Baker MG, Kvalsvig A, Zhang J, Lake R, Sears A, Wilson N. Declining Guillain-Barré syndrome after
campylobacteriosis control, New Zealand, 1988–2010. Emerg Infect Dis. 2012;18:226–33.
PubMed http://dx.doi.org/10.3201/eid1802.111126
5. Siegler R, Oakes R. Hemolytic uremic syndrome; pathogenesis, treatment, and outcome. Curr Opin
Pediatr. 2005;17:200–4. PubMed http://dx.doi.org/10.1097/01.mop.0000152997.66070.e9
6. Elliott EJ, Robins-Browne RM. Hemolytic uremic syndrome. Curr Probl Pediatr Adolesc Health Care.
2005;35:310–30. PubMed http://dx.doi.org/10.1016/j.cppeds.2005.06.002
7. Walker CL, Applegate JA, Black RE. Haemolytic-uraemic syndrome as a sequela of diarrhoeal disease.
J Health Popul Nutr. 2012;30:257–61. PubMed http://dx.doi.org/10.3329/jhpn.v30i3.12288
8. Alvarado AS, Brodsky SV, Nadasdy T, Singh N. Hemolytic uremic syndrome associated with
Clostridium difficile infection. Clin Nephrol. 2014;81:302–6. PubMed
9. Albaqali A, Ghuloom A, Al Arrayed A, Al Ajami A, Shome DK, Jamsheer A, et al. Hemolytic uremic
syndrome in association with typhoid fever. Am J Kidney Dis. 2003;41:709–13. PubMed
http://dx.doi.org/10.1053/ajkd.2003.50135

Page 9 of 14
10. Baker NM, Mills AE, Rachman I, Thomas JE. Haemolytic-uraemic syndrome in typhoid fever. BMJ.
1974;2:84–7. PubMed http://dx.doi.org/10.1136/bmj.2.5910.84
11. McPherson M, Kirk MD, Raupach J, Coombs B, Butler JR. Economic costs of Shiga toxin–producing
Escherichia coli infection in Australia. Foodborne Pathog Dis. 2011;8:55–62. PubMed
http://dx.doi.org/10.1089/fpd.2010.0608
12. Mead PS, Griffin PM. Escherichia coli O157:H7. Lancet. 1998;352:1207–12. PubMed
http://dx.doi.org/10.1016/S0140-6736(98)01267-7
13. Beutin L, Zimmerman S, Gleier K. Human infections with Shiga toxin–producing Escherichia coli
other than serogroup O157 in Germany. Emerg Infect Dis. 1998;4:635–9. PubMed
http://dx.doi.org/10.3201/eid0404.980415
14. McPherson M, Lalor K, Combs B, Raupach J, Stafford R, Kirk MD. Serogroup-specific risk factors
for Shiga toxin–producing Escherichia coli infection in Australia. Clin Infect Dis. 2009;49:249–
56. PubMed http://dx.doi.org/10.1086/599370
15. Vally H, Hall G, Dyda A, Raupach J, Knope K, Combs B, et al. Epidemiology of Shiga toxin
producing Escherichia coli in Australia, 2000–2010. BMC Public Health. 2012;12:63–71.
PubMed http://dx.doi.org/10.1186/1471-2458-12-63
16. Elliott EJ, Robins-Browne RM, O’Loughlin EV, Bennett-Wood V, Bourke J, Henning P, et al.
Nationwide study of haemolytic uraemic syndrome: clinical, microbiological, and
epidemiological features. Arch Dis Child. 2001;85:125–31. PubMed
http://dx.doi.org/10.1136/adc.85.2.125
17. López EL, Contrini MM, Glastein E, Ayala SG, Santoro R, Ezcurra G, et al. An epidemiologic
surveillance of Shiga-like toxin producing Escherichia coli infection in Argentinean children: risk
factors and serum Shiga-like toxin 2 values. Pediatr Infect Dis J. 2012;31:20–4. PubMed
http://dx.doi.org/10.1097/INF.0b013e31822ea6cf
18. Van Duynhoven YT, De Jager CM, Heuvelink AE, Van Der Zwaluw WK, Maas HM, Van Pelt W, et
al. Enhanced laboratory-based surveillance of Shiga-toxin–producing Escherichia coli O157 in
the Netherlands. Eur J Clin Microbiol Infect Dis. 2002;21:513–22. PubMed
http://dx.doi.org/10.1007/s10096-002-0756-7
19. Käppeli U, Hächler H, Giezendanner N, Cheasty T, Stephan R. Shiga toxin–producing Escherichia
coli O157 associated with human infections in Switzerland, 2000–2009. Epidemiol Infect.
2011;139:1097–104. PubMed

Page 10 of 14
20. Bradley KK, Williams JM, Burnsed LJ, Lytle MB, McDermott MD, Mody RK, et al. Epidemiology
of a large restaurant-associated outbreak of Shiga toxin–producing Escherichia coli O111:NM.
Epidemiol Infect. 2012;140:1644–54. PubMed http://dx.doi.org/10.1017/S0950268811002329
21. Neil KP, Biggerstaff G, MacDonald JK, Trees E, Medus C, Musser KA, et al. a novel vehicle for
transmission of Escherichia coli O157:H7 to humans: multistate outbreak of E. coli O157:H7
infections associated with consumption of ready-to-bake commercial prepackaged cookie
dough—United States, 2009. Clin Infect Dis. 2012;54:511–8. PubMed
http://dx.doi.org/10.1093/cid/cir831
22. Frank C, Werber D, Cramer JP, Askar M, Faber M, an der Heiden M, et al. Epidemic profile of Shiga-
toxin–producing Escherichia coli O104:H4 outbreak in Germany. N Engl J Med. 2011;365:1771–
80. PubMed http://dx.doi.org/10.1056/NEJMoa1106483
23. Jay MT, Garrett V, Mohle-Boetani JC, Barros M, Farrar JA, Rios R, et al. A multistate outbreak of
Escherichia coli O157:H7 infection linked to consumption of beef tacos at a fast-food restaurant
chain. Clin Infect Dis. 2004;39:1–7. PubMed http://dx.doi.org/10.1086/421088
24. Sigmundsdottir G, Atladottir A, Hardadottir H, Gudmundsdottir E, Geirsdottir M, Briem H. STEC
O157 outbreak in Iceland, September–October 2007. Euro Surveill. 2007;12:E0711012. PubMed
25. Rangel JM, Sparling PH, Crowe C, Griffin PM, Swerdlow DL. Epidemiology of Escherichia coli
O157:H7 outbreaks, United States, 1982–2002. Emerg Infect Dis. 2005;11:603–9. PubMed
http://dx.doi.org/10.3201/eid1104.040739
26. Schwille-Kiuntke J, Frick JS, Zanger P, Enck P. Post-infectious irritable bowel syndrome—a review
of the literature. Z Gastroenterol. 2011;49:997–1003. PubMed http://dx.doi.org/10.1055/s-0031-
1281581
27. Haagsma JA, Siersema PD, De Wit NJ, Havelaar AH. Disease burden of post-infectious irritable
bowel syndrome in the Netherlands. Epidemiol Infect. 2010;138:1650–6. PubMed
http://dx.doi.org/10.1017/S0950268810000531
28. Thabane M, Kottachchi DT, Marshall JK. Systematic review and meta-analysis: the incidence and
prognosis of post-infectious irritable bowel syndrome. Aliment Pharmacol Ther. 2007;26:535–44.
PubMed http://dx.doi.org/10.1111/j.1365-2036.2007.03399.x
29. Halvorson HA, Schlett CD, Riddle MS. Postinfectious irritable bowel syndrome—a meta-analysis.
Am J Gastroenterol. 2006;101:1894–9. PubMed http://dx.doi.org/10.1111/j.1572-
0241.2006.00654.x

Page 11 of 14
30. Smith JL, Bayles D. Postinfectious irritable bowel syndrome: a long-term consequence of bacterial
gastroenteritis. J Food Prot. 2007;70:1762–9. PubMed
31. Neal KR, Hebden J, Spiller R. Prevalence of gastrointestinal symptoms six months after bacterial
gastroenteritis and risk factors for development of the irritable bowel syndrome: postal survey of
patients. BMJ. 1997;314:779–82. PubMed http://dx.doi.org/10.1136/bmj.314.7083.779
32. Parry SD, Stansfield R, Jelley D, Gregory W, Phillips E, Barton JR, et al. Does bacterial
gastroenteritis predispose people to functional gastrointestinal disorders? A prospective,
community-based, case–control study. Am J Gastroenterol. 2003;98:1970–5. PubMed
33. Mearin F, Perez-Oliveras M, Perello A, Vinyet J, Ibanez A, Coderch J, et al. Dyspepsia and irritable
bowel syndrome after a Salmonella gastroenteritis outbreak: one-year follow-up cohort study.
Gastroenterology. 2005;129:98–104. PubMed http://dx.doi.org/10.1053/j.gastro.2005.04.012
34. Ji S, Park H, Lee D, Song YK, Choi JP, Lee SI. Post-infectious irritable bowel syndrome in patients
with Shigella infection. J Gastroenterol Hepatol. 2005;20:381–6. PubMed
http://dx.doi.org/10.1111/j.1440-1746.2005.03574.x
35. Marshall JK. Post-infectious irritable bowel syndrome following water contamination. Kidney Int
Suppl. 2009;Feb(112):S42–3. PubMed http://dx.doi.org/10.1038/ki.2008.618
36. Thabane M, Simunovic M, Akhtar-Danesh N, Garg AX, Clark WF, Collins SM, et al. An outbreak of
acute bacterial gastroenteritis is associated with an increased incidence of irritable bowel
syndrome in children. Am J Gastroenterol. 2010;105:933–9. PubMed
http://dx.doi.org/10.1038/ajg.2010.74
37. Wensaas KA, Langeland N, Hanevik K, Morch K, Eide GE, Rortveit G. Irritable bowel syndrome and
chronic fatigue 3 years after acute giardiasis: historic cohort study. Gut. 2012;61:214–9. PubMed
http://dx.doi.org/10.1136/gutjnl-2011-300220
38. Penrose AS, Wells EV, Aiello AE. Infectious causation of chronic disease: examining the relationship
between Giardia lamblia infection and irritable bowel syndrome. World J Gastroenterol.
2007;13:4574–8. PubMed
39. D’Anchino M, Orlando D, De Feudis L. Giardia lamblia infections become clinically evident by
eliciting symptoms of irritable bowel syndrome. J Infect. 2002;45:169–72. PubMed
http://dx.doi.org/10.1016/S0163-4453(02)91038-8

Page 12 of 14
40. Marshall JK, Thabane M, Borgaonkar MR, James C. Postinfectious irritable bowel syndrome after a
food-borne outbreak of acute gastroenteritis attributed to a viral pathogen. Clin Gastroenterol
Hepatol. 2007;5:457–60. PubMed http://dx.doi.org/10.1016/j.cgh.2006.11.025
41. Koh SJ, Lee DH, Lee SH, Park YS, Hwang JH, Kim JW, et al. Incidence and risk factors of irritable
bowel syndrome in community subjects with culture-proven bacterial gastroenteritis. Korean J
Gastroenterol. 2012;60:13–8. PubMed http://dx.doi.org/10.4166/kjg.2012.60.1.13
42. Hannu T. Reactive arthritis. Best Pract Res Clin Rheumatol. 2011;25:347–57. PubMed
http://dx.doi.org/10.1016/j.berh.2011.01.018
43. Townes JM. Reactive arthritis after enteric infections in the United States: the problem of definition.
Clin Infect Dis. 2010;50:247–54. PubMed http://dx.doi.org/10.1086/649540
44. Girschick HJ, Guilherme L, Inman RD, Latsch K, Rihl M, Sherer Y, et al. Bacterial triggers and
autoimmunie rheumatic diseases. Clin Exp Rheumatol. 2008;26(Suppl 48):S12–7. PubMed
45. Schönberg-Norio D, Mattila L, Lauhio A, Katila ML, Kaukoranta SS, Koskela M, et al. Patient-
reported complications associated with Campylobacter jejuni infection. Epidemiol Infect.
2010;138:1004–11. PubMed http://dx.doi.org/10.1017/S0950268809991099
46. Doorduyn Y, Van Pelt W, Siezen CL, Van Der Horst F, Van Duynhoven YT, Hoebee B, et al. Novel
insight in the association between salmonellosis or campylobacteriosis and chronic illness, and
the role of host genetics in susceptibility to these diseases. Epidemiol Infect. 2008;136:1225–34.
PubMed http://dx.doi.org/10.1017/S095026880700996X
47. Townes JM, Deodhar AA, Laine ES, Smith K, Krug HE, Barkhuizen A, et al. Reactive arthritis
following culture-confirmed infections with bacterial enteric pathogens in Minnesota and Oregon:
a population-based study. Ann Rheum Dis. 2008;67:1689–96. PubMed
http://dx.doi.org/10.1136/ard.2007.083451
48. Schiellerup P, Krogfelt KA, Locht H. A comparison of self-reported joint symptoms following
infection with different enteric pathogens: effect of HLA-B27. J Rheumatol. 2008;35:480–7.
PubMed
49. Pope JE, Krizova A, Garg AX, Thiessen-Philbrook H, Ouimet JM. Campylobacter reactive arthritis: a
systematic review. Semin Arthritis Rheum. 2007;37:48–55. PubMed
http://dx.doi.org/10.1016/j.semarthrit.2006.12.006
50. Rees JR, Pannier MA, McNees A, Shallow S, Angulo FJ, Vugia DJ. Persistent diarrhea, arthritis, and
other complications of enteric infections: a pilot survey based on California FoodNet
Page 13 of 14
surveillance, 1998–1999. Clin Infect Dis. 2004;38(Suppl 3):S311–7. PubMed
http://dx.doi.org/10.1086/381601
51. Hannu T, Mattila L, Rautelin H, Pelkonen P, Lahdenne P, Siitonen A, et al. Campylobacter-triggered
reactive arthritis: a population-based study. Rheumatology (Oxford). 2002;41:312–8. PubMed
http://dx.doi.org/10.1093/rheumatology/41.3.312
52. Locht H, Krogfelt KA. Comparison of rheumatological and gastrointestinal symptoms after infection
with Campylobacter jejuni/coli and enterotoxigenic Escherichia coli. Ann Rheum Dis.
2002;61:448–52. PubMed http://dx.doi.org/10.1136/ard.61.5.448
53. Arnedo-Pena A, Beltran-Fabregat J, Vila-Pastor B, Tirado-Balaguer MD, Herrero-Carot C, Bellido-
Blasco JB, et al. Reactive arthritis and other musculoskeletal sequelae following an outbreak of
Salmonella Hadar in Castellon, Spain. J Rheumatol. 2010;37:1735–42. PubMed
http://dx.doi.org/10.3899/jrheum.091250
54. Lee AT, Hall RG, Pile KD. Reactive joint symptoms following an outbreak of Salmonella
Typhimurium phage type 135a. J Rheumatol. 2005;32:524–7. PubMed
55. Buxton JA, Fyfe M, Berger S, Cox MB, Northcott KA. Reactive arthritis and other sequelae following
sporadic Salmonella Typhimurium infection in British Columbia, Canada: a case control study. J
Rheumatol. 2002;29:2154–8. PubMed
56. Hannu T, Mattila L, Siitonen A, Leirisalo-Repo M. Reactive arthritis following an outbreak of
Salmonella Typhimurium phage type 193 infection. Ann Rheum Dis. 2002;61:264–6. PubMed
http://dx.doi.org/10.1136/ard.61.3.264
57. Rudwaleit M, Richter S, Braun J, Sieper J. Low incidence of reactive arthritis in children following a
Salmonella outbreak. Ann Rheum Dis. 2001;60:1055–7. PubMed
http://dx.doi.org/10.1136/ard.60.11.1055
58. Urfer E, Rossier P, Mean F, Krending MJ, Burnens A, Bille J, et al. Outbreak of Salmonella
Braenderup gastroenteritis due to contaminated meat pies: clinical and molecular epidemiology.
Clin Microbiol Infect. 2000;6:536–42. PubMed http://dx.doi.org/10.1046/j.1469-
0691.2000.00148.x
59. Huovinen E, Sihvonen LM, Virtanen MJ, Haukka K, Siitonen A, Kuusi M. Symptoms and sources of
Yersinia enterocolitica-infection: a case–control study. BMC Infect Dis. 2010;10:122. PubMed
http://dx.doi.org/10.1186/1471-2334-10-122
Page 14 of 14
60. Hannu T, Mattila L, Nuorti JP, Ruutu P, Mikkola J, Siitonen A, et al. Reactive arthritis after an
outbreak of Yersinia pseudotuberculosis serotype O:3 infection. Ann Rheum Dis. 2003;62:866–9.
PubMed http://dx.doi.org/10.1136/ard.62.9.866

Page 1 of 2
Article DOI: http://dx.doi.org/10.3201/eid2011.131316
Sequelae of Foodborne Illness Caused by 5 Pathogens, Australia, Circa 2010
Technical Appendix 2
Methods to Estimate Sequelae Incidence
For all 4 sequelae illnesses, we used data from notifiable surveillance (either national
or state notifications) to estimate incidence of acute gastroenteritis due to relevant pathogens
and then adjusted this using a sequelae multiplier, which is the proportion of bacterial
infections that lead to sequelae illnesses (online Technical Appendix 1,
http://wwwnc.cdc.gov/EID/article/20/11/13-1316-Techapp1.pdf). This approach is displayed
in the Technical Appendix 2 Figure, where the left-hand column describes each input or
output distribution, the central column illustrates the distribution, and the right-hand column
describes the type and source of data underlying each input distribution. The final estimate is
produced from a statistical model that incorporates uncertainty in case numbers in multipliers
using probability distributions. That is, at each stage of the calculation, the estimate is
represented by a probability distribution, and our final estimates and credible intervals are
computed from this distribution. Further details on the estimation of incidence of acute illness
due to each of the causal pathogens can be found in Kirk et al. (1).
The sequelae multiplier was modelled by using the PERT (Project Evaluation and
Review Techniques) distribution, which is widely used for expert elicitation and risk
assessment studies. It is based on the beta distribution and allows the input of minimum,
maximum, and modal values. The alternate PERT distribution can be specified by 3
percentile points, such as a median value and 95% credible intervals (CrIs). Alternate PERT
was used for the hemolytic uremic syndrome and irritable bowel syndrome sequelae
multiplier, as the multiplier used was from another study that used median and 95% CIs.
Alternate PERT was also used for reactive arthritis sequelae multipliers to enable a median
value to be input, except in the case of the Shigella-associated reactive arthritis, where an
alternate PERT distribution would not fit the data, and a PERT distribution was used instead.
PERT allows for asymmetric distributions and can be easily produced from many data
sources.

Page 2 of 2
Reference
1. Kirk M, Ford L, Glass K, Hall G. Foodborne illness, Australia, circa 2000–circa 2010. Emerg
Infect Dis. 2014;20:zzz–zzz. http://dx.doi.org/10.3201/eid2011.131315
Technical Appendix 2 Figure. Flowchart for the approach used to calculate the estimated number of
sequelae cases in the community, Australia, circa 2010. PERT, project evaluation and review
technique.

Page 1 of 2
Article DOI: http://dx.doi.org/10.3201/eid2011.131316
Sequelae of Foodborne Illness Caused by 5 Pathogens, Australia, Circa 2010
Technical Appendix 3
Comparison with Estimates from 2000
Hall et al. estimated incidence, hospitalizations, and deaths for these 4 sequelae illnesses
in Australia circa 2000 (1). Because methods and data sources have changed since the 2000
estimation effort, we recalculated incidence estimates for the sequelae in 2000 using our current
methods and equivalent data from that earlier time period to validly compare rates over time. We
used National Notifiable Disease Surveillance System data from 1996 to 2000 to recalculate the
estimates for the incidence of all cases of gastroenteritis due to foodborne Campylobacter spp.,
nontyphoidal Salmonella enterica serotypes (hereafter referred to as nontyphoidal Salmonella
spp.), Shigella spp., and Yersinia enterocolitica (2,3), and South Australian data from 1998–2000
(3) to recalculate the 2000 estimate for the incidence of gastroenteritis due to Shiga toxin–
producing Escherichia coli (STEC). Further details on the method and recalculated circa 2000
estimates for Campylobacter spp., nontyphoidal Salmonella spp., and Shigella spp. can be found
in the methods section and Table 3 of Kirk et al. (4). The estimates of foodborne illness from
STEC and Y. enterocolitica for circa 2000 were calculated solely for this paper, using the same
methods described in Kirk et al. (4) and the data described above.
Sequelae multipliers for the 2010 estimates were then applied to the recalculated 2000
estimates of incidence of acute gastroenteritis. The Technical Appendix 3 Table presents a
comparison of the recalculated incidence estimates of sequelae of Guillain-Barré syndrome,
hemolytic uremic syndrome, irritable bowel syndrome, and reactive arthritis for 2000 and 2010.
Changes in sequelae illness from 2000 to 2010 reflect changes in the incidence of the preceding
bacterial pathogen because the rate of sequelae after foodborne gastroenteritis, otherwise referred
to as the sequelae multiplier, is assumed to be constant over this time period.

Page 2 of 2
Technical Appendix 3 Table. Comparison of incidence estimates and rates of 4 sequelae, Australia, circa 2000 and 2010*
Illness
2000 2010 Rate ratio (90% CrI) Incidence (90% CrI)
Rate per million (90% CrI) Incidence (90% CrI)
Rate per million (90% CrI)
GBS 50 (25–100) 2.8 (1–6) 70 (30–150) 3.1 (2–6) 1.13 (0.5–3.6) HUS 55 (15–175) 3 (1–9) 70 (25–200) 3 (1–9) 1 (0.3–3.5) IBS 14,800 (9,500–23,500) 850 (550–1,350) 19,500 (12,500–30,700) 915 (570–1,440) 1.07 (0.5–2.0) ReA 12,500 (6,700–23,000) 730 (380–1,325) 16,200 (8,750–30,400) 765 (415–1,375) 1.06 (0.4–2.5) *GBS, Guillain-Barré syndrome; HUS, hemolytic uremic syndrome; IBS, irritable bowel syndrome; ReA, reactive arthritis; CrI, credible interval.
References
1. Hall G, Kirk M. Foodborne illnesses in Australia: annual incidence circa 2000. Report no. 0642825769.
Canberra (ACT): Commonwealth Department of Health and Ageing; 2005.
2. Government of Australia. National Notifiable Disease Surveillance System (NNDSS). Commonwealth
of Australia; 2013 [cited 2013 April 5]. http://www9.health.gov.au/cda/source/cda-index.cfm
3. Hall G. OzFoodNet Working Group. How much gastroenteritis in Australia is due to food? Report no.
NCEPH working paper no. 51. Sponsored by the Commonwealth Department of Health and
Ageing. Canberra (Australia): National Centre for Epidemiology and Population Health. 2004.
4. Kirk M, Ford L, Glass K, Hall G. Foodborne illness, Australia, circa 2000–circa 2010. Emerg Infect
Dis. 2014;20:zzz–zzz. http://dx.doi.org/10.3201/eid2011.131315
Page 1 of 8
Article DOI: http://dx.doi.org/10.3201/eid2011.131316
Sequelae of Foodborne Illness Caused by 5 Pathogens, Australia, Circa 2010
Technical Appendix 4
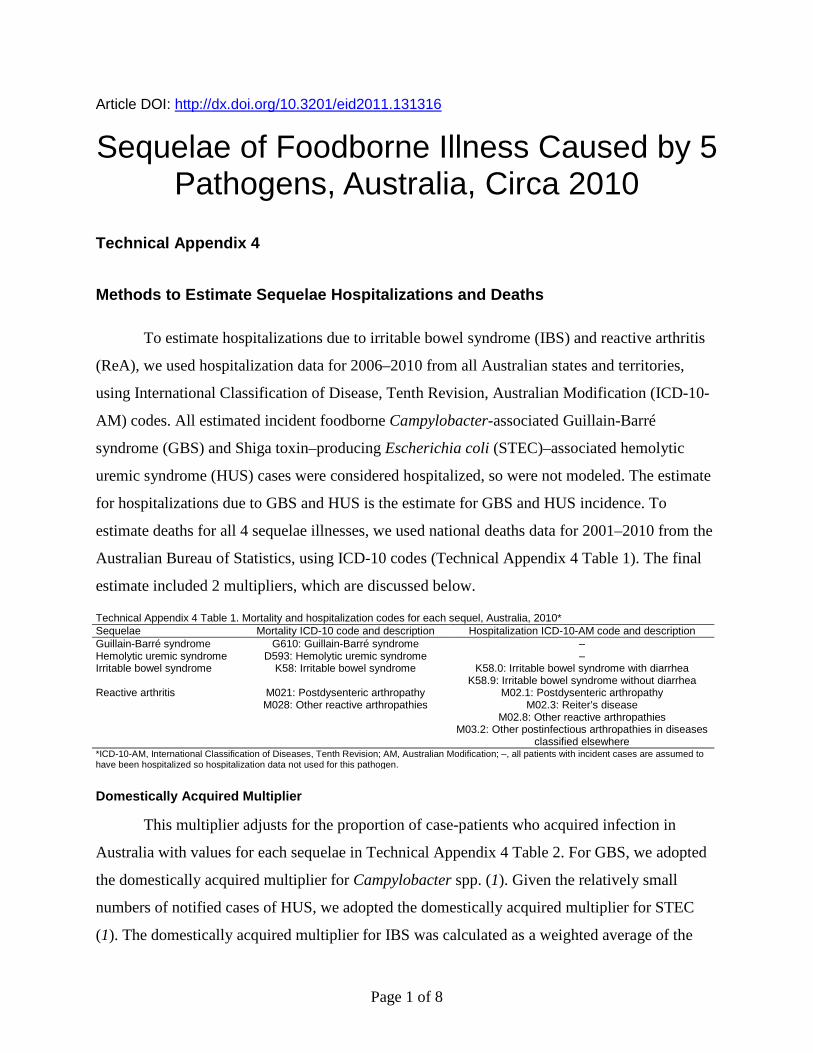
Methods to Estimate Sequelae Hospitalizations and Deaths
To estimate hospitalizations due to irritable bowel syndrome (IBS) and reactive arthritis
(ReA), we used hospitalization data for 2006–2010 from all Australian states and territories,
using International Classification of Disease, Tenth Revision, Australian Modification (ICD-10-
AM) codes. All estimated incident foodborne Campylobacter-associated Guillain-Barré
syndrome (GBS) and Shiga toxin–producing Escherichia coli (STEC)–associated hemolytic
uremic syndrome (HUS) cases were considered hospitalized, so were not modeled. The estimate
for hospitalizations due to GBS and HUS is the estimate for GBS and HUS incidence. To
estimate deaths for all 4 sequelae illnesses, we used national deaths data for 2001–2010 from the
Australian Bureau of Statistics, using ICD-10 codes (Technical Appendix 4 Table 1). The final
estimate included 2 multipliers, which are discussed below.
Technical Appendix 4 Table 1. Mortality and hospitalization codes for each sequel, Australia, 2010* Sequelae Mortality ICD-10 code and description Hospitalization ICD-10-AM code and description Guillain-Barré syndrome G610: Guillain-Barré syndrome – Hemolytic uremic syndrome D593: Hemolytic uremic syndrome – Irritable bowel syndrome K58: Irritable bowel syndrome K58.0: Irritable bowel syndrome with diarrhea
K58.9: Irritable bowel syndrome without diarrhea Reactive arthritis M021: Postdysenteric arthropathy
M028: Other reactive arthropathies M02.1: Postdysenteric arthropathy
M02.3: Reiter’s disease M02.8: Other reactive arthropathies
M03.2: Other postinfectious arthropathies in diseases classified elsewhere
*ICD-10-AM, International Classification of Diseases, Tenth Revision; AM, Australian Modification; –, all patients with incident cases are assumed to have been hospitalized so hospitalization data not used for this pathogen.
Domestically Acquired Multiplier
This multiplier adjusts for the proportion of case-patients who acquired infection in
Australia with values for each sequelae in Technical Appendix 4 Table 2. For GBS, we adopted
the domestically acquired multiplier for Campylobacter spp. (1). Given the relatively small
numbers of notified cases of HUS, we adopted the domestically acquired multiplier for STEC
(1). The domestically acquired multiplier for IBS was calculated as a weighted average of the

Page 2 of 8
domestically acquired multipliers for Campylobacter spp., nontyphoidal Salmonella enterica
serotypes (hereafter referred to as nontyphoidal Salmonella spp.), and Shigella spp., weighted by
the total number of IBS cases for each pathogen. Similarly, the domestically acquired multiplier
for ReA was calculated as a weighted average of the domestically acquired multipliers for
Campylobacter spp., nontyphoidal Salmonella spp., Shigella spp., and Yersinia enterocolitica,
weighted by the total number of ReA cases for each pathogen.
Technical Appendix 4 Table 2. Domestically acquired multipliers* Sequelae Domestically acquired multiplier Guillain-Barré syndrome 0.97 (range 0.91–0.99) Hemolytic uremic syndrome 0.99 (range 0.93–1.00) Irritable bowel syndrome 0.91 (90% CrI 0.88–0.94) Reactive arthritis 0.91 (90% CrI 0.86–0.95) *CrI, credible interval.
Proportion Foodborne Multiplier
This multiplier adjusts for the proportion of illness that is acquired from food and was
required only to estimate hospitalizations and deaths. Sequelae can arise from a source other than
a bacterial pathogen, from a bacterial pathogen that was not foodborne, or from a foodborne
pathogen. Only this latter category is considered a foodborne source. The proportion foodborne
multiplier is the simulated product of the bacterial multiplier and the weighted foodborne
multiplier and can be found in Technical Appendix 4 Table 3. The approach for calculating the
proportion foodborne multiplier for each sequel is described as follows:
Technical Appendix 4 Table 3. Proportion foodborne multiplier* Sequelae Foodborne multiplier Guillain-Barré syndrome 0.25 (90% CrI 0.1–0.43) Hemolytic uremic syndrome 0.33 (90% CrI 0.17–0.53) Irritable bowel syndrome 0.13 (90% CrI 0.08–0.20) Reactive arthritis 0.48 (90% CrI 0.36–0.62) *CrI, credible interval.
GBS
There have been several reviews, as well as many case–control and cross-sectional
studies, that estimated the percentage of GBS cases attributable to Campylobacter spp.
(Technical Appendix 4 Table 3). Poropatich et al. (8) performed a systematic review of 30 case–
control studies and concluded that 31.0% of GBS cases might be attributable to a previous
infection due to Campylobacter spp. (8). The other global systematic review of GBS incidence
does not look at Campylobacter spp. specifically or perform a meta-analysis (9). Other
(nonsystematic) reviews have found that 13%–72% (10) and 8%–50% (11) of GBS occurs as a
sequel to campylobacteriosis. We assume that 31% (range 4.8%–72%) of cases of GBS arise
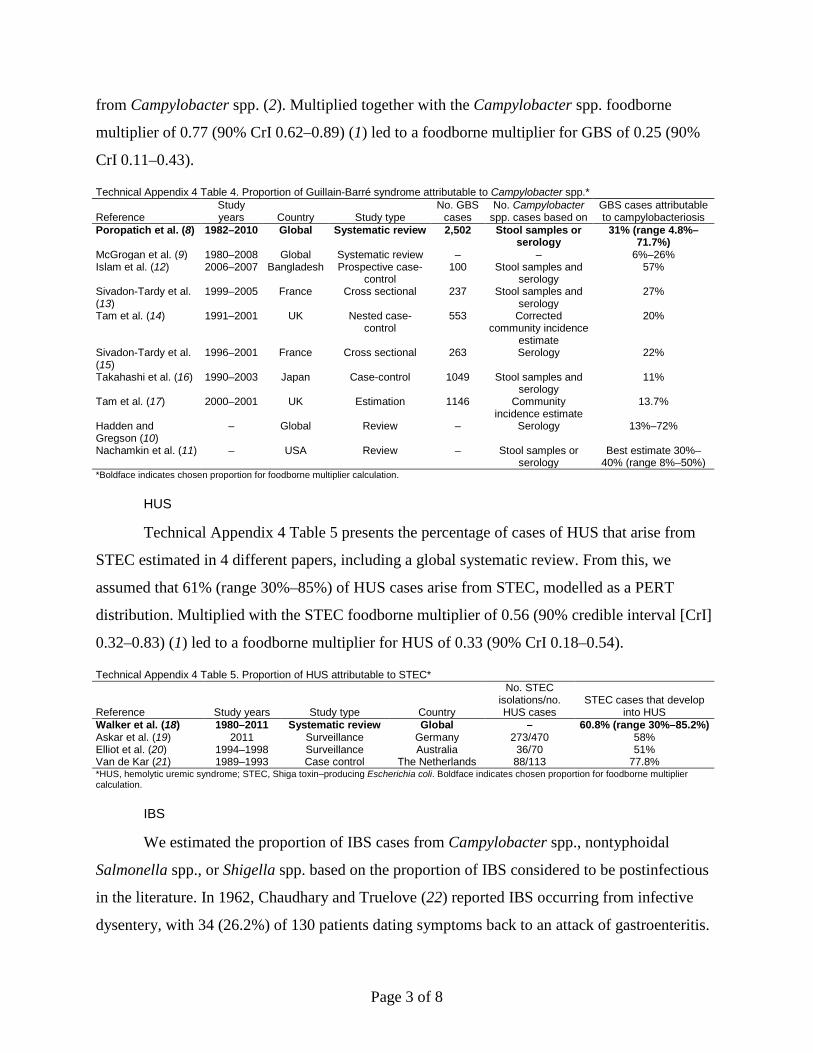
Page 3 of 8
from Campylobacter spp. (2). Multiplied together with the Campylobacter spp. foodborne
multiplier of 0.77 (90% CrI 0.62–0.89) (1) led to a foodborne multiplier for GBS of 0.25 (90%
CrI 0.11–0.43).
Technical Appendix 4 Table 4. Proportion of Guillain-Barré syndrome attributable to Campylobacter spp.*
Reference Study years Country Study type
No. GBS cases
No. Campylobacter spp. cases based on
GBS cases attributable to campylobacteriosis
Poropatich et al. (8) 1982–2010 Global Systematic review 2,502 Stool samples or serology
31% (range 4.8%–71.7%)
McGrogan et al. (9) 1980–2008 Global Systematic review – – 6%–26% Islam et al. (12) 2006–2007 Bangladesh Prospective case-
control 100 Stool samples and
serology 57%
Sivadon-Tardy et al. (13)
1999–2005 France Cross sectional 237 Stool samples and serology
27%
Tam et al. (14) 1991–2001 UK Nested case-control
553 Corrected community incidence
estimate
20%
Sivadon-Tardy et al. (15)
1996–2001 France Cross sectional 263 Serology 22%
Takahashi et al. (16) 1990–2003 Japan Case-control 1049 Stool samples and serology
11%
Tam et al. (17) 2000–2001 UK Estimation 1146 Community incidence estimate
13.7%
Hadden and Gregson (10)
– Global Review – Serology 13%–72%
Nachamkin et al. (11) – USA Review – Stool samples or serology
Best estimate 30%–40% (range 8%–50%)
*Boldface indicates chosen proportion for foodborne multiplier calculation.
HUS
Technical Appendix 4 Table 5 presents the percentage of cases of HUS that arise from
STEC estimated in 4 different papers, including a global systematic review. From this, we
assumed that 61% (range 30%–85%) of HUS cases arise from STEC, modelled as a PERT
distribution. Multiplied with the STEC foodborne multiplier of 0.56 (90% credible interval [CrI]
0.32–0.83) (1) led to a foodborne multiplier for HUS of 0.33 (90% CrI 0.18–0.54).
Technical Appendix 4 Table 5. Proportion of HUS attributable to STEC*
Reference Study years Study type Country
No. STEC isolations/no. HUS cases
STEC cases that develop into HUS
Walker et al. (18) 1980–2011 Systematic review Global – 60.8% (range 30%–85.2%) Askar et al. (19) 2011 Surveillance Germany 273/470 58% Elliot et al. (20) 1994–1998 Surveillance Australia 36/70 51% Van de Kar (21) 1989–1993 Case control The Netherlands 88/113 77.8% *HUS, hemolytic uremic syndrome; STEC, Shiga toxin–producing Escherichia coli. Boldface indicates chosen proportion for foodborne multiplier calculation.
IBS
We estimated the proportion of IBS cases from Campylobacter spp., nontyphoidal
Salmonella spp., or Shigella spp. based on the proportion of IBS considered to be postinfectious
in the literature. In 1962, Chaudhary and Truelove (22) reported IBS occurring from infective
dysentery, with 34 (26.2%) of 130 patients dating symptoms back to an attack of gastroenteritis.

Page 4 of 8
More recently, review studies have estimated that 6%-17% (23) and 7%–33% of IBS is
postinfectious (24). In the meta-analysis and estimation by Haagsma et al. (25), the authors
considered that 17% of IBS is due to campylobacteriosis, salmonellosis, or shigellosis from the
top end of the range of 6%-17% by Spiller and Garsed (23). We assumed 17% of IBS to be
triggered by a gastrointestinal infection (25), with a range of 7%–33% from the review by
Schwille-Kiuntke et al. (24). Because more than just Campylobacter spp., nontyphoidal
Salmonella spp. and Shigella spp. can cause postinfectious IBS, this may be an overestimate.
A foodborne multiplier for the combined 3 pathogens of 73% (90% CrI 64%–82%) was
calculated as a weighted average of the foodborne multipliers for each pathogen, weighted by the
total number of IBS cases for each pathogen. Multiplied by the above PERT distribution of 17%
(range 6%–33%), gave a foodborne multiplier for IBS of 13% (90% CrI 8%–20%).
Technical Appendix 4 Table 6. Proportion of IBS attributable to infectious gastroenteritis*
Reference Publication
year Study type Country No. postinfectious IBS
cases/IBS cases IBS that is
postinfectious, % Chaudhary and Truelove (22) 1962 Epidemiologic report UK 34/130 26.2 Spiller and Garsed (23) 2009 Review Global – 6–17 Haagsma et al. (25) 2010 Meta-analysis and
estimation The Netherlands – 17
Schwille-Kiuntke et al. (24) 2013 Review Global – 7–33 *IBS, irritable bowel syndrome. Boldface indicates chosen proportion for foodborne multiplier calculation.
ReA
In a review of ReA, Hannu et al. (4) compiled population-based studies on the annual
incidence of ReA—both from enteric and urogenital infection. We used this compilation and
calculated the proportion of ReA due to enteric infection by dividing the enteric incidence by the
total incidence found in each study (Technical Appendix 4 Table 7). We used the midpoint and
range of the proportions from these studies for the bacterial multiplier. We therefore assumed a
median of 66.7% of ReA is due to an enteric infection, with a range of 50%–94.7%. If enteric
infections preceding ReA are from other infections besides campylobacteriosis, salmonellosis,
shigellosis, or yersiniosis, using this distribution to estimate ReA cases from these infections
may cause an overestimation.
We adjusted for the proportion foodborne using a weighted average of the foodborne
multipliers for Campylobacter spp., nontyphoidal Salmonella spp., Shigella spp., and Y.
enterocolitica, weighted by the total number of ReA cases for each pathogen. This gave a
foodborne multiplier of 72% (90% CrI 60%–82%). Multiplied by the above alternate PERT
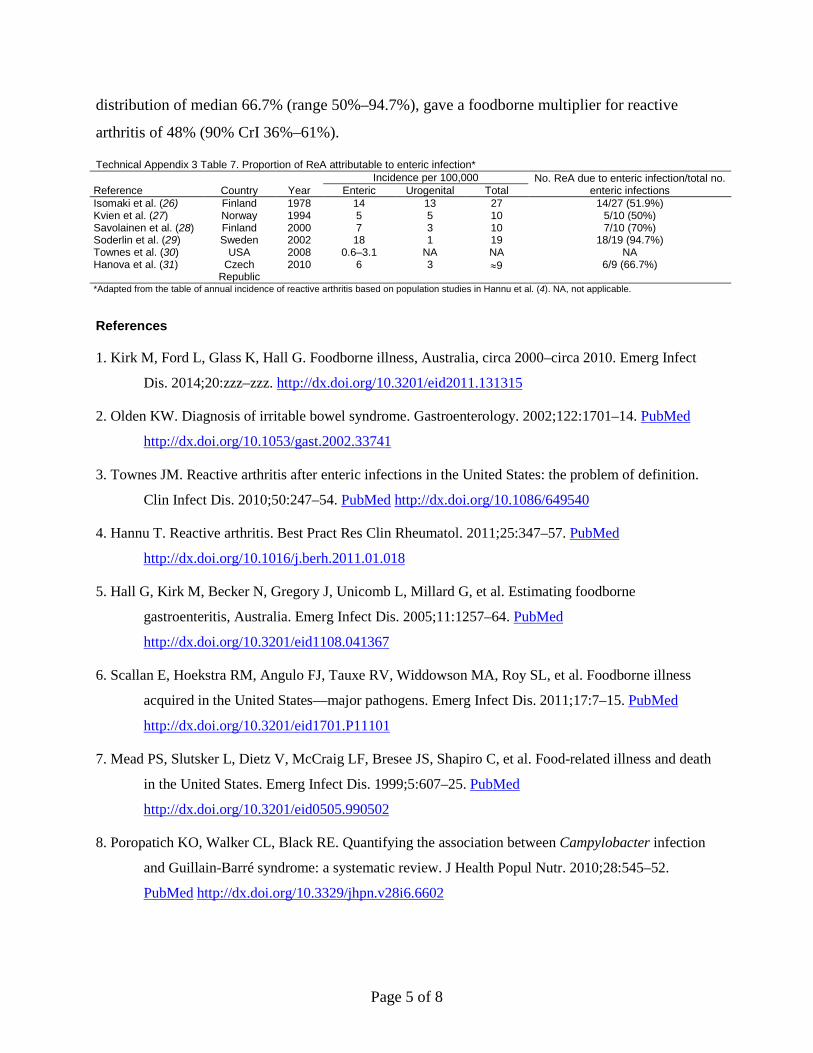
Page 5 of 8
distribution of median 66.7% (range 50%–94.7%), gave a foodborne multiplier for reactive
arthritis of 48% (90% CrI 36%–61%).
Technical Appendix 3 Table 7. Proportion of ReA attributable to enteric infection*
Reference Country Year Incidence per 100,000 No. ReA due to enteric infection/total no.
enteric infections Enteric Urogenital Total Isomaki et al. (26) Finland 1978 14 13 27 14/27 (51.9%) Kvien et al. (27) Norway 1994 5 5 10 5/10 (50%) Savolainen et al. (28) Finland 2000 7 3 10 7/10 (70%) Soderlin et al. (29) Sweden 2002 18 1 19 18/19 (94.7%) Townes et al. (30) USA 2008 0.6–3.1 NA NA NA Hanova et al. (31) Czech
Republic 2010 6 3 ≈9 6/9 (66.7%)
*Adapted from the table of annual incidence of reactive arthritis based on population studies in Hannu et al. (4). NA, not applicable.
References
1. Kirk M, Ford L, Glass K, Hall G. Foodborne illness, Australia, circa 2000–circa 2010. Emerg Infect
Dis. 2014;20:zzz–zzz. http://dx.doi.org/10.3201/eid2011.131315
2. Olden KW. Diagnosis of irritable bowel syndrome. Gastroenterology. 2002;122:1701–14. PubMed
http://dx.doi.org/10.1053/gast.2002.33741
3. Townes JM. Reactive arthritis after enteric infections in the United States: the problem of definition.
Clin Infect Dis. 2010;50:247–54. PubMed http://dx.doi.org/10.1086/649540
4. Hannu T. Reactive arthritis. Best Pract Res Clin Rheumatol. 2011;25:347–57. PubMed
http://dx.doi.org/10.1016/j.berh.2011.01.018
5. Hall G, Kirk M, Becker N, Gregory J, Unicomb L, Millard G, et al. Estimating foodborne
gastroenteritis, Australia. Emerg Infect Dis. 2005;11:1257–64. PubMed
http://dx.doi.org/10.3201/eid1108.041367
6. Scallan E, Hoekstra RM, Angulo FJ, Tauxe RV, Widdowson MA, Roy SL, et al. Foodborne illness
acquired in the United States—major pathogens. Emerg Infect Dis. 2011;17:7–15. PubMed
http://dx.doi.org/10.3201/eid1701.P11101
7. Mead PS, Slutsker L, Dietz V, McCraig LF, Bresee JS, Shapiro C, et al. Food-related illness and death
in the United States. Emerg Infect Dis. 1999;5:607–25. PubMed
http://dx.doi.org/10.3201/eid0505.990502
8. Poropatich KO, Walker CL, Black RE. Quantifying the association between Campylobacter infection
and Guillain-Barré syndrome: a systematic review. J Health Popul Nutr. 2010;28:545–52.
PubMed http://dx.doi.org/10.3329/jhpn.v28i6.6602

Page 6 of 8
9. McGrogan A, Madle GC, Seaman HE, de Vries CS. The epidemiology of Guillain-Barré syndrome
worldwide. A systematic literature review. Neuroepidemiology. 2009;32:150–63. PubMed
http://dx.doi.org/10.1159/000184748
10. Hadden RD, Gregson NA. Guillain–Barré syndrome and Campylobacter jejuni infection. Symp Ser
Soc Appl Microbiol. 2001;(30):145S–54S. PubMed http://dx.doi.org/10.1046/j.1365-
2672.2001.01363.x
11. Nachamkin I, Allos BM, Ho T. Campylobacter species and Guillain-Barré syndrome. Clin Microbiol
Rev. 1998;11:555–67. PubMed
12. Islam Z, Jacobs BC, van Belkum A, Mohammad QD, Islam MB, Herbrink P, et al. Axonal variant of
Guillain-Barré syndrome associated with Campylobacter infection in Bangladesh. Neurology.
2010;74:581–7. PubMed http://dx.doi.org/10.1212/WNL.0b013e3181cff735
13. Sivadon-Tardy V, Orlikowski D, Porcher R, Ronco E, Caudie C, Roussi J, et al. Guillain-Barré
syndrome, greater Paris area. Emerg Infect Dis. 2006;12:990–3. PubMed
14. Tam CC, O’Brien SJ, Petersen I, Islam A, Hayward A, Rodrigues LC. Guillain-Barré syndrome and
preceding infection with Campylobacter, influenza and Epstein-Barr virus in the general practice
research database. PLoS ONE. 2007;2:e344. PubMed
http://dx.doi.org/10.1371/journal.pone.0000344
15. Sivadon-Tardy V, Orlikowski D, Rozenberg F, Caudie C, Sharshar T, Lebon P, et al. Guillain-Barré
syndrome, greater Paris area. Emerg Infect Dis. 2006;12:990–3. PubMed
http://dx.doi.org/10.3201/eid1206.051369
16. Takahashi M, Koga M, Yokoyama K, Yuki N. Epidemiology of Campylobacter jejuni isolated from
patients with Guillain-Barré and Fisher syndromes in Japan. J Clin Microbiol. 2005;43:335–9.
PubMed http://dx.doi.org/10.1128/JCM.43.1.335-339.2005
17. Tam CC, O’Brien SJ, Adak GK, Meakins SM, Frost JA. Campylobacter coli—an important
foodborne pathogen. J Infect. 2003;47:28–32. PubMed http://dx.doi.org/10.1016/S0163-
4453(03)00042-2
18. Walker CL, Applegate JA, Black RE. Haemolytic-uraemic syndrome as a sequela of diarrhoeal
disease. J Health Popul Nutr. 2012;30:257–61. PubMed
http://dx.doi.org/10.3329/jhpn.v30i3.12288

Page 7 of 8
19. Askar M, Faber MS, Frank C, Bernard H, Gilsdorf A, Fruth A, et al. Update on the ongoing outbreak
of haemolytic uraemic syndrome due to Shiga toxin–producing Escherichia coli (STEC) serotype
O104, Germany, May 2011. Euro Surveill. 2011;16: pii: 19883. PubMed
20. Elliott EJ, Robins-Browne RM, O’'Loughlin EV, Bennett-Wood V, Bourke J, Henning P, et al.
Nationwide study of haemolytic uraemic syndrome: clinical, microbiological, and
epidemiological features. Arch Dis Child. 2001;85:125–31. PubMed
http://dx.doi.org/10.1136/adc.85.2.125
21. van de Kar NC, Roelofs HG, Muytjens HL, Tolboom JJ, Roth B, Proesmans W, et al. Verocytotoxin-
producing Escherichia coli infection in hemolytic uremic syndrome in part of western Europe.
Eur J Pediatr. 1996;155:592–5. PubMed
22. Chaudhary NA, Truelove SC. The irritable colon syndrome: a study of the clinical features,
predisposing causes, and prognosis in 130 cases. Q J Med. 1962;31:307–22. PubMed
23. Spiller R, Garsed K. Postinfectious irritable bowel syndrome. Gastroenterology. 2009;136:1979–88.
PubMed http://dx.doi.org/10.1053/j.gastro.2009.02.074
24. Schwille-Kiuntke J, Frick JS, Zanger P, Enck P. Post-infectious irritable bowel syndrome—a review
of the literature. Z Gastroenterol. 2011;49:997–1003. PubMed http://dx.doi.org/10.1055/s-0031-
1281581
25. Haagsma JA, Siersema PD, De Wit NJ, Havelaar AH. Disease burden of post-infectious irritable
bowel syndrome in the Netherlands. Epidemiol Infect. 2010;138:1650–6. PubMed
http://dx.doi.org/10.1017/S0950268810000531
26. Isomäki H, Raunio J, von Essen R, Hämeenkorpi R. Incidence of inflammatory rheumatic diseases in
Finland. Scand J Rheumatol. 1978;7:188–92. PubMed
http://dx.doi.org/10.3109/03009747809095652
27. Kvien TK, Glennas A, Melby K, Granfors K, Andrup O, Karstensen B, et al. Reactive arthritis:
incidence, triggering agents and clinical presentation. J Rheumatol. 1994;21:115–22. PubMed
28. Savolainen E, Kaipiainen-Seppanen O, Kroger L, Luosujarvi R. Total incidence and distribution of
inflammatory joint diseases in a defined population: results from the Kuopio 2000 arthritis
survey. J Rheumatol. 2003;30:2460–8. PubMed
29. Söderlin MK, Kautiainen H, Puolakkainen M, Hedman K, Söderlund-Venermo M, Skogh T, et al.
Infections preceding early arthritis in southern Sweden: a prospective population-based study. J
Rheumatol. 2003;30:459–64. PubMed

Page 8 of 8
30. Townes JM, Deodahar AA, Laine ES, Smith K, Krug HE, Barkhuizen A, et al. Reactive arthritis
following culture-confirmed infections with bacterial enteric pathogens in Minnesota and Oregon:
a population-based study. Ann Rheum Dis. 2008;67:1689–96. PubMed
http://dx.doi.org/10.1136/ard.2007.083451
31. Hanova P, Pavelka K, Holcatova I, Pikhart H. Incidence and prevalence of psoriatic arthritis,
ankylosing spondylitis, and reactive arthritis in the first descriptive population-based study in the
Czech Republic. Scand J Rheumatol. 2010;39:310–7. PubMed
http://dx.doi.org/10.3109/03009740903544212f

Page 1 of 4
Article DOI: http://dx.doi.org/10.3201/eid2011.131316
Sequelae of Foodborne Illness Caused by 5 Pathogens, Australia, Circa 2010
Technical Appendix 5
Model Inputs for 4 Sequelae Illnesses Due to Contaminated Food
Incidence
Technical Appendix 5 Table 1. Guillain-Barré Syndrome Model input, source, and comments Distribution Data for model input Antecedent bacterial gastroenteritis cases: estimated number of foodborne Campylobacter spp. cases (1)
Outcome
5%, median, 95% values: 108500, 179000, 290000 (circa 2010) 82500, 139000, 227000 (circa 2000)
Sequelae multiplier: this proportion was a midpoint between estimates from the literature reported in Tam et al. (2), McCarthy and Gieseke (3), and Allos et al. (4)
PERT Minimum, modal, maximum values: 0.000192, 0.000304, 0.000945
Total foodborne illness: foodborne Campylobacter spp. cases × Sequelae multiplier
Outcome 5%, median, 95% values: 30, 75, 150 (circa 2010) 25, 50, 100 (circa 2000)
Rate of foodborne illness from Campylobacter spp. per million population
Outcome 5%, median, 95% values: 2, 3.1, 6 (circa 2010) 1, 2.8, 6 (circa 2000)
Technical Appendix 5 Table 2. Hemolytic uremic syndrome Model input, source, and comments Distribution Data for model input Antecedent bacterial gastroenteritis cases: estimated number of foodborne STEC cases (1)
Outcome
5%, median, 95% values: 950, 2350, 5850 (circa 2010) 550, 1900, 5000 (circa 2000)
Sequelae multiplier: this proportion is from Vally et al. (5) Alternate PERT
2.5%, Median, 97.5% values: 0.017, 0.03, 0.051
Total foodborne illness: foodborne STEC cases × Sequelae multiplier Outcome 5%, median, 95% values: 25, 70, 200 (circa 2010) 15, 55, 175 (circa 2000)
Rate of foodborne illness from STEC per million Outcome 5%, median, 95% values: 1, 3.3, 9 (circa 2010) 1, 3.0, 9 (circa 2000)
*STEC, Shiga toxin–producing Escherichia coli. Technical Appendix 5 Table 3. Irritable bowel syndrome Model input, source, and comments Distribution Data for model input Antecedent bacterial gastroenteritis cases: Estimated number of foodborne Campylobacter spp. cases (1) Outcome 5%, median, 95% values:
108500, 179000, 290000 (circa 2010) 82500, 139000, 227000 (circa 2000)
Estimated number of foodborne nontyphoidal Salmonella spp. cases (1)
Outcome 5%, median, 95% values: 21200, 39600, 73400 (circa 2010) 15000, 28000, 50000 (circa 2000)
Estimated number of foodborne Shigella spp. cases (1) Outcome 5%, median, 95% values: 150, 350, 850 (circa 2010) 175, 515, 1300 (circa 2000)
Sequelae multiplier: This proportion was from Haagsmsa et al. (6) Alternate PERT
2.5%, Median, 97.5% values: 0.072, 0.088, 0.104
Total foodborne illness Outcome 5%, median, 95% values: Foodborne Campylobacter spp. cases × Sequelae multiplier + 12500, 19500, 30700 (circa 2010)

Page 2 of 4
Model input, source, and comments Distribution Data for model input Foodborne nontyphoidal Salmonella spp. cases × Sequelae multiplier +
9500, 14800, 23500 (circa 2000)
Foodborne Shigella spp. cases × Sequelae multiplier Rate of foodborne illness per million Outcome 5%, median, 95% values:
570, 915, 1440 (circa 2010) 550, 850, 1350 (circa 2000)
Technical Appendix 5 Table 4. Reactive arthritis Model input, source, and comments Distribution Data for model input Antecedent bacterial gastroenteritis cases: Estimated number of foodborne Campylobacter spp. cases (1) Outcome 5%, median, 95% values:
108500, 179000, 290000 (circa 2010) 82500, 139000, 227000 (circa 2000)
Estimated number of foodborne nontyphoidal Salmonella spp. cases (1)
Outcome 5%, median, 95% values: 21200, 39600, 73400 (circa 2010) 15000, 28000, 50000 (circa 2000)
Estimated number of foodborne Shigella spp. cases (1) Outcome 5%, median, 95% values: 150, 350, 850 (circa 2010) 175, 515, 1300 (circa 2000)
Estimated number of foodborne Yersinia enterocolitica cases (1) Outcome 5%, median, 95% values: 650, 1150, 1950 (circa 2010) 300, 800, 1650 (circa 2000)
Sequelae multipliers: The proportion for each of the 4 pathogens was calculated from the literature. See Technical Appendix 1 for further explanation.
Campylobacter spp. sequelae multiplier Alternate PERT
Minimum, median, maximum values: 0.028, 0.07, 0.16
Nontyphoidal Salmonella spp. sequelae multiplier Alternate PERT
Minimum, median, maximum values: 0, 0.085, 0.26
Shigella spp. sequelae multiplier PERT Minimum, modal, maximum values: 0.012, 0.097, 0.098
Yersinia enterocolitica sequelae multiplier Alternate PERT
Minimum, median, maximum values: 0, 0.12, 0.231
Total foodborne illness: Outcome 5%, median, 95% values: Foodborne Campylobacter spp. cases × Sequelae multiplier + Foodborne nontyphoidal Salmonella spp. cases × Sequelae multiplier + Foodborne Shigella spp. cases × Sequelae multiplier + Foodborne Y. enterocolitica cases × Sequelae multiplier
8750, 16200, 30400 (circa 2010) 6700, 12500, 23000 (circa 2000)
Rate of foodborne illness from Campylobacter spp., nontyphoidal Salmonella spp., Shigella spp. and Y. enterocolitica per million
Outcome 5%, median, 95% values: 415, 765, 1375 (circa 2010) 380, 730, 1325 (circa 2000)
Hospitalizations and Deaths
Technical Appendix 5 Table 5. Guillain-Barré syndrome Model input, source, and comments Distribution Data for model input Average number of deaths per year: Australian Bureau of Statistics death data
Empirical 2001–2010: 24.5
Population adjustment: Australian resident population June quarter, http://www.abs.gov.au/AUSSTATS/[email protected]/DetailsPage/3101.0Dec%202011?OpenDocument [cited 2012 Aug 16]
Empirical By year (2001–2010): 19413240, 19651438, 19895435, 20127363, 20394791, 20697880, 21015936, 21384427,
21778845, 22065317 Domestically acquired multiplier: Campylobacter spp. domestic acquired multiplier
PERT Minimum, modal, maximum values: 0.91, 0.97, 0.99
Foodborne multiplier: derived from: Bacterial multiplier—the proportion of Guillain-Barré syndrome that is attributable to Campylobacter spp. from Poropatich et al. (7) × Campylobacter spp. foodborne proportion (1)
Outcome 5%, median, 95% values: 0.1, 0.25, 0.43
PERT Minimum, modal, maximum values: 0.048, 0.31, 0.717
Alternate PERT
5%, median, 95% values: 0.62, 0.77, 0.89
Total foodborne deaths: circa 2010 Outcome 5%, median, 95% values: 2, 6, 10 Rate of foodborne deaths per million: circa 2010 Outcome 5%, median, 95% values: 0.1, 0.3, 0.5 Technical Appendix 5 Table 6. Hemolytic uremic syndrome* Model input, source, and comments Distribution Data for model input

Page 3 of 4
Model input, source, and comments Distribution Data for model input Average number of deaths per year: Australian Bureau of Statistics death data
Empirical 2001–2010: 4.2
Population adjustment: Australian resident population June quarter, http://www.abs.gov.au/AUSSTATS/[email protected]/DetailsPage/3101.0Dec%202011?OpenDocument [cited 2012 Aug 16]
Empirical By year (2001–2010): 19413240, 19651438, 19895435, 20127363, 20394791, 20697880,
21015936, 21384427, 21778845, 22065317 Domestically acquired multiplier: STEC domestically acquired multiplier
PERT Minimum, modal, maximum values: 0.93, 0.99 1
Foodborne multiplier: derived from: Bacterial multiplier—the proportion of HUS that is attributable to STEC from Walker et al. (8) × STEC foodborne proportion (1)
Outcome 5%, median, 95% values: 0.17, 0.33, 0.53 PERT Minimum, modal, maximum values: 0.3,
0.608, 0.852 Alternate
PERT 5%, median, 95% values: 0.32, 0.56, 0.83
Total foodborne deaths: circa 2010 Outcome 5%, median, 95% values: 1, 2, 3 Rate of foodborne deaths per million: circa 2010 Outcome 5%, median, 95% values: 0.03, 0.1, 0.12 *HUS, hemolytic uremic syndrome; STEC, Shiga toxin–producing Escherichia coli. Technical Appendix 5 Table 7. Irritable bowel syndrome Model input, source, and comments Distribution Data for model input Yearly observed hospitalizations: state and territory hospitalization data
Empirical By year (2006–2010): 7851, 7933, 7753, 8128, 7762
Average number of deaths per year: Australian Bureau of Statistics death data
Empirical 2001–2010: 13.1
Population adjustment: Australian resident population June quarter, http://www.abs.gov.au/AUSSTATS/[email protected]/DetailsPage/3101.0Dec%202011?OpenDocument [cited 2012 Aug 16]
Empirical By year (2001–2010): 19413240, 19651438, 19895435, 20127363, 20394791, 20697880, 21015936, 21384427,
21778845, 22065317 Domestically acquired multiplier: a weighted multiplier from Campylobacter spp., nontyphoidal Salmonella spp., and Shigella spp. domestic multipliers
Alternate PERT
5%, median, 95% values: 0.88, 0.91, 0.94
Foodborne multiplier: derived from: Bacterial multiplier—proportion of IBS that is post-infectious extracted from the literature (6,9) × weighted Campylobacter spp., nontyphoidal Salmonella spp., and Shigella spp. foodborne proportion (1)
Outcome 5%, median, 95% values: 0.08, 0.13, 0.33
Alternate PERT
5%, median, 95% values: 0.06, 0.17, 0.33
Alternate PERT
5%, median, 95% values: 0.64, 0.73, 0.82
Total foodborne hospitalizations: circa 2010 Outcome 5%, median, 95% values: 550, 915, 1400 Total foodborne deaths: circa 2010 Outcome 5%, median, 95% values: 1, 2, 2 Rate of foodborne hospitalizations per million: circa 2010 Outcome 5%, median, 95% values: 25, 43, 70 Rate of foodborne deaths per million: circa 2010 Outcome 5%, median, 95% values: 0.05, 0.1, 0.11 Technical Appendix 5 Table 8. Reactive arthritis Model input, source, and comments Distribution Data for model input Yearly observed hospitalizations: State and Territory hospitalization data
Empirical By year (2006–2010): 63, 50, 50, 70, 70
Average number of deaths per year: Australian Bureau of Statistics death data
Empirical 2001–2010: 0
Population adjustment: Australian resident population June quarter, http://www.abs.gov.au/AUSSTATS/[email protected]/DetailsPage/3101.0Dec%202011?OpenDocument [cited 2012 Aug 16]
Empirical By year (2001–2010): 19413240, 19651438, 19895435, 20127363, 20394791, 20697880, 21015936, 21384427,
21778845, 22065317 Domestically acquired multiplier: Weighted multiplier of Campylobacter spp., nontyphoidal Salmonella spp., Shigella spp., and Y. enterocolitica domestic multipliers
Alternate PERT
5%, median, 95% values: 0.86, 0.91, 0.95
Foodborne multiplier: derived from: Bacterial multiplier—proportion of ReA that is post-infectious extracted from the literature (10) × weighted Campylobacter spp., nontyphoidal Salmonella spp., and Shigella spp. foodborne proportion (1).
Alternate PERT
5%, median, 95% values:0.36, 0.48, 0.61
Alternate
PERT Alternate
PERT
Minimum, median, maximum values: 0.5,
0.66, 0.947 5%, median, 95% values: 0.60, 0.72, 0.82
Total foodborne hospitalizations: circa 2010 Outcome 5%, median, 95% values: 20, 25, 40 Total foodborne deaths: circa 2010 Outcome 5%, median, 95% values: 0, 0, 0 Rate of foodborne hospitalizations per million: circa 2010 Outcome 5%, median, 95% values: 1, 1, 2 Rate of foodborne deaths per million: circa 2010 Outcome 5%, median, 95% values: 0, 0, 0

Page 4 of 4
References
1. Kirk M, Ford L, Glass K, Hall G. Foodborne illness, Australia, circa 2000–circa 2010. Emerg Infect
Dis. 2014;20:zzz–zzz. http://dx.doi.org/10.3201/eid2011.131315
2. McCarthy N, Giesecke J. Incidence of Guillain-Barré syndrome following infection with
Campylobacter jejuni. Am J Epidemiol. 2001;153:610–4. PubMed
http://dx.doi.org/10.1093/aje/153.6.610
3. Tam CC, Rodrigues LC, Petersen I, Islam A, Hayward A, O’Brien SJ. Incidence of Guillain-Barré
syndrome among patients with Campylobacter infection: a general practice research database
study. J Infect Dis. 2006;194:95–7. PubMed http://dx.doi.org/10.1086/504294
4. Baker MG, Kvalsvig A, Zhang J, Lake R, Sears A, Wilson N. Declining Guillain-Barré syndrome after
campylobacteriosis control, New Zealand, 1988–2010. Emerg Infect Dis. 2012;18:226–33.
PubMed http://dx.doi.org/10.3201/eid1802.111126
5. Vally H, Hall G, Dyda A, Raupach J, Knope K, Combs B, et al. Epidemiology of Shiga toxin
producing Escherichia coli in Australia, 2000–2010. BMC Public Health. 2012;12:63–71.
PubMed http://dx.doi.org/10.1186/1471-2458-12-63
6. Haagsma JA, Siersema PD, De Wit NJ, Havelaar AH. Disease burden of post-infectious irritable bowel
syndrome in the Netherlands. Epidemiol Infect. 2010;138:1650–6. PubMed
http://dx.doi.org/10.1017/S0950268810000531
7. Poropatich KO, Walker CL, Black RE. Quantifying the association between Campylobacter infection
and Guillain-Barré syndrome: a systematic review. J Health Popul Nutr. 2010;28:545–52.
PubMed http://dx.doi.org/10.3329/jhpn.v28i6.6602
8. Walker CL, Applegate JA, Black RE. Haemolytic-uraemic syndrome as a sequela of diarrhoeal disease.
J Health Popul Nutr. 2012;30:257–61. PubMed http://dx.doi.org/10.3329/jhpn.v30i3.12288
9. Schwille-Kiuntke J, Frick JS, Zanger P, Enck P. Post-infectious irritable bowel syndrome—a review of
the literature. Z Gastroenterol. 2011;49:997–1003. PubMed http://dx.doi.org/10.1055/s-0031-
1281581
10. Hannu T. Reactive arthritis. Best Pract Res Clin Rheumatol. 2011;25:347–57. PubMed
http://dx.doi.org/10.1016/j.berh.2011.01.018