sequence and structure databanks
DESCRIPTION
Sequence and structure databanks. can be divided into many different categories. One of the most important is. Supervised databanks with gatekeeper. Examples: Swissprot Refseq (at NCBI) Entries are checked for accuracy. + more reliable annotations -- frequently out of date. - PowerPoint PPT PresentationTRANSCRIPT
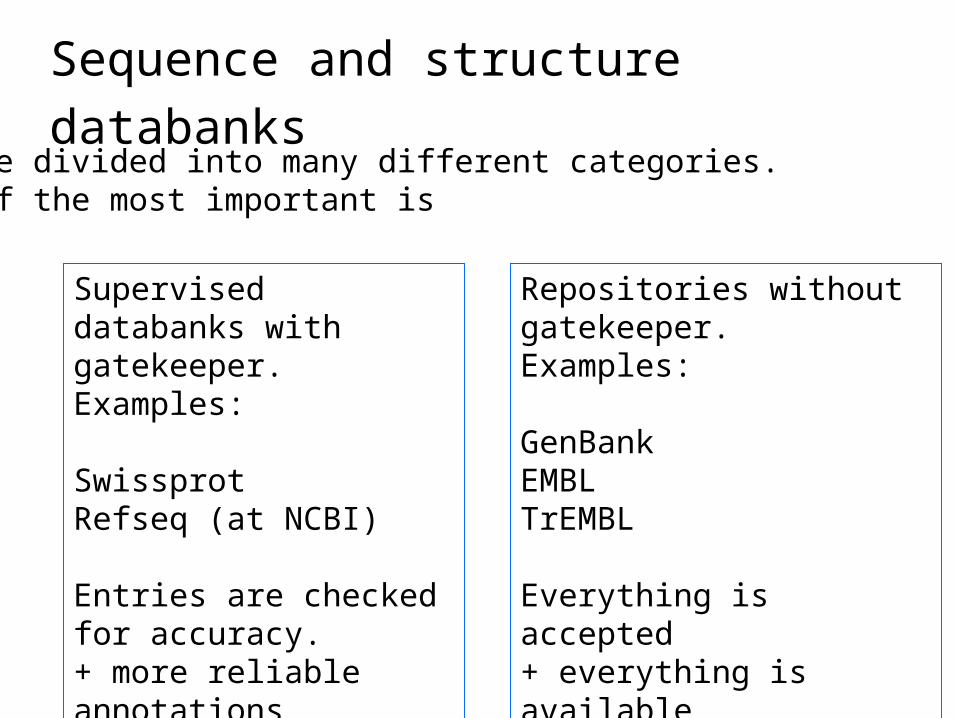
Sequence and structure databanks can be divided into many different categories. One of the most important is
Supervised databanks with gatekeeper. Examples:
SwissprotRefseq (at NCBI)
Entries are checked for accuracy.+ more reliable annotations-- frequently out of date
Repositories without gatekeeper. Examples:
GenBankEMBLTrEMBL
Everything is accepted + everything is available-- many duplicates-- poor reliability of annotations
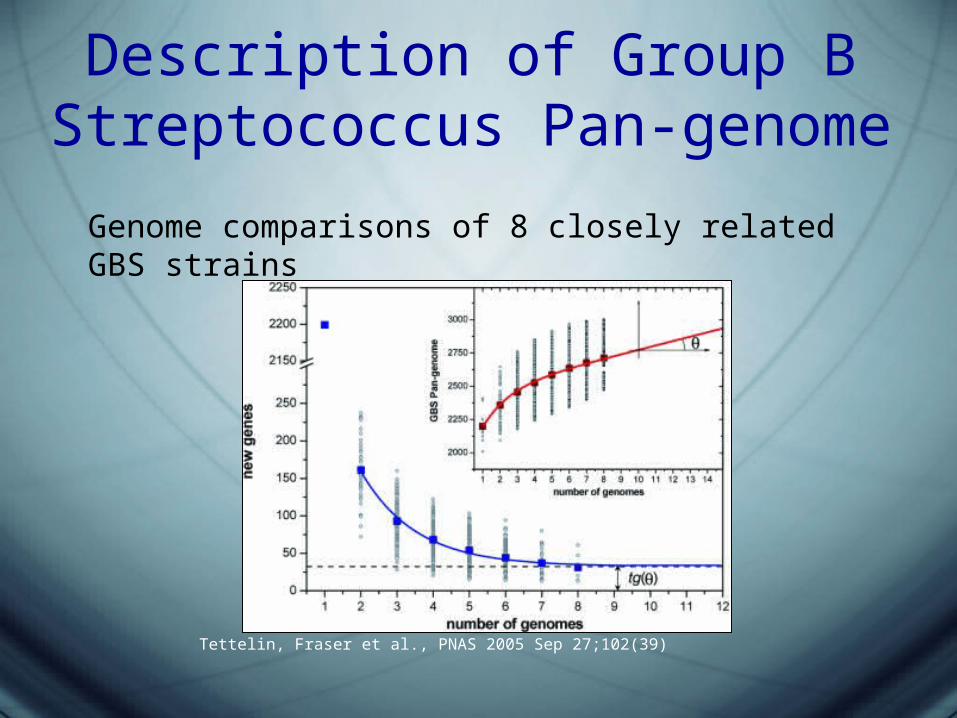
Description of Group B Streptococcus Pan-genome
Genome comparisons of 8 closely related GBS strains
Tettelin, Fraser et al., PNAS 2005 Sep 27;102(39)
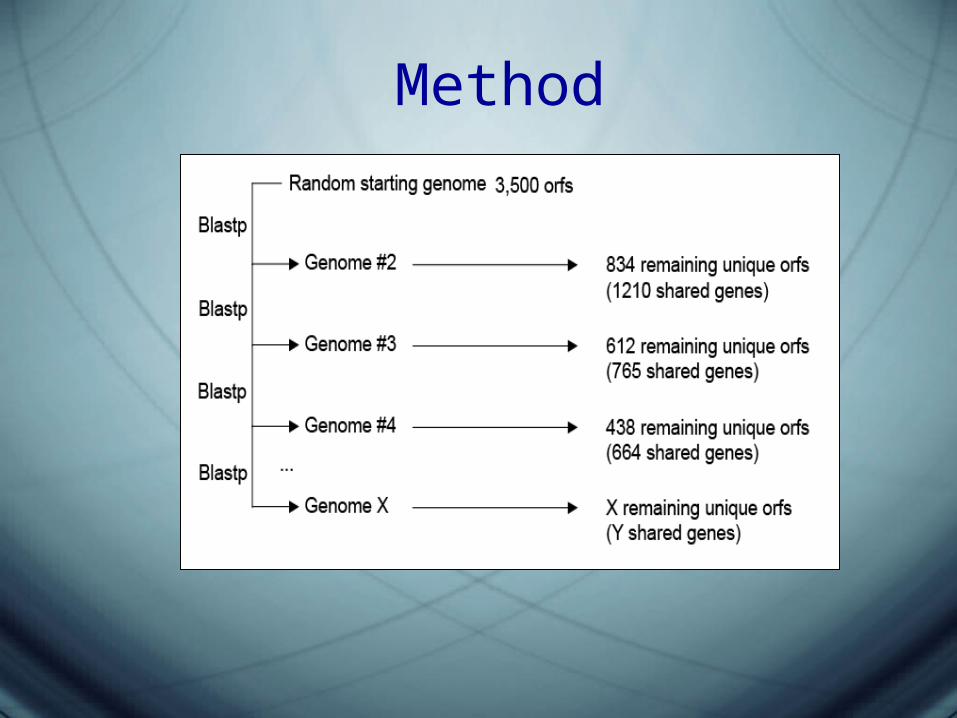
Method
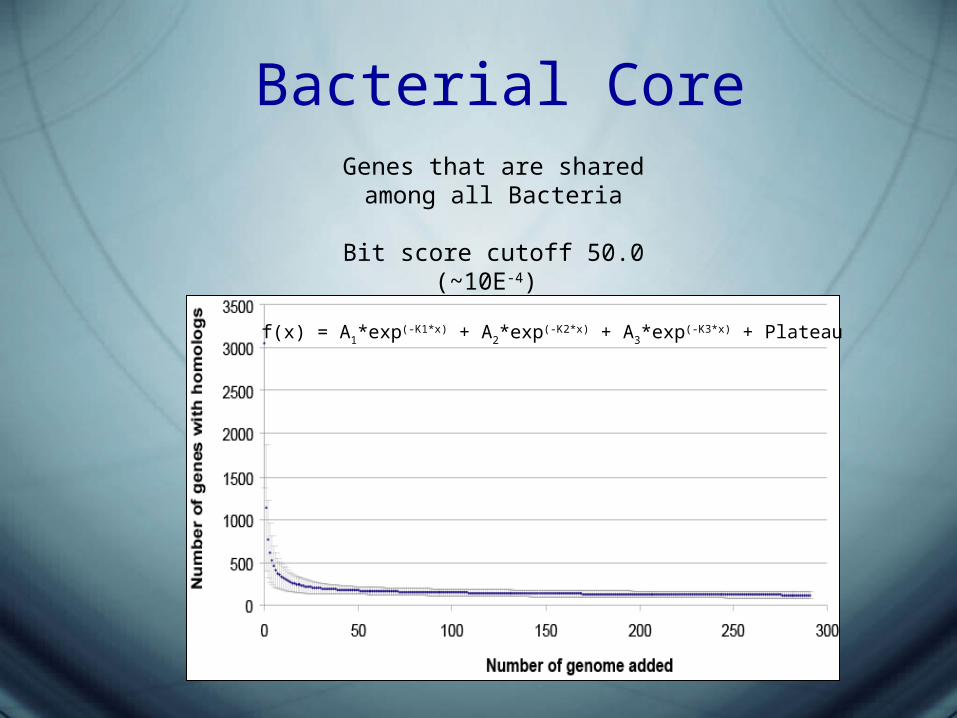
Bacterial CoreGenes that are shared among all
Bacteria
Bit score cutoff 50.0 (~10E-4)
f(x) = A1*exp(-K1*x) + A2*exp(-K2*x) + A3*exp(-K3*x) + Plateau

Genes without homologs
f(x) = A1*exp(-K1*x) + A2*exp(-K2*x) + A3*exp(-K3*x) + A4*exp(-K4*x)
+ A5*exp(-K5*x) + Plateau
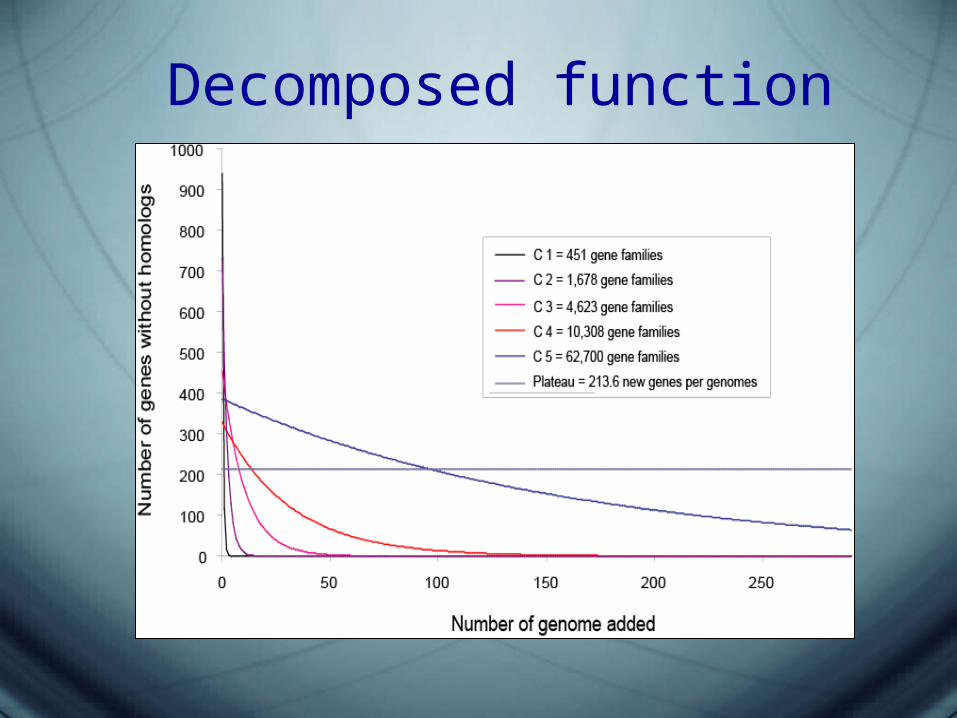
Decomposed function
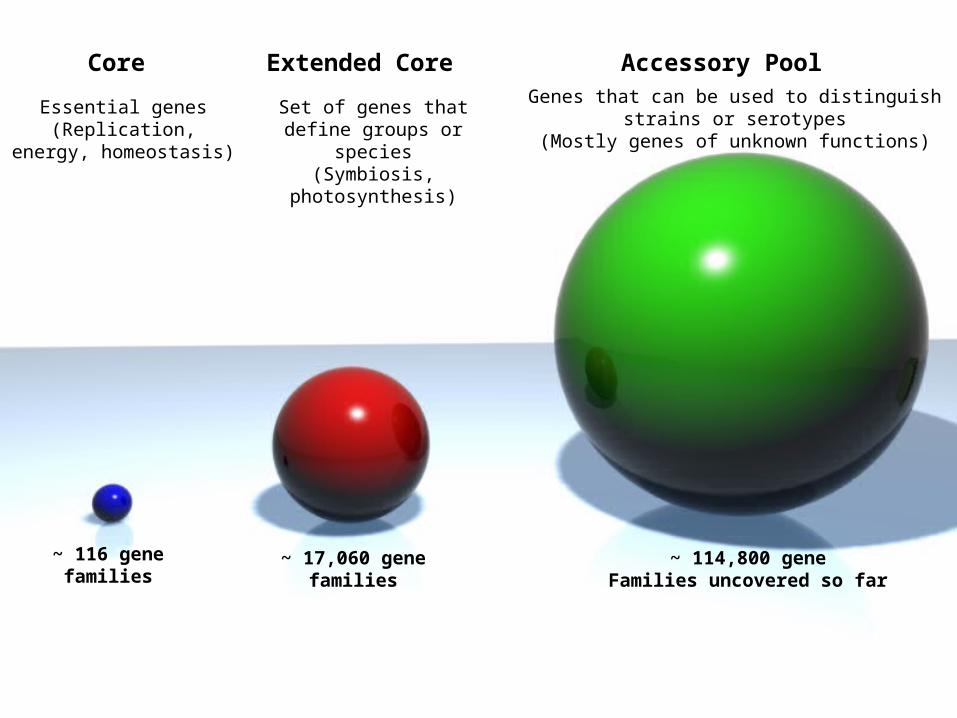
Core
Essential genes(Replication, energy,
homeostasis)
~ 116 genefamilies
Extended Core
Set of genes that define groups or species
(Symbiosis,photosynthesis)
~ 17,060 genefamilies
Accessory PoolGenes that can be used to distinguish strains or
serotypes(Mostly genes of unknown functions)
~ 114,800 geneFamilies uncovered so far
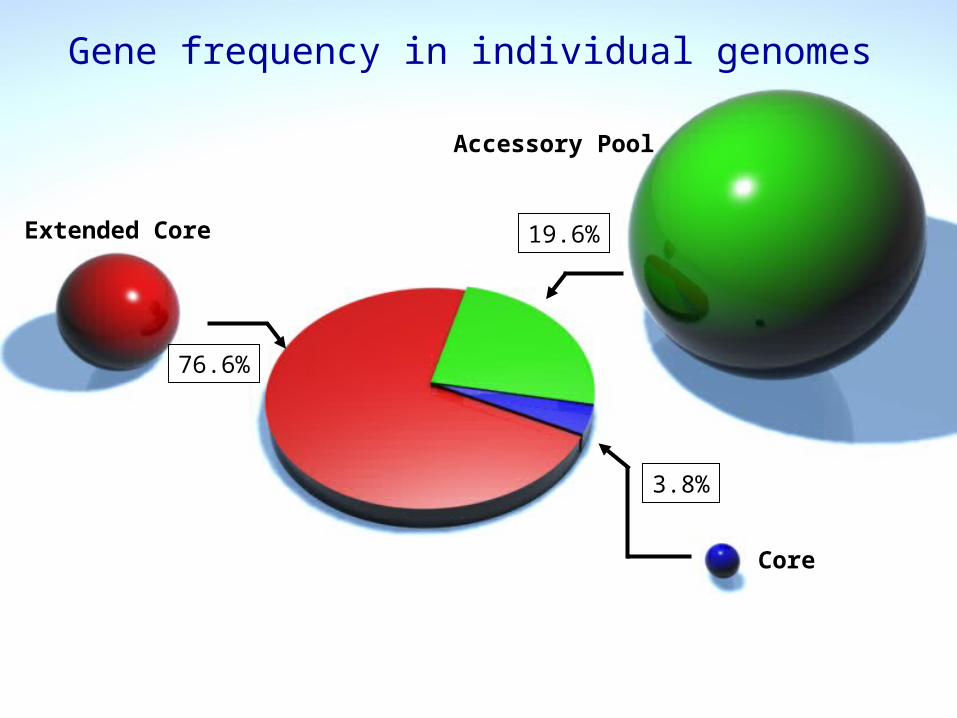
76.6%
3.8%
19.6%
Gene frequency in individual genomes
Core
Extended Core
Accessory Pool
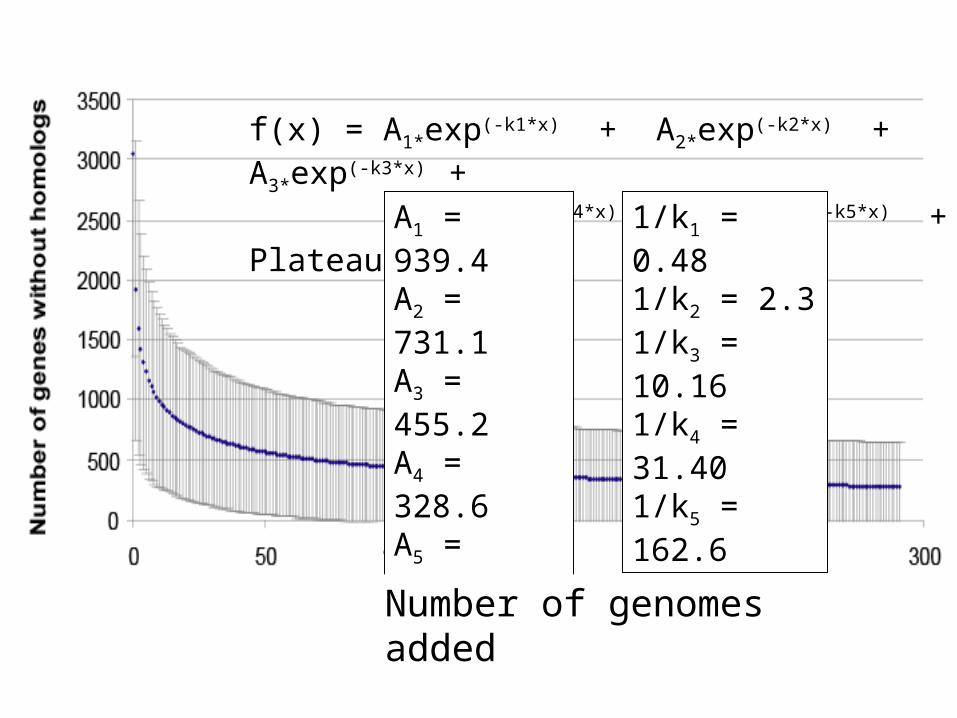
f(x) = A1*exp(-k1*x) + A2*exp(-k2*x) + A3*exp(-k3*x) + A4*exp(-k4*x) + A5*exp(-k5*x) + Plateau
1/k1 = 0.48 1/k2 = 2.31/k3 = 10.161/k4 = 31.401/k5 = 162.6
A1 = 939.4A2 = 731.1A3 = 455.2A4 = 328.6A5 = 385.5
Number of genomes added

Kézdy-Swinbourne Plot
0
50
100
150
200
250
300
350
400
450
500
-100 0 100 200 300 400 500 600
delta x = 10
2030405060708090100110120130
Novel genes after looking in x genomes
Nov
el g
enes
aft
er lo
oki
ng
in x
+ ∆
x ge
nom
es
~230 novel genes per genome
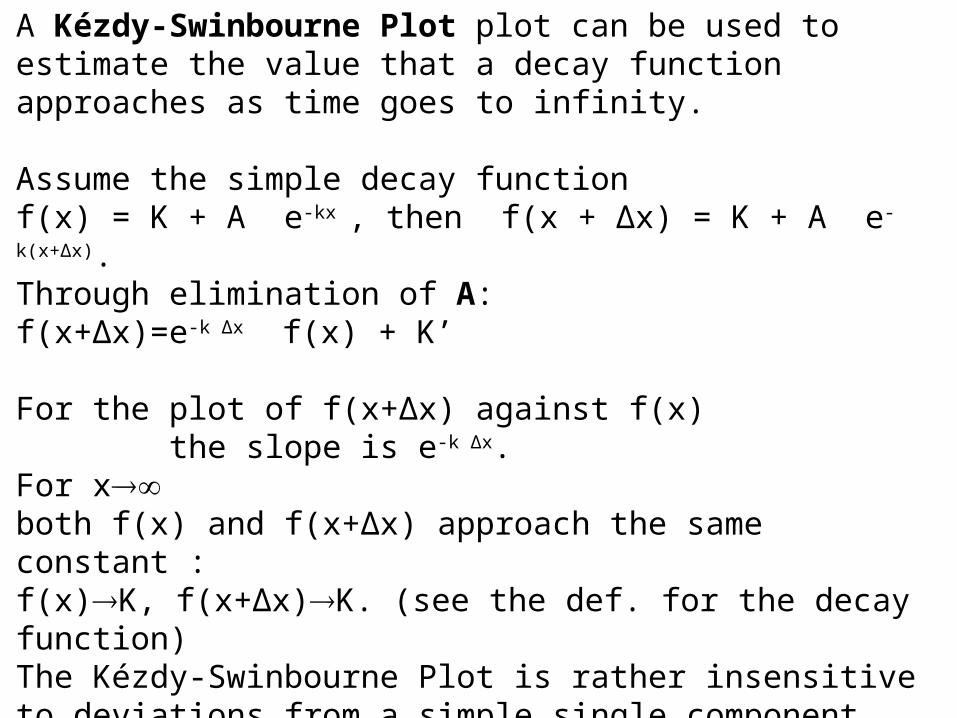
A Kézdy-Swinbourne Plot plot can be used to estimate the value that a decay function approaches as time goes to infinity.
Assume the simple decay function f(x) = K + A e-kx , then f(x + ∆x) = K + A e-k(x+∆x).Through elimination of A: f(x+∆x)=e-k ∆x f(x) + K’
For the plot of f(x+∆x) against f(x) the slope is e-k ∆x. For x both f(x) and f(x+∆x) approach the same constant : f(x)K, f(x+∆x)K. (see the def. for the decay function)The Kézdy-Swinbourne Plot is rather insensitive to deviations from a simple single component decay function.
More at Hiromi K: Kinetics of Fast Enzyme Reactions. New York: Halsted Press (Wiley); 1979

Kézdy-Swinbourne Plot
0
50
100
150
200
250
300
350
400
450
500
-100 0 100 200 300 400 500 600
delta x = 10
2030405060708090100110120130
Novel genes after looking in x genomes
Nov
el g
enes
aft
er lo
oki
ng
in x
+ ∆
x ge
nom
es
~230 novel genes per genome