sequence stratigraphic characterization of the baton … · sands have complex geometries...
TRANSCRIPT

Sequence Stratigraphic Characterization of the Baton Rouge Aquifer System, Southeastern Louisiana
Elizabeth L. Chamberlain1,2, Jeffrey S. Hanor1, and Frank T.-C. Tsai3
1Department of Geology and Geophysics, Louisiana State University, Baton Rouge, Louisiana 70803
2Department of Earth and Environmental Sciences, Tulane University, New Orleans, Louisiana 70118
3Department of Civil and Environmental Engineering, Louisiana State University, Baton Rouge, Louisiana 70803
ABSTRACT
Saltwater encroachment northward into freshwater sands of the Baton Rouge aqui-fer system, southeastern Louisiana, poses a serious environmental threat to this im-portant municipal and industrial water resource. The aquifer system consists of a 2800-ft (850-m) thick succession of south-dipping siliciclastic sandy units and mudstones of Upper Miocene through Pleistocene age. A geology-based understanding of this aquifer system is necessary for developing strategies to control saltwater intrusion. Seventy-five digitized spontaneous potential-resistivity logs for boreholes in the area provided data for interpreting environments of deposition, for correlating sand-rich and mudstone-rich zones, and for identifying periods of low and high rates of sediment aggradation. The sands have complex geometries representing braided stream, meandering channel fill, floodplain, levee, and crevasse splay facies. Individual aquifer units are interpreted to be complex zones of amalgamated sand bodies that may have been deposited during times of low aggradation associated with sea-level falling-stages and lowstand system tracts. The amalgamation created a high degree of connectivity which results in these zones behaving as single hydrologic units. Numerous and major erosional unconformi-ties are seen in the subsurface. Mudstone-rich confining sequences are interpreted to be flood-plain sediments that may have been deposited during times of high aggradation associated with sea-level highstands. Superimposed on this longer-term allogenic forcing caused by sea-level changes are shorter-term autogenic events, such as avulsion, which can be inferred from sand body geometries. Sequence stratigraphic characterization provides a process-oriented basis for understanding the details of the architecture and hydrologic behavior of this highly complex aquifer system and supports the spatial com-plexity of geostatistical models which are being developed for the aquifers.
INTRODUCTION A widespread loss of stationarity has been perceived in hydrologic systems and is attributed to anthropogen-
ic alteration of catchments, increased consumption, and climate change (Milly et al., 2008). Finding new and innovative ways to describe and model aquifers will become increasingly important as attempts to mitigate this change are implemented. The research herein addresses the environmental problem of saltwater encroachment into freshwater sands of the Baton Rouge aquifer system, southeastern Louisiana. These freshwater aquifers are the principal source of public supply and industrial waters in the Baton Rouge metropolitan area (Sargent, 2012). Saltwater encroachment into sands north of the Baton Rouge Fault has been identified for years as a serious threat to these aquifers (Rollo, 1969; Lovelace, 2007; Tsai, 2010). This study presents a detailed geology-based ap-proach to understanding the hydraulic character, morphology and depositional setting of the Baton Rouge aquifer system which is necessary for developing strategies to halt or control the intrusion of salt water into this drinking water supply (Tsai, 2010). The work was undertaken with a broader scientific objective of understanding the
Chamberlain, E. L., J. S. Hanor, and F. T.-C. Tsai, 2013, Sequence stratigraphic characterization of the Baton Rouge aquifer system, southeastern Louisiana: Gulf Coast Association of Geological Societies Transactions, v. 63, p. 125–136.
125
Copyright © 2013 by The Gulf Coast Association of Geological Societies

Chamberlain et al.
basis for the geometry of the Baton Rouge aquifer sands and putting these sediments into a sequence stratigraphic framework.
GEOLOGIC SETTING The Southern Hills aquifer system, as designated by the U.S. Geological Survey (Buono, 1983) includes late
Cenozoic coastal plain sediments in southeastern Louisiana and southwestern Mississippi. The term “Baton Rouge aquifer system” is used here informally to represent the portion of the Southern Hills regional aquifer sys-tem in the Baton Rouge metropolitan area. The aquifer system consists of an approximately 2800-ft (850-m) thick succession of interbedded and unconsolidated siliciclastic sandy units and confining mudstone units that dip toward the south (Martin and Whiteman, 1989). The sediments date in age from the Upper Miocene through the Pleistocene. The aquifer recharge zone is in southwestern Mississippi and along the Mississippi–Louisiana bor-der, and there is topographic gradient driving groundwater flow to the south (Rollo, 1969). The aquifer sands are named for their approximate depth below ground level in the industrial district in northern Baton Rouge. The U.S. Geological Survey has designated these sands as the 1200-foot sand, 1500-foot sand, and so on, according to their depth (Griffith, 2003). According to Galloway (2005) Louisiana Upper Miocene, Pliocene, and Pleistocene deltaic depositional systems were located south of the study area, and thus the sediments of these ages in the Ba-ton Rouge area are fluvial in origin. The ancient Mississippi and Tennessee Rivers were major axes which deliv-ered sediments from central and southern Rocky Mountains and southern Appalachian/Cumberland Plateau source areas to southeastern Louisiana during this time (Galloway, 2005).
Two west-east trending listric faults crosscut units of the Baton Rouge aquifer system. These are the Denham Springs–Scotlandville Fault to the north, and the Baton Rouge Fault, which runs through the metropoli-tan area (Fig. 1). McCulloh and Heinrich (2013) found that the aquifer units south of the Baton Rouge Fault are offset by a range of 300–350 ft (90–107 m). The greatest offset is seen in the deepest units. The Baton Rouge Fault serves as a leaky barrier to saltwater intrusion, with mainly freshwater sands to the north and brackish sands to the south. Anthropogenic withdrawal of waters to the north of the fault has caused migration of brackish water across the fault against the topographically-driven gradient into freshwater aquifer units north of the fault (Rollo, 1969). Saltwater contamination has been identified north of the fault in most aquifer units including the 1500-foot and 2000-foot sands (Lovelace, 2007).
Fluvial systems may deposit a variety of facies which can stack to form complex subsurface units. Heinrich (1990) in an unpublished report appears to have been the first to use log response to interpret the environments of deposition of sands in the Baton Rouge aquifer system. Five log-response facies were identified, two of which were thought to represent deposition by braided streams, two by meandering rivers, and one of unknown origin. He proposed that the braided stream deposits because of their coarser, more uniform character should conduct groundwater better than meandering river deposits.
METHODS
Sources Of Data The principal sources of information used to establish sand bed geometries and environments of sediment
deposition were 75 wireline spontaneous potential–resistivity logs for boreholes that had been previously drilled in the study area. A list of these logs and the locations of the boreholes are given in Chamberlain (2012). Spon-taneous potential and resistivity log responses are controlled largely by the ratio of sand to clay minerals. Well log curve responses and curve morphologies were used to establish subsurface lithology and to identify deposi-tional facies in the subsurface. All original log depths were adjusted for kelley bushing height and ground level elevation based on NGVD29 so that the depths are relative to mean sea level.
Evaluation of Subsurface Geology through Cross Sections Two lithostratigraphic cross sections were drafted based on digitized spontaneous potential and resistivity
curves for wells along transects established by Wendeborn and Hanor (2008), with one transect directly to the north and one directly south of the Baton Rouge Fault. The south transect, which included 11 well logs is shown here (Fig. 2). These digitized curves were used to identify the location of sands at depth, with sands identified as
126

Sequence Stratigraphic Characterization of the Baton Rouge Aquifer System, Southeastern Louisiana
Figure 1. The study area is in southeast Louisiana and uses well data from green-shaded parishes in-cluding East Baton Rouge (EBR), West Baton Rouge (WBR), and Livingston (LI). The study area in-cludes the modern Mississippi River (shown in brown) and is crosscut by the Baton Rouge and Denham Springs-Scotlandville faults. Transects directly to the north (N-) and south (S-) of the Baton Rouge fault are shown in red. Transects A–A’ through E–E’ were used to generate lithology-depth curves and are show in blue. Black dots indicate the location of boreholes from which well log data were used. Borehole names and locations are given in Chamberlain (2012). Scale is in UTM units and gridded into 6.21 mi (10 km) by 6.21 mi (10 km) squares.
deviations from a visually estimated mudstone baseline of both resistivity and spontaneous potential curves. Sand units were then laterally correlated between logs along each transect. Sands at matching depths for adjacent logs were extended to connect between those logs. Non-sand areas were assumed to be mudstone.
Isometric Fence Diagrams and Log Curve Morphologies Rollo (1969) constructed isometric fence diagrams to illustrate the geometries of the 1200-, 1500-, 2000-,
and 2400-foot sands. Hanor (1971) converted Rollo’s (1969) fence diagrams into block diagrams by covering the diagrams with bounding surfaces. The Rollo (1969) and Hanor (1971) diagrams do not show the Denham Springs–Scotlandville Fault, which had not been identified in the subsurface at that time. The U.S. Geological
127

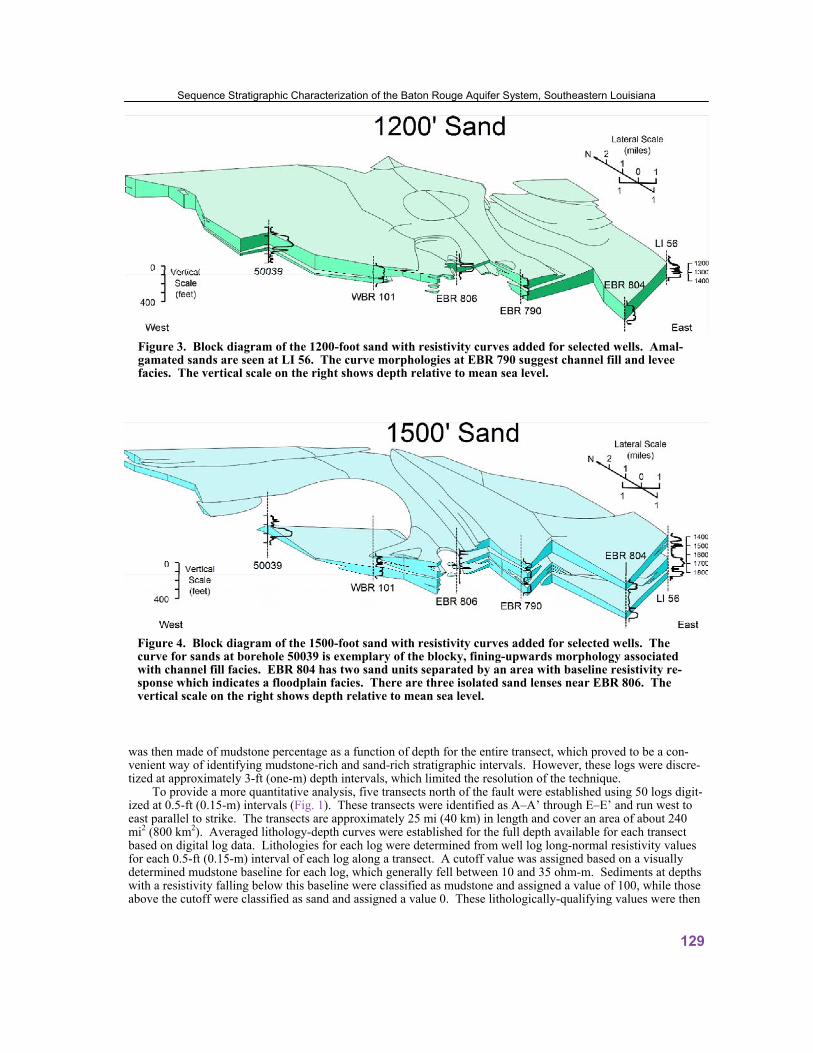
Survey–designated 1700-foot sand is included in Rollo’s 1500-foot unit. The figures by Hanor (1971) were re-drafted digitally for this study (Figs. 3–6) and arranged stratigraphically to show their relative positions in the subsurface (Fig. 7). Resistivity curves for boreholes on the visible side surfaces of the block diagrams were matched to sand units in the 1200-, 1500-, 2000-, and 2400-foot sands. Depositional facies were interpreted for these diagrams using the log response fluvial facies models established by Kerr and Jirik (1990) and Miall (2010). Levee facies result in spiky curve responses. Channel fill point bar sands are associated with blocky, fining-upward morphology. Crevasse splay deposits have coarsening-upward curve morphology, and muddy floodplain sediments are associated with baseline spontaneous potential and resistivity curves. Sands deposited by braided streams produce jagged, wedge-shaped curve morphologies.
Sequence Stratigraphic Setting Using Lithology-Depth Curves It was noted early on in this study that the sandy units in the aquifer system are highly discontinuous lateral-
ly, which makes correlation difficult. Hanor (2012, personal communication) used the digital resistivity logs for the transect immediately south of the fault (S-transect) to determine what percentage of all of the logs had a resis-tivity response indicative of mudstone at a specified depth. This appeared to be a possible way of identifying sand-rich and mudstone-rich stratigraphic intervals in a more quantitative way in a sequence in which individual units are highly discontinuous laterally. For example, if all the logs at a given depth had a mudstone response, then this depth was assigned a mudstone percentage of 100 for the entire transect. If half the logs had a mudstone response, that depth was assigned a value of 50, and if none did the depth was assigned a value of zero. A plot
Chamberlain et al.
Figure 2. The south (S-) transect revealed a subsurface with a high volume of mudstones and laterally discontinuous sands of complex morphologies. The spatial distribution of sands and mudstones and their lateral correlation (bottom) were drafted from spontaneous and resistivity responses (top) for 11 wells which included the depth interval of 1400 to 2800 ft (427 to 853 m).
128
was then made of mudstone percentage as a function of depth for the entire transect, which proved to be a con-venient way of identifying mudstone-rich and sand-rich stratigraphic intervals. However, these logs were discre-tized at approximately 3-ft (one-m) depth intervals, which limited the resolution of the technique.
To provide a more quantitative analysis, five transects north of the fault were established using 50 logs digit-ized at 0.5-ft (0.15-m) intervals (Fig. 1). These transects were identified as A–A’ through E–E’ and run west to east parallel to strike. The transects are approximately 25 mi (40 km) in length and cover an area of about 240 mi2 (800 km2). Averaged lithology-depth curves were established for the full depth available for each transect based on digital log data. Lithologies for each log were determined from well log long-normal resistivity values for each 0.5-ft (0.15-m) interval of each log along a transect. A cutoff value was assigned based on a visually determined mudstone baseline for each log, which generally fell between 10 and 35 ohm-m. Sediments at depths with a resistivity falling below this baseline were classified as mudstone and assigned a value of 100, while those above the cutoff were classified as sand and assigned a value 0. These lithologically-qualifying values were then
Sequence Stratigraphic Characterization of the Baton Rouge Aquifer System, Southeastern Louisiana
Figure 3. Block diagram of the 1200-foot sand with resistivity curves added for selected wells. Amal-gamated sands are seen at LI 56. The curve morphologies at EBR 790 suggest channel fill and levee facies. The vertical scale on the right shows depth relative to mean sea level.
Figure 4. Block diagram of the 1500-foot sand with resistivity curves added for selected wells. The curve for sands at borehole 50039 is exemplary of the blocky, fining-upwards morphology associated with channel fill facies. EBR 804 has two sand units separated by an area with baseline resistivity re-sponse which indicates a floodplain facies. There are three isolated sand lenses near EBR 806. The vertical scale on the right shows depth relative to mean sea level.
129

averaged across each transect at a given depth to provide a percent mudstone value for each half foot of depth along the transect. Depths represented by fewer than 6 boreholes were not considered. A 41-point centered mov-ing average was applied to smooth the data. The percent mudstone was graphed as a function of depth and trends were correlated between transects (Fig. 8).
RESULTS
Evaluation of Subsurface Geology through Cross Sections The correlated cross-section immediately south of the fault shows a high volume of mudstones and laterally
discontinuous sands. U.S. Geological Survey–identified aquifer units such as the 2000-foot sand are clearly not
Chamberlain et al.
Figure 5. Block diagram of the 2000-foot sand with resistivity curves added for selected wells. Amal-gamated sands are seen at LI 56. Sands thin and pinch out to the west which suggests an erosional un-conformity. The vertical scale on the right shows depth relative to mean sea level.
Figure 6. Block diagram of the 2400-foot sand with resistivity curves added for selected wells. A chan-nel fill facies curve morphology is present at WBR 101. The vertical scale on the right shows depth relative to mean sea level.
130

continuous laterally across this section. Sand body morphology is highly heterogeneous and includes blocky sands with thicknesses up to 150 ft (46 m), thin sands that are less than 10-ft (3-m) thick and extend for variable distances and isolated sand lenses of variable sizes (Fig. 2). These are interbedded with confining mudstones. The cross section north of the fault is similar (Chamberlain, 2012).
Isometric Block Diagrams and Log Curve Morphologies Many of the sands appear to be channel fill sands (point bar sands). This is evident in the 1200-foot sand,
where the selected log responses are largely indicative of blocky, upwardly fining units (Fig. 3). Further log analysis indicates stacking of multiple sand units to comprise layers depicted as homogeneous by Rollo (1969). A clear example is the 400-ft (120-m) interval of stacked sands at Li-56 in the 2000-foot sand diagram (Figs. 3 and 5).
Sequence Stratigraphic Characterization of the Baton Rouge Aquifer System, Southeastern Louisiana
Figure 7. The orientation and stratigraphic positions in the subsurface are shown for the 1200-, 1500-, 2000-, and 2400- sand units. 50039, WBR 101, EBR 806, EBR 790, EBR 804 and LI 56 are boreholes used for matching curve morphologies.
131

Cham
berlain et al.
Figure 8. Averaged lithology-depth curves for transects A–A’ through E–E’. The scale 0 to 100 at the top of each graph represents the percent-age of the logs in that transect which have mudstone present at that given depth. A 41-point centered average was used to smooth the data. Peaks to the left indicate a high proportion of sand across the transect, while peaks to the right indicate a high proportion of mudstone. Sandy peaks are labeled to corresponding U.S. Geological Survey–designated sands.
132

Sequence Stratigraphic Characterization of the Baton Rouge Aquifer System, Southeastern Louisiana
Sequence Stratigraphic Setting Using Lithology-Depth Curves Plotting average percent mudstone with depth for each transect yielded curves showing changes in average
lithology with depth and with position downdip within the study area (Fig. 8). These curves reveal cyclic peaks with depth. Each peak to the left in Figure 8 represents a high percentage of sand across the transect at that depth, while far-right portions of the curve indicate high average percent mudstone across that transect at the given depths. Sand-rich zones established in this study were correlated with the U.S. Geological Survey–designated sand units based on zones established in Griffith’s (2003) cross section through the study area. The sand peaks were also correlated from one transect to another. For example, the 1200-foot sand exists as a strong peak in all transects and occurs at increasing depths from northernmost transect A–A’ to southernmost transect E–E’ (Fig. 8). The depth change of recognizable sand peaks generally agrees with the dip of sedimentary units from north to south, which ranges from 0.28 to 0.41 degrees (Elshall et al., in revision). Enlarged curves for each transect with labeled sand units are shown in Appendix B of Chamberlain (2012). The E–E’ transect is located near the north Baton Rouge industrial district and exhibits sandy intervals which closely agree with the depth-occurrence of U.S. Geological Survey–designated sands. An enlarged version of transect E–E’ is shown in Figure 9.
DISCUSSION AND CONCLUSIONS
Cyclic Deposition of Sand-Rich and Mud-Rich Units The lithology-depth curves shown in Figures 8 and 9 identify changes in the relative proportions of sand and
mudstone that appear to be periodic with depth. It is proposed here that the cyclic deposition of sand-rich and mudstone-rich intervals may reflect forcing by sea-level changes in the Gulf of Mexico. Sea-level change is an allogenic, downstream control on fluvial systems (Blum and Tӧrnqvist, 2000) that can act on a timescale of 104 to 107 years (Miall, 2010). In contrast, channel avulsion is an example of an autogenic control on fluvial deposition (Miall, 2010) that typically acts on 102 to 103years time scale. Avulsion is a process that occurs when a river water escapes its natural levee in favor of a more hydraulically efficient pathway.
It is further proposed that the lithology of the aquifer units agrees with the lithology of that which can be expected of fluvial systems under base-level forcing conditions. Changes in sea level affect lithology by influ-encing the processes that govern sediment deposition. The alternation of these processes can produce distinct depositional sequences characterized relatively sand-rich and mudstone rich units (Posamentier and Allen, 1999). Rising sea level is associated with increased aggradation rate and a higher preservation of fine-grain sediments. Additionally, overbank sedimentation and river meandering are dominant fluvial processes that occur during sea-level highstand. These processes lead to the formation of relatively mudstone-rich sedimentary units which tend to contain a low proportion of highly compartmentalized sands (Kerr and Jirik, 1990). Sea-level falling stage and lowstand system tracts are associated with decreased aggradation rate and the removal of mudstones. This leads to a higher preservation of sand-rich units with amalgamated sand body geometries. Fluvial incision during fall-ing stage also produces erosional unconformities, which are then overlain by sand bodies. The result is a deposi-tional sequence bounded by erosional unconformities overlain by amalgamated sands (Posamentier and Allen, 1999). The connectivity of sands can also be influenced by subsidence rate and avulsion frequency.
Recent work in the Lower Mississippi River found that large amplitude sea-level changes can profoundly influence fluvial processes up to 400 mi (600 km) upstream from the present shoreline (Shen et al., 2012). Be-cause the Baton Rouge aquifer system is about 50 to 120 mi (80 to 190 km) from the Miocene to Pleistocene depocenter (cf. Galloway, 2005), it is quite likely that the fluvial systems which deposited Baton Rouge aquifer sediments responded to large amplitude sea-level changes. The sediments of the Baton Rouge aquifer system were deposited over a period of about 7 to 10 million years, from the upper Miocene through the Pleistocene. Roughly 10 distinct sand peaks are identified and labeled based on U.S. Geological Survey–designated sand oc-currence with depth (Fig. 9). These peaks are interpreted to correspond to 10 cycles of large amplitude sea-level changes. However significantly fewer cycles are identified than the 24 sea-level cycles are indicated by the Gulf of Mexico coastal onlap for this time period (Styzen, 1996). It is therefore concluded that numerous and large unconformities in the study area have removed portions of the geologic record. Fluvial incision is a mechanism that may have produced these unconformities. It is also likely that high frequency, low amplitude cycles includ-ing those seen at 5.0–4.6 Ma and 1.7–0.9 Ma were not captured as large events in the geologic record, but may be the source of small signatures embedded within the sandy peaks of the lithology-depth curves, or may simply not have had a notable effect on these fluvial sequences . Without more precise dating of the sediments, it is not pos-sible to identify specific hiatuses or unconformities in the Baton Rouge aquifer system stratigraphic record.
133
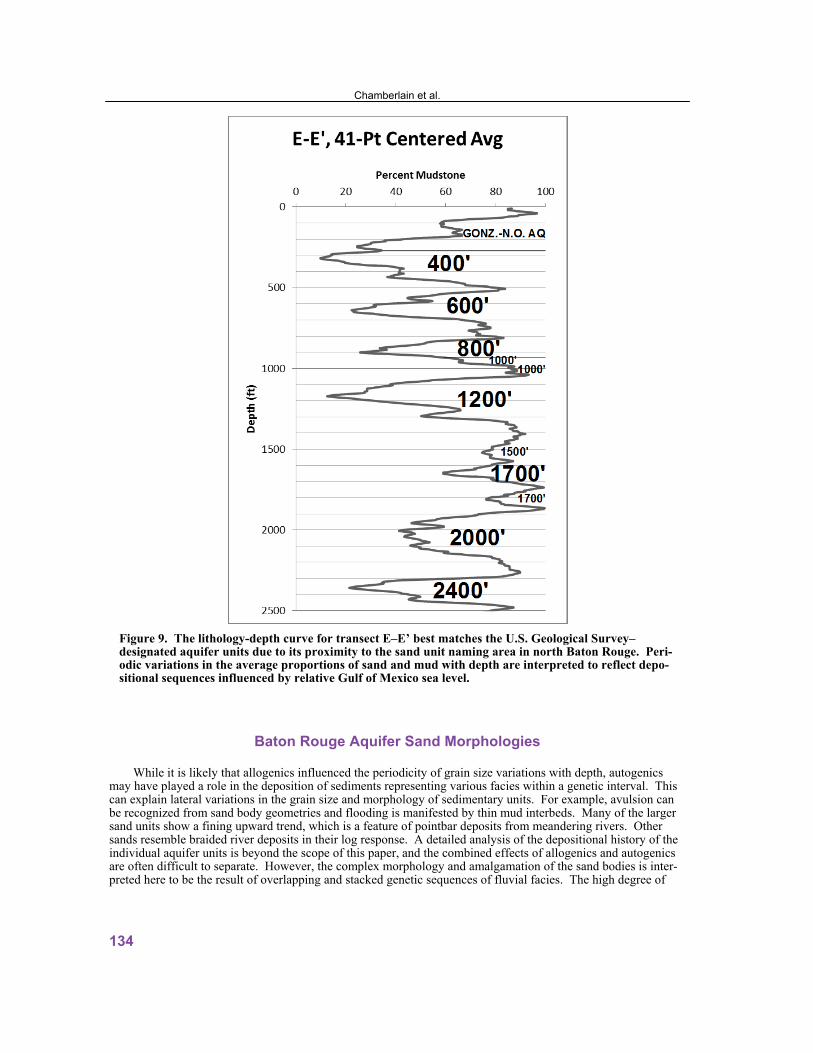
Figure 9. The lithology-depth curve for transect E–E’ best matches the U.S. Geological Survey–designated aquifer units due to its proximity to the sand unit naming area in north Baton Rouge. Peri-odic variations in the average proportions of sand and mud with depth are interpreted to reflect depo-sitional sequences influenced by relative Gulf of Mexico sea level.
Chamberlain et al.
Baton Rouge Aquifer Sand Morphologies While it is likely that allogenics influenced the periodicity of grain size variations with depth, autogenics
may have played a role in the deposition of sediments representing various facies within a genetic interval. This can explain lateral variations in the grain size and morphology of sedimentary units. For example, avulsion can be recognized from sand body geometries and flooding is manifested by thin mud interbeds. Many of the larger sand units show a fining upward trend, which is a feature of pointbar deposits from meandering rivers. Other sands resemble braided river deposits in their log response. A detailed analysis of the depositional history of the individual aquifer units is beyond the scope of this paper, and the combined effects of allogenics and autogenics are often difficult to separate. However, the complex morphology and amalgamation of the sand bodies is inter-preted here to be the result of overlapping and stacked genetic sequences of fluvial facies. The high degree of
134
complexity inferred from well-log interpretation of these buried Miocene to Pleistocene sediments is consistent with variations in contemporaneously deposited fluvial units seen in Galloway’s (1977) fluvial facies diagrams and with the documented geomorphology of present-day systems.
CONCLUSIONS It is proposed that U.S. Geological Survey–designated aquifer sands and confining mudstones represent a
series of depositional sequences influenced by changes in relative Gulf of Mexico sea level. Superimposed on this longer-term allogenic forcing caused by sea-level changes are shorter-term autogenic events, such as avul-sion.While the combined effects of autogenics and allogenics may be difficult to parse out in great detail in the stratigraphic record, it is clearly noted that spatial and temporal variations in fluvial processes result in a high degree heterogeneity in the subsurface. Distinct facies can be recognized from sand body geometries based on well log curve morphologies. Numerous and major erosional unconformities are seen in the subsurface.
The geology-based approach used in this study highlighted the highly complex nature of this aquifer system. The results yielded new information on the morphology of individual sand units, which led to a better under-standing of the hydrology of the system. For example, the amalgamation of sand units created a high degree of connectivity which results in these zones behaving as single hydrologic units. The degree of complexity of the amalgamated aquifer sands is mirrored in the spatial complexity of geostatistical models of the aquifer system (Elshall et al., in revision). Sequence stratigraphic characterization provides a process-oriented basis for under-standing the details of the architecture and hydrologic behavior of this highly complex aquifer system.
ACKNOWLEDGMENTS This paper is based on the M.S. thesis of Chamberlain (2012). The M.S. thesis committee consisted of pro-
fessors Jeffrey Hanor (Chair), Frank Tsai, and Sam Bentley. The study was supported in part by Grant/Cooperative Agreement Number G10AP00136 (Tsai and Hanor) from the U.S. Geological Survey. Its contents are solely the responsibility of the authors and do not necessarily represent the official views of the U.S. Geologi-cal Survey. Well logs were digitized using a program designed by Matthew Clark at the Louisiana State Univer-sity.
REFERENCES CITED
Blum, M. D., and T. E. Törnqvist, 2000, Fluvial responses to climate and sea-level change: A review and looking forward: Sedimentology, v. 47, p. 2–48.
Buono, A., 1983, The Southern Hills regional aquifer system of southeastern Louisiana and southwestern Mississippi:
U.S. Geological Survey Water-Resources Investigations Report 83–4189, 38 p. Chamberlain, E. L., 2012, Depositional environments of Upper Miocene through Pleistocene siliciclastic sediments,
Baton Rouge aquifer system, southeastern Louisiana: M.S. thesis, Louisiana State University, Baton Rouge, <http://etd.lsu.edu/docs/available/etd-07052012-181939/> Accessed August 8, 2013.
Elshall, A. S., F. T.-C. Tsai, and J. S. Hanor, in revision, Indicator geostatistics for reconstructing Baton Rouge
aquifer-fault hydrostratigraphy: Hydrogeology Journal. Galloway, W. E., 2005, Gulf of Mexico Basin depositional record of Cenozoic North American drainage basin
evolution: International Association of Sedimentologists Special Publications 35, p. 409–423. Griffith, J. M., 2003, Hydrogeologic framework of southeastern Louisiana: Louisiana Department of Transportation
and Development Water Resources Technical Report 72, 14 plates. Hanor, J. S.,1971, Unpublished figures on the 3-D sand geometry, Baton Rouge aquifer system, Louisiana. Heinrich, P. V., 1990, Relationship of hydrogeology to depositional facies in the Baton Rouge, Louisiana aquifers:
Unpublished report, Louisiana Geological Survey, Baton Rouge, 21 p.
Sequence Stratigraphic Characterization of the Baton Rouge Aquifer System, Southeastern Louisiana
135

Kerr, D. R., and L. A. Jirik, 1990, Fluvial architecture and reservoir compartmentalization in the Oligocene Middle Frio formation, south Texas: Gulf Coast Association of Geological Societies Transactions, v. 40, p. 373–380.
Lovelace, J. K., 2007, Chloride concentrations in ground water in East and West Baton Rouge parishes, Louisiana,
2004–05: U.S. Geological Survey Scientific Investigations Report 2007–5069, 27 p. Martin, A., and C. D. Whiteman, 1989, Geohydrology and regional ground-water flow of the coastal lowlands aquifer
system in pats of Louisiana, Mississippi, Alabama, and Florida preliminary analysis: U.S. Geological Survey Water-Resources Investigations Report 88–4100, 88 p.
McCulloh, R. P., and P. V. Heinrich, 2013, Surface faults of the south Louisiana growth-fault province, in R. T. Cox,
M. Tuttle, O. Boyd, and J. Locat, eds., Recent advances in North American paleoseismology and neotectonics east of the Rockies and use of the data in risk assessment and policy: Geological Society of America Special Papers 493, Boulder, Colorado, p. 37–49.
Miall, A. D., 2010, Alluvial deposits, in N. P. James and R. W. Dalrymple, eds., Facies models 4, 4th ed.: Geological
Association of Canada, St. John’s, Newfoundland, p. 105–137. Milly, P. C. D., J. Betancourt, M. Falkenmark, R. M. Hirsch, Z. W Kundzewic, D. P. Lettenmaier, and R. J. Stouffer,
2008, Stationarity is dead, whither water management?: Science, v. 319, p. 573–574. Posamentier, H. W., and G. P. Allen, 1999, Facies and log expression of systems tracts, in R. W. Dalrymple, ed.,
Siliciclastic sequence stratigraphy—Concepts and applications: Society for Sedimentary Geology Concepts in Sedimentology and Paleontology 7, Tulsa, Oklahoma, p. 103–121.
Rollo, J. R., 1969, Salt-water encroachment in aquifers of the Baton Rouge area, Louisiana: Louisiana Department of
Conservation and Department of Public Works Water Resources Bulletin 13, Baton Rouge, 31 p. Sargent, B. P. 2012, Water use in Louisiana, 2010: Louisiana Department of Transportation Water Resources Special
Report 17, Baton Rouge, 135 p. Shen, Z., T. E. Törnqvist, W. J. Autin, Z. R. P. Mateo, K. M. Straub, and B. Mauz, 2012, Rapid and widespread re-
sponse of the Lower Mississippi River to eustatic forcing during the last glacial-interglacial cycle: Geological Society of America Bulletin, v. 124, p. 690–704.
Styzen, M. J., 1996, A chart in two sheets of the Late Cenozoic chronostratigraphy of the Gulf of Mexico: Gulf Coast
Section of the Society of Economic Paleontologists and Mineralogists Foundation, Houston, Texas, 2 sheets. Tsai, F. T.-C., 2010, Bayesian model averaging assessment on groundwater management under model structure uncer-
tainty: Stochastic Environmental Research and Risk Assessment, v. 24, p. 845–861. Wendeborn, C., and J. S. Hanor, 2008, The Baton Rouge Fault, South Louisiana: A barrier and/or conduit for vertical
and/or lateral ground water flow?: Baton Rouge Geological Society, Louisiana Groundwater and Water Resource Symposium.
Chamberlain et al.
136