sequential star formation in iras 06084-0611 \(ggd 12-15\)
TRANSCRIPT

A&A 531, A27 (2011)DOI: 10.1051/0004-6361/201116743c© ESO 2011
Astronomy&
Astrophysics
Sequential star formation in IRAS 06084-0611 (GGD 12-15)
From intermediate-mass to high-mass stars�,��
K. M. Maaskant1,2, A. Bik3, L.B.F.M. Waters4,1, L. Kaper1, Th. Henning3, E. Puga5,6,M. Horrobin7, and J. Kainulainen3
1 Astronomical Institute Anton Pannekoek, University of Amsterdam, PO Box 94249, 1090 GE Amsterdam, The Netherlandse-mail: [email protected]
2 Leiden Observatory, Leiden University, PO Box 9513, 2300 RA Leiden, The Netherlands3 Max-Planck-Institut für Astronomie, Königstuhl 17, 69117 Heidelberg, Germany4 SRON-Netherlands Institute for Space Research, Sorbonnelaan 2, 3584 CA Utrecht, The Netherlands5 Centro de Astrobiología (CSIC-INTA), 28850 Torrejón de Ardoz, Madrid, Spain6 Instituut voor Sterrenkunde, Celestijnenlaan 200D, 3001 Leuven, Belgium7 I.Physikalisches Institut, Universität zu Köln, 50937 Köln, Germany
Received 17 February 2011 / Accepted 21 April 2011
ABSTRACT
Context. The formation and early evolution of high- and intermediate-mass stars towards the main sequence involves the interplay ofstars in a clustered and highly complex environment. To obtain a full census of this interaction, the Formation and Early evolution ofMassive Stars (FEMS) collaboration studies a well-selected sample of 10 high-mass star-forming regions.Aims. In this study we examine the stellar content of the high-mass star-forming region centered on IRAS 06084-0611 in theMonoceros R2 cloud.Methods. Using the near-infrared H- and K-band spectra from the VLT/SINFONI instrument on the ESO Very Large Telescope (VLT)and photometric near-infrared NTT/SOFI, 2MASS and Spitzer/IRAC data, we were able to determine the spectral types for the mostluminous stars in the cluster.Results. Two very young and reddened massive stars have been detected by SINFONI: a massive young stellar object (YSO) con-sistent with an early-B spectral type and a Herbig Be star. Furthermore, stars of spectral type G and K are detected while still in thePre-Main Sequence (PMS) phase. We derive additional properties such as temperatures, extinctions, radii and masses. We present aHertzsprung-Russell diagram and find most objects having intermediate masses between ∼1.5–2.5 M�. For these stars we derive amedian cluster age of ∼4 Myr.Conclusions. Using Spitzer/IRAC data we confirm earlier studies that the younger class 0/I objects are centrally located while theclass II objects are spread out over a larger area, with rough scale size radii of ∼0.5 pc and ∼1.25 pc respectively. Moreover, thepresence of a massive YSO, an ultracompact H ii region and highly reddened objects in the center of the cluster suggest a muchyounger age of <1 Myr. A possible scenario for this observation would be sequential star formation along the line of sight; from acluster of intermediate-mass to high-mass stars.
Key words. infrared: stars – stars: early-type – stars: formation – stars: pre-main sequence – circumstellar matter
1. Introduction
The formation of stars and planets is a result of complex in-tertwined behavior of gas and dust, strongly depending on theinitial conditions. The presence of high-mass stars is believedto play a major role in the process of star formation in clusters(Zinnecker & Yorke 2007). Since high-mass stars preferentiallyform in clusters, they inevitably exert influence on the clustersurroundings. Massive stars can clear out their direct surround-ings through their strong winds and ionizing fluxes more rapidlythan less massive stars. The energy they release in the interstel-lar medium powers H ii regions and bubbles and is thought totrigger second-generation star formation events.
Several mechanisms have been proposed to explain triggeredstar formation. The collect and collapse model (Elmegreen &Lada 1977) involves the propagation of ionization and shock
� Based on observations collected at the European SouthernObservatory at Paranal, Chile (ESO program 078.C-0780).�� SINFONI spectra are available in electronic form upon request:[email protected]
fronts through a molecular cloud complex. Between these frontsa dense shell of material is trapped and when grown largeenough, global shell fragmentation occurs and new stars areformed. Alternatively, triggered star formation can occur in pre-existing clumps. Through dynamical processes such as the ex-pansion of an H ii region in a non-homogeneous neutral medium,high pressure accumulates the dense material into layers, shellsor rings which then gravitationally collapse (Elmegreen 1998).We refer to Lada (2010) and André et al. (2009) and referencestherein for reviews of triggered star formation scenarios.
Infrared (IR), sub-millimeter and radio imaging has allowedthese earliest stages of protostellar evolution to become acces-sible to observers. Observational studies have started to mapthe interaction of high-mass stars and previously hidden stel-lar content in those star-forming regions (Blum et al. 2000; Bik2004; Alvarez et al. 2004; Churchwell et al. 2006). Much lessambiguous identification and classification of the stellar contenthas been demonstrated by the diagnostic power of near-infrared(NIR) spectroscopy (Hanson et al. 2002; Bik et al. 2005, 2010;Puga et al. 2010; Martins et al. 2010).
Article published by EDP Sciences A27, page 1 of 13

A&A 531, A27 (2011)
Fig. 1. Spitzer/IRAC three-color image of IRAS 06084-0611 and its surroundings (blue: 3.6 μm, green: 4.5 μm, red: 5.8 μm). The dense clusterregion delimited by the white box is the area covered by the SINFONI observations. The right upper inlay figure is a close-up of the SINFONIregion. The positions of the VLA radio sources and their respective ID numbers (Gómez et al. 2002) are marked with plus signs. Note that VLA 1represents an H ii region and is also visible in the IRAC bands. The field of view is equal to Fig. 5.
This paper is the third in a program to obtain a full NIR spec-troscopic census of the stellar content of a sample of high-massstar-forming regions by means of integral field spectroscopy us-ing VLT/SINFONI. The first paper by Bik et al. (2010) studiesthe star formation process in the high-mass star-forming regionRCW 34. A spatial distinction between class II sources insidea “bubble region” on one hand, and the H ii region, the mas-sive stars and the class 0/I sources in the molecular cloud onthe northern edge of the bubble on the other hand, suggest thatsequential star formation is at work from south to north. The sec-ond paper by Wang et al. (2011) examines star formation in theS255 complex: three regions of massive star formation at differ-ent evolutionary stages that reside in the same natal molecularcloud. It was found that the age difference between the olderlow-mass cluster and the young massive cores indicates differ-ent stellar populations in the cluster. Wang et al. (2011) proposethe triggered outside-in collapse star formation scenario for thisregion.
These earlier papers show that the interaction between theyoung massive stars and the surrounding molecular cloud couldnot only lead to the destruction of the cloud, but also to the for-mation of a younger generation of stars. Multiple generationsof newly formed stars are identified and star formation scenar-ios have been proposed in which clusters of stars could havetriggered the collapse of a pre-existing dense core in the molec-ular clouds. It seems that the interaction between stars and thesurrounding molecular cloud could lead to the formation of ayounger generation including massive stars. In a similar way,this paper studies the interplay between the cluster environmentof IRAS 06084-0611 and the embedded young stars within it.
The star-forming region IRAS 06084-0611, often referred toas GGD 12–15, is deeply embedded in the Monoceros molecu-lar cloud at a distance of 830± 50 pc (Herbst & Racine 1976).Figure 1 gives an overview of the cluster surroundings in thefirst three IRAC bands. We can distinguish the Spitzer image inroughly three regions: eastward we observe the signature of abow shock; gas flowing out of the central star colliding with theISM. In the south we observe an extended emission region show-ing (very) weak filamentary structures. But the main focus of thispaper is the dense cluster region covered by SINFONI, delimitedby the white box. In that region, active signs of star-formationhave been observed from infrared to radio wavelengths: an H iiregion, a Herbig Be star, a massive YSO, extended CO-bipolaroutflows, an H2O maser and about a dozen potential T Tauri ob-jects.
Radio observations: radio continuum observations at 3.6 and6 cm were obtained by Gómez et al. (2000, 2002) using theVery Large Array (VLA). Around the bright cometary H ii re-gion VLA 1, nine extremely compact (≤0.3′′) and faint radiosources have been found (Fig. 1). Gómez et al. (2002) estimatethat VLA 1 is excited by a B0.5 ZAMS star with a luminos-ity of ∼1.0 × 10⁴ L�. The derived spectral index for VLA 7(+0.6± 0.3) fits the stellar wind model better than other possi-bilities, supporting the idea that VLA 7 is the powering sourceof the molecular CO outflow which extends ∼6′ from SE to NW(Qin et al. 2008). The remaining radiosources show variabilityat radio wavelengths, and their spectral indices are characteristi-cally negative. It has been suggested that their emission mecha-nism could be explained by gyro-synchrotron radiation from theactive magnetospheres of T Tauri stars.
A27, page 2 of 13

K. M. Maaskant et al.: Sequential star formation in IRAS 06084-0611 (GGD 12-15)
IR observations: several infrared studies covering a rangefrom 1 to 120 μm (Bik 2004; Bik et al. 2005, 2006; Reipurth& Wamsteker 1983; Olofsson & Koornneef 1985; Harvey et al.1985; Hodapp 1994) have revealed about a dozen objects. Ithas been suggested that most of these objects are PMS clus-ter members. Mid-infrared observations at 8.7, 9.7 and 12.5 μm(Persi & Tapia 2003) revealed two objects: one identified withthe compact cometary H ii region VLA 1 (Gómez et al. 2002)and the second with the faint and unresolved radio continuumsource VLA 4. The latter has been identified as a Herbig Bestar since the IR counterpart shows large IR excess and its de-rived IR luminosity is L1−20 μm = 350 L�, indicating the pres-ence of a young massive star. The spectrum of VLA 4 between2.47 and 11.62 μm shows the presence of IR emission bands at3.3, 6.2, 7.7, 8.6 and 11.2 μm also known as Polycyclic AromaticHydrocarbon (PAH) features (Persi & Tapia 2003; Boersma et al.2009).
Molecular line observations: the most recent study of the COoutflow has been carried out by Qin et al. (2008) in which COJ = 3–2 and J = 2–1 lines are mapped. VLA7 is located cen-trally on the axis of the outflow and is a likely candidate to be thepowering source. Moreover, the origin and position of the cen-tral source powering the outflow is studied by Sato et al. (2008)using NIR imaging polarimetry and they confirm that the cen-tral object indeed seems to coincide with VLA 7. High densityHCO+ gas (Heaton et al. 1988), a H2O maser (Tofani et al. 1995)and a NH3 region (Torrelles et al. 1989) have been observed inthe center of the outflow. There are two maxima in the ammoniaregion suggesting that the structure could represent a moleculartoroid which helps to collimate the outflow.
The objective of this paper is to probe the star formationhistory of the cluster. In the next section, the spectroscopicVLT/SINFONI and supporting photometric NTT/SOFI, 2MASSand Spitzer/IRAC observations are presented. The analysis is di-vided in three parts. First, the photometric colors are presentedand an overview is given of the cluster surrounding. Second, us-ing the H- and K-band spectra, we present spectral classificationsof the high- and intermediate-mass stellar population and deter-mine their properties (e.g. extinction, age, mass). And third, theobjects are placed in a Hertzsprung Russell diagram and the clus-ter age is estimated. Finally, we provide an interpretation of theformation history of IRAS 06084-0611. The last section summa-rizes the main conclusions of the paper.
2. Observations and data reduction
2.1. Spectroscopy: VLT/SINFONI H- and K-bandobservations
Spectroscopic near-infrared H- and K-band observationswere taken using the Integral Field spectrograph SINFONI(Eisenhauer et al. 2003; Bonnet et al. 2004) on the UnitTelescope 4 (YEPUN) of the ESO Very Large Telescope atParanal, Chile (see Fig. 2a for the continuum image of the re-gion). The observations were performed in service mode onJanuary 30 and February 4, 2007. The observations were per-formed using the non-AO mode providing a 8′′ × 8′′ field ofview. The spectrograph was operated using the H+K grating pro-viding a spectral resolving power of R = 1500 in the H- and K-band in a single exposure. The observations are centered on RA=06h10m50.14s, Dec = −06◦11′36.82′′ (J2000) and cover a totalarea of 74′′ × 74′′. To cover the entire cluster we applied a map-ping pattern with 4′′ offsets in RA and 6.75′′ offsets in Dec tocover every position in the cluster at least twice with a detector
(a)
(b)
Fig. 2. VLT/SINFONI observation of IRAS 06084-0611. Top: Sinfoni2.16 μm line-map with the object identification numbers sorted by SOFIK-band brightness. The positions of evolutionary class (Lada 1987) 0/I(red asterisks), class II (blue squares) objects and VLA radio detec-tions (green stars, Gómez et al. 2002, see Fig. 1 for all their respec-tive ID numbers) are marked. We do not detect the NIR counterpart ofVLA 1 in the SINFONI data. Bottom: three-color image created fromthe SINFONI line maps with green: H2 (2.12 μm, shocked gas), blue:[Fe ii] (1.644 μm, shocked outflows) and red: Br-γ (2.16 μm, ionizedgas). Green H2 and blue [Fe ii] spots are clearly visible, suggesting thepresence of outflows and jets, respectively, and thereby tracing activestar formation. (Epoch: J2000).
integration time (DIT) of 30 s to guarantee a good S/N (∼70)for the early type stars in the cluster. The average seeing dur-ing the observations was ∼0.8′′. Furthermore, every 3 min, a skyframe was taken using the same DIT as the science observations.The sky positions were chosen based on existing NIR imagingin order to avoid contamination. Immediately after every scienceobservation, a telluric standard of B spectral type was observed,matching as closely as possible the airmass of the object. This
A27, page 3 of 13
A&A 531, A27 (2011)
star was used for the removal of the telluric absorption lines aswell as for flux calibration.
The data reduction was performed using the SPRED soft-ware package version 1.37 (Schreiber et al. 2004; Abuter et al.2006). The data reduction consists of correcting for dark, flat-field and distortion as well as reconstructing the final 3D datacubes (see Bik et al. 2010 for a detailed description). The finalreduced SINFONI data of IRAS 06084-0611 consist of 3D datacubes with two spatial (x − y) dimensions and a third dimensionencompassing the H- and K-band (1.4–2.45 μ) spectra for eachindividual pixel. The VLT/SINFONI line + continuum image isshown on Fig. 2b.
2.2. Photometry: Spitzer/IRAC, 2MASS and NTT/SOFIobservations
Complementary basic calibration archival Spitzer/IRAC data(Fazio et al. 2004) are used to study the region as well as itssurroundings at longer wavelengths. The IRAC data coveringIRAS 06084-0611 (PID: 6, PI: Fazio) were processed using thestandard pipeline version S14.0.0. The data were downloadedfrom the archive and processed using the MOPEX software ver-sion 16.2.1 (Makovoz et al. 2006). Spitzer/IRAC photometryof IRAS 06084-0611 has previously been studied in Gutermuthet al. (2009).
Using IRAF, photometry was applied with an aperture of1.5 × FWHM (with a FWHM ∼ 1.7 pixels for all bands), a skyannulus of 3.5 × FWHM and an annulus width of 2.5 × FWHM.To obtain the magnitudes of the objects, the appropriate aperturecorrections and zeropoints were adopted from the Spitzer/IRACwebsite.
Additionally, 2MASS (Skrutskie et al. 2006) data was usedin which detections of poor data quality were discarded as wellas SOFI data taken from Bik (2004), which covers a 5′ × 5′ fieldaround IRAS 06084-0611 using narrow-band continuum filtersin J and K. An advantage of narrow-band filters is that the ob-servations are better representatives of the stellar continuum fluxin the J- and K-band as they were chosen not to include emis-sion lines. The J-band continuum is centered on 1.215 μ, with awidth of 0.018 μm and the K-band is centered on 2.09 μm with awidth of 0.02 μm. For comparison with 2MASS broadband pho-tometry and isochrone colors of standard main sequence stars,a correction was applied to address the observed differences be-tween narrow-band and broad-band filters (Bik 2004) Finally,when a SINFONI source coincides in position within 1.25′′ witha 2MASS, SOFI or IRAC source the detections were matched.The matching procedure connected 39 objects with SOFI andSINFONI detections, and available 2MASS and IRAC photom-etry was added. The object IDs are ordered by SOFI K-bandbrightness. The magnitudes of objects located in the SINFONIfield of view are listed in Table 1.
3. Cluster surroundings
In this section we present the Color Magnitude Diagrams(CMDs) based on SOFI, 2MASS (Fig. 3) and IRAC (Fig. 4) pho-tometry to trace stellar properties like temperature, spectral type,reddening and accordingly, the evolutionary stage.
(a)
(b)
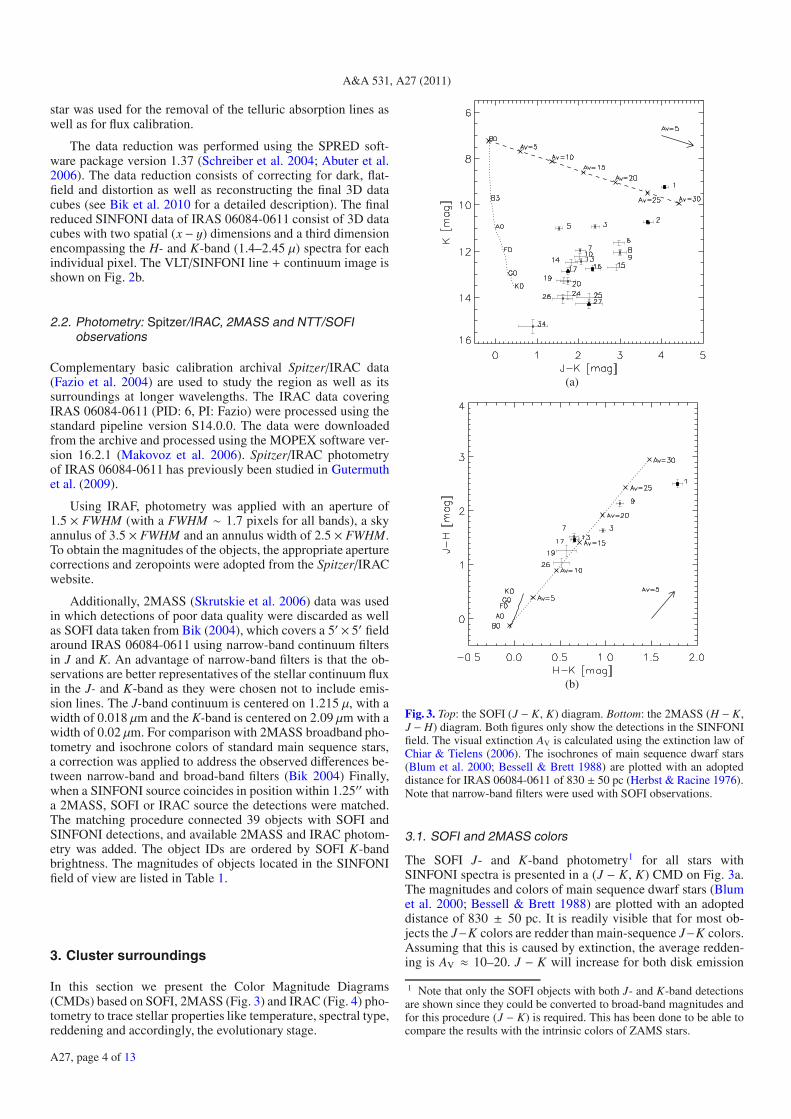
Fig. 3. Top: the SOFI (J − K, K) diagram. Bottom: the 2MASS (H − K,J − H) diagram. Both figures only show the detections in the SINFONIfield. The visual extinction AV is calculated using the extinction law ofChiar & Tielens (2006). The isochrones of main sequence dwarf stars(Blum et al. 2000; Bessell & Brett 1988) are plotted with an adopteddistance for IRAS 06084-0611 of 830 ± 50 pc (Herbst & Racine 1976).Note that narrow-band filters were used with SOFI observations.
3.1. SOFI and 2MASS colors
The SOFI J- and K-band photometry1 for all stars withSINFONI spectra is presented in a (J − K, K) CMD on Fig. 3a.The magnitudes and colors of main sequence dwarf stars (Blumet al. 2000; Bessell & Brett 1988) are plotted with an adopteddistance of 830 ± 50 pc. It is readily visible that for most ob-jects the J−K colors are redder than main-sequence J−K colors.Assuming that this is caused by extinction, the average redden-ing is AV ≈ 10–20. J − K will increase for both disk emission
1 Note that only the SOFI objects with both J- and K-band detectionsare shown since they could be converted to broad-band magnitudes andfor this procedure (J − K) is required. This has been done to be able tocompare the results with the intrinsic colors of ZAMS stars.
A27, page 4 of 13

K. M. Maaskant et al.: Sequential star formation in IRAS 06084-0611 (GGD 12-15)
Table 1. Photometric properties of objects located in the SINFONI field of view.
NTT/SOFI 2MASS Spitzer/IRACObject J K J H K band 1 band 2 band 3 band 4# [1.25 μm] [2.16 μm] [1.25 μm] [1.65 μm] [2.16 μm] [3.6 μm] [4.5 μm] [5.8 μm] [8.0 μm]VLA1 . . . . . . . . . . . . . . . 9.95± 0.05 8.67± 0.05 5.91± 0.10 4.49± 0.101 14.02 ± 0.08 9.33 ± 0.01 13.61 ± 0.06 11.11 ± 0.04 9.33 ± 0.02 7.56 ± 0.00 6.80 ± 0.00 6.26 ± 0.00 5.52 ± 0.012 15.06 ± 0.13 10.83 ± 0.03 . . . . . . . . . 8.05 ± 0.01 7.61 ± 0.02 4.94 ± 0.01 3.81 ± 0.023 13.73 ± 0.07 10.97 ± 0.03 13.60 ± 0.03 11.96 ± 0.03 10.99 ± 0.02 9.63 ± 0.02 8.79 ± 0.02 8.04 ± 0.06 7.12 ± 0.084 . . . 10.98 ± 0.03 . . . 13.19 ± 0.05 10.73 ± 0.05 8.61 ± 0.00 7.74 ± 0.00 7.09 ± 0.01 6.59 ± 0.025 12.79 ± 0.05 11.01 ± 0.03 12.67 ± 0.04 . . . . . . 9.75 ± 0.04 9.56 ± 0.08 . . . . . .6 15.10 ± 0.14 11.69 ± 0.04 14.76 ± 0.05 . . . 11.61 ± 0.05 9.48 ± 0.04 . . . . . . . . .7 14.34 ± 0.10 11.99 ± 0.05 14.30 ± 0.04 12.78 ± 0.04 12.12 ± 0.04 11.85 ± 0.06 11.89 ± 0.12 . . . . . .8 15.55 ± 0.17 12.11 ± 0.05 . . . . . . 12.17 ± 0.04 10.18 ± 0.01 . . . . . . . . .9 15.57 ± 0.17 12.12 ± 0.05 15.39 ± 0.04 13.26 ± 0.04 12.10 ± 0.02 10.72 ± 0.01 10.08 ± 0.01 9.50 ± 0.03 8.60 ± 0.0310 14.59 ± 0.11 12.25 ± 0.05 . . . . . . 12.41 ± 0.06 11.38 ± 0.04 . . . . . . . . .11 . . . 12.26 ± 0.05 . . . 14.27 ± 0.15 11.87 ± 0.06 9.69 ± 0.03 8.78 ± 0.04 7.07 ± 0.06 . . .12 . . . 12.40 ± 0.06 . . . 13.99 ± 0.11 12.17 ± 0.05 10.28 ± 0.01 9.49 ± 0.01 8.55 ± 0.02 . . .13 14.84 ± 0.12 12.46 ± 0.06 14.86 ± 0.04 13.40 ± 0.03 12.74 ± 0.03 12.00 ± 0.02 11.70 ± 0.04 11.40 ± 0.09 10.49 ± 0.0514 14.62 ± 0.11 12.50 ± 0.06 . . . . . . . . . . . . . . . . . . . . .15 16.11 ± 0.22 12.76 ± 0.07 . . . 14.00 ± 0.03 12.95 ± 0.03 11.39 ± 0.02 10.74 ± 0.02 10.21 ± 0.06 9.45 ± 0.0516 15.49 ± 0.17 12.79 ± 0.07 . . . . . . . . . . . . . . . . . . . . .17 14.89 ± 0.12 12.87 ± 0.07 15.32 ± 0.04 13.84 ± 0.03 13.18 ± 0.04 11.83 ± 0.04 11.44 ± 0.06 10.62 ± 0.10 9.58 ± 0.0818 . . . 13.24 ± 0.00 . . . . . . 13.01 ± 0.04 10.84 ± 0.01 9.91 ± 0.01 9.25 ± 0.03 8.61 ± 0.0219 15.18 ± 0.14 13.27 ± 0.09 15.12 ± 0.06 13.86 ± 0.08 13.29 ± 0.07 12.40 ± 0.08 . . . . . . . . .20 15.33 ± 0.15 13.31 ± 0.09 . . . . . . . . . . . . . . . . . . . . .21 . . . 13.36 ± 0.09 . . . 14.70 ± 0.07 13.02 ± 0.06 10.26 ± 0.04 8.99 ± 0.05 6.43 ± 0.05 . . .22 . . . 13.50 ± 0.10 . . . . . . 12.94 ± 0.06 11.20 ± 0.04 9.76 ± 0.02 8.63 ± 0.02 7.57 ± 0.0223 . . . 13.88 ± 0.10 . . . . . . 13.57 ± 0.06 11.89 ± 0.08 11.18 ± 0.10 9.79 ± 0.15 . . .24 15.95 ± 0.20 13.93 ± 0.12 . . . 14.66 ± 0.04 14.06 ± 0.06 13.29 ± 0.07 12.99 ± 0.13 12.36 ± 0.29 . . .25 16.63 ± 0.31 14.03 ± 0.13 . . . . . . . . . . . . . . . . . . . . .26 15.95 ± 0.20 14.06 ± 0.12 15.80 ± 0.06 14.76 ± 0.05 14.24 ± 0.07 13.91 ± 0.07 13.64 ± 0.11 . . . . . .27 16.90 ± 0.33 14.30 ± 0.14 . . . 15.07 ± 0.07 14.09 ± 0.06 12.62 ± 0.05 12.64 ± 0.12 . . . . . .28 . . . 14.44 ± 0.15 . . . . . . . . . 12.82 ± 0.18 12.45 ± 0.20 . . . . . .29 . . . 14.48 ± 0.15 . . . . . . . . . 12.19 ± 0.07 11.22 ± 0.07 9.24 ± 0.19 8.11 ± 0.3230 . . . 14.49 ± 0.16 . . . . . . 13.46 ± 0.08 9.95 ± 0.01 8.15 ± 0.00 6.84 ± 0.01 . . .31 . . . 14.52 ± 0.18 . . . . . . . . . 12.13 ± 0.03 11.41 ± 0.02 . . . 9.53 ± 0.0732 . . . 14.60 ± 0.19 . . . . . . . . . 12.69 ± 0.14 11.51 ± 0.09 11.03 ± 0.28 . . .33 . . . 14.65 ± 0.20 . . . . . . . . . . . . . . . . . . 4.96 ± 0.0534 16.32 ± 0.25 15.22 ± 0.22 . . . . . . . . . . . . . . . . . . . . .35 . . . 15.59 ± 0.24 . . . . . . . . . . . . . . . . . . . . .36 . . . 15.62 ± 0.25 . . . . . . . . . . . . . . . . . . . . .37 . . . 15.70 ± 0.25 . . . . . . . . . 13.40 ± 0.10 12.46 ± 0.07 12.46 ± 0.37 . . .38 . . . 15.85 ± 0.26 . . . . . . . . . . . . . . . . . . . . .39 . . . 16.53 ± 0.28 . . . . . . . . . 13.37 ± 0.14 11.96 ± 0.06 11.14 ± 0.15 10.47 ± 0.24
and extinction, so disentangling these effects is still a problem,even when the intrinsic stellar color (i.e. spectral type) is known.
The 2MASS J − K, H − K color–color diagram for all starswith SINFONI spectra is shown in Fig. 3b. The average extinc-tion is again AV ≈ 10–20. From this diagram we can attemptto discern extinction from IR excess. Most objects are alignedclose to the dashed extinction line which shows that the bulk ofthe emission in the J-, H- and K-band originate from their stellarphotospheres. Additionally, the fact that we see absorption linesin their H- and K-band spectra also suggests that the disk con-tribution is low (See Sect. 4). All but objects 17 and 19 do havesignificant IR excess in their IRAC bands indicating that thereis no clear evidence of disk emission until λ > 2.5 μm for theseobjects.
3.2. Extinction map
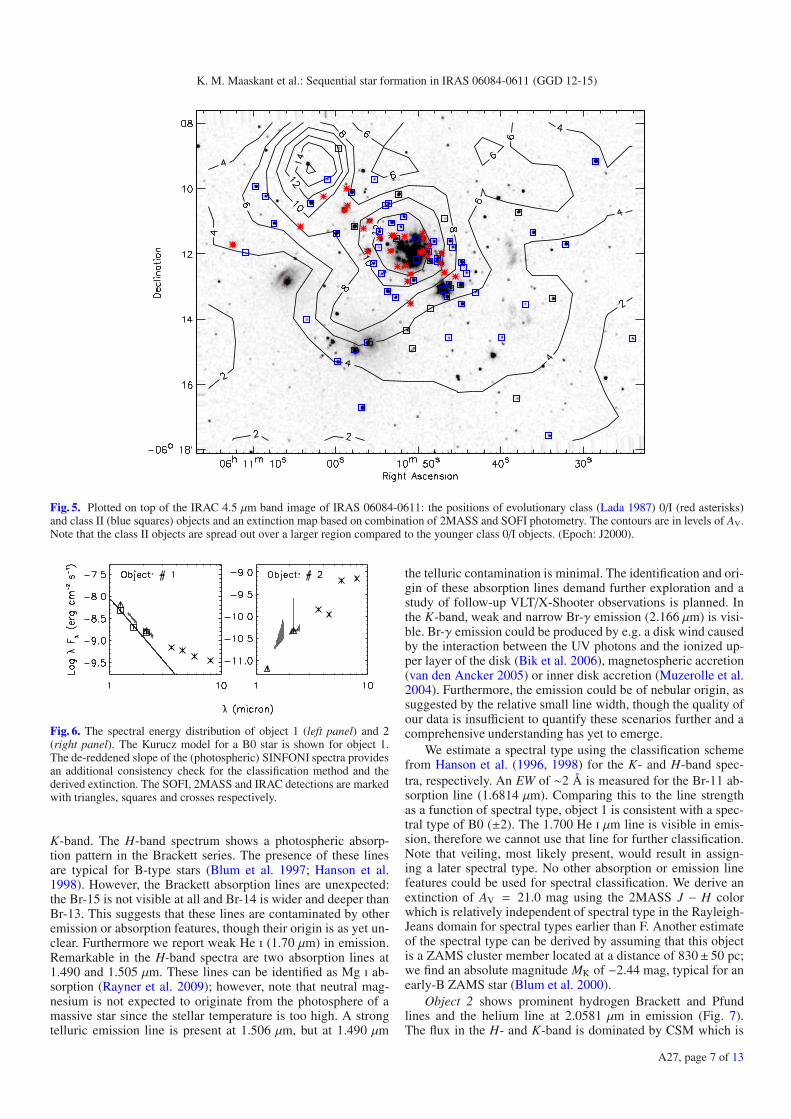
A large extinction map of the cluster surroundings as shownin Fig. 5 has been constructed by a combination of 2MASSand SOFI photometry. This map shows the extinction in visual
magnitudes and has a resolution of 1.5′. The extinction mappingmethod is explained in Lombardi & Alves (2001).
There are two extinction blobs in the region, one is centeredon the cluster region covered by SINFONI, the other extinctionblob falls ∼4′ north east of that. We can see that star formationin the northern blob (if any) is not as evolved as in the south-ern blob. Most of the class 0/I sources seem to be concentratedin the southern extinction blob where also the extinction is rel-atively high. The young high mass stars are also found in thisregion. The class II objects are spread out over a larger region.This result is in agreement with the IRAC study of Gutermuthet al. (2009). An average extinction of AV ∼ 12 mag in theSINFONI field as derived from the extinction map seems to beconsistent with the average extinction found in the previous sec-tion (Figs. 3a and b).
3.3. Spitzer colors
Figure 4 presents the color–color diagrams of the IRAC detec-tions in the SINFONI-field. Note that not all objects detected
A27, page 5 of 13
A&A 531, A27 (2011)
(a)
(b)
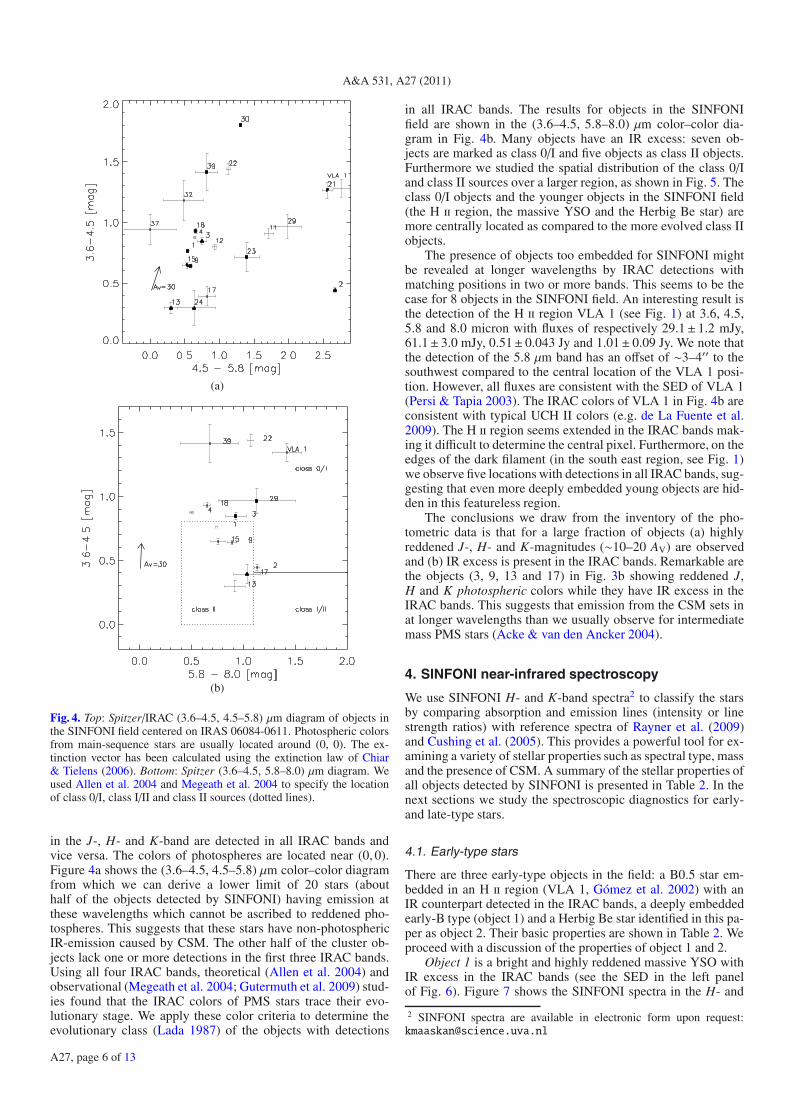
Fig. 4. Top: Spitzer/IRAC (3.6–4.5, 4.5–5.8) μm diagram of objects inthe SINFONI field centered on IRAS 06084-0611. Photospheric colorsfrom main-sequence stars are usually located around (0, 0). The ex-tinction vector has been calculated using the extinction law of Chiar& Tielens (2006). Bottom: Spitzer (3.6–4.5, 5.8–8.0) μm diagram. Weused Allen et al. 2004 and Megeath et al. 2004 to specify the locationof class 0/I, class I/II and class II sources (dotted lines).
in the J-, H- and K-band are detected in all IRAC bands andvice versa. The colors of photospheres are located near (0, 0).Figure 4a shows the (3.6–4.5, 4.5–5.8) μm color–color diagramfrom which we can derive a lower limit of 20 stars (abouthalf of the objects detected by SINFONI) having emission atthese wavelengths which cannot be ascribed to reddened pho-tospheres. This suggests that these stars have non-photosphericIR-emission caused by CSM. The other half of the cluster ob-jects lack one or more detections in the first three IRAC bands.Using all four IRAC bands, theoretical (Allen et al. 2004) andobservational (Megeath et al. 2004; Gutermuth et al. 2009) stud-ies found that the IRAC colors of PMS stars trace their evo-lutionary stage. We apply these color criteria to determine theevolutionary class (Lada 1987) of the objects with detections
in all IRAC bands. The results for objects in the SINFONIfield are shown in the (3.6–4.5, 5.8–8.0) μm color–color dia-gram in Fig. 4b. Many objects have an IR excess: seven ob-jects are marked as class 0/I and five objects as class II objects.Furthermore we studied the spatial distribution of the class 0/Iand class II sources over a larger region, as shown in Fig. 5. Theclass 0/I objects and the younger objects in the SINFONI field(the H ii region, the massive YSO and the Herbig Be star) aremore centrally located as compared to the more evolved class IIobjects.
The presence of objects too embedded for SINFONI mightbe revealed at longer wavelengths by IRAC detections withmatching positions in two or more bands. This seems to be thecase for 8 objects in the SINFONI field. An interesting result isthe detection of the H ii region VLA 1 (see Fig. 1) at 3.6, 4.5,5.8 and 8.0 micron with fluxes of respectively 29.1± 1.2 mJy,61.1± 3.0 mJy, 0.51± 0.043 Jy and 1.01± 0.09 Jy. We note thatthe detection of the 5.8 μm band has an offset of ∼3–4′′ to thesouthwest compared to the central location of the VLA 1 posi-tion. However, all fluxes are consistent with the SED of VLA 1(Persi & Tapia 2003). The IRAC colors of VLA 1 in Fig. 4b areconsistent with typical UCH II colors (e.g. de La Fuente et al.2009). The H ii region seems extended in the IRAC bands mak-ing it difficult to determine the central pixel. Furthermore, on theedges of the dark filament (in the south east region, see Fig. 1)we observe five locations with detections in all IRAC bands, sug-gesting that even more deeply embedded young objects are hid-den in this featureless region.
The conclusions we draw from the inventory of the pho-tometric data is that for a large fraction of objects (a) highlyreddened J-, H- and K-magnitudes (∼10–20 AV) are observedand (b) IR excess is present in the IRAC bands. Remarkable arethe objects (3, 9, 13 and 17) in Fig. 3b showing reddened J,H and K photospheric colors while they have IR excess in theIRAC bands. This suggests that emission from the CSM sets inat longer wavelengths than we usually observe for intermediatemass PMS stars (Acke & van den Ancker 2004).
4. SINFONI near-infrared spectroscopy
We use SINFONI H- and K-band spectra2 to classify the starsby comparing absorption and emission lines (intensity or linestrength ratios) with reference spectra of Rayner et al. (2009)and Cushing et al. (2005). This provides a powerful tool for ex-amining a variety of stellar properties such as spectral type, massand the presence of CSM. A summary of the stellar properties ofall objects detected by SINFONI is presented in Table 2. In thenext sections we study the spectroscopic diagnostics for early-and late-type stars.
4.1. Early-type stars
There are three early-type objects in the field: a B0.5 star em-bedded in an H ii region (VLA 1, Gómez et al. 2002) with anIR counterpart detected in the IRAC bands, a deeply embeddedearly-B type (object 1) and a Herbig Be star identified in this pa-per as object 2. Their basic properties are shown in Table 2. Weproceed with a discussion of the properties of object 1 and 2.
Object 1 is a bright and highly reddened massive YSO withIR excess in the IRAC bands (see the SED in the left panelof Fig. 6). Figure 7 shows the SINFONI spectra in the H- and
2 SINFONI spectra are available in electronic form upon request:[email protected]
A27, page 6 of 13
K. M. Maaskant et al.: Sequential star formation in IRAS 06084-0611 (GGD 12-15)
Fig. 5. Plotted on top of the IRAC 4.5 μm band image of IRAS 06084-0611: the positions of evolutionary class (Lada 1987) 0/I (red asterisks)and class II (blue squares) objects and an extinction map based on combination of 2MASS and SOFI photometry. The contours are in levels of AV.Note that the class II objects are spread out over a larger region compared to the younger class 0/I objects. (Epoch: J2000).
Fig. 6. The spectral energy distribution of object 1 (left panel) and 2(right panel). The Kurucz model for a B0 star is shown for object 1.The de-reddened slope of the (photospheric) SINFONI spectra providesan additional consistency check for the classification method and thederived extinction. The SOFI, 2MASS and IRAC detections are markedwith triangles, squares and crosses respectively.
K-band. The H-band spectrum shows a photospheric absorp-tion pattern in the Brackett series. The presence of these linesare typical for B-type stars (Blum et al. 1997; Hanson et al.1998). However, the Brackett absorption lines are unexpected:the Br-15 is not visible at all and Br-14 is wider and deeper thanBr-13. This suggests that these lines are contaminated by otheremission or absorption features, though their origin is as yet un-clear. Furthermore we report weak He i (1.70 μm) in emission.Remarkable in the H-band spectra are two absorption lines at1.490 and 1.505 μm. These lines can be identified as Mg i ab-sorption (Rayner et al. 2009); however, note that neutral mag-nesium is not expected to originate from the photosphere of amassive star since the stellar temperature is too high. A strongtelluric emission line is present at 1.506 μm, but at 1.490 μm
the telluric contamination is minimal. The identification and ori-gin of these absorption lines demand further exploration and astudy of follow-up VLT/X-Shooter observations is planned. Inthe K-band, weak and narrow Br-γ emission (2.166 μm) is visi-ble. Br-γ emission could be produced by e.g. a disk wind causedby the interaction between the UV photons and the ionized up-per layer of the disk (Bik et al. 2006), magnetospheric accretion(van den Ancker 2005) or inner disk accretion (Muzerolle et al.2004). Furthermore, the emission could be of nebular origin, assuggested by the relative small line width, though the quality ofour data is insufficient to quantify these scenarios further and acomprehensive understanding has yet to emerge.
We estimate a spectral type using the classification schemefrom Hanson et al. (1996, 1998) for the K- and H-band spec-tra, respectively. An EW of ∼2 Å is measured for the Br-11 ab-sorption line (1.6814 μm). Comparing this to the line strengthas a function of spectral type, object 1 is consistent with a spec-tral type of B0 (±2). The 1.700 He i μm line is visible in emis-sion, therefore we cannot use that line for further classification.Note that veiling, most likely present, would result in assign-ing a later spectral type. No other absorption or emission linefeatures could be used for spectral classification. We derive anextinction of AV = 21.0 mag using the 2MASS J − H colorwhich is relatively independent of spectral type in the Rayleigh-Jeans domain for spectral types earlier than F. Another estimateof the spectral type can be derived by assuming that this objectis a ZAMS cluster member located at a distance of 830± 50 pc;we find an absolute magnitude MK of −2.44 mag, typical for anearly-B ZAMS star (Blum et al. 2000).
Object 2 shows prominent hydrogen Brackett and Pfundlines and the helium line at 2.0581 μm in emission (Fig. 7).The flux in the H- and K-band is dominated by CSM which is
A27, page 7 of 13

A&A 531, A27 (2011)
Table 2. Properties of objects located in the SINFONI field of view.
(J2000) Available photometric data Objects properties clusterObject # RA (h m s) Dec (◦ ′ ′′) SOFI 2MASS IRAC Radio Sp. Typea Luma IRex
b classc Teffd AV
e R� f memberVLA1 6 10 50.50 −6 11 51.4 . . . . . . 1243 VLA1 HII region† . . . + . . . . . . . . . . . . +
1 6 10 50.40 −6 11 19.3 JK JHK 1234 . . . early-B V + II 27700± 5000 21.0± 0.16 5.0± 0.29 +
2 6 10 50.31 −6 11 57.6 JK . . . 1234 VLA 4 Herbig Be†† . . . + 0 / I . . . . . . . . . +
3 6 10 49.81 −6 11 45.0 JK JHK 1234 . . . G0 - G3 V + 0 / I 5950± 500 10.9± 0.17 4.2± 0.25 +
4 6 10 49.45 −6 11 42.0 K HK 1234 VLA 2 . . . . . . + 0 / I . . . . . . . . . +5 6 10 50.50 −6 12 04.4 JK JK 1 . . . K1 - K2 IV . . . . . . 5000± 350 4.7± 0.52 3.4± 0.21 . . .6 6 10 50.68 −6 11 55.1 JK JK 1 . . . K2 IV + . . . 4900± 350 12.9± 0.25 3.7± 0.27 +
7 6 10 49.21 −6 11 30.2 JK JHK 12 VLA 8 K1 IV no . . . 5100± 350 8.2± 0.45 2.3± 0.14 +8 6 10 52.52 −6 11 35.0 JK K 1 . . . K0 - K2 IV + . . . 5100± 350 12.5± 0.80 2.9± 0.18 +
9 6 10 48.63 −6 12 00.4 JK JHK 1234 . . . G8 - K0 IV + II 5400± 350 13.6± 0.74 3.0± 0.18 +
10 6 10 49.65 −6 11 22.1 JK K 1 . . . K1 IV . . . . . . 5100± 350 7.5± 0.45 2.1± 0.12 . . .11 6 10 50.82 −6 11 39.6 K HK 123 . . . . . . . . . + . . . . . . . . . . . . +12 6 10 50.61 −6 11 35.0 K HK 123 . . . . . . . . . + . . . . . . . . . . . . +
13 6 10 48.18 −6 11 25.7 JK JHK 1234 . . . K1 V + II 5100± 350 8.3± 0.20 1.9± 0.11 +
14 6 10 50.39 −6 11 55.3 JK . . . . . . . . . M4 V . . . . . . 3350± 350 4.9± 0.42 2.4± 0.15 no15 6 10 47.74 −6 12 00.9 JK HK 1234 . . . K5 IV + II 4350± 250 13.7± 0.61 2.3± 0.13 +16 6 10 50.28 −6 12 05.6 JK . . . . . . . . . K5 IV . . . . . . 4350± 250 7.8± 0.61 2.3± 0.13 . . .17 6 10 48.82 −6 11 43.8 JK JHK 1234 . . . K1 IV + II 5100± 250 7.8± 0.45 1.4± 0.08 +
18 6 10 48.78 −6 11 32.6 K K 1234 . . . . . . . . . + 0 / I . . . . . . . . . +19 6 10 49.64 −6 11 15.3 JK JHK 1 . . . K1 IV . . . . . . 5100± 350 6.2± 0.45 1.2± 0.07 +
20 6 10 50.12 −6 11 59.0 JK . . . . . . . . . . . . . . . . . . . . . . . . . . . . . . +
21 6 10 50.76 −6 11 44.9 K HK 123 . . . K3 - K4 IV + . . . 4650± 350 23.9± 0.24 2.1± 0.13 +
22 6 10 49.44 −6 11 20.6 K K 1234 . . . . . . . . . + 0 / I . . . . . . . . . +23 6 10 51.49 −6 11 35.0 K HK 123 . . . . . . . . . + . . . . . . . . . . . . +
24 6 10 48.02 −6 11 42.8 JK HK 123 . . . . . . . . . + . . . . . . . . . . . . +
25 6 10 50.16 −6 11 55.0 JK . . . . . . . . . . . . . . . . . . . . . . . . . . . . . . +26 6 10 48.15 −6 11 06.6 JK JHK 12 . . . . . . . . . . . . . . . . . . . . . . . . . . .27 6 10 52.01 −6 12 12.3 JK HK 12 . . . . . . . . . . . . . . . . . . . . . . . . . . .28 6 10 51.10 −6 11 25.3 K HK 12 . . . . . . . . . . . . . . . . . . . . . . . . . . .29 6 10 51.64 −6 12 07.8 K K 1234 . . . . . . . . . + 0 / I . . . . . . . . . +30 6 10 52.35 −6 11 32.1 K K 123 VLA 7 . . . . . . + . . . . . . . . . . . . +
31 6 10 48.43 −6 12 03.9 K HK 124 . . . . . . . . . . . . . . . . . . . . . . . . +
32 6 10 51.55 −6 11 26.4 K K 123 . . . . . . . . . + . . . . . . . . . . . . . . .33 6 10 50.75 −6 11 42.0 K . . . 4 VLA 6 . . . . . . . . . . . . . . . . . . . . . +
34 6 10 52.23 −6 11 25.2 JK . . . . . . . . . . . . . . . . . . . . . . . . . . . . . . . . .35 6 10 50.54 −6 11 19.0 K . . . . . . . . . . . . . . . . . . . . . . . . . . . . . . . . .36 6 10 50.98 −6 11 38.3 K . . . . . . . . . . . . . . . . . . . . . . . . . . . . . . . . .37 6 10 47.90 −6 11 47.9 K . . . 123 . . . . . . . . . + . . . . . . . . . . . . +
38 6 10 49.31 −6 11 46.3 K . . . . . . . . . . . . . . . . . . . . . . . . . . . . . . . . .39 6 10 51.80 −6 11 16.3 K . . . 1234 . . . . . . . . . + 0 / I . . . . . . . . . +
Notes. (a) Based on spectral comparison with reference spectra from Rayner et al. (2009). (b) IR excess based on 2MASS, SOFI and IRACphotometry compared to Kurucz models (Kurucz 1993) and IRAC color criteria as described in Sect. 3.3. (c) Evolutionary class (Lada 1987)derived from the IRAC colors as defined by Megeath et al. (2004). (d) Temperature from Kenyon & Hartmann (1995), averaged between thespectral type range. (e) AV derived using intrinsic colors of Koornneef (1983). ( f ) Result of fitting with Kurucz (Kurucz 1993) model. A distance of830± 50 pc is assumed (Herbst & Racine 1976). † Based on radio continuum flux Gómez et al. (2002) estimate the ionizing object to be of spectraltype B0.5. †† Based on the infrared luminosity Persi & Tapia (2003) estimate the presence of a very young star somewhat later than B3.
irradiated by the central object and hence produces the abun-dant emission lines. We identify Fe ii (1.688 μm) and [Fe ii](1.664 μm) emission lines. Strong PAH features at 8.6, 11.2 and12.7 μm are present (Persi & Tapia 2003; Boersma et al. 2009).The peculiar shape of the SED at IRAC wavelengths (see theright panel on Fig. 6) might be explained by such strong dustfeatures. Object 2 has a radio counterpart (VLA 4) which showstime variability and has a negative spectral index. Persi & Tapia(2003) studied the IR energy distribution (assuming a distanceof 1 kpc) and obtained a luminosity consistent with the presenceof a very young star somewhat later than B3. However, the He i1.70 μm recombination emission line suggests a spectral typeearlier than B2.5V (Clark & Steele 2000).
4.2. Late-type stars
For the spectral classification of low-mass stars, the SINFONIspectra were visually compared with reference spectra from the
spectral library of Rayner et al. (2009) and Cushing et al. (2005).In this way, the spectral types of 14 stars were determined in arange from early G to mid-K with generally an uncertainty of∼1–2 in subclass. Spectra dominated by CSM or too low S/Ncould not be classified. Figures 8 and 9 show the SINFONI H-and K-band spectra for all the objects in the field. Table 2 showsthe results of the spectral classification for these objects.
The temperature of the classified objects is derived usingthe spectral type to temperature relation of Kenyon & Hartmann(1995). It has been found by Cohen & Kuhi (1979) that the tem-perature of PMS stars might be overestimated and translate tonon-systematic errors, resulting in an error of about 500 K forG stars and about 200 K for late K-type stars. This uncertaintyintroduces the dominant source of error.
Important absorption lines for the temperature determinationof low-mass stars are neutral metal absorption features. Mg i(1.50, 1.53 and 1.71 μm) shows a gradual variation as a func-tion of spectral type: these lines are strongest in K and early
A27, page 8 of 13

K. M. Maaskant et al.: Sequential star formation in IRAS 06084-0611 (GGD 12-15)
Fig. 7. Normalized SINFONI H- and K-band spectra of the two brightest stars detected in IRAS 06084-0611. The spectrum of object 1 is charac-terized by absorption lines of the hydrogen Brackett series. The spectrum of object 2 shows numerous hydrogen lines in emission of which Brγ(2.166 μm) is the most prominent. The spectra of the other objects in the field are shown in Figs. 8 and 9.
M dwarfs. The Ca i (2.26 μm) triplet absorption line is presentin early M, K and G stars and weakens in the late-M spectraltypes. The Na i doublet (2.20 μm) becomes visible in early Gstars and is strongest in mid- to late-type M dwarfs. CO over-tone bands in the K-band (∼2.29–2.5 μm) are strongest in super-giants and become progressively weaker with decreasing lumi-nosity. Therefore, they provide good surface gravity indicatorssince PMS stars have lower surface gravities while evolving tothe main sequence. CO overtone bands can also be observed inemission. In that case they are most likely originating from a cir-cumstellar disk in combination with a stellar wind (e.g. Chandleret al. 1995; Bik & Thi 2004; Wheelwright et al. 2010). This isobserved in the YSO object 22 (Fig. 9).
Visual extinctions have been derived by comparison of SOFIand 2MASS colors to the intrinsic giant and dwarf colors ofKoornneef (1983) and using the extinction law of Cardelli et al.(1989) to be able to express the extinction in AV. For spectrawith luminosity class IV, the extinction has been derived fromthe average of the giant and dwarf colors of Koornneef (1983).
A representative Kurucz model and de-reddened SINFONIspectra have been over-plotted for objects with known spectraltype (e.g. for object 1 in Fig. 6). The slope of the de-reddenedSINFONI spectrum provides an additional consistency check forthe classification method: the spectral type is consistent withthe derived extinction if the de-reddened photospheric SINFONIspectrum fits the Kurucz model and the de-reddened photometry.Most de-reddened objects show a good fit which implies that theextinction has been correctly estimated.
4.3. Cluster membership
To confirm the cluster membership of the objects, we looked forthe following characteristics: (a) highly reddened photometry;(b) IR-excess in the IRAC bands; (c) evidence of jets/ouflows byH2 and [Fe ii] emission associated with the object and (d) thepresence of a radio (VLA) counterpart. In this way we identified28 objects as cluster members. We could not confirm the cluster
membership of 10 objects. Object 14 is excluded as a clustermember, since the spectral type is too late for its brightness. It istherefore marked as a foreground star.
4.4. Jets and outflows
We use the green H2 and blue [Fe ii] line maps (Fig. 2b) to searchfor emission blobs in the field that trace star formation activity.H2 emission can be related to outflows since thermal H2 emis-sion in the near-IR can originate from shocked neutral gas be-ing heated up to a few 1000 K. Alternatively, non-thermal emis-sion can be caused by fluorescence of non-ionizing UV photons.These mechanisms can be distinguished as they populate differ-ent energy levels and thus produce different line ratios (see Biket al. 2010; Wang et al. 2011 for discussions of these mecha-nisms for RCW 34 and the S255 complex). For the three north-ern H2 emission blobs in IRAS 06084-0611, the outflow naturehas been confirmed making use of hydrogen emission line ra-tios (Puga et al. 2008). The morphology of the emitting regions(compact blobs) would suggest an outflow nature, the fluores-cence emission is usually diffuse and extended. Another tracerof active star formation is [Fe ii] emission, often observed in starforming regions associated with shocked gas from jets and out-flows or photon dominated regions.
H2 and a few [Fe ii] emission regions are spread out over thecluster (Fig. 2b). H2 emission blobs are found near object 3, 4and 30 and might they trace outflows from these objects. For theother half we find emission regions lacking central objects; theycould be too deeply embedded or are Photon Dominated Regions(PDRs) excited by the UV radiation from these objects.
Our observations identify object 30 as the IR counterpart ofthe thermal non-variable radio source VLA 7, the suggested cen-tral object powering the massive CO outflow. Recall that VLA 7is the suggested central object powering the massive CO out-flow that extends ∼6′ from SE to NW (Sect. 1). The SINFONIK-band spectrum of this object shows strong H2 emission lines
A27, page 9 of 13

A&A 531, A27 (2011)
Fig. 8. Normalized SINFONI H-band (left) and K-band (right) spectra of the first 21 objects. For most of these objects we were able to derive thespectral type (Table 2). The location of some of the absorption lines used for the classification of the stars are shown by the vertical dashed lines.The combination of Mg i , Na i and Ca i absorption lines proved to be the best temperature tracers. The width of the CO lines in the K-band givesan indication of the luminosity class.
(see Fig. 9) and the IRAC detection in the first three bands showshighly reddened colors, suggesting the presence of a protostar.
5. Stellar population: content and age
In this section we discuss the global properties of the stellar con-tent in more detail. We present the Hertzsprung-Russell (HR)diagram and compare the observed parameters with PMS evolu-tionary tracks.
The HR diagram of IRAS 06084-0611 is shown in Fig. 10.Over-plotted are the ZAMS-isochrone from Blum et al. (2000),isochrones (upper panel) between 0.1 and 10 Myr and PMS evo-lutionary tracks (lower panel) from 1 up to 5 M�. The latterisochrones have been taken from Da Rio et al. (2009) calculatedfrom the Siess et al. (2000) evolutionary models. An estimateof the average age of the cluster provides more insight into thecluster history. Furthermore, comparison of the positions in theHR diagram to the evolutionary tracks provides information onthe mass of the classified stars.
For the derivation of the absolute magnitude, a distance of830± 50 pc (Herbst & Racine 1976) was adopted and the ob-jects have been corrected for foreground extinction. For all ob-jects, the uncertainty of the absolute magnitude has been de-rived taking into account four effects: the first and second arethe photometric and distance uncertainty. The third is a conse-quence of the uncertainty in extinction which is a reflection ofthe uncertainty of the spectral type and the variation of redden-ing between the different photometric colors (see Table 2). Thefourth is the uncertainty in distance of the cluster. For all objects,the first three sources of uncertainty are typically a few percentwhile the latter translates to a dominant source of uncertainty of±0.13 mag.
The assumption that all the objects have the same distancemight be incorrect if the cluster is extended along the line ofsight (i.e. if the group of younger class 0/I objects and the groupof class II sources have different distances). In this study we as-sume the stars to be equidistant.
We find that most objects lie on the evolutionary tracksof ∼1.5–2.5 M� stars (Fig. 10b) and thus the majority are
A27, page 10 of 13

K. M. Maaskant et al.: Sequential star formation in IRAS 06084-0611 (GGD 12-15)
Fig. 9. Normalized SINFONI H-band (left) and K-band (right) spectra of the remaining objects. The spectra with very bad S/N are not shown.
intermediate-mass PMS stars. The age of the stars ranges be-tween 1 and 10 Myr (Fig. 10a) and we find a median age of∼4 Myr. This result can be considered as an upper limit of thecluster age since no ZAMS intermediate-mass stars have beendetected. However, the spread in age is large and suggests thatthe stars might not all originate from the same cluster or have acomplex formation history. We will discuss this scenario furtherin the discussion section.
We note that the number of objects with known spectral typeis less than half of the objects observed in the SOFI K-band.This implies that there is a selection effect which excludesobjects that do not show photospheric absorption lines in theH- and K-band. This is the case for objects 4, 11, 12, 18 and20 and objects with low signal to noise ratio spectra. Since thedetection of circumstellar emission is an indication that an objectis a young PMS star, this would lower the average cluster age.The fainter objects might include young objects still deeply em-bedded in the parental cloud, which obviously lowers the clusterage estimate as well. So while the group of stars shown in theHR diagram is ∼4 Myr old, the group of stars which could notbe classified might be (much) younger. We can relate this resultwith our findings from the IRAC colors (Sect. 3.3) which show
that the class II objects are spread out over a larger region ascompared with the class 0/I objects. All the class II objects areidentified in the HR diagram. Six out of seven class 0/I objectscould not be classified. It seems plausible that the age derivedfrom the HR diagram is primarily dominated by the class II ob-jects.
6. Discussion
We start with a review of the observed stellar properties of thecluster. We can distinguish two groups based on their age andposition.
The first group of objects include the massive stars (object1, 2 and the H ii region) and the class 0/I objects. CSM aroundobject 1 and 2 and the presence of the H ii region suggest thatthese objects belong to a very young population of stars less thana million years old. Since the massive objects are found in thecenter of the class 0/I objects (as demonstrated by their spatialdistribution on the IRAC field in Fig. 5), this suggest that mostclass 0/I objects might be associated with this younger popu-lation. For several of the class 0/I objects we have SINFONIspectra (object 4, 18, 22, 29). Their spectra do not show pho-tospheric absorption lines. They have significant excess in the
A27, page 11 of 13

A&A 531, A27 (2011)
(a)
(b)
Fig. 10. HR diagram of objects classified by their SINFONI spectra.Top: the extinction corrected MK vs. log(T ) HR diagram. The K-bandmagnitude has been corrected for a distance of 830± 50 pc. Over plot-ted with a dashed line is the ZAMS isochrone from Blum et al. (2000)and the dotted lines represent the isochrones from Da Rio et al. (2009)between 1 and 10 Myr calculated from the Siess et al. (2000) evolution-ary models. The bottom panel shows the same diagram with overplottedthe pre-main-sequence evolutionary tracks for 3, 2.5, 2, 1.5 and 1 M�stars from Da Rio et al. (2009).
H-, K- and IRAC-bands but lack detections in the J-band, sug-gesting that these objects are strongly reddened and surroundedby CSM. Furthermore we observe several H2 blobs lacking cen-tral objects in our SINFONI data, indicating early star formationactivities deeply embedded in the cluster.
The second group consists of a population of class II objectswhich appear more diffused outward in the IRAC field (Fig. 5)and have typical ages of a few Myr. The class II objects inthe SINFONI field can be associated with the spectroscopically
classified stars as most of them (with detections in all IRACbands) are class II objects (see Table 2). We classified 13intermediate-mass PMS stars, and found that they are typicallyof G-K spectral type with luminosity class IV and will evolveto stars with late B, A or early F spectral type. With an extinc-tion of ∼10–20 AV mag, they show IR excess in the IRAC bandsstarting at wavelengths >2 μm. These objects are placed in anHR diagram (Fig. 10), and comparison with evolutionary tracksshows that they represent a group of stars with a median age of∼4 Myr. Note that no massive stars are observed in this group.
We will now attempt to reconstruct the star formation historyof this region and examine how they are related in age and loca-tion. IRAS 06084-0611 is a cluster spanning a wider range of agethan is typical of stars formed in any individual star-forming re-gion. The presence of young massive objects (group 1) suggeststhat a part of the cluster is significantly younger than the stars be-longing to the ∼4 Myr population (group 2). Though we cannotprove a possible physical relation from our dataset, it is reason-able to suggest that despite the range in age, the star formationhistory of group 1 and 2 in the cluster might be closely related.However, what we really observe is sequential star formation:the most massive stars of group 1 have formed sequential to theinitial cluster of intermediate mass PMS stars (group 2).
There is very strong differential extinction in the SINFONIfield, particularly towards the southeast. The extended H2 emis-sion in the lower half of the SINFONI field (Fig. 2b) could beoriginating from a lower density PDR where the filament is lessdense. This might also explain why object 4, 11, 12, 21 and 23are not detected in the J-band. On a larger scale, the IRAC colorimage in Fig. 1 and the extinction map in Fig. 5 show dark fil-amentary structures indicating large extinction. On the bordersof the dark filament in the SINFONI field we find 5 objects aswell as the H ii region (VLA1) only detected in the IRAC bands.This population, deeply embedded in optically thick molecularclouds, is illustrative for the youth of this cluster region.
The SINFONI field is too small to observe gradients inthe distribution of massive stars and class 0/I objects and theintermediate-mass PMS stars (See Fig. 2a). However, in theIRAC field (Fig. 5), the spatial distribution of class 0/I and classII objects shows that the class 0/I objects are concentrated atshorter distances around the massive objects (object 1, 2 and theH ii region) as compared to the class II objects. This suggests thatthe intermediate mass cluster (group 2) could have lost enoughnatal cloud mass in the first million years since formation thatthe stars are no longer gravitationally bound. They are in theprocess of diffusing outward and hence appear more spread outcompared to the younger class 0/I objects. Taking into accountthat the SINFONI observations show many infant star formationfeatures like outflows and strong reddened colors, and that class0/I objects are younger than class II objects, it seems that the cen-ter of IRAS 06084-0611 contains a relatively higher fraction ofyoung objects than its surroundings. A possible scenario for thisobservation would be sequential star formation along the line ofsight; in front or behind the initial cluster from our perspective.
The observation that the most massive stars are concentratedtowards the center of the cluster is observed in many more youngclusters (Hillenbrand & Hartmann 1998; Gouliermis et al. 2004).Mass segregation to the center of the cluster could be primor-dial or dynamical: the most massive stars can be concentratedat or near the center or migrate into the center of the clusterdue to two-body interactions. Allison et al. (2009) describe anensemble of simulations of cool, clumpy (fractal) clusters andthey show that during the early life of such a cluster often masssegregation takes place on timescales far shorter than expected
A27, page 12 of 13

K. M. Maaskant et al.: Sequential star formation in IRAS 06084-0611 (GGD 12-15)
from simple models. The results of these N-body simulationslook quite similar to the current situation in IRAS 06084-0611.
Our findings show an interesting similarity to those found inthe S255 complex (Bik et al. 2010; Wang et al. 2011). Also inthis regions, a group of intermediate mass stars (up to a few Myr)seems to have formed after star formation in a smaller regioncontaining younger, more massive stars. As for IRAS 06084-0611, sequential star formation might be at work too.
7. Conclusions
The results of our study can be summarized as follows:
1. We detect two high mass stars in our SINFONI data: a mas-sive YSO consistent with an early-B spectral type and aHerbig Be star. Moreover we detected the IR counterpart ofthe H ii region VLA1 in the IRAC bands.
2. The spectral types of 13 objects are determined in the starforming region IRAS 06084-0611 using SINFONI H- andK-band spectra. Most objects for which a spectral type couldbe obtained are PMS intermediate-mass stars of G–K spec-tral type.
3. Using 2MASS, SOFI and IRAC photometry we find that theextinction shows a large variation over the SINFONI fieldranging between AV ∼ 10–20 mag.
4. We derive a median cluster age of ∼4 Myr. This seems tobe in contradiction with the presence of embedded class 0/Iobjects and two massive objects (a massive YSO and an H iiregion) with ages of ∼1 Myr.
5. The younger class 0/I objects and the massive objects arelocated in a smaller region as compared to the class II ob-jects, with rough scale size radii of ∼0.5 pc and ∼1.25 pcrespectively. A possible scenario for this observation wouldbe sequential star formation along the line of sight: from theinitial formation of a cluster of intermediate-mass stars to theformation of more massive stars.
Acknowledgements. K.M. thanks the staff of the MPIA for their hospitalities.The authors thank F. Eisenhauer for providing the data reduction softwareSPRED, R. Davies for providing his routines to remove the OH line residu-als, N. Da Rio for providing the isochrones and evolutionary tracks and JouniKainulainen for sharing his expertise in making the NIR extinction map. Theauthors thank the Paranal staff for carrying out the observations.This publication makes use of data products from the Two Micron All SkySurvey, which is a joint project of the University of Massachusetts and theInfrared Processing and Analysis Center/California Institute of Technology,funded by the National Aeronautics and Space Administration and the NationalScience Foundation. This work is based on observations made with the SpitzerSpace Telescope, which is operated by the Jet Propulsion Laboratory, CaliforniaInstitute of Technology under a contract with the National Aeronautics and SpaceAdministration (NASA). E.P. is partially funded by the Consolider-Ingenio 2010Program CSD2006-00070We thank the anonymous referee for the careful review of the manuscript thathelped to improve the paper.
ReferencesAbuter, R., Schreiber, J., Eisenhauer, F., et al. 2006, New Astron. Rev., 50, 398Acke, B., & van den Ancker, M. E. 2004, A&A, 426, 151Allen, L. E., Calvet, N., D’Alessio, P., et al. 2004, ApJS, 154, 363Allison, R. J., Goodwin, S. P., Parker, R. J., et al. 2009, ApJ, 700, L99Alvarez, C., Feldt, M., Henning, T., et al. 2004, ApJS, 155, 123André, P., Basu, S., & Inutsuka, S. 2009, The formation and evolution of prestel-
lar cores, ed. G. Chabrier (Cambridge University Press), 254Bessell, M. S., & Brett, J. M. 1988, PASP, 100, 1134Bik, A. 2004, Ph.D. Thesis, University of AmsterdamBik, A., & Thi, W. F. 2004, A&A, 427, L13
Bik, A., Kaper, L., Hanson, M. M., & Smits, M. 2005, A&A, 440, 121Bik, A., Kaper, L., & Waters, L. B. F. M. 2006, A&A, 455, 561Bik, A., Puga, E., Waters, L. B. F. M., et al. 2010, ApJ, 713, 883Blum, R. D., Conti, P. S., & Damineli, A. 2000, AJ, 119, 1860Blum, R. D., Ramond, T. M., Conti, P. S., Figer, D. F., & Sellgren, K. 1997, AJ,
113, 1855Boersma, C., Peeters, E., Martín-Hernández, N. L., et al. 2009, A&A, 502, 175Bonnet, H., Conzelmann, R., Delabre, B., et al. 2004, in SPIE Conf. Ser. 5490,
ed. D. Bonaccini Calia, B. L. Ellerbroek, & R. Ragazzoni, 130Cardelli, J. A., Clayton, G. C., & Mathis, J. S. 1989, ApJ, 345, 245Chandler, C. J., Carlstrom, J. E., & Scoville, N. Z. 1995, ApJ, 446, 793Chiar, J. E., & Tielens, A. G. G. M. 2006, ApJ, 637, 774Churchwell, E., Povich, M. S., Allen, D., et al. 2006, ApJ, 649, 759Clark, J. S., & Steele, I. A. 2000, A&AS, 141, 65Cohen, M., & Kuhi, L. V. 1979, ApJS, 41, 743Cushing, M. C., Rayner, J. T., & Vacca, W. D. 2005, ApJ, 623, 1115Da Rio, N., Gouliermis, D. A., & Henning, T. 2009, ApJ, 696, 528de La Fuente, E., Porras, A., Grave, J. M. C., et al. 2009, Rev. Mex. Astron.
Astrofis. Conf. Ser., 37, 13Eisenhauer, F., Abuter, R., Bickert, K., et al. 2003, in ed. M. Iye, &
A. F. M. Moorwood, SPIE Conf. Ser. 4841, 1548Elmegreen, B. G. 1998, in ASP Conf. Ser., 148, Origins, ed. C. E. Woodward,
J. M. Shull, & H. A. Thronson Jr., 150Elmegreen, B. G., & Lada, C. J. 1977, ApJ, 214, 725Fazio, G. G., Hora, J. L., Allen, L. E., et al. 2004, BAAS, 36, 699Gómez, Y., Rodríguez, L. F., & Garay, G. 2000, ApJ, 531, 861Gómez, Y., Rodríguez, L. F., & Garay, G. 2002, ApJ, 571, 901Gouliermis, D., Keller, S. C., Kontizas, M., Kontizas, E., & Bellas-Velidis, I.
2004, A&A, 416, 137Gutermuth, R. A., Megeath, S. T., Myers, P. C., et al. 2009, ApJS, 184, 18Hanson, M. M., Conti, P. S., & Rieke, M. J. 1996, ApJS, 107, 281Hanson, M. M., Rieke, G. H., & Luhman, K. L. 1998, AJ, 116, 1915Hanson, M. M., Luhman, K. L., & Rieke, G. H. 2002, The ApJSS, 138, 35Harvey, P. M., Wilking, B. A., Joy, M., & Lester, D. F. 1985, ApJ, 288, 725Heaton, B. D., Little, L. T., Andersson, M., & Dent, W. R. F. 1988, A&A, 203,
99Herbst, W., & Racine, R. 1976, AJ, 81, 840Hillenbrand, L. A., & Hartmann, L. W. 1998, ApJ, 492, 540Hodapp, K. 1994, ApJS, 94, 615Kenyon, S. J., & Hartmann, L. 1995, ApJS, 101, 117Koornneef, J. 1983, A&A, 128, 84Kurucz, R. L. 1993, VizieR Online Data Catalog, 6039, 0Lada, C. J. 1987, in Star Forming Regions, ed. M. Peimbert, & J. Jugaku, IAU
Symp., 115, 1Lada, C. J. 2010, Royal Society of London Philosophical Transactions Series A,
368, 713Lombardi, M., & Alves, J. 2001, A&A, 377, 1023Makovoz, D., Khan, I., & Masci, F. 2006, Proc. SPIE, 6065, 330Martins, F., Pomarès, M., Deharveng, L., Zavagno, A., & Bouret, J. C. 2010,
A&A, 510, A32Megeath, S. T., Allen, L. E., Gutermuth, R. A., et al. 2004, ApJS, 154, 367Muzerolle, J., D’Alessio, P., Calvet, N., & Hartmann, L. 2004, ApJ, 617, 406Olofsson, G., & Koornneef, J. 1985, A&A, 146, 337Persi, P., & Tapia, M. 2003, A&A, 406, 149Puga, E., Bik, A., Waters, L. B. F. M., et al. 2008, in Massive Star Formation:
Observations Confront Theory, ed. H. Beuther, H. Linz, & T. Henning, ASPConf. Ser., 387, 331
Puga, E., Marín-Franch, A., Najarro, F., et al. 2010, A&A, 517, A2Qin, S.-L., Wang, J.-J., Zhao, G., Miller, M., & Zhao, J.-H. 2008, A&A, 484,
361Rayner, J. T., Cushing, M. C., & Vacca, W. D. 2009, ApJS, 185, 289Reipurth, B., & Wamsteker, W. 1983, A&A, 119, 14Sato, Y., Tamura, M., Kandori, R., et al. 2008, PASJ, 60, 429Schreiber, J., Thatte, N., Eisenhauer, F., et al. 2004, Astronomical Data Analysis
Software and Systems XIII (San Francisco: ASP), ASP Conf. Ser., 314, 380Siess, L., Dufour, E., & Forestini, M. 2000, A&A, 358, 593Skrutskie, M. F., Cutri, R. M., Stiening, R., et al. 2006, AJ, 131, 1163Tofani, G., Felli, M., Taylor, G. B., & Hunter, T. R. 1995, A&AS, 112, 299Torrelles, J. M., Verdes-Montenegro, L., Ho, P. T. P., Rodriguez, L. F., & Canto,
J. 1989, ApJ, 346, 756van den Ancker, M. 2005, in High Resolution Infrared Spectroscopy in
Astronomy, ed. H. U. Käufl, R. Siebenmorgen, & A. Moorwood, 309Wang, Y., Beuther, H., Bik, A., et al. 2011, A&A, 527, A32Wheelwright, H. E., Oudmaijer, R. D., de Wit, W. J., et al. 2010, MNRAS, 408,
1840Zinnecker, H., & Yorke, H. W. 2007, ARA&A, 45, 481
A27, page 13 of 13