sequently tris, glycine - project overview | project irene -...
TRANSCRIPT
7 5
Anthropoid Evolution: The Molecular EvidenceJohn E. Cronin
It has become apparent, in recent years, that mac-romolecules can provide phylogenetic informationelucidating the branching order of lineages (cladis-tics), the amount of evolution occurring along lineages(patristics), and the approximate times of divergenceof these lineages (chronistics). Within the primates,particularly with respect to the Anthropoidea, anumber of different cladograms have been con-structed using macromolecular comparisons includ-ing DNA (Kohne et al. 1972; Hoyer et al. 1972),hemoglobin (Wilson and Sarich 1969; Goodman andMoore 1973), fibrinopeptides (Doolittle et al. 1971;Wooding et al. 1972), myoglobin (Romero-Herrera etal. 1973), mixed immunology (Goodman and Moore1971), albumin (Sarich and Wilson 1967; Wilson andSarich 1969; Sarich 1970; Cronin and Sarich 1975;Sarich and Cronin 1977), transferrin (Cronin andSarich 1975; Sarich and Cronin 1977).The serum protein albumin has been studied in a
number of vertebrate groups, other than primates,including carnivores (Sarich 1969a, 1969b, 1973),ranid frogs (Wallace, King and Wilson 1973) and hylidfrogs (Maxson and Wilson 1975).
In this paper we construct two independentphylogenies of the Anthropoidea using the two serumproteins, albumin and transferrin. The groupsexamined consist taxonomically of three super-families, Hominoidea, Cercopithecoidea andCeboidea (Napier and Napier 1967). We find that thetwo molecular cladograms are in excellent agreementwith each other and furthermore, that both are inaccord with other molecular data and macromolecularcladograms. Finally, the total macromolecular evi-dence supports the use of "molecular clocks."
Experimental ProceduresSerum albumin and serum transferrin were
purified for immunological comparisons from thosespecies listed in Tables 1, 2 and 3. In every case exceptthat of Tupaia the proteins were purified from a singleindividual.
Transferrin purificationTransferrin was purified by a modification of the
Stratil and Spooner (1971) procedure (Sarich 1974;Cronin and Sarich 1975). To a given serum was addedFeCl3 (0.1 mg/ml of serum). Rivanol (2-ethoxy 6-9diaminoacridine lactate; 1 mg/ml serum) was dissolvedin 0.25 M tris (pH 8.8; 0.25 mg/ml of serum) and then
diluted 4 to 5 fold with distilled water. The serum wasthen added to the rivanol solution and cooled to 5C.The solution was centrifuged (12,000g) and(NH4)2 S04 was added to 40% saturations, then sub-sequently to 70% saturation. The final solution wascentrifuged at 12,000g and the precipitate, usually asalmon pink, redissolved into a minimal volume ofisotris buffer dialyzed against isotris containing citricacid and ferrous ammonium sulfate to promote sat-uration.The solution was then subjected to polyacrylamide
disc gel electrophoresis (Wallace 1971; Maxson andWilson 1975), alternatively. An 8% cyanogun (95%acrylamide, 5% bis) solution was used in the gel mix-ture with a tris-glycine buffer (0.1 M tris, 0.05M glycinepH 8.8) as both well and gel buffer. In this case,equilibration was prolonged to 1 hour at 5 ma/tube(Palmour and Sutton, 1971).
Albumin purificationAlbumin was usually purified from serum by
polyacrylamide disc gel electrophoresis (Wallace andWilson 1972). In the single case of Cacajao, albuminwas purified by the heat caprylate method of Hochand Chanutin (Sarich 1967).
Antisera ProductionAntisera were prepared in rabbits according to the
method of Sarich (1967). Individual antisera werepooled in inverse proportion to their microcomple-ment fixation (MC'F). Titres and all reported resultsare from pooled antisera (Prager and Wilson 1971aand b). Purity tests were conducted according to pub-lished techniques (Wallace, King and Wilson 1971). Insome cases, minor components were observed in thegels, indicating that antibodies had been induced toproteins other than albumin or transferrin. However,these minor components do not interfere with mic-rocomplement fixation experiment results as identicalresults are obtained whether one uses the purifiedprotein or unmodified primate serum as the antigensource (Sarich 1966; Cronin 1975).
Microcomplement FixationQuantitative microcomplement fixation experi-
ments as devised by Wasserman and Levine (1961)were modified by Sarich and Wilson (1966) and exten-sively detailed by Champion et al. (1974). Immunolog-ical distance (y) is generally related to the percent

difference in amino acid sequence (x) between twomolecules by the equation y=5x (Prager and Wilson1971a and b; Champion et al. 1974). Evidencesuggests that one unit of immunological distance isapproximately equivalent to one amino acid differ-ence between two species albumin or transferrin(Maxson and Wilson 1974; Sarich 1974).
Transferrin SaturationThe possibility exists that the binding of iron to
transferrin alters the configuration of the molecule insuch a way as to affect immunological recognition inmicrocomplement fixation experiments. Normally,transferrin is about one third saturated with apo trans-ferrin (Tf), monoferro, and diferro molecules presentin plasma (Palmour and Sutton 1971). Presumablyupon injection into the rabbit, molecules of all threetypes would be present.To test the effect of saturation on immunological
recognition human transferrin was deprived of iron,resaturated and tested immunologically with purifiedhuman transferrin and serum as controls. Microcom-plement fixation tests were performed using anti-human transferrin (genotype CC) with apo Tf,purified Tf, serum and 80% saturated Tf. No differ-ence was detected in any of these duplicated experi-ments. In addition similar procedures were carriedout on chicken ovo transferrin and identical resultsobtained (Prager et al. 1974).
Results
Construction of Phylogenetic TreesThe phylogenetic trees were constructed using the
method of Sarich (Sarich 1969; Cronin and Sarich1975). The immunological distance values used were
the average of the values determined by reciprocaltests. The phylogenetic trees presented have a statedpercent deviation (Fitch and Margoliash 1967) as a
measure of "goodness of fit" where input data is com-pared with the output data. The latter is calculated byadding up the immunological distance units separat-ing any pair of species in the cladogram.The method of tree construction is similar to that of
Fitch and Margoliash (1967). The difference lies in thefact that to apportion lineage lengths between two
species A and B, Fitch and Margoliash average thedistances from A to every other species and from B to
every other species. The method as described in Cro-nin and Sarich (1975) does not use every other speciesas an outside reference point but uses the next closestgroup to align branch lengths in the group understudy. For example, anti-cercopithecoid antiserawould serve as outside reference points for theHominoidea and similarly the anti-ceboid antiserawould serve as outside reference points for aligningthe cercopithecoid lineages. The different methods ofconstruction yield similar although not identical re-
sults (Farris 1972; Wallace et al. 1973; Maxson andWilson 1975).Antisera to the purified transferrins from 5
hominoid species, 5 cercopithecoid species, and 5ceboid species were used to investigate the phyleticrelationships of the suborder Anthropoidea. Usingthe microcomplement fixation technique each an-
tiserum was tested with transferrin of every specieslisted in Table 1. Table 1 gives all immunological dis-tances between all 105 possible pairs of species. Thus,between every pair of species 2 immunological dis-tances were obtained.
Similarly antisera to the purified albumins from 5hominoid, 5 cercopithecoid and 10 ceboid specieswere used to investigate the phyletic relationshipswithin the Anthropoidea. Table 2 gives the matrix ofimmunological distance units for all 45 pairs of catar-
rhine species. Table 3 gives the matrix of immunolog-ical distance units for all 45 pairs of platyrrhinespecies.The trees constructed are shown in Figures 1 and 2.
The percent standard deviation of the transferrincladogram is 8.9%. The lowest tree for 20 eukaryoticcytochrome c sequences constructed by Fitch andMargoliash (1967) was 8.7%. No tree this large hasbeen published previously using immunological data.For a tree of 12 hylid frog species Maxson and Wilson(1975) report 10% standard deviation. For a tree of 15cercopithecoid species (Cronin and Sarich in prep.) a
12.5% standard deviation was obtained. The an-
thropoid albumin tree has a 8.0% standard deviation.
Correlation of Albumin and Transferrin DistancesAlbumin immunological distances are correlated
with transferrin immunological distances. To illus-trate this one may consider all the pairs of catarrhinespecies that have been subjected to both albumin (Ta-ble 2) and transferrin (Table 1) comparison. For these45 pairs a product moment correlation coefficient of0.86 was observed (p <<O.O1). Similarly when the aver-
age albumin distances given in Table 4 for primates as
a whole are compared with the corresponding trans-ferrin distances r = 0.83 (p<<0.01).The equation for the regression lines were as fol-
lows:Catarrhine A= mT+bPrimates A= mT+b
Where A is the albumin immunological distance and Tis the transferrin immunological distance. Transferrinimmunological distances are on the average 1.5 foldgreater than albumin distances between the same
species. Similar results have been found in comparisonof carnivore, rodent and chiroptera albumins andtransferrins (Sarich 1973). In birds transferrin dis-tances average 2.2 times the albumin distances.(Prager et al. 1974).
7 6

7 7
TABLE 1Immunological Distances Among Anthropoid Transferrins
ANTISERAT
pAN
13
1018223341363333287871838280
G0RILLA
55
24233751373131366160707068
p0NG0
333637
354366614440398382
1019295
HyL0BATES
27272628
4363453937428480868987
pRESByTIS
6454595255
43343434319592909797
HER0pITHECUS
555250504720
51316138589958592
pApI0
CyN0pITHECUS
61 4956 4652 4550 4245 4415 193 20- 18
16 -20 1920 768 82110 77108 7299 71106 78
ERyTHR0CEBUS
524649474521242112
97579817675
CERC0CEBUS
ATELES
42 7341 7139 7538 8558 7821 7924 10023 9812 8623 86
- 8279 -
81 3179 3281 2881 28
A C0 ET BU US S
73 7573 7473 6283 7178 8289 96100 112100 10989 10086 9194 8928 30
- 3230 -
30 2930 35
CALLITHRIx
SAGUINUS
70 8670 7468 7674 8874 8590 104103 113101 11085 10181 9475 9226 2535 2836 32
- 86 -
TABLE 2Immunological Distances Among Catarrhine Albumins.
ANTISERAC.
C.H P GY A R A
G L E E L P.0 0 M. T S ER P B H B R P
H I 0 A I I Y I A0 P L N T R 0 T T PM A L G E U P I U I
ANTIGEN 0 N A 0 S S S S S 0
Homo - 4 4 11 10 37 49 42 37 34Pan 7 - 9 11 14 37 49 46 38 31Gorilla 5 7 - 11 10 32 62 51 37 36Pongo 12 8 10 - 11 42 57 48 38 40Hylobates 13 13 12 11 - 36 49 44 35 43M. irus 37 30 21 38 36 - 12 24 6 0C. aethiops 44 42 21 33 37 10 - 22 9 4Presbytis 42 40 22 38 38 24 34 - 28 16C. galeritus 39 32 20 33 33 7 0 19 - 4P. papio 40 30 18 34 36 2 7 25 8 -
H0M0ANTIGEN
HomoPanGorillaPongoHylobatesPresbytisTheropithecusPapioCynopithecusErythrocebusCercocebusAtelesAotusCebusCallithrixSaguinus
78
16203441373434356467666764
7 8
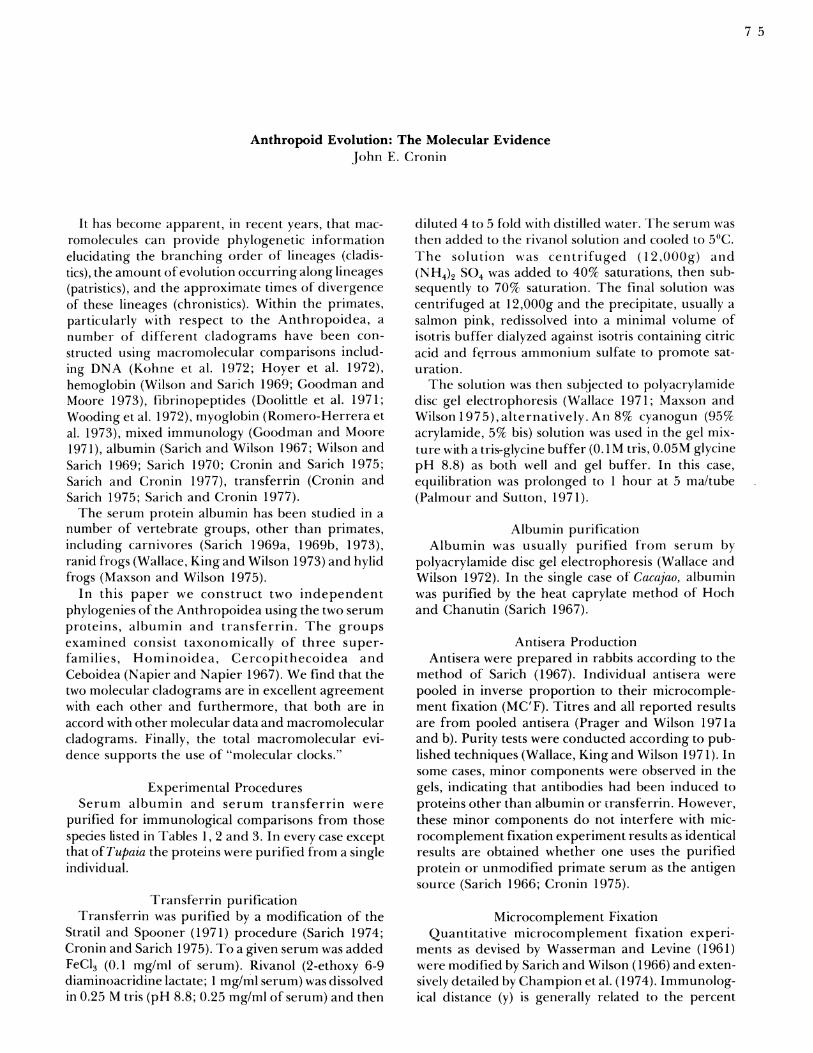
TABLE 3Intraplatyrrhine Albumin Immunological Distances
ANTISERUMC C(A AL A P S 1, RL L I S C A L, E
A I 0 r A A G I L, RaA T C C U H I C, U T A A0 E E E A E M A I H T FT L B B T C I J N R I EU E U U T I R A U I V
AN'FIGEN S S S S A A I 0 S X E
Aotus trivirgatus 0 31 29 26 28 18 32 22 32 27 -12Ateles geoJfroyi 33 0 31 19 21 27 29 17 43 42 0Cebus capucinus 37 43 0 30 36 25 38 37 59 56 +12Callicebus cupreus 36 33 29 0 36 28 48 24 50 41 -2Alouatta palliata 38 12 30 22 0 31 42 31 56 55 +6Pithecia monachus 29 29 18 12 34 0 24 4 50 30 -4Saimiri scuirea 40 42 3 1 34 36 39 0 43 60 46 +8Cacajao rubicundus 33 36 29 24 33 9 45 0 41 34 +2Saguinus leucopus 36 27 17 16 25 26 27 14 0 29 +3Callithrix jaccus 29 39 37 22 45 37 40 22 29 0 +2
aFhese numbers indicate the mean amount by which the given albumin species is more distant (+) or lessdistant (-) than Ateles from a series of nonplatyrrhine albumins (Homo, Pan, Macaca, Cercopithecus, Presbytis,Nycticebus) from Sarich and Wilson 1967; Sarich 1970.
TABLE 4Immunological Distances Among Primate Albumins and Transferrinsa
Non-H C P Ta Tu Cy Le Lo primatesb
HominoideaC(ercopithecoideaPlatyrrhiniTarsiusTupaiaCynocephalusLemuriformesLorisiformes
TRANSFERRI N
0 33 58 123 98 117 112 94 +1945 0 56 128 102 114 110 107 + 19 A76 91 0 109 89 98 112 107 + 12 L
172 164 156 0 93 109 122 95 +5 B170 190 180 159 0 103 117 108 -5 U175 156 177 161 183 0 109 113 +5 M164 171 164 156 178 162 0 88 0 I196 195 193 178 183 185 118 0 -4 N
aThese data have been gathered using antisera to the albumins and transferrins of Homo,Pan, Gorilla, Pongo, Hylobates, Papio, Cercocebus, Cercopithecus, Presbytis, Aotus, Ateles, Cebus,Callithrix, Saguinus, Lemur, Avahi, Lepilemur, Propithecus, Phaner, Daubentonia, Nycticebus,Galago, Tupaia, and Cynocephalus; to the transferrin ofMacaca nigra; and to the albumins ofUrsus, Genetta, Hyaena, Felis, Hipposideros, Pteropus, Tadarida, Antrozous, Bradypus, Cabassous,Tamandua, Scapanus, and Solenodon.
bThese numbers represent the amount by which those albumins are more (+) or less (-)distant from the various nonprimates than the lemuriform mean. A similar analysis is notpossible for the transferrins as antisera to nonprimate transferrins do not generally reactwith those of primates.

TRANSFERRIN PHYLOGENY
I ~~I I I I I50 40 30 20 10 0
IMMUNOLOGICAL DISTANCEFigure 1. A transferrin cladogram of the Anthropoidea constructed according tothe method of Sarich (1969). The immunological distances on which this cladog-ram is based are those of Table 1. The percent standard deviation is 8.9%. Thenumber in parentheses following the species names represent the amount oftransferrin immunological distance accumulated on that species lineage from thenode separating the catarrhines and platyrrhines.
ANTHROPOID ALBUMIN PHYLOGENY
s . PONGO
3, HOMO13 3 3 .PAN/ ~~~~~~~3GORILLA
/ 6 . HYLOBATES/4 PRESBYTIS
;7 4 , Cercopithecus aethiops/; ^ _^ ~~~~~~~~~Mocaca irus0 Papio papio
\ ~~~~~~~~~~~2. C- gobritus\6
\ 4 . AOTUS
12%Sguinus/CalfithrixIs Ateles /Alouatta
CALLICEBUS< 21 , CEBUS\ 24 . SAIMIRI
10 Pithecia /Cacaiao
Figure 2. An albumin cladogram of the Anthropoidea constructed as in Figure 1.The immunological distances on which this cladogram is based are those ofTables2 and 3. The percent standard deviation is 8.0%.
7 9

Anthropoid EvolutionThe agreement, in terms of cladistics, between the
albumin and transferrin cladograms is evident. Nomajor differences are readily apparent. There is onedifference and that is in terms of the placement of theceboid lineage Aotus. Previous albumin studies placedit diverging before the major ceboid radiation (Sarich1967). The transferrin data, however, suggest that it isone of the 7 major ceboid lineages which radiate froma common node (Cronin and Sarich 1975) as do thehemoglobin data (Boyer et al. 1971).Beyond that specific discrepancy (discussed in
depth in Cronin and Sarich 1975) no other specificdisagreements are noted. It is clear that the specieswithin Anthropoidea comprise a group with a sharedlineage of some considerable time depth. The initialdivergence is between the Old and New World forms,the Catarrhini and Platyrrhini. The former group sub-sequently diverges into the two constituent subunits,the Hominoidea and the Cercopithecoidea. Thus, themajor groupings apparent at the molecular level are
in good agreement with the classification of the An-thropoidea (Napier 1967).The fact that the two molecular cladograms are in
such close agreement supports the using of im-munological data in order to elucidate the phylogene-tic relationship of taxa.Given the data, it is readily apparent that the An-
thropoidea is composed of three clusters of species,including the Hominoidea, the Cercopithecoidea andthe Ceboidea. The former are closer to each otherfrom almost every molecular measure, except for theprimate lysozyme data, than they are to the lattergroup the Ceboidea. Reciprocity problems are inhe-rent in the lysozyme anti lysozyme system as hasbeen pointed out (Prager et al. 1974). The overwhelm-ing evidence is that the Catarrhini are a unit relative to
the Platyrrhini.All the molecular data support the conclusion that
the Anthropoidea share a common lineage subsequentto the divergence of any prosimian stock. Along thislineage accumulated some 70 units of combined albu-min and transferrin units of change, three myoglobinsequence changes, seven fibrinopeptide changes, fivebeta hemoglobin changes and two units of antigenicdistance, before the divergence of the New Worldmonkeys.The Ceboidea form a fairly tight unit (evolutionary
radiation) with a division into units, the Callithricidaeplus Callimico, and a number of other fairly indepen-dent ceboid lineages (Cronin and Sarich 1975; Baba etal. 1975; Boyer et al. 1971).The Catarrhini form a group relative to the Platyr-
rhini, with respect to serum proteins, albumin andtransferrin (Sarich 1970; Sarich and Cronin 1975),prealbumin, albumin, alpha 2 macroglobulin, thry-globulin, transferrin, ceruloplasmin and gammaglobulin (Goodman et al. 1971), DNA (Kohne 1972),
myoglobin (Romero-Herrera 1973), hemoglobin(Goodman et al. 1973, 1974), fibrinopeptides (Wood-ing et al. 1972) and carbonic anhydrase (Nonno et al.1969).The Catarrhini are traditionally broken into two
taxonomic units, the Hominoidea and the Cer-copithecoidea on morphological grounds. This is alsotrue with respect to the molecular division (all refer-ences above and figures this paper). The Cer-copithecoidea have had little detailed genetic work.Yetit is apparent that the basic division into leaf eaters
(Colobinae) and non leaf eaters (Cercopithicine) isrecognized at the molecular level. (Sarich 1970;Barnicot and Wade 1970; Goodman and Moore 1971).A detailed presentation of the evolution of the Cer-copithecoidea as determined by the microcomplementfixation technique is in preparation (Cronin andSarich) arid a brief preliminary version is in press
(Sarich and Cronin 1977).
Albumin and Transferrin Molecular ClocksIt appears that albumin accumulates approximately
50 units of change per 60 million years per lineage or
100 units per 60 million years of separation. Theseresults are found for a large variety of vertebratesbesides primates (Sarich 1970) including carnivores(Sarich 1969), ranid frogs (Wallace, et al. 1973), hylidfrogs (Maxson and Wilson 1975) and iguanid lizards(Gorman et al. 1971).
Transferrin accumulates about 150 units per 60m.y. of separation in mammalian and snake lineages(Mao et al. 1971; Cronin and Sarich 1975; Sarich1974). In birds, the rate of transferrin evolution is ¼4 to'/2 that found in mammals and snakes. Similar resultsare observed in serum albumin, with a rate of evolu-tion '3 that found in mammals (Prager et al. 1974).This phenomen of an evolutionary slowdown is not
unique to these two molecules. Lysozyme and cyto-chrome c seem to have evolved about twice as slowly inbirds as in mammals (Prager et al. 1974). This problempoints to the fact that rates of evolution cannot be as-
sumed; they must be calculated for every group understudy.
In the equation: Immunological Distance = K XTime (106 year), K approximates 1.67 for albuminand 2.5 for transferrin per million years for mamma-lian lineages. Thus, 250 units of combined albuminplus transferrin immunological distance calibrates to
approximately 60 million years. Using this calibrationpoint for albumin and transferrin it can be seen inTable 5 what the approximate times of separation ofvarious taxa are for the two molecules independentlyand averaged.The dates of divergence calculated from the im-
munological data presented in this study are in goodagreement with dates proposed by Sarich (1970);Sarich and Wilson (1967a and b); and Wilson andSarich (1969). Certain differences are, however, appa-
8 0
8 1
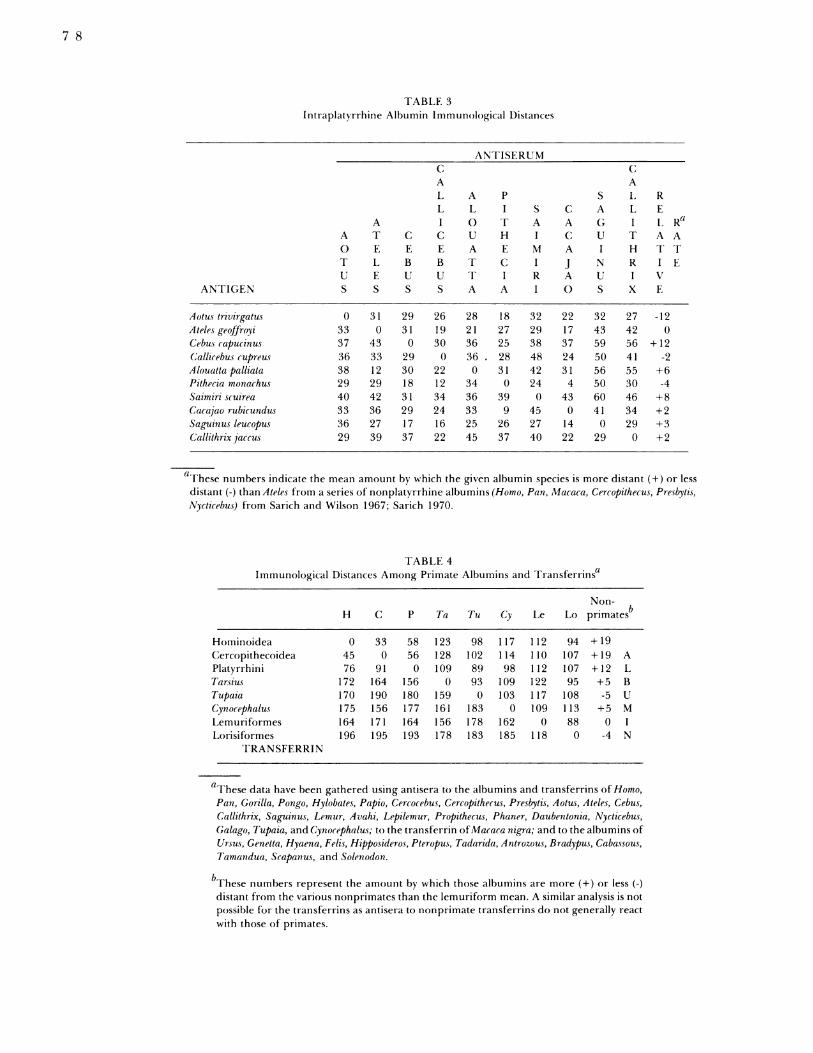
TABLE 5
Times of Divergence Among Various Primate Taxa Predicted byAlbumin and Transferrin Immunological Distances
Time of Divergence (106 yrs.)aTaxa Albumin TIransferrin Average
Homo vs Pan vs Gorillab 3.6 4 3.8Homo vs Pongo vs Hylobatesb 7.2 9.6 8.4Colobinae vs Cercopithecinae 14.4 10.8 12.6Hominoidea vs Cercopithecoidea 22.2 18 20.1Platyrrhini vs Catarrhini 34.2 33.6 33.9Anthropoidea vs Prosimii 70.2 64 67.1
aTimes ofdivergence are calculated on the basis that approximately 100 ablumin and150 transferrin units accumulate between two taxa over sixty million years.
bThe taxa listed are cladistically equally divergent from a common node so that it is athree way comparison. Since all three lineages separated cladistically from the samenode, they have existed for equal evolutionary time.
rent. It was postulated that prosimians and an-thropoids differed by about 100 albumin units. Thisfigure has had to be adjusted upward by about 10 unitsgiven the additon of five new lemurid albumin anti-sera.A second point of difference is the date of 30 million
years for the hominoid-cercopithecoid divergenceused to calculate the man-chimpanzee divergence timeof approximately 5 m.y. BP (Sarich and Wilson1967b). In subsequent publications a divergence timeof approximately 22 million years has been estimatedfor the hominoid-cercopithecoid separation (Sarich1970, 1971). The date estimated from the transferrindata of 18 m.y. BP is in close agreement with this latterfigure. The initial publication (Sarich and Wilson1967b) assumed a hominoid-cercopithecoid divergencetime of approximately 30 m.y. BP. From this date,given the ratio of the man-chimpanzee albumin dis-tance of 6 units versus the hominoid-cercopithecoiddistance of 35 immunological distance (I.D.) units; andgiven the hypothesis of the regularity of proteinevolution a time of divergence of 5 m.y. BP was calcu-lated for man and chimpanzee. Additional albumindata have now been gathered. Given the data fromTable 3, a mean hominoid-cercopithecoid distance of37 I.D. units is obtained. A cladistic analysis of thehominoids indicates that man, chimpanzee and gorilladiverged from a common node into three separatelineages. Each lineage is a sample of the amount ofchange given the time ofdivergence for those lineages.A mean distance using all descendent lineages from anode may give a better representation of the actualdistance between species descending from that nodethan only one measurement. This consideration givesa mean man-chimpanzee-gorilla albumin distance of 6
units. The same analysis on the transferrin data reveala mean distance of 8 units. The hominoid-cercopithecoid mean is 45 transferrin units. The ra-tio is 1:6.1 for albumin and 1:5.6 for tranferrih.Given the small distances involved between the greatapes and man, the two ratios are consistent and predictthat the human-chimpanzee divergence is approxi-mately 5 m.y. BP.
Agreement Among Genetic DistancesFortunately, with Anthropoidea we do not merely
need to rely upon only a comparison of albumin andtransferrin genetic distances. The reliability of thesephylogenies may be tested with other molecules andthere is good agreement with the cladograms pro-duced by studies of hemoglobin (Wilson and Sarich1969; Goodman and Moore 1973) fibrinopeptides(Doolittle et al. 1971; Wooding et al. 1972), DNA(Kohne et al. 1972; Hoyer et al. 1972) myoglobin(Romero-Herrera et al. 1973) transferrin (Cronin andSarich 1975) and mixed immunology (Goodman andMoore 1971).Table 6 lists the relative genetic distances between 5
primate taxa. The molecular data when considered asa whole support the hypothesis that the immunologi-cal data are not unique or unrepresentative of suchmacromolecular evidence. The correlation coefficientfor the nine molecular systems among the 5 taxa com-pared is 0.96 (p <<(.01). The rank correlation coeffi-cient is 1.0 (Cronin, Sarich and Dempster in prep.). Itappears that data on any one of the molecules yieldssubstantially the same conclusions as data from anyother molecular system.
8 2
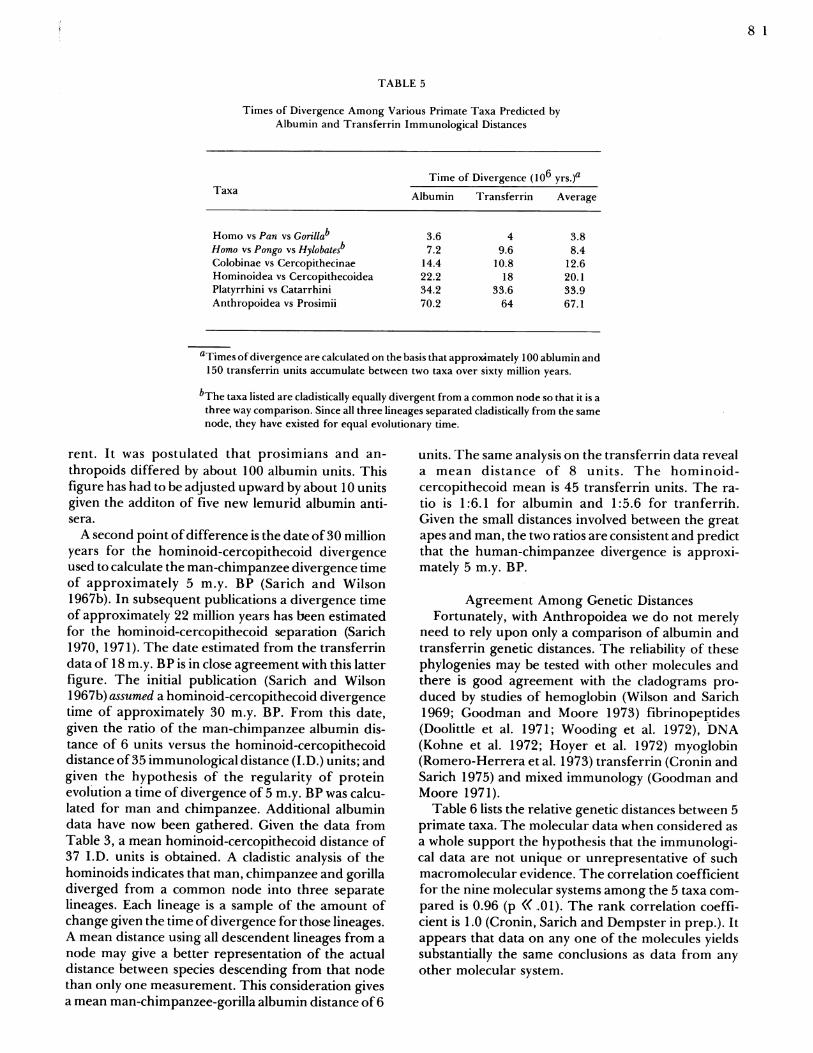
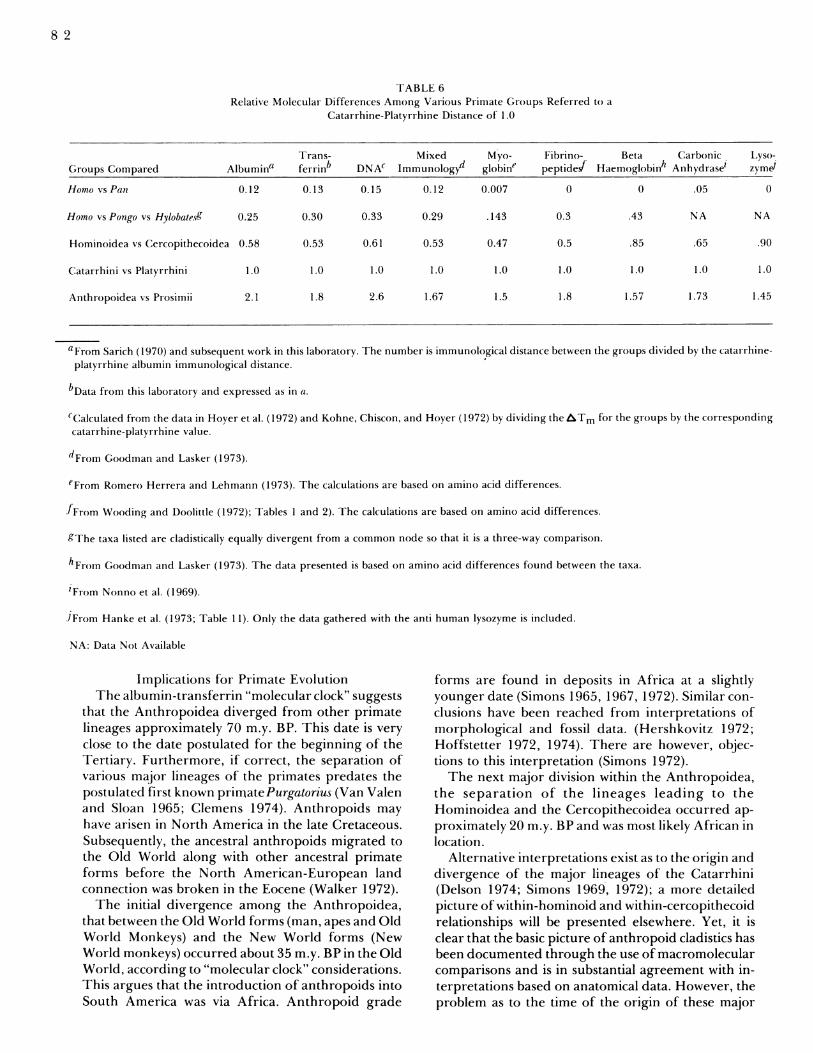
TABLE 6Relative Molecular Differences Among Various Primate Groups Referred to a
Catarrhine-Platyrrhine Distance of 1.0
Trans- Mixed Myo- Fibrino- Beta Carbonic Lyso-Groups Compared Albumina ferrinb DNA' Immunologyd globine peptidef Haemoglobinh Anhydrase' zym'
Homo vs Pan 0.12 0.13 0.15 0.12 0.007 0 0 .05 0
Homo vs Pongo vs Hylobate.s9 0.25 0.30 0.33 0.29 .143 0.3 .43 NA NA
Hominoidea vs Cercopithecoidea 0.58 0.53 0.61 0.53 0.47 0.5 .85 .65 .90
Catarrhini vs Platyrrhini 1.0 1.0 1.0 1.0 1.0 1.0 1.0 1.( 1.0
Anthropoidea vs Prosimii 2.1 1.8 2.6 1.67 1.5 1.8 1.57 1.73 1.45
aFrom Sarich (1970) and subsequent work in this laboratory. The number is immunological distance between the groups divided by the catarrhine-platyrrhine albumin immunological distance.
bData from this laboratory and expressed as in a.
'Calculated from the data in Hoyer et al. (1972) and Kohne, Chiscon, and Hoyer (1972) by dividing the ATm for the groups by the correspondingcatarrhine-platyrrhine value.
dFrom Goodman and Lasker (1973).
eFrom Romero Herrera and Lehmann (1973). The calculations are based on amino acid differences.
fFrom Wooding and Doolittle (1972); Tables I and 2). The calculations are based on amino acid differences.
gThe taxa listed are cladistically equally divergent from a common node so that it is a three-way comparison.
hFrorn Goodman and Lasker (1973). The data presented is based on amino acid differences found between the taxa.
'From Nonno et al. (1969).
JFrom Hanke et al. (1973; Table 11). Only the data gathered with the anti human lysozyme is included.
NA: Data Not Available
Implications for Primate EvolutionThe albumin-transferrin "molecular clock" suggests
that the Anthropoidea diverged from other primatelineages approximately 70 m.y. BP. This date is veryclose to the date postulated for the beginning of theTertiary. Furthermore, if correct, the separation ofvarious major lineages of the primates predates thepostulated first known primnatePurgatorius (Van Valenand Sloan 1965; Clemens 1974). Anthropoids mayhave arisen in North America in the late Cretaceous.Subsequently, the ancestral anthropoids migrated tothe Old World along with other ancestral primateforms before the North American-European landconnection was broken in the Eocene (Walker 1972).The initial divergence among the Anthropoidea,
that between the Old World forms (man, apes and OldWorld Monkeys) and the New World forms (NewWorld monkeys) occurred about 35 m.y. BP in the OldWorld, according to "molecular clock" considerations.This argues that the introduction of anthropoids intoSouth America was via Africa. Anthropoid grade
forms are found in deposits in Africa at a slightlyyounger date (Simons 1965, 1967, 1972). Similar con-clusions have been reached from interpretations ofmorphological and fossil data. (Hershkovitz 1972;Hoffstetter 1972, 1974). There are however, objec-tions to this interpretation (Simons 1972).The next major division within the Anthropoidea,
the separation of the lineages leading to theHominoidea and the Cercopithecoidea occurred ap-proximately 20 m.y. BP and was most likely African inlocation.
Alternative interpretations exist as to the origin anddivergence of the major lineages of the Catarrhini(Delson 1974; Simons 1969, 1972); a more detailedpicture of within-hominoid and within-cercopithecoidrelationships will be presented elsewhere. Yet, it isclear that the basic picture of anthropoid cladistics hasbeen documented through the use of macromolecularcomparisons and is in substantial agreement with in-terpretations based on anatomical data. However, theproblem as to the time of the origin of these major

anthropoid lineages remains controversial (Simons1972; Delson 1974; Read 1975; Delson and Andrews1976).In conclusion the fact that the macromolecules are
in agreement as to the relationships among theAnthropoidea is an important observation. Mac-romolecules may be as unambiguous a source ofphylogenetic information as any body of data. It isinteresting that within each life form a history of thatform is encoded. We need only to know how to readthe enclosed message.
AcknowledgementThe author wishes to thank V.M. Sarich for help in
both the research and in the writing of this article. Dr.A. Wilson generously provided laboratory space.
Thanks go to A. Hill and P. Hornbeck for technicalassistance. L. Brunker generously aided in the prep-
aration of the technical illustrations. Thanks also go to
E. Meikle, N. Boaz and L. Brunker in editing andcommenting on the drafts of the manuscripts. T. Cordgenerously provided her time in typing the manus-
cript.
REFERENCES CITED
Barnicot, N.A., and P.T. Wade 1970 Protein Structureand the Systematics of Old World Monkeys. In OldWorld Monkeys: Evolution, Systematics and Be-havior, J.R. Napier and P.H. Napier, eds. NewYork: Academic Press.
Boyer, S.H. et al. 1971 Primate Haemoglobins: SomeSequence and Some Proposals Concerning theCharacter of Evolution and Mutation. Biochem.Genetics 5:405-448.
Champion, A.C., E.M. Prager, D. Wachter, and A.C.Wilson 1974 Microcomplement Fixation. InBiochemical and Immunological Taxonomy ofAnimals, C.A. Wright, ed. London: AcademicPress.
Clemens, W.A. 1974 Purgatorius, An EarlyParomomyid Primate (Mammalia). Science184:903-905.
Cronin, J.E. 1975 Molecular Systematics of the OrderPrimates. Ph.D. Dissertation, University of Califor-nia, Berkeley.
Cronin, J.E., and V.M. Sarich 1975 Molecular Sys-tematics of the New World Monkeys. J. HumanEvol. 4:357-375.
Cronin,J.E., V.M. Sarich and E. Dempster 1977 Ratesof Molecular Evolution in the Primates. Unpub-lished Manuscript.
Delson, E. 1975 Evolutionary History of the Cer-copithecidae. In Approaches to Primate Paleobiol-ogy, F. Szalay, ed. Contrib. Primate. 5:167-217.
Delson, E., and P. Andrews 1975 Evolution and Inter-relationships of the Catarrhine Primates. InPhylogeny of the Primates, W.P. Luckett and F.S.Szalay, eds. New York: Plenum.
Doolittle, R.F., G.C. Wooding, Y. Sen, and H. Riley1971 Hominoid Evolution as Judged by Fib-rinopeptide Structures. J. Molec. Evol. 1:74-83.
Farris, J.S. 1970 Methods for Computing WagnerTrees. Syst. Zool. 19:83-92.
Fitch, W.H. and E. Margoliash 1967 Construction of
Phylogenetic Trees. Science 155:279-284.Goodman, M. and W. Moore 1971 Immunodiffusion
Systematics of the Primates. I. The Catarrhines.Syst. Zool. 20:19-62.
Goodman, M., and G.W. Moore 1974 Phylogeny ofHaemoglobin. Syst. Zool. 32:508-532.
Gorman, G.C., A.C. Wilson and M. Nakanishi 1971 ABiochemical Approach the Study of Reptili?nPhylogeny: Evolution ofSerum Albumin and LacticDehydrogenase. Syst. Zool. 20:167-185.
Hershkovitz, P. 1970 Notes on Tertiary PlatyrrhineMonkeys and Description of a New Genus from theLate Miocene of Columbia. Folia Primat. 12:1-37.1972 The Recent Mammals of the Neotropical Reg-ion: A Zoogeographic and Ecological Review. In
Evolution, Mammals and Southern Continents, A.Keast, F.C. Erk and B. Glass, eds. Albany: StateUniversity of New York Press.
8 3
Hoffstetter, R. 1972 Relationship, Origins and Historyof the Ceboid Monkeys and Caviomorph Rodents:A Modern Reintrepretation. In Evolutionary Biol-ogy, Vol. 6, T. Dobzhansky, M.K. Hecht and W.C.Steere, eds. New York: Appleton, Century Crofts.
Hoyer, B.H., N.W. van de Velde and M. Goodman1972 Examination of Hominoid Evolution by DNASequence Homology. J. Human Evol. 1:645-649.
Kohne, D.E., J.A. Chiscon, and B.H. Hoyer 1972Evolution of Primate DNA Sequences. J. HumanEvol. 1:627-644.
Mao, Shao-hsien, and H.C. Dessauer 1971 SelectivelyNeutral Mutations, Transferrins and the Evolutionof Natricine Snakes. Comp. Biochem. Phys.40:669-680.
Maxson, L., and A.C. Wilson 1974 Convergent Mor-phological Evolution Detected by Studying Proteinsof Tree Frogs in the Hyla exemia Species Group.Science 185:66-68.1975 Albumin Evolution and Organismal Evolutionin Tree Frogs (Hylidae). Syst. Zool. 24:1-15.
Napier, J.R., and P.H. Napier 1967 A Handbook ofLiving Primates. New York: Academic Press.
Palmour, R.M., and H.E. Sutton 1971 VertebrateTransferrins, Molecular Weights, Chemical Com-position, and Iron Binding Studies. Biochem.10:4026-4032.
Prager, E.M., and A.C. Wilson 1971a The Depen-dence of Immunological Cross-Reactivity UponSequence Resemblances Among Lysozymes. J. Biol.Chem. 246:5978-5989.1971b The Dependence of Immunological Cross-Reactivity Upon Sequence Resemblance AmongLysozymes. II. Comparison of Precipitin and Mic-rocomplement Fixation Results. J. Biol. Chem.246:7010-7017.
Prager, E.M., A.H. Brush, R.A. Nolan, M. Nakanishiand A.C. Wilson 1974 Slow Evolution of Transfer-rin and Albumin in Birds According to Microcom-plement Fixation Analysis.J. Mol. Biol. 3:243-262.
Read, D. 1975 Primate Phylogeny, Neutral Mutationsand Molecular Clocks. Syst. Zool. 24:209-221.
Romero-Herrera, A.E., H. Lehmann, K.A.Joysey andA.E. Friday 1973 Molecular Evolution of Myoglo-bin and the Fossil Record: A Phylogenetic Synthe-sis. Nature 246:389-395.
Sarich, V.M. 1967 A Quantitative ImmunologicalStudy of Evolution of Primate Albumins. Ph.D. Dis-sertation. University of California, Berkeley.1968 Human Origins: An Immunological View. InPerspectives on Human Evolution, S.L. Washburnand P.C. Jay, eds. New York: Holt, Rinehart andWinston.1969a Pinneped Origins and the Rate of Evolutionof Carnivore Albumins. Syst. Zool. 18:286-295.1969b Pinneped Phylogeny. Syst. Zool. 18:416-422.
1970 Primate Systematics with Special Reference toOld World Monkeys: A Protein Perspective. In OldWorld Monkeys: Evolution, Systematics and Be-havior,J.R. Napier and P.H. Napier eds. New York:Academic Press.1973 The Grand Panda is a Bear. Nature 245:218-219.1974 Just How Old is the Hominid Line? Yearbookof Physical Anthropology 17:98-112.
Sarich, V.M., and A.C. Wilson 1966 Quantitative Im-munochemistry and the Evolution of Primate Al-bumins. Microcomplement Fixation. Science154:1563-1566.1967a Rates of Albumin Evolution in Primates.Proc. Nat. Acad. Sci. 58:142-148.1967b Immunological Time Scale for HominidEvolution. Science 158: 1200-1203.
Sarich, 'V.M., and J.E. Cronin 1977 Molecular Sys-tematics of the Primates. In Molecular Anthropol-ogy, M. Goodman and R. Tashian, eds. New York:Plenum (In Press.)
Simons, E.L. 1965 New Fossil Apes from Egypt andthe Initial Differentiation of Hominoidea. Nature205: 135-139.1967 The Earliest Apes. Sci. Amer. 217:28-35.1972 Primate Evolution. New York: Macmillan Co.
Stratil, A., and R.L. Spooner 1971 Isolation and Prop-erties of Individual Components of Cattle Trans-ferrin: The Role of Sialic Acid. Biochem. Gen.5:347-365.
Walker, A. 1972 The Dissemination and Segregationof Early Primates in Relation to Continental Con-figurations. In Calibration of Hominoid Evolution,W.W. Bishop and J.A. Miller, eds. New York: Scot-tish Academic Press.
Wallace, D.G. 1971 A Comparison of Amphibian Al-bumins. Taxonomic and Evolutionary Significance.
Ph.D. Dissertation, University of California, Ber-keley.
Wallace, D.G., M.C. King and A.C. Wilson 1972 Al-bumin Differences Among Ranid Frogs:Taxonomic and Phylogenetic Implications. Syst.Zool. 22:1-14.
Wallace, D.G., and A.C. Wilson 1972 Comparison ofFrog Albumins with That of Other Vertebrates. J.Mol. Evol. 2:72-86.
Wooding, G., and R. Doolittle 1972 Primate Fib-rinopeptides: Evolutionary Significance. J. Hum.Evol. 1:553-563.
Van Valen, L., and R.E. Sloan 1965 The Earliest Pri-mates. Science 150:743-745.
Wasserman, E. and L. Levine 1961 Quantitative Mic-rocomplement Fixation and Its Use in the Study ofAntigenic Structure by Specific Antigen-AntibodyInhibition. J. Immunology 87:290-295.
Wilson, A.C., and V.M. Sarich 1969 A Molecular TimeScale for Human Evolution. Proc. Nat. Acad. Sci.63:1088-1093.
8 4