serbia social assistance and child protection...
TRANSCRIPT

Report No. 35954-YU
Serbia Social Assistanceand Child Protection Note
June 20, 2006
Human Development Sector Unit Europe and Central Asia Region
Document of the World Bank _

Copyright (c) 2006 The International Bank for Reconstruction and Development/The World Bank 1818 H Street, N.W. Washington, D.C. 20433, U.S.A. [email protected] rights reserved.
First Printing: June 2006
World Bank Working Papers are published to communicate the results of the Bank’s work to the development community with the least possible delay. The manuscript of this paper therefore has not been prepared in accordance with the procedures appropriate to formally-edited texts. Some sources cited in this paper may be informal documents that are not readily available. The findings, interpretations, and conclusions expressed herein are those of the author(s) and do not necessarily reflect the views of the International Bank for Reconstruction and Development/The World Bank and its affiliated organizations, or those of the Executive Directors of The World Bank or the governments they represent. The World Bank does not guarantee the accuracy of the data included in this work. The material in this publication is copyrighted. Copying and/or transmitting portions or all of this work without permission may be a violation of applicable law. The International Bank for Reconstruction and Development. The World Bank encourages dissemination of its work and will normally grant permission promptly to reproduce portions of the work. For permission to photocopy or reprint any part of this work, please send a request with complete information to the Copyright Clearance Center, Inc., 222 Rosewood Drive, Danvers, MA 01923, USA, Tel: 978-750-8400, Fax: 978-750-4470, www.copyright.com . All other queries on rights and licenses, including subsidiary rights, should be addressed to the Office of the Publisher, The World Bank, 1818 H Street NW, Washington, DC 20433, USA, Fax: 202-522-2422, email: [email protected] .


The Serbia Social Assistance and Child Protection Note is a result of joint work of the World Bank and the Ministry of Labor, Employment and Social Policy, and provides a critical analysis of the current situation in terms of the work of the agencies providing social services and benefits at both the central and local levels. This study, which fully complements the Social Welfare Development Strategy and the Serbia Poverty Reduction Strategy, analyzes the current situation, and proposes new models for efficient provision of social assistance benefits, in light of the coming decentralization.
Belgrade, June 2006

TABLE OF CONTENTS
Acknowledgments........................................................................................................................... 5Overview......................................................................................................................................... 1
A. A Window of Opportunity ............................................................................................ 1 B. Strengthening the Safety Net ........................................................................................ 2 C. Streamlining Delivery................................................................................................... 4 D. Improving Responsiveness and Planning for Decentralization .................................... 5 E. Consolidating Social Benefits....................................................................................... 6
Chapter 1: Introduction -Social Assistance and Child Protection in Serbia........................... 12 A. Background and Objectives ........................................................................................ 12 B. Social Protection Programs and Expenditures............................................................ 17
Chapter 2: Does Serbia’s Safety Net Reach the Poor? ........................................................... 26 A. Coverage and Targeting.............................................................................................. 26 B. The Welfare Impact of Transfers................................................................................ 33 C. Strengthening the Safety Net ...................................................................................... 40
Chapter 3: Delivery of Social Assistance at the Local Level ................................................. 41 A. Implementation and Effectiveness.............................................................................. 41 B. Institutional Arrangements for Benefit Delivery: Roles and Responsibilities............ 41 C. Access and Outreach................................................................................................... 45 D. Consolidating Benefit Delivery .................................................................................. 50 E. Strengthening the Safety Net: Next Steps................................................................... 53
Chapter 4: Increasing Local Involvement in Social Welfare.................................................. 56 A. Introduction................................................................................................................. 56 B. Decentralization in Serbia........................................................................................... 56 C. Diversifying Social Service Provision: Increasing Community-Based Care ............. 60 D. Improving Social Service Delivery: Next Steps ......................................................... 63
Vice President: Shigeo Katsu Country Director: Orsalia Kalantzopoulos
Sector Director Charles C. Griffin Sector Manager: Arup Banerji
Task Team Leader: Dena Ringold

LIST OF TABLES Table 1: Consolidating the MOP and Child Allowances At-a-Glance .......................................... 8 Table 2: Social Assistance and Child Protection: Summary of Recommendations and Next Steps....................................................................................................................................................... 10 Table 1.1: Main Labor Market Indicators in Serbia, 2005 .......................................................... 17 Table 1.2: Social Assistance and Child Protection in Serbia, 2005, % of GDP .......................... 18 Table 2.1: Coverage of Social Protection Programs, 2003 (% of households)............................ 27 Table 2.2: Characteristics of MOP Beneficiaries, in Percent ...................................................... 28 Table 2.3: Incidence of the MOP and Child Allowances by Quintile (% of total transfers received by each sub-group) ......................................................................................................... 31 Table 2.4: Benefit Levels for Various Household Profiles, 2005................................................ 37 Table 3.1: Beneficiaries and CSW Staff Numbers in the Study Sites, 2006 ............................... 42 Table 3.2: Consolidating the MOP and Child Allowances at a Glance....................................... 52 Table 4.1: Social Expenditures by Municipality, 2004................................................................. 57 Table 4.2: Institutions by Type and Number of Beneficiaries on December 31, 2004 ............... 61 Table 4.3: Average Costs per Year for Residential and Non-residential Care (US dollars) ....... 62 Table 4.4: Distribution of Responsibilities by Target Group ...................................................... 63
LIST OF FIGURES Figure 1.1: Composition of Social Protection Spending in Serbia, 2005 .................................... 17 Figure 1.2: Social Assistance and Child Protection Spending in Comparison (% of GDP)........ 19 Figure 2.1: Coverage of Social Protection Systems, % of population receiving (latest available year) .............................................................................................................................................. 26 Figure 2.2: MOP, Child Allowance, and Caregiver’s Allowance Recipients (individuals) ........ 28 Figure 2.3: Trends in MOP Beneficiaries, January 2002 = 100 .................................................. 29 Figure 2.4: Evolution of MOP Beneficiary Numbers, April 2005 = 100 .................................... 29 Figure 2.5: Concentration Curves for Selected Social Welfare and Child Protection Programs, 2003............................................................................................................................................... 31 Figure 2.6: Targeting of Social Assistance Systems in Comparison........................................... 32 (CGH Index, Latest possible year)................................................................................................ 32 Figure 2.7: Poverty Headcount among Beneficiaries in 2003 – before and after transfers ......... 34 Figure 2.8: Cost-benefit Ratios for Social Welfare and Child Protection Programs, 2002 and 2003............................................................................................................................................... 34 Figure 2.9: Average Benefit Levels, 2005 ................................................................................... 35 Figure 3.1: Reasons for Not Applying for Benefits (% of Roma Household)............................. 46
LIST OF BOXES Box 1.1: Definitions..................................................................................................................... 13 Box 1.2: Qualitative Study of Social Assistance Delivery at the Local Level ............................ 15 Box 2.1: Coverage of Roma......................................................................................................... 30 Box 2.2: Alternative Targeting Methods for Social Assistance: The Proxy-Means-Test ............ 33 Box 2.3: What are Cash Benefits Worth? Views from Beneficiaries and Providers.................. 36 Box 2.4: Public Works and Workfare: An Alternative to the Unemployment Benefit? ............ 38

Box 3.1: Documents Required to Apply for MOP and Child Allowances.................................. 48 Box 3.2: Outreach to Roma through the Social Innovation Fund (SIF) ...................................... 50 Box 4.1: Decentralization of Social Welfare in Romania, A Cautionary Tale............................ 58 Box 4.2: Early Lessons from the Social Innovation Fund ........................................................... 64
LIST OF ANNEX TABLES Annex Table 1.1: Main Social Assistance and Child Welfare Programs, 2005 .......................... 21 Annex Table 1.2: Major Changes to the Social Welfare Laws (2001-2006)............................... 24

ACKNOWLEDGMENTS
This report was prepared by a team consisting of Dena Ringold (Team Leader), Christian Bodewig, Marina Petrovic, Maria-Laura Sanchez Puerta, and Tanja Boskovic, under the direction of Arup Banerji (Sector Manager, Human Development Economics) and Carolyn Jungr (Country Manager for Serbia and Montenegro). Peer reviewers from the World Bank were Philip O’Keefe and Aleksandra Posarac (ECSHD). Mathew Verghis and Ruslan Yemtsov (ECSPE) also provided helpful comments and inputs to the report.
The study benefited substantially from comments and contributions from the representatives of the Ministry of Labor, Employment, and Social Policy. The team would like to thank Minister of Labor, Employment, and Social Policy Slobodan Lalovi and his team for their excellent collaboration and partnership on this work.
The study incorporates findings from a qualitative study undertaken by the NGO Logos. The core team for research design, data analysis and final reporting included: Jelena Markovi(project coordinator), Smiljka Tomanovi (external consultant) and Jasmina Kijev anin (field coordinator).
Field research was undertaken by Petar Arbutina, Branka Kresoja and Dragan Miljkovi(in-depth interviews), Snežana Stankovi (focus groups), Miloš Radovanovi (focus groups and transcripts), CSW representatives, Barajevo, and NGO NSHC, Center for Human Rights Niš, Aurora and Nada (recruitment of groups and respondents), Tijana Rolovi , Suzana Simi , Marija Kovandži and Mirjana Kijev anin (monitoring team), Jelena Markovi and Smiljka Tomanovi(in-depth interviews at the national level) and Jasmina Kijev anin (in-depth interviews with key informant and coordination of research and monitoring team).
The team would also like to recognize the useful comments and contributions of all of those who participated in the discussion workshop in Belgrade on February 28, 2006. The feedback and discussions on an earlier version of this Note was extremely useful.

ABBREVIATIONS
ALMP Active Labor Market Program CSO Central Statistical Office CSW Center for Social Work ECA Europe and Central Asia EU European Union EPS Elektroprivreda SrbijeFBiH Federation of Bosnia and Herzegovina HBS Household Budget Survey IDP Internally Displaced Person LFS Labor Force Survey LSG Local Self-Government MLESP Ministry of Labor, Employment and Social Protection MOF Ministry of Finance MOP Material support for low income households (Materijalno obezbe enje
porodice)NES National Employment Service PRS Poverty Reduction Strategy RSO Republican Statistical Office SIF Social Innovation Fund SLS Serbia Living Standards Survey

________________________________________________________________________________________________________________________________________________
SSEERRBBIIAASSOOCCIIAALL AASSSSIISSTTAANNCCEE AANNDDCCHHIILLDD PPRROOTTEECCTTIIOONN NNOOTTEE
OOVVEERRVVIIEEWW
AAA... AAA WWWIIINNNDDDOOOWWW OOOFFF OOOPPPPPPOOORRRTTTUUUNNNIIITTTYYYSerbia’s social assistance and child protection system is at a turning point.1 In many ways
Serbia’s reforms in these areas have been more rapid and systemic than in other countries in the region. The legislative and strategic frameworks are in place. The Poverty Reduction Strategy and the Ministry of Labor, Employment and Social Policy’s new Strategy for the Development of the Social Welfare System in Serbia provide important starting points for further improvements. As the process of EU integration intensifies, Serbia faces significant opportunities to continue to modernize and improve the efficiency and effectiveness of its safety net over the longer-term.
Reforms need to build on the existing strengths. Serbia has a fully developed social protection system including insurance-based pensions and unemployment benefits, social assistance and child allowances, and an increasingly diverse array of social services. Social protection is an important source of income support for the population. In 2003 65 percent of the population received at least one social transfer.
The main social assistance program, the materijalno obezbe enje porodice (MOP) benefit is well-targeted and compares favorably with other means-tested benefits in the region, as well as in comparison with the other targeted cash benefits in Serbia, especially the child allowance. However, the main issues are its low coverage and low level of benefits, which limit the poverty alleviation impact of the program. Reforms are needed to increase the MOP program within the existing budget envelope for social protection. This is discussed here in the context of a package of reforms of social assistance and child protection. There is also scope to improve the targeting of the MOP through more concentrated outreach by social workers to poor households, and better dissemination about the program and its rules to potential beneficiaries.
In the area of social services, there is scope to build on the body of existing experience of local involvement in the design and implementation of services. The MLESP’s Social Innovation Fund (SIF) has amassed a wide range of experience in supporting innovative community based services to target vulnerable groups, including children-at-risk, the disabled, elderly and Roma. Lessons from the SIF can inform the on-going effort to shift social care from institutions to
1 In this report social assistance and child protection refer to the set of cash benefits and services targeted at the poor and vulnerable groups in Serbia. Within social assistance cash benefits, this study focuses on the two main targeted programs: the MOP benefit and the child allowances (Box 1.1).
1

community-based care, particularly in the context of growing involvement of local governments and NGOs in service provision.
This report proposes a set of reforms, consistent with the MLESP’s Strategy, aimed at improving the impact, efficiency, and responsiveness of Serbia’s social protection system, and ensuring fiscal sustainability. These include (i) strengthening the safety net for the poorest households, by shifting funding from poorly targeted programs to strengthen the well-targeted MOP program and making further improvements to targeting through piloting new approaches to identifying the poor; (ii) streamlining delivery and cost-efficiency by modernizing information systems and improving data; (iii) improving responsiveness of services and benefits and planning for decentralization by both strengthening the capacity of local governments to deliver benefits and services and the capacity of the central government to oversee quality and equity; and finally (iv) consolidating the two main targeted benefit programs in Serbia, the MOP and child allowances to improve overall effectiveness of the system. These reforms should be undertaken within the existing budget for social protection, with savings over the long-term from efficiency gains.
The next phase of reforms needs to emphasize consolidation of institutional arrangements and implementation, to build on the achievements of the first phase of reforms and to increase access and quality of services for the poor. The way forward includes a streamlined safety net of cash benefit programs combined with high quality social services tailored to Serbia’s most vulnerable. In particular, this will involve planning for growing local involvement in service delivery and simplifying administration, by reducing duplicative institutions and procedures and improving information through better collection and management of information.
BBB... SSSTTTRRREEENNNGGGTTTHHHEEENNNIIINNNGGG TTTHHHEEE SSSAAAFFFEEETTTYYY NNNEEETTTThere are opportunities for strengthening Serbia’s safety net for its poorest citizens.
These should include a combination of measures to expand the coverage, adequacy and targeting of social benefits and to improve responsiveness of social services to vulnerable groups. This will require shifting resources from untargeted and poorly targeted programs, to well targeted programs, as well as testing new approaches to improve targeting Reforms would affect institutional arrangements, benefit design and training and the roles and responsibilities of professional staff.
Scaling-up the MOP. Expanding the safety net is priority for Serbia. The impact of the MOP on poverty is limited by its low coverage – the benefit currently reaches only 3 percent of poor households. A substantial expansion of the program – within the existing envelope for social protection – is needed to ensure coverage of the poorest. This should entail a shift from spending on untargeted programs such as the birth grant – to the MOP. Increasing expenditures on the MOP beyond its current level of 0.14 percent of GDP is essential for ensuring an adequate safety net.
Tightening Targeting to the Poor. While the analysis demonstrates that the MOP is a well-targeted program, there is scope for improvement – particularly as the program is expanded and the risk of leakage of resources to the non-poor increases. For example, targeting based on income is likely to be underestimating household welfare in an environment of high informal employment. Piloting new targeting approaches such as proxy means-testing would be an important investment to improve the safety net for the poor. Within the targeting system, a
2

stronger reliance on asset tests may be required to retain the MOP’s targeting if its coverage expands. There is scope for learning from the positive results of MOP targeting to improve other programs. For example, lessons from MOP could be drawn upon to improve targeting of child allowances. Similarly, the MOP could be used as a base benefit for targeting of other benefits, such as health insurance.
Promoting Work Incentives. Increasing the size of the MOP program should not encourage greater welfare dependency or detract from efforts to expand labor market opportunities. Experience from Bulgaria shows that work incentives can be improved if social assistance is linked to adequate and accessible training and employment programs, while the size of the benefit decreases when such offers are refused. This will require stronger institutional alignment between Centers for Social Work (CSWs) and local Employment Offices over the longer-term.
The existing rule of limiting MOP receipt for beneficiaries capable of working to nine months in a year is not achieving its objective of increasing work incentives. The nine month rule eliminates a stable income source for poor households for a three month period. It has administrative costs, as CSWs often end up making one-time “emergency” payments to these families. There are also equity considerations, as not all CSWs have additional resources needed to pay the stop-gap benefits. Eliminating the 9 month rule and building in work incentives, including eventually through closer links with active labor programs as these are strengthened and scaled-up has the potential to improve efficiency and equity. The resources would be more effectively allocated to activation measures aimed at increasing employment.
Outreach to the Poor… A limitation of the current system is the absence of opportunities and incentives for CSW social workers to visit poor households and communities to identify and respond to their needs. This is important to improve the targeting of the MOP program – as the analysis indicates that lack of information about the program is a barrier to applying for some poor households – as well as for referrals to other social services and programs. Outreach should be an integral part of the work of CSWs, to facilitate access to both cash benefits and social services. Social workers need professional training in working with vulnerable groups, including attention to the specific needs of Roma, IDPs and refugees, as well as access to vehicles to reach their clients. Training on how to conduct home visits to assess benefit eligibility is important for staff in both CSWs and local governments (LSGs).
Especially to Roma and other Excluded Groups. Focused efforts are needed to ensure that outreach is intensified in Roma settlements and other excluded communities, not generally visited by social workers. CSWs and municipal authorities as well as Roma associations can benefit from experience from the Social Innovation Fund (SIF), which has piloted new ways of social service delivery and management in partnership with NGOs, including support for outreach to Roma communities. The CSWs are also possibly a key tool in overcoming barriers to access such as lack of registration documents.
Focusing CSWs on Social Work. There is a need for a renewed emphasis on the capacity of CSWs to meet the needs of vulnerable groups through strengthened social work functions. This will require attention to human resources, to strengthen the professional skills of staff in CSWs, and to revise the outdated staffing norms for CSWs, based upon the actual workload. The formal function of a facilitator who can guide clients through the complex system of benefits and services, advice on applicable support and help with obtaining the relevant documentation
3

required has been successfully introduced in the US and other countries to help marginalized groups to better access social services and benefits. While in Serbia the CSWs are in principle expected to take on this role, it is important to make staff available for this, as otherwise the role is at risk of being crowded out by other activities, and to train staff for this work. Alternatively, NGOs could also assume this role in partnership with the CSWs.
Simplifying Documentation Requirements for Social Benefits. Applications for MOP and child allowances require extensive documentation, burdening beneficiaries and providers alike. In addition to the extensive number of documents, there are requirements for frequent rechecking (e.g. every six months in some cases).2 A preferred option would be to unify the document requirements for MOP and child allowances. This would be facilitated by administrative consolidation or, if possible, unifying the two benefits. Regardless of changes to program design and institutional responsibilities, the documentation requirements should be updated and simplified. A first step would be to eliminate requirements for twice-yearly verification of documents for birth certificates and other documents that do not change over time.
Ensuring Registration of Roma IDPs. Roma households, and particularly Roma IDPs often lack the most basic form of documentation – residential and citizenship documents. Tackling the lack of citizenship and residential registration is challenging given complex associated legal dimensions. These issues lie beyond the scope of this report. Authorities need to intensify efforts to ensure residential registration of Roma, including those residing in settlements and in particular Roma IDPs, to ensure access to municipal services even without legalizing such settlements. While a new and comprehensive registration effort is required in the long-term, allowing Roma households to access residential and citizenship registration documents, as well as birth certificates and marriage licenses, temporary solutions are needed in the short term. This could involve applying temporary registration through the municipal CSWs or allocating temporary numbers to households instead of addresses.
CCC... SSSTTTRRREEEAAAMMMLLLIIINNNIIINNNGGG DDDEEELLLIIIVVVEEERRRYYYMeasures to streamline and simplify delivery of benefits and services are important for
increasing the efficiency and quality of social welfare services. These actions should be coordinated with the institutional reforms discussed in the following section, to support the move to a modern and more effective social welfare system.
Upgrading Information Systems. There is much to be gained from improving the quality and availability of information on the administration of social benefits and social services. Within the MLESP system, there is currently no shared database for managing the MOP program or other social benefits. Each CSW keeps its own records, either on its own computers or on paper. Similarly, there are no shared databases with other institutions involved in social protection – for example with local governments, labor offices, or the social insurance administration. A networked inter-agency information system would improve targeting – by maintaining current information about the eligibility status of beneficiaries. Such a system should pay close attention to protecting the privacy of the population, through close attention to confidentiality of individual records and adherence with national privacy guidelines.
2 See Box 3.1 for a complete account of paperwork requirements.
4
Improving Survey Data. A related issue is the need to improve survey data for monitoring and evaluating the effectiveness of social protection programs. This report underscores the limitations of the current databases. In particular, the HBS survey does not include sufficiently detailed questions on benefit programs to allow for analysis of the performance of specific programs. Similarly, the sample size of the HBS is too small for disaggregated analysis. The on-going efforts to improve the HBS as the main tool for poverty analysis in Serbia need to continue, with specific attention to expanding the module on social benefits, and considering the use of periodic booster surveys of the beneficiary populations to allow for detailed analysis. Such longitudinal data will be essential for monitoring the impact of future reforms.
Implementing Public Communications. Better analysis can also improve public awareness about the social welfare system in Serbia. This is important for two main reasons: first, to improve access, since a sizeable share of the eligible population do not apply for MOP benefits because they lack information about the programs and how to apply; and second, to increase awareness among the public at large regarding the objectives and impact of social welfare programs in order to overcome the stigma associated with receiving social benefits.
DDD... IIIMMMPPPRRROOOVVVIIINNNGGG RRREEESSSPPPOOONNNSSSIIIVVVEEENNNEEESSSSSS AAANNNDDD PPPLLLAAANNNNNNIIINNNGGG FFFOOORRRDDDEEECCCEEENNNTTTRRRAAALLLIIIZZZAAATTTIIIOOONNN
The Ministry’s Strategy for the Development of the Social Welfare System emphasizes the increasing role that local governments have to play in social welfare. This is consistent with the direction of the government as a whole, as decentralization is increasingly high on the policy agenda in Serbia. At the time of writing, framework legislation on property rights and intergovernmental finance were under discussion, as part of establishing the legislative framework for decentralization. Decentralization is also important for European integration, which calls for greater local and regional autonomy and involvement in service delivery, and provides strong fiscal incentives to decentralize, through allocation of resources to local levels of government.
Decentralization has the potential to improve social service delivery, by bringing services closer to clients and strengthening the capacity of local governments and providers to plan and deliver services, and to monitor outcomes. However, it also entails risks, particularly for social welfare. In the absence of sufficient attention to local resources and capacity, decentralizationcan lead to an erosion of services. It can also deepen geographic inequalities – if poorer municipalities with the least resources are unable to maintain services.
Ensuring Sustainable Financing. Lessons from other countries in the region underscore the need to maintain central budget financing for social welfare until a well-functioning intergovernmental fiscal system that ensures adequate, sustainable and equitable financing of benefits and programs across municipalities is in place.3 Without earmarked financing sources there is a high risk that funds designated for social assistance programs will be diverted elsewhere. There is also a risk that the poorest municipalities with the greatest need will have the
3 After bad experience with the decentralization of cash transfer financing in the late 1990s, Romania recentralized social assistance financing in 2002. Meanwhile, in Bosnia and Herzegovina decentralized financing mechanisms have resulted in substantial inter-regional disparities in coverage, with the poorer localities providing the least amount of services.
5
most limited resources available for social assistance, leading to a vicious circle in which funds are not available to those who need them the most.
Coordinating Between Central and Local Governments. Stronger partnerships and better coordination between the central government, LSGs, and improved coordination across sectors (e.g. social protection, employment, education, health, police, justice, etc.) is important for improving social service delivery. Implementation of the Social Welfare Strategy will provide a good opportunity for inter-ministerial cooperation and facilitate more integrated social policy at the local level. The Social Innovation Fund (SIF) provides valuable examples of coordinated approaches across government levels, agencies and with other partners including NGOs.
Implementing and Monitoring Quality Standards. Quality assurance could be improved through development and improvement of organization and management across the sectors, setting the right incentives for managers and staff and better coordination of service delivery. The relative roles of central and local governments in implementing quality standards need to be clearly defined to ensure a framework for improvements through: improved incentives, shared interpretation of the standards, training and education of staff, periodic assessments, codes of ethics, and quality management tools. In addition, a system of permanent professional promotion and training for all employees in CSWs and other social welfare institutions could be established and case management introduced.
Performance indicators should be used to assess services and the impact of cash transfers. The key would be to select a small number of measurable indicators, including the quality of performance to support the implementation of an adequate monitoring system. Monitoring and evaluation of social welfare programs has been weak and irregular in the past and the capacity of central and local governments has to be strengthened through capacity building. Standardized reporting systems are needed.
Diversifying Services Providers: NGOs and Private Involvement. The NGO and private sector have an increasing role to play in social service delivery as decentralization proceeds. Attention is needed to ensure that the framework for planning, contracting and quality assurance is in place. Capacity building to handle this increasing diversity of providers will be required both at the central and local government levels. A starting point is a framework NGO Law. The MLESP also needs to develop.
EEE... CCCOOONNNSSSOOOLLLIIIDDDAAATTTIIINNNGGG SSSOOOCCCIIIAAALLL BBBEEENNNEEEFFFIIITTTSSSThere is scope for consolidating the two main cash benefit programs in Serbia, which are
currently administered by different agencies: the MOP by Centers for Social Work (CSWs) and the child allowances by local self governments (LSGs).4 This division of responsibilities has significant costs, including duplicative administrative structures, staff and office space. Parallel institutions for the means-tested benefits also impose costs on beneficiaries who need to mobilize separate applications and sets of documentation for each benefit, and on providers who end up spending a disproportionate amount of time on paperwork. No mechanisms are currently in place
4 CSWs are branch offices of the Ministry of Labor, Employment and Social Protection. There are 135 CSWs in Serbia. LSGs are municipalities, there are currently 167 LSGs.
6

for coordinating and sharing information between agencies, which would facilitate the work of both institutions and reduce errors of inclusion and exclusion.
While there is agreement on the need for reform, there is less consensus on the preferred organizational model and next steps. This is largely because there are many options, and the information base needed to evaluate and choose from them is not in place. Consolidation could involve actual merging of the two benefit programs into a single benefit, or keeping the programs separate and merging administrative functions – either under the CSWs or LSGs. Such changes will require careful attention to roles and responsibilities for administering and financing the benefits – issues that need to be considered in the overall context of increasing decentralization of social welfare in Serbia.
Qualitative research conducted for this study revealed a wide range of views on the topic of benefit consolidation. Many CSW staff would gladly transfer the bureaucratic tasks of benefit administration – especially checking documents and filling out paperwork to the municipalities, to allow them to focus on their social work tasks. On the other hand, they are also concerned about the lack of capacity within the municipalities, and worry that they would lose touch with their clients if they no longer came to the CSWs to file their MOP applications.
Finally, such reforms should ensure that the achievements of the current system are not lost. The MOP is a well-targeted benefit, which does reach the poor, while the targeting of child allowances is less successful. Consolidation – whether through actual merging of the benefits, or through combining the administrative functions – should be done carefully, to improve the targeting of both benefits.
A Single Consolidated Benefit? The PRS, launched in 2003, proposed, as an option, “the integration of the social assistance and child allowances into a single unique transfer that could be called a family allowance.”5 The idea of a single consolidated welfare benefit, which would take into account various household characteristics in determining benefit levels has been gaining currency in other countries. This option would be the most desirable.
A single welfare benefit would have one set of rules, administrative and institutional requirements, and source of funding. It would be transparent, low on administrative costs, and easy to communicate and understand. A single benefit could incorporate the objective of providing increased support to families with children through a benefit formula that would provide higher benefits based on the number and age of children in the family. Such an approach is currently used in Bulgaria within its guaranteed minimum income benefit system.
However, a single benefit may not be as desirable from a political economy perspective if it created the perception that child allowances were being eliminated. Child allowances in Serbia – although means-tested – have twin objectives of providing income support to the poor, as well as supporting families with children. In the context of declining fertility, support for child-rearing has a political component. A well-designed public information campaign could facilitate the reform by clearly communicating that the consolidated benefit maintains the same objectives of the child allowance, with strengthened support to the poorest families.
Responsibility for delivering the unified family allowance could be with either the LSGs or CSWs. As discussed below, the LSGs would have a comparative advantage in being the lead institution for delivering the allowance.
5 Poverty Reduction Strategy Paper for Serbia, 2003.
7

8
Delegating MOP Administration to Local Governments. A second best option would be to maintain the two separate benefits and transfer responsibility for delivery of the MOP program to LSGs. This would have the benefit of reducing administrative costs, simplifying procedures for both beneficiaries and providers, and freeing social workers from verifying documentation and paperwork. Such delegation would require careful planning, to ensure that there is sufficient staff capacity in LSGs to handle the increase workload. This could include transferring some of the staff currently working on MOP in the CSWs to the LSGs. A key question to be resolved would be whether LSG staff would conduct the field visits for verifying the income and assets of beneficiaries, or whether this would continue to be done by CSW social workers.
Regardless of whether field visits are done by social workers sitting in CSWs or LSGs, close coordination between the two institutions will be essential. The CSW, as the agency with main responsibility for assisting vulnerable groups, has the mandate and capacity to work closely with beneficiaries and respond to their needs. Field visits for verifying MOP should be closely coordinated with fieldwork by social workers to provide outreach and referral services – especially for clients (e.g. elderly and the disabled) who are unable to travel to apply for benefits.
Consolidating Benefit Delivery in CSWs. A third option would be to consolidate responsibility for delivering MOP and child allowances within the CSWs. This would have all of the benefits of administrative consolidation. However, as there are fewer CSW offices than LSGs, it would leave beneficiaries with fewer locations to apply for benefits, increasing transportation costs. It would also require a substantial increase in administrative staff capacity in CSWs to handle large number of applications for child allowances (e.g. 485,000 children received benefits in 2005).
On the other hand, transferring responsibility for delivering the child allowance to CSWs could build on the successful experience of targeting the MOP, and potentially improve targeting of child allowances by drawing on the existing capacity. It would allow for a “one-stop” shop approach for beneficiaries with cash benefits and services merged into one office.
Table 1: Consolidating the MOP and Child Allowances At-a-Glance Option Pros Cons Key Preconditions and
Considerations
(i) Create a single benefit Reduce documentation requirements; Reduce administrative costs;Simplify procedures; Improve targeting by reducing opportunities for errors across two programs.
Political economy concerns (e.g. that child benefits are being eliminated).
Benefit design needs to incorporate extra support to families with children; Public information campaign; Should LSGs or CSWs deliver? See below.
(ii) LSGs administer both benefits
Simplify procedures, reduce costs; Build on LSG capacity;Take advantage of local knowledge.
Potential weakening of targeting if CSW expertise in means-testing is not utilized.
Adequate staffing to cover workload (potential transfer of CSW staff); Coordination with CSWs on fieldwork; Information-sharing with CSWs; Coordination on field

9
visits, referrals to social services.
(iii) CSWs administer both benefits
Build on successful CSW targeting of MOP; Take advantage of CSW capacity for means-testing; Link MOP with social services and other CSW provided benefits through a “one-stop shop” approach.
Increase transport costs (fewer offices); Greater administrative burden for CSWs. Reduces LSG involvement in social welfare.
Adequate staffing to cover workload (potential transfer of LSG staff).
Choosing a Way Forward. The information needed to make choices about where to locate responsibility for benefit administration is not yet available. A more detailed analysis of the current administrative costs of delivering MOP and child allowances in CSWs and LSGs is needed – including staff and other associated costs (e.g. office space, equipment, vehicles), and opportunity costs. A feasibility study looking at the costs of the three main options and the existing capacity is needed. This should investigate options for coordinating or sharing responsibility for field work between the LSGs and CSWs, and how referrals to social services could work. Such a study could develop a set of options for piloting and evaluation in a subset of municipalities, prior to the development of a national plan and roll-out.

Tab
le 2
: So
cial
Ass
ista
nce
and
Chi
ld P
rote
ctio
n: S
umm
ary
of R
ecom
men
datio
ns a
nd N
ext S
teps
Is
sue
Polic
y A
ctio
ns
Exp
ecte
d O
utco
me
Indi
cato
rs
Res
pons
ible
Age
ncy
Stre
ngth
enin
g th
e Sa
fety
Net
Lo
w p
over
ty a
llevi
atio
n im
pact
of
the
MO
P so
cial
ass
ista
nce
prog
ram
.
Incr
ease
tota
l spe
ndin
g to
ex
tend
cov
erag
e an
d in
crea
se
bene
fit le
vels
; rea
lloca
te
reso
urce
s fro
m u
ntar
gete
d pr
ogra
ms.
Incr
ease
d co
vera
ge,
adeq
uacy
.C
over
age
(% o
f hou
seho
lds
rece
ivin
g M
OP)
; Ad
equa
cy (%
of b
enef
its in
ho
useh
old
cons
umpt
ion)
.
MO
F, M
LESP
Lim
ited
wor
k in
cent
ives
St
reng
then
link
s bet
wee
n M
OP
and
activ
e la
bor m
arke
t m
easu
res.
Incr
ease
d op
portu
nitie
s for
M
OP
bene
ficia
ries t
o pa
rtici
pate
in A
LMPs
.
% o
f MO
P be
nefic
iarie
s pa
rtici
patin
g in
em
ploy
men
t pr
ogra
ms.
MLE
SP, C
SWs a
nd N
ES
Off
ices
Lack
of o
utre
ach
by so
cial
w
orke
rs to
the
poor
Pr
ofes
sion
al d
evel
opm
ent,
train
ing
for C
SW st
aff i
n ou
treac
h an
d w
ork
with
vu
lner
able
gro
ups;
bet
ter
acce
ss to
veh
icle
s.
Gre
ater
invo
lvem
ent o
f C
SWs i
n co
mm
uniti
es.
# of
fiel
d vi
sits
. #s
of r
efer
rals
to so
cial
se
rvic
es.
MLE
SP, C
SWs
Exte
nsiv
e do
cum
enta
tion
requ
irem
ents
for c
ash
bene
fit
elig
ibili
ty.
Rev
iew
, red
uce,
and
co
nsol
idat
e do
cum
ent
requ
irem
ents
for M
OP
and
child
allo
wan
ces.
Elim
inat
e re
quire
men
ts fo
r ver
ifyin
g do
cum
ents
that
will
not
cha
nge
(e.g
. birt
h ce
rtific
ates
).
Red
uced
indi
rect
cos
ts fo
r be
nefic
iarie
s; re
duce
d ad
min
istra
tive
cost
s, tim
e sp
ent o
n ad
min
istra
tion
by
soci
al w
orke
rs.
Adm
inis
trativ
e co
sts o
f ben
efit
prog
ram
s. %
of t
ime
spen
t by
soci
al
wor
kers
che
ckin
g do
cum
ents
; tra
nspo
rtatio
n co
sts o
f be
nefic
iarie
s.
MLE
SP, C
SWs,
LSG
s.
Gap
s in
cove
rage
of n
on-
regi
ster
ed p
opul
atio
ns (e
.g.
Rom
a, ID
Ps, r
efug
ees)
.
Ensu
re a
cces
s to
docu
men
tatio
n on
resi
denc
y an
d ci
tizen
ship
, con
side
r te
mpo
rary
regi
stra
tion
thro
ugh
LSG
s.
Incr
ease
d co
vera
ge o
f non
-re
gist
ered
pop
ulat
ions
. %
of n
on-r
egis
tere
d R
oma,
ID
Ps, r
efug
ees;
M
OP
and
child
allo
wan
ce
cove
rage
of t
hese
gro
ups.
MLE
SP, L
SGs,
Min
istry
of
Inte
rior.
Stre
amlin
ing
Del
iver
y, In
crea
sing
Effic
ienc
y D
uplic
ativ
e st
ruct
ures
for
deliv
erin
g M
OP,
chi
ld
allo
wan
ces.
Feas
ibili
ty st
udy;
cap
acity
re
view
; pilo
ting
of d
iffer
ent
optio
ns (e
.g. s
ingl
e be
nefit
; LS
G d
eliv
ery;
CSW
del
iver
y).
Plan
for e
ffic
ient
del
iver
y of
mai
n so
cial
ass
ista
nce
prog
ram
s.
Cos
ts/b
enef
its o
f diff
eren
t m
odel
s. M
LESP
, MO
F, C
SWs,
LSG
s.
No
unifi
ed d
atab
ase
for s
ocia
l be
nefit
pro
gram
s or s
ocia
l se
rvic
es.
Dev
elop
men
t of a
net
wor
ked
inte
r-ag
ency
info
rmat
ion
syst
em.
Impr
oved
targ
etin
g of
be
nefit
s; k
now
ledg
e of
lo
cal n
eeds
; red
uctio
n of
ad
min
istra
tive
cost
s.
Adm
inis
trativ
e co
sts o
f ben
efit
prog
ram
s. Ta
rget
ing:
% o
f poo
r re
ceiv
ing
bene
fits;
Ta
ke-u
p ra
tes:
% o
f elig
ible
be
nefic
iarie
s rec
eivi
ng
MLE
SP, M
OF,
CSW
s, LS
Gs.
10

11
Polic
y A
ctio
ns
Exp
ecte
d O
utco
me
Indi
cato
rs
Res
pons
ible
Age
ncy
Issu
ebe
nefit
s. Po
or d
ata
for m
onito
ring
soci
al
wel
fare
pro
gram
s. Im
prov
emen
ts to
HB
S:
stre
ngth
ened
mod
ule
on so
cial
be
nefit
s; b
oost
er sa
mpl
es o
f be
nefic
iarie
s of s
ocia
l pr
ogra
ms.
Rep
eat o
f 200
3 SL
S.
Bet
ter i
nfor
mat
ion
for
budg
etin
g, p
olic
y de
sign
, an
d m
onito
ring
outc
omes
.
Dat
a av
aila
ble
for o
utco
me
anal
ysis
(e.g
. of c
over
age,
ta
rget
ing,
ade
quac
y, ta
ke-u
p).
MLE
SP, C
SO, C
SWs,
LSG
s.
Lim
ited
awar
enes
s of b
enef
it pr
ogra
ms a
nd e
ligib
ility
cr
iteria
. Stig
ma
asso
ciat
ed w
ith
rece
ivin
g be
nefit
s.
Publ
ic in
form
atio
n ca
mpa
ign
targ
eted
at t
he g
ener
al
popu
latio
n an
d th
e po
or in
pa
rticu
lar.
Impr
oved
aw
aren
ess,
supp
ort f
or re
form
s, re
duce
d st
igm
a.
Targ
etin
g of
ben
efits
to th
e po
or; %
of p
opul
atio
n aw
are
of p
rogr
ams a
nd e
ligib
ility
cr
iteria
.
MLS
P, C
SWs,
LSG
s.
Impr
ovin
g Re
spon
siven
ess:
Pre
parin
g fo
r Dec
entra
lizat
ion
Nee
d fo
r a su
stai
nabl
e pl
an fo
r de
cent
raliz
atio
n.
Inte
rgov
ernm
enta
l app
roac
h de
velo
ped
for i
ncre
asin
g fis
cal
and
adm
inis
trativ
e de
cent
raliz
atio
n. F
ram
ewor
k in
clud
ing
legi
slat
ion
on
inte
rgov
ernm
enta
l fin
ance
, pr
oper
ty ri
ghts
, loc
al p
ublic
ad
min
istra
tion.
Cle
ar p
lan
for p
hase
d de
cent
raliz
atio
n.
% o
f ser
vice
s fin
ance
d an
d ad
min
iste
red
by lo
cal
gove
rnm
ents
; mec
hani
sm fo
r eq
ualiz
ing
reso
urce
s acr
oss
LSG
s.
MO
F, M
LSEP
, LSG
s.
Eros
ion
of fi
nanc
ing
for s
ocia
l se
rvic
es in
poo
r mun
icip
aliti
es.
Mai
ntai
n ce
ntra
lized
fina
ncin
g fo
r soc
ial w
elfa
re u
ntil
inte
rgov
ernm
enta
l fin
anci
ng
arra
ngem
ents
are
in p
lace
.
Cen
tral f
inan
cing
of c
ore
soci
al b
enef
its a
nd se
rvic
es.
% o
f LSG
ben
efits
spen
t on
soci
al w
elfa
re.
MO
F, M
LSEP
, LSG
s.
Wea
k im
plem
enta
tion
of
qual
ity st
anda
rds f
or so
cial
se
rvic
e pr
ovis
ion.
Trai
ning
for C
SW w
orke
rs a
nd
man
ager
s in
mon
itorin
g qu
ality
stan
dard
s; in
cent
ives
bu
ilt in
to p
erfo
rman
ce
revi
ews;
mon
itorin
g ar
rang
emen
ts.
Impr
oved
qua
lity
of so
cial
se
rvic
es.
Com
plia
nce
with
MLE
SP
qual
ity st
anda
rds.
MLE
SP, C
SWs,
LSG
s.
Lack
of f
ram
ewor
k fo
r N
GO
/priv
ate
sect
or
invo
lvem
ent i
n so
cial
serv
ices
.
NG
O la
w, r
egul
atio
ns o
n co
ntra
ctin
g.
Gre
ater
div
ersi
ty o
f ser
vice
pr
ovid
ers.
#s o
f NG
Os a
nd p
rivat
e or
gani
zatio
ns p
artic
ipat
ing
in
soci
al se
rvic
e de
liver
y.
MLE
SP.

CHAPTER 1: INTRODUCTIONSOCIAL ASSISTANCE AND CHILD
PROTECTION IN SERBIA AAA... BBBAAACCCKKKGGGRRROOOUUUNNNDDD AAANNNDDD OOOBBBJJJEEECCCTTTIIIVVVEEESSS
Since 2001, the Government has enacted major reforms of social assistance and child protection, including introducing new legislation on social assistance cash benefits and child allowances, and a new Family Law – which was the first such revision in over 20 years.6 These reforms have entailed, inter alia, means-testing of previously untargeted child allowances, changes to the eligibility criteria and benefit levels for the main social assistance cash benefit (the MOP) and an improved legislative framework for foster care. Reforms of social services have included the establishment of a Social Innovation Fund (SIF) for supporting community driven social services. The SIF is unique in the region for its focus on supporting partnerships between local self-governments and NGOs, and its objective of scaling-up local innovations in service delivery into national policy.
With the increased focus on preparations for EU accession, Serbia faces new opportunities to strengthen its social welfare system. The way forward includes a streamlined safety net of cash transfer programs combined with high quality social services tailored to Serbia’s most vulnerable groups. The next phase of reforms will build on the legislative reforms and focus on rethinking organization and administration to improve effectiveness and efficiency. The Ministry of Labor, Employment and Social Protection (MLESP) is charting its next phase of reforms. In December 2005 it launched a new “Strategy for the Development of the Social Welfare System,” which outlines reform directions in the sector with a particular focus on decentralization and increasing the responsibilities of local governments in social welfare provision. The Strategy builds on the priorities outlined in Serbia’s Poverty Reduction Strategy (PRS).7
Decentralization entails rethinking institutional arrangements, the roles and responsibilities of actors involved in delivering social assistance and child protection, the incentives that they face, and intergovernmental financial arrangements. It also requires attention to the quality of delivery and equity– to ensure that all local governments are able to finance and deliver an adequate social safety net to help the poor.
Objectives and Scope
The objective of this Social Assistance and Child Protection Note is to take stock of the status of the existing social welfare programs for the poorest households in Serbia in order to inform the upcoming reforms envisaged under the Social Welfare Strategy and the PRS. It formulates policy recommendations and next steps for the Government and for donor involvement, including that of the World Bank. Recommendations are based on analysis of
6 The reforms are summarized in Annex Table 1.2. 7 The Government of Serbia launched its Poverty Reduction Strategy in 2003.
12

existing data sources as well as a qualitative assessment of delivery at the local level conducted especially for this report (discussed below).
The focus of the analysis and recommendations is the social assistance and child protection cash benefits and services, which make up Serbia’s social welfare system (Box 1.1). Within these programs, it looks most closely at the two main cash transfer programs – the MOP benefit and child allowances. These programs are of critical importance for combating poverty and social exclusion. As Serbia moves close to EU integration, ensuring the effectiveness, sustainability and equity of these programs is an increasing priority. Social insurance programs, including pensions and unemployment insurance are discussed in the context of the overall fiscal envelope for social protection, and their impact on poverty, but are not a main focus. Other in-kind social protection measures, such as the winter energy subsidy program for the poor implemented by the energy company, Elektroprivreda Srbije (EPS) is not addressed.8
Social services for vulnerable groups, particularly for children-at-risk, the elderly the disabled, IDPs, refugees and Roma are an important part of Serbia’s social welfare system. While this report does not provide an in-depth analysis of the issues facing social services in Serbia, it takes stock of some of the main issues and discusses challenges, particularly around the implications for further decentralization in Serbia. Social work is also not covered comprehensively in this report. A number of key issues are raised pertaining to the roles and responsibilities of professionals within Centers for Social Work, however an in depth discussion of this area lies beyond the scope of the Note.
The effectiveness of the social safety net needs to consider the labor market context carefully. Cash benefits need to be designed so that they do not diminish incentives for people to work. Similarly, benefits need to be complemented by effective active labor market measures, which support labor market integration. This study was conducted in tandem with a separate World Bank Study on the labor market in Serbia, which explores the labor market linkages in more detail.9 Detailed policy recommendations referring to the labor market are included in that report.
Box 1.1: Definitions
This report relies on a number of key terms for describing the set of policies and programs that make up Serbia’s support for its poorest citizens. The terms as used in the report are as follows:
Social assistance refers to income support benefits targeted to poor households. In Serbia the main social assistance benefits are the MOP, child allowances, and caregivers’ allowances.
Child protection refers to cash benefits and services for children, including child allowances and social services intended for children-at-risk, such as disabled children and children without parental care.
Social safety nets and social welfare are used to describe the full range of social assistance and child protection cash and in-kind benefits and services intended for low income individuals and households.
8 In 2004 an estimated 17,000 households received this support in 2004. 9 The labor market study focuses on four areas: (i) an update of the labor market situation, based primarily on the 2004 Labor Force Survey, with particular attention to long-term unemployment, informal employment, flexible work forms, wage determination, and youth unemployment; (ii) labor laws and institutions, with a focus on whether labor market regulation and collective bargaining are sufficiently flexible to support job creation; (iii) labor cost trends, including non-wage costs; and (iv) labor adjustment, including large-scale restructuring as well as the capacity of unemployment insurance and employment services to support workers in adjusting to the changing labor market.
13

Box 1.1 contd.
Social insurance refers to contribution-based benefits, including old age, disability, survivors’ pensions and unemployment insurance.
Social protection refers to all social insurance and social assistance programs and benefits as well as active labor market policies10
Analysis of the safety net also needs to consider the profile and characteristics of poverty in Serbia. This report uses the poverty measures presented in the 2003 Serbia Poverty Assessment conducted jointly by the World Bank and the Government of Serbia (World Bank, 2003). At the time of writing, updated poverty analysis using the 2004 Household Budget Survey was underway. The paper also draws on findings of analysis of a booster survey of Roma households conducted in 2003 (Bodewig and Sethi, 2005).
Data Sources and Approach
The analysis included in this report is based on household surveys, as well as MLESP’s administrative data sources. Because of the drawbacks of the surveys and the need to look more closely at how delivery of services actually works on the ground, a sociological study was commissioned especially for the report. An important conclusion of this report is the need for more and better data for the analysis of social protection.
Quantitative Data. Recent household survey instruments, which allow for full analysis of specific social assistance programs, are not available. This report draws from the two main survey instruments, the 2003 Serbian Living Standard Survey (SLS), which was used for the Poverty Assessment, and the Household Budget Survey (HBS). The SLS has a detailed module on social protection, however, it does not cover reforms to the Social Welfare Law that were introduced in late 2004, and full implementation of the Law on Financial Assistance to Families with Children, which came into effect in 2002.11 The SLS also has a number of constraints related to sample size and coverage of social welfare beneficiaries.12 Nevertheless, the analysis provides some guidance on the relative performance of individual programs. The 2003 SLS is useful in that it allows comparative analysis for the general population and Roma residing in settlements – a particularly marginalized and poor group in Serbia.
Work is currently underway to revise the Household Budget Survey (HBS) to make it the main instrument for analyzing poverty and living standards over time in Serbia. Currently the questionnaire does not include a complete breakdown of social transfers. Child allowances are included as a separate category, however social assistance, unemployment insurance and maternity benefits are aggregated together, limiting program-level analysis. Because of the high level of aggregation and low coverage of social protection beneficiaries, the HBS was of limited use for this analysis, and only basic information on coverage is included here.
10 For more information on social protection refer to www.worldbank.org/sp 11 While the Law was under implementation at the time of the survey take-up of the benefit was initially low. 12 The SLS sample was reduced substantially between 2003 and 2002 (from 6,354 households in 2002 to only 2,548 households in 2003), so that the sub-sample of social welfare and child protection beneficiaries in 2003 was too low to allow any disaggregated analysis for 9 out of the 10 programs captured in the survey. The only exception is the child allowance program. Moreover, while it has detailed questions on the incidence of individual benefits, the surveys were fielded prior to recent changes to the MOP eligibility threshold in 2004 and simultaneously to the tightening of eligibility criteria of child allowance in 2002/2003.
14

The note draws from all available data sources to give the most complete picture possible. Data from the 2003 SLS is complemented by more recent data from the HBS and administrative data from the MLESP. However, it is important to note that these data sources are inadequate for program evaluation and analysis of trends over time. Improving the HBS for analysis of social benefits is a priority, including a more detailed module on social protection programs, as well as periodic booster samples to allow for disaggregated analysis of social welfare beneficiaries.
Qualitative Study. A qualitative study was commissioned to address gaps and limitations in the existing survey database, but also to look more closely at the implementation and delivery of social benefits at the local level (Box 1.2). This included documenting delivery arrangements for social assistance and child protection cash benefits at the local level, comparing arrangements in practice with regulations provided in the legislation, identifying incentives for local stakeholders – including staff in Centers for Social Work and local governments – in delivering cash benefits, and assessing the experience of beneficiaries and potential beneficiaries in interacting with the system. The findings are included throughout the paper and are the focus of Chapter 3.
Box 1.2: Qualitative Study of Social Assistance Delivery at the Local Level
The World Bank commissioned a qualitative study of benefit delivery to understand how social assistance and child protection work at the local level from the perspectives of beneficiaries, providers and policy makers. The study was undertaken by the NGO Logos and its network of local researchers in February and March 2006.
The study was conducted in five municipalities in Serbia: Kragujevac, Barajevo, Novi Sad, Niš and Bor. The study sites were selected for their geographic and demographic diversity – including variation in the share of Roma, IDPs and refugees in the populations, and variety in socioeconomic conditions – including the unemployment rate.
The research involved in-depth interviews with key informants at the national level (e.g. MLESP and other government officials), as well as within the municipalities (e.g. CSW and municipality officials). Focus groups were also conducted in each municipality with both social assistance beneficiaries, and members of target groups who were not receiving benefits. Two focus groups were held in each municipality, including men and women, respondents from rural and urban areas, and people from different social groups, including Roma, IDPs and refugees, the unemployed, and single parents.
Source: Logos, 2006.
This study was done in close partnership with MLESP, which advised on the scope, contributed data, and commented on prior versions. A previous draft was discussed at a one-day workshop held in February 2006, involving a wide range of government and NGO stakeholders involved in delivery of social assistance at the central and local levels in Serbia. Many of the comments and issues raised in the workshop are included here.
Poverty and the Labor Market in Serbia
Safety net programs need to respond to the needs of the population and the particular characteristics and profile of poverty and vulnerability in Serbia. Two parallel analyses of living standards and the labor market were underway at the time of writing and will provide in-depth analysis of both areas.
Poverty. According to the joint World Bank-Government Poverty Assessment for Serbia conducted in 2003 and using the SLS survey, 10.5 percent of the population was poor, using the
15

national poverty line, and 2.3 percent were living in extreme poverty. Preliminary analysis of the HBS survey estimated poverty at 9.4 percent. While the results were not yet finalized at the time of writing, they indicate that poverty has not changed substantially in Serbia since 2003 to affect the conclusions in this Note.
Poverty in Serbia is closely associated with educational attainment, employment status, and household location. Roma are also significantly more likely to be poor than other groups. Education is the closest correlate of poverty in Serbia. Poorly educated individuals make up the majority of the poor, with close to two-thirds of the poor having elementary education or less. Poverty is also closely associated with household labor market status. Inactivity and joblessness are strongly correlated with poverty; however the majority of the poor in Serbia – close to 75 percent – are in working families.
Poverty in Serbia also has a regional dimension, with the greatest pockets of deprivation in the rural areas of Southeast Serbia. Refugees, IDPs and Roma are the most vulnerable groups in the poverty profile. Analysis of a booster survey of Roma household found that poverty rates among Roma were 10 times higher than that of the national population, indicating the need for focused efforts to reach Roma through the social safety net.
The Labor Market. Even with the resumption of economic growth, labor market outcomes in Serbia are not favorable. Employment has decreased and unemployment is high and appears to be rising. It is estimated that an additional 80,000 workers in state-owned companies will be made redundant in 2005-2008 (Cvetkovic and Lieberman, 2005). Table 1.1 below summarizes the main labor market indicators, based on the new Labor Force Survey (LFS) for 2005.13
Labor market exclusion is a significant problem for many workers, particularly because of high long-term unemployment. Youth (especially young women) have particularly adverse labor market outcomes. Roma communities, which can be identified in the LFS, are one of the most marginalized groups in Serbia. The less educated also experience considerable problems in the labor market. Even following Labor Code reforms, flexible forms of employment (part-time and temporary work) are almost non-existent. Flexibility is achieved through informal employment. One of the most striking findings reported in the Poverty Assessment (World Bank, 2003) is the high incidence of poverty among workers employed in the informal sector.
According to the forthcoming Serbia Labor Market Update, this situation can be explained primarily by Serbia’s late transition. Even though this stage of “defensive restructuring” is a necessary precondition for future growth, in the meantime it leads to high rates of job destruction. In a few years, once this process is largely over, and if the investment climate continues to improve and macrostability continues, more favorable job creation rates are expected. At that time, the labor market context for social assistance clientele should improve.
13 There is concern about how well the LFS fully captures the characteristics of the labor market. In particular, uncertainty is higher in countries where informal sectors are large, statistical administrative capacity is low, and reporting might be affected by incentives associated with government programs. However, the LFS in Serbia has improved significantly in Serbia since 2004 and is the only source available to describe the current situation.
16

Table 1.1: Main Labor Market Indicators in Serbia, 2005
Rates Total Male Female Youth Roma Less than Elementary School
Elementary School
Labor Force Participation 65.2 74.3 56.2 35.7 60.4 45.6 46.3
Employment 50.9 61.2 40.8 18.7 28.3 37.7 36.3 Unemployment 21.8 17.6 27.4 47.7 53.1 17.2 21.5 Long-termUnemployment1 79.1 78.4 79.5 67.8 88.9 83.0 86.9
Source: LFS (2005) Note: (1) Long-term Unemployment captures the proportion of unemployed looking for jobs for a year or more.
BBB... SSSOOOCCCIIIAAALLL PPPRRROOOTTTEEECCCTTTIIIOOONNN PPPRRROOOGGGRRRAAAMMMSSS AAANNNDDD EEEXXXPPPEEENNNDDDIIITTTUUURRREEESSS Serbia has a fully developed social protection system including insurance-based pensions and unemployment benefits, social assistance and child protection benefits, and an increasingly diverse array of social services. Social protection is an important source of income support for the population. In 2003 65 percent of the population received at least one social transfer. In the absence of social protection benefits, and particularly pensions, the poverty rate in Serbia is estimated to be more than 30 percentage points higher.
Total social protection expenditures amounted to approximately 14 percent of GDP in 2006, of which 11.4 percent of GDP was pension spending. Social insurance, especially pensions, are contribution based benefits intended to smooth consumption over the lifecycle and provide income security during old age. However, as will be discussed in the following chapter, pensions in Serbia are strongly progressive and have an important role in protecting the poor from poverty. Financing also blurs the distinction between social insurance and social assistance, since a significant share of pension expenditures come from general revenues rather than from contributions – 46 percent in 2005. This share is expected to decline to 15 percent by 2020 through reforms which are strengthening contribution compliance and the fiscal sustainability of the system.
Figure 1.1: Composition of Social Protection Spending in Serbia, 2005
Pension benefits
Child protection
Social assistance
Veterans
Unemployment benefits
Source: MLESP.
17

In the area of social assistance and child protection, Serbia has over 20 social assistance programs covering population groups considered vulnerable or at high risk of poverty: disabled, families with children, single parents, children without parental care, refugee mothers, war veterans, civilian war-victims, children and elderly with special needs. Despite the proliferation of programs, the safety net in Serbia can be characterized by low coverage and low adequacy. In other words, few people receive very little assistance. The main cash benefit programs are the means-tested cash benefit program, Material Support (materijalno obezbe enje porodice, MOP), child and carer’s allowances. The impact of these programs is analyzed in detail in the following chapter.14
Table 1.2: Social Assistance and Child Protection in Serbia, 2005, % of GDP
2000 2001 2002 2003 2004 2005 Total 0.99 1.68 1.64 1.50 1.35 1.40 Child Protection 0.75 1.41 1.40 1.27 1.11 1.07
Wage compensation during maternity 0.21 0.24 0.35 0.40 0.41 0.43 Child allowance 0.03 0.91 0.74 0.55 0.50 0.44 Birth grant (parental allowance) - - 0.11 0.23 0.22 0.20 Educational program before first grade 0.09 0.10 0.07 -- -- 0.00 Others 0.05 0.10 0.06 0.07 -- --
Social Assistance 0.24 0.28 0.25 0.24 0.24 0.33 MOP 0.02 0.09 0.10 0.11 0.11 0.14 Caregiver's allowance 0.03 0.04 0.05 0.05 0.06 0.09 Social Institutions 0.10 0.06 0.08 0.05 0.05 0.06 Others 0.09 0.10 0.01 0.02 0.02 0.03
Source: Ministry of Labor, Employment and Social Policy, Republic of Serbia.
The MOP social assistance benefit is the means-tested social assistance benefit for poor households in Serbia. Financed and delivered by MLESP through Centers for Social Work (CSWs), it is aimed at individuals and households with an income below the minimum social welfare threshold, filling the gap between the household’s income and the threshold equal to a share of the average wage, adjusted for household size. However, it appears that typically households receive the full amount equal to the threshold, if their income is assessed to lie below the threshold. This does not differentiate between those households substantially below the line and those rather close. The eligibility is also dependent on an asset test.15 In 2005, there were 109,337 MOP beneficiaries, or 43,329 households.
CSWs also administer the caregiver’s allowance, which is a monthly cash benefit for persons with disabilities to finance personal care. Granted, like the MOP, by the Law on Social Care and Provision of Social Security of Citizens, the caregiver’s allowance is financed by MLESP and managed by the municipal CSWs. In 2005, 245,584 individuals received the benefit.
Child allowances are financed and managed by the MLESP and run by the municipalities. A Law on Financial Support for Families amended in 2002 aims at improving the targeting of child allowances. Households are eligible for monthly child allowances for the first four children
14 Annex Table 1.1 describes the main characteristics and eligibility criteria for each of the benefits. 15 A unified Republican-wide eligibility threshold for MOP was introduced in amendments to the social welfare legislation in 2004. The analysis of the MOP benefit incidence in this report is based on 2003 data, i.e. without the unified threshold.
18

aged 0-19 (above the age of 7 if they are enrolled in school) and if the household’s income is below a defined eligibility threshold. The right to child allowance is limited to the first four children, and the eligibility is controlled through means-testing, including asset tests. The amendments also introduced a uniform eligibility threshold for benefits across the Republic. There were 485,000 beneficiaries in 2005.
The 2002 amendments to the Law on Financial Support to Families with Children also introduced a new birth grant benefit with the aim of encouraging families to have children. Total expenditures on birth grants are high in comparison with the other programs. Although only a small number of households receive them, 2,870 per month in the first six months of 2005; 3,079 in 2004, in 2004, they amounted to 0.25 percent of GDP, over twice what is spent on the MOP.
In January 2006, the program was further expanded to include benefits for first-born children. Preliminary estimates put the number of monthly beneficiaries of the birth grant at 3,350. The benefit level for the first child is 20,000 dinars, suggesting an additional budgetary impact in 2006 of 804 million dinars, roughly one-third of the total amount budgeted for the MOP program. The birth grant for the first child is to be disbursed in a lump sum amount, while those for the second, third and fourth child are to be disbursed over 24 monthly installments, in order to reduce the immediate fiscal impact.
Spending on social assistance and child protection in Serbia is significantly lower than in other countries in the region (Figure 1.2). In 2005, Serbia spent 1.4 percent of GDP on social assistance and child protection cash benefits and services and another 0.6 percent of GDP on veterans’ benefits. Focusing on means-tested social assistance benefits, Serbia also stands out as a low spender. Spending on the MOP program in Serbia amounted to 0.14 percent of GDP in 2005. In comparison, Croatia spends 0.26 percent on a comparable program (and aims to increase spending), Slovenia 0.6 percent of GDP and Bulgaria 0.29 percent of GDP.16
Figure 1.2: Social Assistance and Child Protection Spending in Comparison (% of GDP)
0.00.51.01.52.02.53.03.54.04.55.0
FBiH
Republik
a SrpskaCroati
aSerb
ia
Slovaki
a
Sloveni
a
Czech Rep
ublic
Bulgari
a
Lithuan
iaLatv
ia
Poland
Hungary
Veterans
Social Assistance and ChildProtection
Sources: Staff calculations based on 2003 official data; Data for BH, Bulgaria and Croatia is from 2004, Serbia from 2005; Serbia veterans benefit data include civilian victims of war; BH data based on GDP figures not adjusted for the informal sector.
There is a need to shift funds to targeted safety net programs. In particular, at 0.14 percent, the MOP program stands out as under-funded in comparison with similar social assistance programs in the region. There is scope for reallocating funds from untargeted
16 Slovenia data for 2003 from ESSPROSS database; Croatia and Bulgaria data for 2004, World Bank data.
19

programs, such as the birth grant, to the MOP to increase its poverty alleviation impact. Such an increase needs to take into consideration program design – and particularly the need to promote work incentives – and delivery mechanisms.
The rest of this report looks at the performance of the social welfare programs and issues of implementation. The following section assesses the effectiveness of the main cash benefit programs in Serbia, their coverage, targeting, effectiveness, and impact on poverty; the third section discusses social benefit delivery from the perspective of providers and beneficiaries, drawing from the sociological survey, while the final chapter looks at issues of decentralization, focusing on implications for social services.
20

Annex Table 1.1: Main Social Assistance and Child Welfare Programs, 2005 Program Description Duration of
Benefits and Amount
Eligibility Financing Sources
ImplementingAgency
Child allowance Monthly benefit for the first 4 children age 0-19 (if in school, after age 7).
One year; then review.
Nominal amount is, determined by the law; indexed to the cost of living twice a year. Same amount granted for each child.
January 2006 amount: 1,399 dinars.
Income/asset test; threshold set in nominal terms by the law – indexed to the cost of living
Republican budget
Municipality, Child Protection Office.
Supplementary child allowance
Supplement to the child allowance.
30% increase to the child allowance.
Single parents, foster parents, and children with disabilities.
Republican budget
Municipality, Child Protection Office.
Maternity and child care benefits.
Maternity leave for formal sector employees and self-employed workers.
1 year
30% of the previous gross wage (with up to 3 months work history prior to maternity), 60% (3-6 months), or 100% (6 months >).
Employed on maternity leave/child care.
Republican budget
Through municipal administration to enterprises/firms.
Birth grant (parental allowance)
Lump sum benefit for 1st-4th child.
1st child – paid in one installment 2nd-4th child – paid in 24 installments
Nominal amount determined by the law; indexed to the cost of living twice a year
February 2006 amounts: 1st – 20,000 dinars 2nd – 76,981
Residents of the Republic of Serbia
Republican budget
Paid through commercial banks.
21

Program Description Duration of Benefits and Amount
Eligibility Financing Sources
ImplementingAgency
dinars 3rd - 138,560 dinars 4th – 184,745 dinars
Assistance to refugee mothers
Social assistance to refugee mothers with children
1 year
7.5% of the average gross wage in Serbia
Current amount: 2,418 dinars
Refugee mothers with children under 1 year.
Republican budget
Municipality, Child Protection Office
Pre-school assistance
Reimbursement of the public preschool costs for certain categories of children.
Time spent in pre-school.
Costs vary across municipalities.
Children with special needs, without parental care, from families in financial need.
Republican budget
Paid directly to pre-school institutions.
Compensation to foster parents
Compensation for foster care.
Between 20% and 100% of the average net wage.
Current amounts: -Foster care for one child - 7,176 dinars -Foster care of 2> - 4,416 dinars.
Foster parents Republican budget
Post offices
Material support (MOP)
Monthly cash benefit covering the gap between household income and the eligibility threshold.
1 year; then review. 9 months (within 12 months) for those who are able to work.
The gap between own income (average monthly income of individual/family in the previous three months) and the eligibility threshold (“minimum social security level” which is determined by law for Serbia and indexed to
Individuals and families with average income below the “minimum social security level”
(income/asset test).
Republican budget
MLESP: Center for Social Work
22

Program Description Duration of Benefits and Amount
Eligibility Financing Sources
ImplementingAgency
the monthly cost of living).
Caregiver's allowance
Assistance for those who cannot take care of themselves.
Permanent
Nominal amount determined by the law; indexed to the monthly cost of living.
Determined by the PiO commission.
Not means-tested.
Republican budget
Post offices
23

Annex Table 1.2: Major Changes to the Social Welfare Laws (2001-2006) Law on Social Care and Provision of Social Security of Citizens
Program Changes/Amendments Developments MOP 2001:
The lack of a uniform Republican eligibility threshold results in inequalities in the treatment of the poor. The Government pilots the introduction of a uniform Republic-wide eligibility threshold. Donor assistance mobilized to make one-off payments targeted at vulnerable groups.
2004: Uniform eligibility threshold introduced. Monthly indexation to cost of living. Benefit effective from the day of application submission. Limits the duration of the benefit to 9 months for those who are capable to work.
Increase in number of MOP beneficiaries; Total spending on MOP increases as share of GDP.
Caregiver’s Allowance
2004: Introduces nominal benefit amounts. Monthly indexation to cost of living. Benefit effective from the day of application submission.
2005: Introduces caregiver’s allowance “supplement” for those with total disability (100%) at the level of 70% of the average monthly wage in the first 5 months of 2006; Indexed to the cost of living twice a year (January 1/July 1). This is to become effective on July 1, 2006.
Constant increase in benefit levels for caregiver’s allowance; Total spending increases as share of GDP.
Equalizes the level of caregiver’s allowance under the two different laws (Law on Social Care and Provision of Social Security of Citizens and Law on Pension and Disability Insurance).
Foster Care 2004:Limits number of children/adults/elderly that could be placed in another family (three persons per family or two in the case of disabled children). Total number of children in a family cannot exceed four. Compensation in the form of salary for a foster parent; Sets the minimum (20 percent of the average wage) and maximum (the average republican wage) level of compensation; Financed from the Republican budget.
Coupled with a strong education campaign contributes to promotion of foster care. The number of children in foster care steadily increases.
Accommodation in shelters
2004: LSGs take over the responsibility for founding and financing of shelters (as of January 1, 2005)
Creates problems with financing in poorer municipalities.
Law on Financial Support for Families with ChildrenProgram Changes/Amendments Developments
Child Allowances 2002: Eligibility thresholds indexed to cost of living rather than wages. Additional asset tests introduced in means-testing for benefits.
Tightens targeting of child allowances; Maintains the real value of support to families;
24

Option to apply for assistance as soon as required without having to wait for a specific date in the year. Additional rights for especially vulnerable groups. Indexing benefits to cost of living.
2005:Indexed to cost of living twice a year (April 1/October 1).
Reduces provision of duplicative benefits; Reduces the number of beneficiaries; Reduces the total amount of expenditures as percent of GDP.
Birth Grants (parentalallowance)
2002: Benefits introduced for the first/second/third - born child Paid in a lump-sum
2005: Program expanded to include benefits to first-born children (as of January 1, 2006) Benefits for the second, third, and fourth child are to be disbursed in 24 installments (instead of a lump-sum payment)
Viewed as a population rather than a social policy measure; High benefit level which carries a significant fiscal impact. Needs to be properly evaluated.
Wagecompensation during maternity
2005: Strengthened control over reported wage (to be paid from the budget) to prevent potential frauds
25

CHAPTER 2: DOES SERBIA’S SAFETY NET REACH THE POOR?
AAA... CCCOOOVVVEEERRRAAAGGGEEE AAANNNDDD TTTAAARRRGGGEEETTTIIINNNGGGDespite Serbia’s comparatively low level of spending on social assistance, the programs
do have an impact on the welfare of poor households. This section reviews the incidence and targeting of cash transfers, focusing on the most important programs: the MOP, child allowances and the caregivers’ allowances. As noted, further analysis of the welfare impact of birth grants is needed, however, the current survey database does not allow for this. Social insurance programs are also analyzed. However it is important to acknowledge that despite their significant impact on household welfare the main objective of social insurance programs is providing income during old age for those with an employment-based contribution history, rather than poverty alleviation.17
The data constraints, noted in the first chapter, limit an up-to-date analysis of benefit incidence. Analysis draws from the 2002 and 2003 Serbian Living Standard Surveys (SLS) as well as, where possible, the Household Budget Survey (HBS) 2003 and 2004. Findings from the qualitative study area also incorporated. The chapter reviews coverage, targeting performance, and adequacy of the main social safety net benefits and their impact on poverty reduction. It also looks at the potential impact of the benefits on work incentives.
Coverage of social transfers in Serbia is high, at 65 percent in 2003, on the lower end in comparison with other countries in the region (Figure 2.1).18 Serbia’s social protection programs can be categorized into social insurance (old-age, disability and survivor’s pensions, as well as unemployment insurance benefits) and social welfare and child protection programs including the MOP, child allowances, caregiver’s allowances, veterans and disability benefits, one-time municipal social assistance, as well as various family and child care services. Figure 2.1: Coverage of Social Protection Systems, % of population receiving (latest available year)
0
10
20
30
40
50
60
70
80
90
Serbia Lithuania Poland Bulgaria Estonia Russia Romania
SerbiaLithuania PolandBulgariaEstonia RussiaRomania
Sources: Serbia, SLS 2003; Lithuania, 2004 HBS; Poland, 2004 HBS, Bulgaria, MTHS 2003; Estonia, 2004 HBS; Romania Poverty Assessment, WB (2003); Russian Federation Poverty Assessment (2004).
Wide coverage is primarily driven by social insurance programs, and in particular old-age pensions, which are received by 33 percent of households (Table 2.1). Poor households receive
17 The analysis in this note builds on previous analysis by Tesliuc (2004) and Bodewig and Sethi (2005) 18 As noted earlier, due to the small sample size, the results on coverage and targeting of social benefits have to be treated with care.
26

transfers at a higher rate than the non-poor.19 In 2003, 93 percent of the poor received a social protection benefit. Although social insurance programs cover a sizeable share of non-poor households – because they are granted on the basis of past work history – coverage of social insurance is progressive in Serbia. In 2003, 83 percent of poor households received a social insurance benefit, in comparison with 40 percent of the non-poor.
Table 2.1: Coverage of Social Protection Programs, 2003 (% of households)
% Total Non-poor Poor Q1
(poorest) Q2 Q3 Q4Q5
(richest) Social Insurance 51.3 39.7 83 88.9 62 47.8 36.3 21.7
Old age pension 33.2 24.6 56.6 61.2 41.7 29.5 21.9 11.6 Disability Pension 11.4 8.1 20.2 21.5 13.2 8.7 7 6.4 Family Pension 10.5 9.3 13.7 15.4 11 13.3 8.2 4.3 Unemployment Benefit 1.9 1.4 3.2 2.8 3.3 2 1.3 0.2 Severance Pay 2.1 1.3 4.3 5.3 2.1 1.3 1.9 0
Social Welfare and Child Protection 20.4 19.3 23.3 20.6 31.2 23.1 16.7 10.5 Caregiver's Allowance 2.8 1.5 6.3 6.9 2.3 2.7 1.4 0.5 MOP 1 0.5 2.6 3 1.1 0.9 0 0.2 Humanitarian Aid 1.5 1.5 1.5 1.6 3.2 1.3 1.2 0.1 Child Allowance 14.3 14.3 14.2 10.8 23.9 16.8 11.1 8.6
Social Protection 64.6 54.1 93.2 96 81.6 65.9 49.3 30.5 Source: Own calculations based on Serbia 2003 SLS.
In terms of coverage, the most important social welfare and child protection benefits in 2003 were child allowances and, to a substantially lesser extent, the caregiver’s allowances and the MOP. More than 14 percent of Serbian households received child allowances, while 3 percent received caregiver’s allowances and 1 percent the MOP benefit.20 Administrative data confirm the wider coverage of child allowance compared to MOP (Figure 2.2). Overall, the number of MOP beneficiaries has been increasing gradually from 85,121 beneficiaries in 2001 to 109,337 registered in 2005.
19 For the SLS-based analysis, the report uses a poverty line defined as “very poor” that was introduced to allow comparative poverty analysis between general population and settlement Roma datasets (see Bodewig and Sethi, 2005). This poverty line is based on the general poverty line, but excludes imputed housing rent. With settlement Roma households likely to be spending significantly less on housing compared to the general population, if anything, their comparative poverty would be overestimated if imputed housing expenditure was included in overall household consumption. The “very poor” poverty line is based on a monthly adult equivalent consumption of Dinars 3,997 for 2003. 20 Donor-financed humanitarian aid covered 1.5 percent of the population, but is not subject to the analysis of publicly financed benefits in this report.
27

Figure 2.2: MOP, Child Allowance, and Caregiver’s Allowance Recipients (individuals)
0
100,000
200,000
300,000
400,000
500,000
600,000
700,000
2001 2002 2003 2004 2005
Child allowanceCarer's AllowanceMOP
Source: MLESP
The majority of MOP beneficiaries are unemployed and of working age. Table 2.2 shows the age profile and size of MOP recipient households. Note that the age distribution refers to recipient households rather than household heads. It reveals that the households receiving MOP are predominantly middle-age and older. Approximately two-thirds of recipients are unemployed and one-third are disabled and considered unable to work. The SLS data also suggest that coverage for the MOP is higher in rural than in urban areas.
Table 2.2: Characteristics of MOP Beneficiaries, in Percent Age of beneficiaries
up to 15 0.6 15-50 6051-60 16over 60 24
Employment Status Employee 0.2 Self-employed 0.1 Farmer 0.3 Pensioner 0.6 Unemployed 64.5 Children 1.0 Disabled 33.2 Other 0.2
Household Size 1 member 41.3 2 members 17.7 3 members 14.2 4 members 13.1 5 and over 5 members 13.7
Source: MLESP; Averages September 2004-July 2005
The number of MOP beneficiaries varies significantly from month-to-month, with a significant drop during the summer periods. Figure 2.3 presents an index of monthly beneficiaries, starting in January 2002. Three observations stand out. First, there has been an upward trend in numbers over the last 3 years. Second, the number of MOP recipients drop
28

dramatically in the summer periods, indicating that at that time of the year fewer claimants apply for the benefit. This is likely due to seasonal factors, particularly the availability of summer employment. Third, the drop in 2005 was particularly deep. This is likely due to the rule, which came into effect on September 1, 2004, that restricts benefits for working people to nine out of twelve months. Beneficiaries, who applied in September 2004, lost their eligibility during the summer of 2005. Prior to this change CSW had the discretion to take into account income from informal employment (e.g. summer jobs) in assessing eligibility, and as a result many did lose their entitlement in the summer. The 2004 amendment formalized this.
Figure 2.3: Trends in MOP Beneficiaries, January 2002 = 100
MOP beneficiaries per Month, Jan 2002=100
8090
100110120130140150160
Jan-02
May
-02
Sep-0
2
Jan-03
May
-03
Sep-0
3
Jan-04
May
-04
Sep-0
4
Jan-05
May
-05
Sep-0
5
FamiliesIndividuals
Figure 2.4: Evolution of MOP Beneficiary Numbers, April 2005 = 100
Evolution of MOP Beneficiary Numbers, April 2005=100
2030405060708090
100110
April May June July
UnemployedDisabledTotal families
The main categories of MOP beneficiaries are the unemployed and the disabled (with an official disability certificate). Decomposing the decline of benefits from the 2005 summer months reveals that, consistent with the legislation, the decline in beneficiary numbers is driven by the unemployed, who are physically able to work, while the disabled retain their benefits without disruption. The nine-month limitation on benefits may be a serious problem for poor MOP beneficiaries who lack other sources of income.
Some parents with school-age children interviewed for the qualitative study confirmed the difficulty of losing income during the summer period, and mentioned the specific problem they face of not being able to buy school supplies for their children who start the school-year in September. Some explained that they could partly pay for the supplies with discretionary one-time payments from the CSWs and manage to buy secondhand textbooks. One-time payments
29
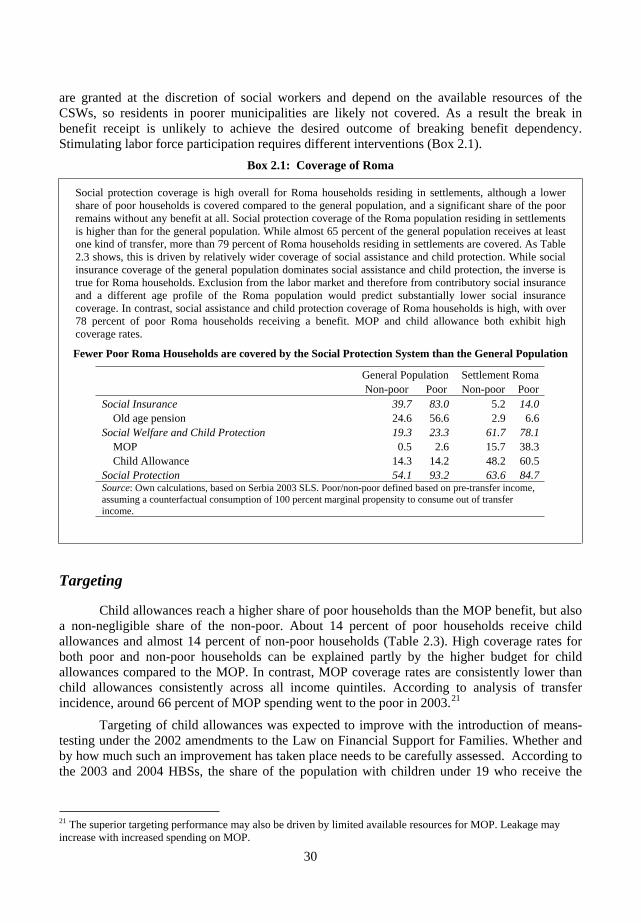
are granted at the discretion of social workers and depend on the available resources of the CSWs, so residents in poorer municipalities are likely not covered. As a result the break in benefit receipt is unlikely to achieve the desired outcome of breaking benefit dependency. Stimulating labor force participation requires different interventions (Box 2.1).
Box 2.1: Coverage of Roma
Social protection coverage is high overall for Roma households residing in settlements, although a lower share of poor households is covered compared to the general population, and a significant share of the poor remains without any benefit at all. Social protection coverage of the Roma population residing in settlements is higher than for the general population. While almost 65 percent of the general population receives at least one kind of transfer, more than 79 percent of Roma households residing in settlements are covered. As Table 2.3 shows, this is driven by relatively wider coverage of social assistance and child protection. While social insurance coverage of the general population dominates social assistance and child protection, the inverse is true for Roma households. Exclusion from the labor market and therefore from contributory social insurance and a different age profile of the Roma population would predict substantially lower social insurance coverage. In contrast, social assistance and child protection coverage of Roma households is high, with over 78 percent of poor Roma households receiving a benefit. MOP and child allowance both exhibit high coverage rates.
Fewer Poor Roma Households are covered by the Social Protection System than the General Population
General Population Settlement Roma Non-poor Poor Non-poor Poor
Social Insurance 39.7 83.0 5.2 14.0 Old age pension 24.6 56.6 2.9 6.6
Social Welfare and Child Protection 19.3 23.3 61.7 78.1 MOP 0.5 2.6 15.7 38.3 Child Allowance 14.3 14.2 48.2 60.5
Social Protection 54.1 93.2 63.6 84.7 Source: Own calculations, based on Serbia 2003 SLS. Poor/non-poor defined based on pre-transfer income, assuming a counterfactual consumption of 100 percent marginal propensity to consume out of transfer income.
Targeting
Child allowances reach a higher share of poor households than the MOP benefit, but also a non-negligible share of the non-poor. About 14 percent of poor households receive child allowances and almost 14 percent of non-poor households (Table 2.3). High coverage rates for both poor and non-poor households can be explained partly by the higher budget for child allowances compared to the MOP. In contrast, MOP coverage rates are consistently lower than child allowances consistently across all income quintiles. According to analysis of transfer incidence, around 66 percent of MOP spending went to the poor in 2003.21
Targeting of child allowances was expected to improve with the introduction of means-testing under the 2002 amendments to the Law on Financial Support for Families. Whether and by how much such an improvement has taken place needs to be carefully assessed. According to the 2003 and 2004 HBSs, the share of the population with children under 19 who receive the
21 The superior targeting performance may also be driven by limited available resources for MOP. Leakage may increase with increased spending on MOP.
30

child allowance remained stable at 12 percent in both years. Further analysis will be needed to assess the impact of the recent policy changes.
Table 2.3: Incidence of the MOP and Child Allowances by Quintile (% of total transfers received by each sub-group)
(in %) Non-poor Poor Q1 (poorest) Q2 Q3 Q4 Q5 (richest) MOP 33.6 66.4 53.6 23.1 16.9 0.0 6.4 Child Allowance 72.1 27.9 16.1 32.6 23.4 15.3 12.2
Source: Own calculation based on Serbia SLS 2003.
The MOP is significantly better targeted than child allowances. Indeed, although it reaches fewer poor households, the MOP has targeted poor households more effectively and shows less leakage to non-poor households. In 2003, a modest 16 percent of child allowance transfers went to the poorest quintile, while 54 percent of MOP benefits went to the poorest 20 percent of households. The data confirm that child allowances in Serbia were ineffectively targeted to the poor in 2003. Almost three quarters of resources for child allowances went to non-poor households in 2003. The concentration curves indicate the superior targeting performance of the MOP (Figure 2.5). With the exception of child allowances, all transfers are progressive, i.e. the poor get a greater share of transfers than their share in total consumption. It also confirms that social insurance was more progressive than social assistance and child protection in Serbia in 2003.
Figure 2.5: Concentration Curves for Selected Social Welfare and Child Protection Programs, 2003
0
10
20
30
40
50
60
70
80
90
100
0 10 20 30 40 50 60 70 80 90 100
cumulative percentage of the population
cum
ulat
ive
perc
enta
ge o
f tra
nsfe
rs
Equal MOPChild Allow ance Social InsuranceSWCP Social ProtectionCarer's Allow ance
Source: World Bank estimates based on Serbia 2003 SLS. Note: Chart assumes a counterfactual consumption of 100 percent marginal propensity to consume out of transfer income. Concentration curves are graphic devices which illustrate whether a transfer is progressive (the poor get a higher share of it) or regressive (the opposite is the case). If the concentration curve of a program lies above the equality line, the program is highly progressive: the poor recipients get more benefits than their share in total consumption.
Targeting of the MOP stands out as comparable with social assistance programs in other countries, although there is room for improvement. Figure 2.6 shows the Coady-Grosh-Hoddinott index for international comparisons (CGH Index). The index is a simple measure, based on a comparison of actual targeting performance to a common reference outcome of neutral targeting. In other words, it compares current targeting to the level of targeting that
31

would result from equal allocation of resources across quintiles.22 The results highlight the better performance of the MOP in reaching the poor, but also the need for further efforts to tightening. This will be especially important as the program is expanded, as higher spending will create the risk of greater leakage.
Figure 2.6: Targeting of Social Assistance Systems in Comparison
(CGH Index, Latest possible year)
0
0.5
1
1.5
2
2.5
3
3.5
4
Russia SerbiaChild
Allowance
Hungary SerbiaMOP
Romania Poland Lithuania Estonia Bulgaria
Sources: Russia, Bulgaria and Romania, from Tesliuc, 2004, Serbia SLS, 2003; Hungary HBS, 2002; Poland, HBS 2004; Lithuania, HBS, 2004, Estonia, HBS, 2004, authors’ calculations. Note: Data include country-specific definitions of social assistance as included in the surveys and are not strictly comparable across countries.
Serbia could benefit from examining the experience of other countries in experimenting with alternative targeting approaches, such as proxy-means-testing. This approach has proven particularly effective in countries, such as Serbia, which have large informal sectors which make measurement of income particularly challenging (Box 2.2). A possible approach would be to test proxy-means-testing in a few municipalities to assess its potential to improve targeting.
22 The CGH indicator is constructed by dividing the actual outcome by the neutral outcome for the bottom quintile of the population. In other words, if the poorest 20 percent of the population received 30 percent of the benefits, then the CGH indicator is equal to (30/20) = 1.5, which means that targeting has led to the poorest quintile receiving 50% more than they would have received under neutral targeting (see Lindert, et. al, 2006; Coady, et. al, 2005).
32

Box 2.2: Alternative Targeting Methods for Social Assistance: The Proxy-Means-Test
Eligibility for MOP and child allowances in Serbia is based on household income. However, like other transition countries in Central and South-Eastern Europe, Serbia has a large informal sector, making it difficult to reliably verify true household monetary income as part of the determination of eligibility for social assistance. Furthermore, a significant part of household food consumption comes from food grown on private garden plots. It can be very difficult to estimate the true value of home-produced goods, since often they are produced with “costless” family labor and their quality may be different than for example food items which are produced for sale. A proxy means test, also called “scoring formula” is a method to estimate household consumption or welfare without requiring detailed information about household income.
Rather than trying to measure total income perfectly, proxy means tests rely on indicators which are much easier to measure and verify and which are known to be correlated with poverty. Proxy means tests generate a score for applicant households based on fairly easy to observe characteristics of the household such as the location and quality of its dwelling, its ownership of durable goods, the demographic structure of the household, and the education and, possibly, the occupations of adult members. The indicators used in calculating this score and their weights are derived from statistical analysis of data from detailed household surveys, such as Serbia’s SLS and HBS. Eligibility is determined by comparing the household’s score against a predetermined cutoff.
The advantage of proxy means testing is that it requires less information than true means testing, and yet is objective. Moreover, because it does not measure income itself, it may discourage work effort less than a means test would. However, administering proxy means tests requires computer-trained staff and information technology in the CSWs. There is also an inherent inaccuracy at household level, since the formula is only a prediction. However, the formulae used usually rely on indicators that are relatively stable and may distinguish well chronic poverty, but can be insensitive to quick changes in household welfare or disposable, which may be frequent and large when an economy is suffering a large downturn. Moreover, the formula and results may seem mysterious or arbitrary to some households and communities, although they can be backed up by an appeals procedure and home visit verification of eligibility.
Proxy means-tests were first introduced in Chile in the late 1970s and 1980s, in a program called Ficha CAS (card for social assistance). Since the early 1990s, other countries in Central and South America have adopted proxy means-tests for social assistance programs, such as Costa Rica and Colombia, Mexico, Honduras, Argentina, Venezuela and Nicaragua. In the Europe and Central Asia region, proxy means tests have been tested and utilized for social assistance programs Turkey (conditional cash transfers) and Armenia (Paros benefit).
Source: Braithwaite, 2003.
BBB... TTTHHHEEE WWWEEELLLFFFAAARRREEE IIIMMMPPPAAACCCTTT OOOFFF TTTRRRAAANNNSSSFFFEEERRRSSS
Adequacy
Social protection, and especially social insurance, is an important source of income for households in Serbia, and especially for the poor. Social insurance programs have a substantial poverty-minimizing effect. This is intuitive: as shown, poverty among pensioners would be expected to rise significantly in the absence of pensions. On average, pensions make up 57 percent of average consumption of pension recipients. While they also clearly have a poverty-reducing effect, these discrepancies are less pronounced for child allowances and MOP. This can be explained by their lower share of household expenditure. According to the 2003 data, MOP benefits were on average 20 percent of per capita consumption of beneficiaries, while the corresponding figure for child allowance recipients was 8 percent of average consumption. Note that the poverty rate for MOP beneficiaries remains at a high 40 percent, even after receiving the transfer.
33

Figure 2.7: Poverty Headcount among Beneficiaries in 2003 – before and after transfers
0.0
10.0
20.0
30.0
40.0
50.0
60.0
Social P
rotec
tion
Social In
suran
ce
SWCPMOP
Carer's Allo
wance
Child Allo
wance
Pove
rty R
ate
AfterBefore
Source: Own calculations, based on Serbia 2003 SLS. Poor/non-poor defined based on pre-transfer income, assuming a counterfactual consumption of 100 percent marginal propensity to consume out of transfer income.
The MOP has the lowest cost-benefit ratio in terms of poverty reduction. The higher effectiveness of the MOP in reducing poverty compared to other programs is confirmed by Figure 2.8, which illustrates how many dinars are spent on a program to reduce the poverty gap of the beneficiaries by 1 dinar. Clearly, the MOP has the lowest cost-benefit ratio. While the changes in performance from 2002 and 2003 are insignificant for the three smaller programs (caregiver’s allowance, MOP and humanitarian aid), the increase in efficiency of the child allowance program is statistically significant, and is possibly due to the introduction of income-testing of the benefit. Figure 2.8: Cost-benefit Ratios for Social Welfare and Child Protection Programs, 2002 and 2003
-
0.50
1.00
1.50
2.00
2.50
3.00
3.50
4.00
4.50
SocialAssistance
Caregivers'allowance
MOP Humanitarian Aid Child allowance
Din
ar s
pent
per
1 d
inar
redu
ctio
n in
pov
erty
gap
2002 2003
Benefit Levels, Eligibility and Work Incentives
Eligibility for the MOP and the carer’s allowance are specified in the Law on Social Care and Provision of Social Security of Citizens (Annex Table 1.1). The Law sets a Serbia-wide
34
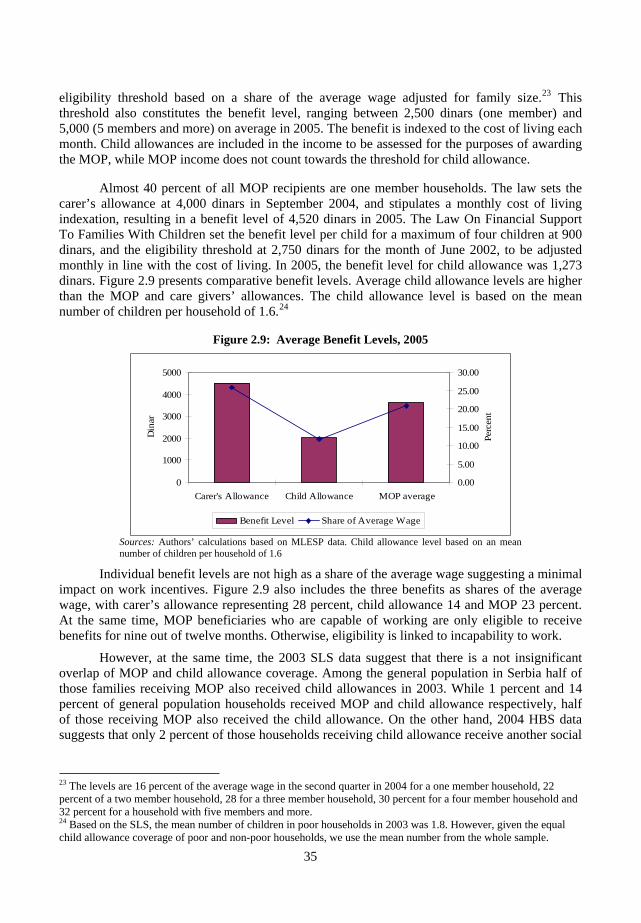
eligibility threshold based on a share of the average wage adjusted for family size.23 This threshold also constitutes the benefit level, ranging between 2,500 dinars (one member) and 5,000 (5 members and more) on average in 2005. The benefit is indexed to the cost of living each month. Child allowances are included in the income to be assessed for the purposes of awarding the MOP, while MOP income does not count towards the threshold for child allowance.
Almost 40 percent of all MOP recipients are one member households. The law sets the carer’s allowance at 4,000 dinars in September 2004, and stipulates a monthly cost of living indexation, resulting in a benefit level of 4,520 dinars in 2005. The Law On Financial Support To Families With Children set the benefit level per child for a maximum of four children at 900 dinars, and the eligibility threshold at 2,750 dinars for the month of June 2002, to be adjusted monthly in line with the cost of living. In 2005, the benefit level for child allowance was 1,273 dinars. Figure 2.9 presents comparative benefit levels. Average child allowance levels are higher than the MOP and care givers’ allowances. The child allowance level is based on the mean number of children per household of 1.6.24
Figure 2.9: Average Benefit Levels, 2005
0
1000
2000
3000
4000
5000
Carer's Allowance Child Allowance MOP average
Din
ar
0.00
5.00
10.00
15.00
20.00
25.00
30.00
Perc
ent
Benefit Level Share of Average Wage
Sources: Authors’ calculations based on MLESP data. Child allowance level based on an mean number of children per household of 1.6
Individual benefit levels are not high as a share of the average wage suggesting a minimal impact on work incentives. Figure 2.9 also includes the three benefits as shares of the average wage, with carer’s allowance representing 28 percent, child allowance 14 and MOP 23 percent. At the same time, MOP beneficiaries who are capable of working are only eligible to receive benefits for nine out of twelve months. Otherwise, eligibility is linked to incapability to work.
However, at the same time, the 2003 SLS data suggest that there is a not insignificant overlap of MOP and child allowance coverage. Among the general population in Serbia half of those families receiving MOP also received child allowances in 2003. While 1 percent and 14 percent of general population households received MOP and child allowance respectively, half of those receiving MOP also received the child allowance. On the other hand, 2004 HBS data suggests that only 2 percent of those households receiving child allowance receive another social
23 The levels are 16 percent of the average wage in the second quarter in 2004 for a one member household, 22 percent of a two member household, 28 for a three member household, 30 percent for a four member household and 32 percent for a household with five members and more. 24 Based on the SLS, the mean number of children in poor households in 2003 was 1.8. However, given the equal child allowance coverage of poor and non-poor households, we use the mean number from the whole sample.
35

welfare or unemployment benefit. Further analysis on work incentives will need to assess the total amount of benefits received by households from all sources.
In order to understand the level of benefits received by different household types, a number of profiles were developed and benefit levels were compared with the minimum and average wages in Serbia in 2005. Average wages vary substantially across Serbia, and Table 2.5 presents cumulative benefits as a share of the Republican average wage in 2005, the average wage in the lowest wage region and the average wage in the ten lowest wage municipalities.
The analysis indicates that in the lowest wage municipalities receiving multiple benefits can push household income above the average wage levels. Whereas the combined receipt of child allowance and MOP for a poor household with one parent and three children represents about 40 percent of the average wage in Belgrade, it is the equivalent of more than 120 percent of the Republican minimum wage and the average wage in the ten lowest wage municipalities.25
While on aggregate the benefit levels of MOP and child allowance, even if combined, do not suggest adverse work incentives, poor households in poor municipalities may face a poverty trap.
Box 2.3: What are Cash Benefits Worth? Views from Beneficiaries and Providers
The qualitative research looked at the impact of cash benefits on welfare from the perspective of beneficiaries and providers. There was consensus among both groups that benefit levels are too low to have a real impact on welfare. At best social assistance helps households to meet a small number of priority needs and is of most significance for the poorest households. Because benefits are scarce, some poor individuals resort to coping strategies including informal employment and loans, as well as illegal strategies such as tax evasion or petty theft such as stealing firewood. A service provider noted:
This is just assistance to help them survive – it has no any impact on improving the beneficiaries’ quality of life.
Low benefit levels force households to prioritize their expenditures and make trade-offs. For example, some beneficiaries explained that they resorted to not paying all or part of their utilities, taxes or rent payments, risking losing access to services or even court proceedings. Others rely on social assistance to help cover these expenditures.
I use MOP benefits to pay the rent. I have to, otherwise, they will evict me. For other things, I need to manage somehow. In 6 years we moved eight times because I haven’t had money to pay the rent.
Food expenses were identified as a priority, although beneficiaries noted that the MOP is sufficient only to cover food expenses for 10-15 days. After utilities, rent and school-related fees household often do not have much money left for food, leaving some to go hungry. Food is bought mostly with money they earn on the side from temporary informal sector work. Beneficiaries also identified medical expenses, such as drugs and doctor’s visits and school expenses, including supplies, transportation, and fees for extracurricular activities as expenditures that crowd out food and other costs. A beneficiary commented on the difficulty of affording medical treatment:
This population is very healthy. We are either healthy or dead.
For those without other sources of income, social benefits are valued very highly. Monthly benefits are important in that they are regular and reliable. Providers noted that benefits were most critical for poor Roma households, persons with disabilities who are unable to work, and large families. MOP is also important as an eligibility criteria for other benefits including free textbooks, transport, and medical treatment.
Source: Logos 2006.
25 The ten lowest wage municipalities in Serbia in 2005 were Kursumlija, Vladicin Han, Vlasotince, Dimitrovgrad, Bela Palanka, Blace, Svrljik, Pantelej, Bojnik, Alibunar. According to official data, average wages in some low wage municipalities are below the minimum wage.
36
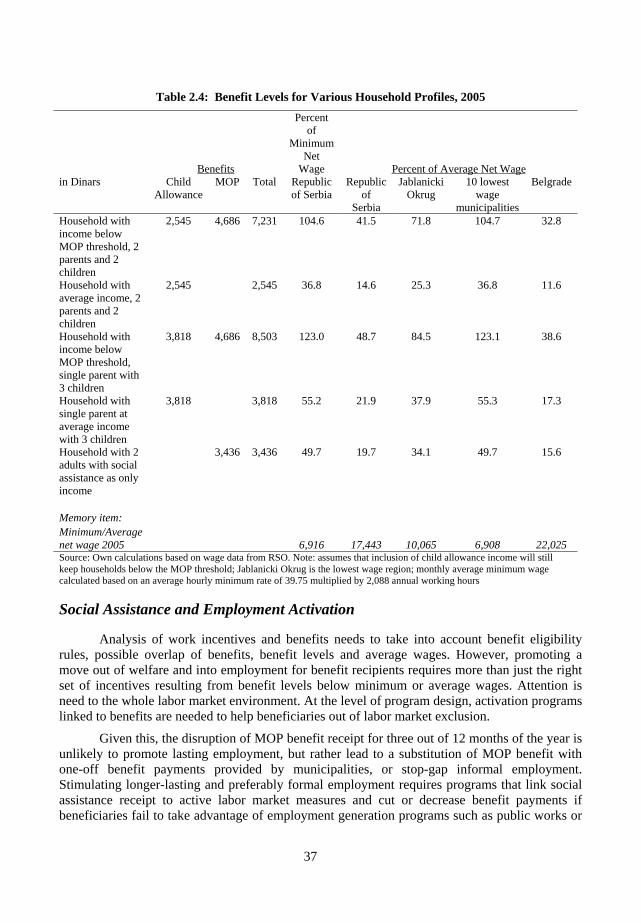
Table 2.4: Benefit Levels for Various Household Profiles, 2005
Benefits
Percent of
Minimum Net
Wage Percent of Average Net Wagein Dinars Child
Allowance MOP Total Republic
of Serbia Republic
of Serbia
Jablanicki Okrug
10 lowest wage
municipalities
Belgrade
Household with income below MOP threshold, 2 parents and 2 children
2,545 4,686 7,231 104.6 41.5 71.8 104.7 32.8
Household with average income, 2 parents and 2 children
2,545 2,545 36.8 14.6 25.3 36.8 11.6
Household with income below MOP threshold, single parent with 3 children
3,818 4,686 8,503 123.0 48.7 84.5 123.1 38.6
Household with single parent at average income with 3 children
3,818 3,818 55.2 21.9 37.9 55.3 17.3
Household with 2 adults with social assistance as only income
3,436 3,436 49.7 19.7 34.1 49.7 15.6
Memory item: Minimum/Average net wage 2005 6,916 17,443 10,065 6,908 22,025 Source: Own calculations based on wage data from RSO. Note: assumes that inclusion of child allowance income will still keep households below the MOP threshold; Jablanicki Okrug is the lowest wage region; monthly average minimum wage calculated based on an average hourly minimum rate of 39.75 multiplied by 2,088 annual working hours
Social Assistance and Employment Activation
Analysis of work incentives and benefits needs to take into account benefit eligibility rules, possible overlap of benefits, benefit levels and average wages. However, promoting a move out of welfare and into employment for benefit recipients requires more than just the right set of incentives resulting from benefit levels below minimum or average wages. Attention is need to the whole labor market environment. At the level of program design, activation programs linked to benefits are needed to help beneficiaries out of labor market exclusion.
Given this, the disruption of MOP benefit receipt for three out of 12 months of the year is unlikely to promote lasting employment, but rather lead to a substitution of MOP benefit with one-off benefit payments provided by municipalities, or stop-gap informal employment. Stimulating longer-lasting and preferably formal employment requires programs that link social assistance receipt to active labor market measures and cut or decrease benefit payments if beneficiaries fail to take advantage of employment generation programs such as public works or
37

“workfare programs”. Such approaches have been tested in some countries in region (see Box 2.4).
Box 2.4: Public Works and Workfare: An Alternative to the Unemployment Benefit?
Temporary relief work, or public works, has been used extensively in many transition countries. Normally, they may be a short-term bridge between more-permanent jobs, especially in environments where jobs are few. They are designed to require high effort and low pay to ensure that only the neediest take part. The length of these jobs can vary, but typically it is between three months to one year. The long-term employment impact of these programs is often insignificant, and the unit costs are high. The organization of public works is often complicated because of a mismatch between the skills needed by employers and the qualifications possessed by the unemployed. Many transition countries have used an offer to take part in public works programs as a work test or a disciplinary measure, to disqualify individuals who may have had hidden employment or income from temporary income support programs. Experience showed that programs operated by private sector employers resulted in more positive impacts than when they were implemented by public agencies.
Public works were initially invented to address demand deficiency unemployment; however, they have increasingly turned into income-support programs largely targeted at low-skilled, long-term unemployed and other disadvantaged groups (for example, older workers and those in distressed regions). This role has developed particularly in those countries where work incentives faced by the unemployed are weak because of benefits being close to the expected market wage. The underlying concept, known as workfare, is that able-bodied individuals should receive income support conditional upon, or in return for, performing some publicly useful work, to self-target the poor.
For example, workfare was introduced in Albania, Bulgaria, and FYR Macedonia. However, in Albania and FYR Macedonia, wages were not set low enough to attract only the poorest workers. Because of considerable income from the informal sector, people in FYR Macedonia did not wish to join public works programs even though the benefit was set at the average wage. In Albania, a community job creation program to undertake public services and infrastructure projects within the community (for example, village roads, water drains, and so forth) was piloted in the late 1990s through the World Bank Labor Market Development Project and then implemented on a broader scale by the National Employment Service through government funds. Recipients of social assistance had to “delegate” one household member to take part in the program. Because wages earned were significantly higher than social assistance received, there was a significant demand for those jobs.
A similar program in Bulgaria, “From Social Assistance Towards Employment,” in which the unemployed individuals—recipients of social assistance—are given an option to either accept temporary jobs or else risk their social assistance benefit being cut or reduced, has been more successful. Wages are set at the minimum wage level, but those employed have to give up their social assistance benefits. Among the reasons for the attractiveness of the program might be that the participants are also covered with pension and health insurance (including maternity benefits). Also, for some of the participants from ethnically mixed regions, employment is combined with literacy enhancement and vocational training.
In summary, if well designed and carefully targeted at disadvantaged worker groups, public works and workfare programs can provide income support to the unemployed without causing adverse labor supply incentives. Public works can also be effective when the intention is well defined (for example, to improve local infrastructure) and are arranged in close collaboration with local authorities (for example, with co-financing arrangements). Design features that contribute to the success of workfare schemes also include (a) organization by private employers and (b) wages set below the market level to ensure self-targeting by the neediest among the unemployed and to prevent participation in public works becoming an attractive alternative to permanent employment.
Source: World Bank (2005), Enhancing Job Opportunities: Eastern Europe and the Former Soviet Union, Washington, DC
The link between benefit receipt and activation is particularly relevant in those low wage areas where combined benefit levels may exceed average wages. While resulting adverse labor supply incentives may trigger a poverty trap, low labor demand may be an equally binding constraint to activation. While labor demand is linked to overall regional economic development and not subject to social policy interventions, the social welfare system should include measures
38

to promote labor supply incentives at any given level of labor demand. One potential way out of the poverty trap is to allow limited continuation of benefit receipt even after entering employment. This bridge benefit approach has been used in a number of OECD countries. Such continued benefit receipt could be at the full social assistance benefit amount or less or at a declining scale and limited to three or six months. Bulgaria is now introducing a benefit to top up the salary for the duration of 12 months paid to those social assistance beneficiaries who find employment at their own initiative for a minimum duration of one year. A bridge benefit could be tested in some low wage municipalities before rolling it out on a larger scale.
Both CSW staff and beneficiaries point out the problem of the lack of an activation mechanism for MOP beneficiaries and the associated poverty trap (Logos, 2006).26.Professionals stated that MOP does not provide work incentives for people who are able to work. Beneficiaries, on the other hand, perceived unemployment as their biggest problem and jobs as their greatest need. They stressed that they are not able to find employment by themselves due to their low education levels, or the generally high rate of unemployment.
In particular, beneficiaries point to the need for both employment and social assistance. However, their views reflect the fact that MOP and employment programs are not well aligned. Beneficiaries expressed doubts about the success of self-employment programs offered by the Republican Employment Agency and concerns about the consequences of failure if they accept participation in such programs. This is why they prefer to remain MOP beneficiaries, even though they call themselves "charity cases.” At the same time, beneficiaries point out that the jobs that are available are often degrading, temporary, and poorly paid. They also note the paradox of experience: without experience they cannot get a job, yet without a job they cannot get the required experience.
Currently active labor market programs (ALMPs) in Serbia are extremely limited. Only 7% of total National Employment Service (NES) budget is spent on ALMPs, and preference is given to those individuals with the biggest chances of being placed in jobs. Naturally, those individuals are not likely to be the poorest ones. Furthermore, the NES is facing a number of severe problems: it lacks funds; is understaffed and is heavily constrained by a fragmented network of employment offices, an old- fashioned system of employment services of limited menu and scope; does not have access to labor market information and the wide range of potential modern labor market measures and techniques.27
In terms of the costs and coverage, ALMPs provided by NES tend to be geared towards the programs with the highest unit costs and limited number of participation. The NES should rebalance the ALMPs towards cheaper measures with low unit costs that reach a larger number of unemployed (job search, skill training programs, job clubs, vacancy and job fairs, virtual enterprises, etc). In addition, the more expensive active job creation programs, such as wage subsidies or self-employment grants should be specifically targeted at the depressed areas, or left to specialized financial institutions.
26 A “poverty trap” occurs when benefits amounts are close to wages, discouraging beneficiaries from working. 27 In 2004, 0.03 percent of GDP was spent directly on ALMPs , and on average over the years 2002-2004, 37,000 unemployed every year (representing about 4 percent of all the unemployed) benefited from them. In EU countries, ALMPs include on average 30 percent of all the unemployed annually.
39

CCC... SSSTTTRRREEENNNGGGTTTHHHEEENNNIIINNNGGG TTTHHHEEE SSSAAAFFFEEETTTYYY NNNEEETTT Serbia’s safety net programs are on a solid footing; however, there is substantial scope for improving their effectiveness, targeting, and impact on those who need them the most. The MOP is the main cash transfer program for the poorest, however, as it only reaches 3 percent of poor households, its impact is limited. Benefit levels are also too low to have a real impact on poverty.
Child allowances are also an important component of Serbia’s safety net. In 2002 the government took an important step to strengthen the coverage of poor households by introducing income and means-testing of benefits. While more recent analysis is needed to assess the current situation, the available data suggest that a significant share of resources go to non-poor households and that tightening targeting could direct more resources to the poor. The next chapter looks at how institutional arrangements and delivery mechanisms affect targeting, with an eye toward potential efficiency gains.
In addition to MOP and child allowances, other social transfers provide non-trivial income support to the poor, including the carers’ allowance, and particularly pensions, which have a significant role in supporting the welfare of the elderly population. Other programs – including the recently expanded birth grant program – are not captured in the household surveys, but need further analysis to assess their real impact on welfare.
Expanding the Safety Net. The impact of the MOP on poverty is limited by its low coverage – the benefit currently reaches only 3 percent of poor households. A substantial expansion of the program is needed to ensure coverage of the poorest. This could be accomplished through more efficient spending within the social protection envelope. There are potential areas for savings in untargeted programs – for example the birth grant – that could be allocated to the MOP. Increasing expenditures on the MOP beyond its current level of 0.14 percent of GDP, while remaining within the current budget envelope, is essential for ensuring an adequate safety net.
Tightening Targeting to the Poor. While the results of the analysis show that the MOP is a well-targeted program, there is scope for improvement – particularly as the program is expanded and the risk of leakage of resources to the non-poor increases. For example, targeting based on income is likely to be underestimating a household’s true welfare in an environment of high informality. Serbia may want to consider trying a proxy-means-testing approach to targeting. A stronger reliance on asset tests may be required to retain the MOP’s targeting if its coverage expands. At the same time, it is important to review the practice of awarding the full benefit equivalent to the eligibility threshold as long as the household’s income is below the threshold, but independent of how much below. The following chapter discusses how improving delivery can tighten targeting. There is also scope for learning from the positive results of MOP targeting to improve other programs. For example, lessons from MOP could be drawn upon to improve targeting of child allowances. Similarly, the MOP could be used as a base benefit for targeting of other benefits, such as health insurance.
Improving Information. Finally, this chapter has highlighted the need to improve the quantitative database for evaluation of social benefit programs. The existing data sources simply do not allow for an up-to-date analysis of the performance of programs at the aggregate level, or their impact on specific population groups – based on ethnicity, gender, or geography.
40

CHAPTER 3: DELIVERY OF SOCIAL ASSISTANCE AT THE LOCAL LEVEL
AAA... IIIMMMPPPLLLEEEMMMEEENNNTTTAAATTTIIIOOONNN AAANNNDDD EEEFFFFFFEEECCCTTTIIIVVVEEENNNEEESSSSSSThe effectiveness of safety net programs and their capacity to reach the poor depends on
a sound legislative framework, but as – or even more – important is implementation at the local level. This section looks into the issues of low coverage and poor targeting from the perspective of delivery, looking at the institutional arrangements, incentives faced by providers, and how they can help explain why some eligible beneficiaries do not receive benefits, and why others do. Much of the material is drawn from the qualitative study and the views of beneficiaries and providers (Logos, 2006).
The poor in Serbia confront barriers to accessing social benefits, and particularly the MOP. Limited public information, communications and awareness are important contributing factors. Both the qualitative and quantitative surveys indicated that many people are uninformed about the criteria for receiving MOP, and simply do not know where to go to get information.
There are also informal costs involved with applying for benefits, some of which are prohibitive, including transport and complex procedures especially a large number of required documents. The rest of this section reviews the institutional set-up for benefit delivery, eligibility criteria and processes for benefit application and obstacles to a more efficient administration of the social safety net in Serbia.
BBB... IIINNNSSSTTTIIITTTUUUTTTIIIOOONNNAAALLL AAARRRRRRAAANNNGGGEEEMMMEEENNNTTTSSS FFFOOORRR BBBEEENNNEEEFFFIIITTT DDDEEELLLIIIVVVEEERRRYYY:::RRROOOLLLEEESSS AAANNNDDD RRREEESSSPPPOOONNNSSSIIIBBBIIILLLIIITTTIIIEEESSS
Responsibility for delivery of cash benefits is divided between the CSWs and municipalities. LSGs are responsible for child allowances and other local benefits, such as subsidies for taxes and utilities, and one-time assistance. The level and availability of benefits other than child allowances depends on the discretion and resources of each municipality. Eligibility criteria are locally determined. Municipal staff, who are generally not trained social workers, assess eligibility for benefits.
CSWs manage the MOP and the other Republican-level transfer programs, including caregiver’s allowances. This division of responsibilities for means-tested benefits between the two separate agencies raises questions surrounding the efficiency and quality of delivery arrangements which are explored further here and in the overview.
Centers for Social Work
Centers for Social Work manage MOP delivery, including assessing eligibility. CSW employees review applications and verify the documentation provided by each applicant. If necessary, social workers conduct home visits to further verify household needs. CSW staff review each case every six months. Actual payment of benefits is made by the MLESP through the post offices. CSWs are organized into teams. Each MOP team includes at least one social worker. Larger municipalities have more than one MOP team and are arranged by geographic area.
41

The MLESP manages a network of 135 Centers for Social Work. According to the legislation, local self-governments are formally the founders of the CSWs. The CSWs serve one or more municipalities, and function as deconcentrated branch offices of the MLESP. The Belgrade Center for Social Work is the largest and covers 16 municipalities. The MLESP employs staff and sets the norms and standards for CSWs, including guidelines for organization, management and staffing. The network of CSWs employs more than 2,600 people, of which about 70 percent are professionals including social workers, lawyers, psychologists, pedagogues, and sociologists.
The primary mandate of CSWs is to implement the Social Welfare Law, including identifying and monitoring the needs of the population. The responsibilities of CSW staff include determining eligibility for cash assistance, including MOP, and directly providing social services, including diagnostic services, counseling, and professional support. Social workers interviewed for the qualitative study noted a number of challenges that they face which limit their capacity to provide quality services. In the first place, because of the large number of documents required to apply for MOP, social workers on MOP teams spend a significant amount of their time checking documents. This shortens the time they are able to spend with their clients and focuses their job on administration and paperwork, rather than on social work.
CSW staff also commented on understaffing and the lack of tools which they have to do their jobs. Many CSWs are understaffed, leaving employees to take on multiple responsibilities. CSW staffing norms are based on 2 social workers per 10,000 population, and have not been updated since 1992.
Staffing ratios vary significantly across CSWs, as found in the study sites (Table3.1). The ratio of staff working in the MOP section to MOP beneficiaries ranged from 120 in Barajevo, the municipality with the lowest number of MOP beneficiaries, to 624 in Novi Sad, the municipality with the highest total number of beneficiaries. On the other hand, the ratio of total CSW staff to beneficiaries was more consistent across municipalities, ranging from 36 to 47 beneficiaries per staff. Workloads can be uneven throughout the year, because of the seasonality of MOP benefits, and because CSW staff have to cover for each other if colleagues are absent.
Table 3.1: Beneficiaries and CSW Staff Numbers in the Study Sites, 2006 MOP
beneficiaries (persons)
Number of CSW
staff
Number of employees in MOP section
Ratio of beneficiaries
to MOP staff
Ratio of beneficiaries to total
CSW staff
Kragujevac 2,573 57 9 286 45Barajevo 600 15 5 120 40Novi Sad 4,991 140 8 624 36Niš 3,397 85 12 283 40Bor 1,359 29 9 151 47Source: Logos, 2006, authors’ calculations.
Because of heavy workloads, social workers often have limited time to spend with their clients, and interactions can become abrupt and bureaucratic. CSW staff also noted the lack of vehicles, which prevents them from doing field visits. Lack of information technology and databases was also noted as an issue. Despite these constraints, CSW staff note that they manage to cope. A staff member from Kragujevac mentioned:
42

The CSW is understaffed in all social welfare services. In addition, we have a problem of fieldwork due to the lack of vehicles. Currently, this problem is being resolved by better planning of visits to families according to their location. Professional training for CSW staff is limited, and generally focused on interpretation of
new legislation. Training mentioned by staff included computer skills and interpretation of the new Family Law. Only one respondent had undergone training on the revised MOP regulations organized by the MLESP. Staff noted a need for training for social workers on how to provide better outreach to beneficiaries.
Constraints on CSW staff were perceived by beneficiaries and NGO staff as well. From their perspective, the staff whom they interact with can be overwhelmed, underpaid, and have limited time to spend on their cases. An NGO staff member in Nis noted that because CSW caseloads are so high, staff lack incentives to go beyond their immediate responsibilities to help clients and coordinate with other services provided by local partners. Another NGO official in Bor noted that the work of the CSW was slow and bureaucratic, discouraging the kind of innovation that would be needed to identify local needs and provide preventative services.
CSW officials are aware of the frequent complaints of beneficiaries concerning their abrupt handling of clients and explain this in several ways. Part of the problem relates to organizational and technical issues. Some officers lack adequate training; others are asked to handle multiple responsibilities because of the overall heavy workload, resulting in frustration and a sense of futility which can lead to conflicts with beneficiaries. In other cases, CSW staff who seek to remain detached and strictly professional in their work are considered cold and reserved toward beneficiaries and do not have good communication with their clients. Other problems arise when beneficiaries present inadequate documentation or incorrectly completed forms leading to the frustration of all concerned.
Local Self Governments
Local self-governments have responsibility for delivering child allowances, financed through the Republican budgets, and “extended rights,” which include social services such as home care assistance, day care, temporary accommodation in shelters, foster care, one-time assistance and a range of community-based welfare services, all financed through the municipal budgets. Municipalities and towns may opt to provide additional services or supplementary resources to beneficiaries, depending on their financial capacity.
Services for administering child allowances in local governments are almost uniformly organized across municipalities because of the Law on Administrative Procedure, which governs local administration. An office within the local government receives the applications and refers the documents to the staff responsible for determining eligibility. Decisions are ratified by the supervising Department Head. There is some variation in the way that local governments handle roles and responsibilities. For example, in some cases officers working with beneficiaries are relieved from handling documents, leaving them with more time for communication and teamwork.
Professional staff from departments for child allowances generally expressed job satisfaction and did not mention lack of human resources and heavy workload, except during periods of intense work (e.g. in November when child allowance applications are due), or in
43

cases when, due to introduction of new regulations, their caseloads increase.28 Legislative norms restrict caseloads to 1,500 to 2,000 cases per professional staff. Because child allowance applications do not require a home visit or frequent recertification, the administrative burden is lower than for the MOP. However, some municipal officials do make home visits and take the opportunity to inform beneficiaries about other programs (e.g. MOP).
Training for child allowance administrators varies across local governments. Interviewed staff mentioned participation in various programs, including professional seminars in the area of social welfare, time and stress management, and training for working with vulnerable groups. Some of them had participated in specialized courses on the application of new legislation.
NGOs
NGOs play a wide range of roles in social benefit delivery, including assisting with outreach and helping poor families and individuals access cash benefits. These services can include: (i) informing people about their rights and the eligibility criteria for different programs, (ii) helping people with gathering documents and filling out forms, (iii) making appointments and mediating contacts with CSWs, (iv) representing beneficiaries in procedures (e.g. writing petitions in support of applicants), (v) referring them to the Complaints Commissioner for appeals, and (vi) requesting field visits by CSWs. Sometimes NGO professionals have difficulty information beneficiaries about program details if they are not fully acquainted with the legislation.
Inter-Agency Coordination
Coordination between the local actors is generally ad hoc, depending on the people involved and the local environment. There are currently no networks or shared databases between the CSWs and LSGs to exchange information on beneficiaries. As a result, means-testing and monitoring of beneficiaries is done separately by both institutions. This creates a burden on beneficiaries, who have to produce documentation to apply for both the MOP and child allowance, as well as on providers in CSWs and LSGs, who cannot benefit from shared information. An official noted: “All services need to be networked through computers instead of making us run from door-to-door, town-to-town.”
Overall coordination between the government agencies (CSWs and LSGs) and the NGO sector is limited by the absence of a law governing NGO activity in Serbia. The qualitative study found that cooperation is nearly always one-way, initiated by NGOs toward CSWs or local governments. NGOs tend to play a compensating role, assisting beneficiaries when CSWs or municipalities are unable. On the other hand, CSWs rarely make use of the capacities and knowledge of NGOs. Professional staff in both CSWs and NGOs emphasized the need for greater cooperation.
Cooperation between the municipality and CSW has the potential to improve the quality and availability of information about programs. It would increase the CSW’s knowledge of beneficiaries’ needs and abilities to meet eligibility requirements while, on the other hand, improve the ability of NGO staff to help beneficiaries. Coordination with other agencies
28 For example, new regulations on extension of parental allowance to the first child for which applications have been received starting from January 1 2006, and have still not been handled because instructions and decisions are still not in place
44

involved in social assistance, including the police, health care institutions and Commissioners for Refugees, would also facilitate better service delivery and referrals.
CCC... AAACCCCCCEEESSSSSS AAANNNDDD OOOUUUTTTRRREEEAAACCCHHH
Eligibility for Cash Benefits
Despite the rigidity of the requirements for applying for MOP, there is still a significant element of subjectivity and discretion involved in assessing eligibility criteria. Social workers noted the lack of transparency, inflexibility of procedures – especially in relation to borderline cases, and significant arbitrariness in assessments during home visits. Respondents reported that criteria were fungible and criticized CSW staff for basing their decisions on the appearance of their residence.
Some of the criteria, such as living conditions, provide applicants with incentives to deceive professionals. Respondents cited cases where applicants hid some of their belongings, or deliberately failed to maintain their home in good condition, for fear that having a neat and good-looking home might cause them to lose access to benefits. Similarly, application of a single criterion – such as ability to work – at times led to denial of assistance of those who, though willing, may not be able to find work, or who cannot work due to their single-parent status. Beneficiaries explain,
If my house is dirty and messy, if my chairs are broken, I can get social assistance. A problem arises when the CSW commission visits us and sees some good stuff in the house, they tell us to sell it to buy food. Applicants are required to fill out a form in which they report undocumented income.
Beneficiaries often underreport and feel embarrassed by the ethical implications of doing so, but feel like they have no choice. On the other hand, they openly speak about not being able to rely solely on MOP. They apply for cash benefits because they cannot cover their basic needs with their irregular and poorly remunerated seasonal jobs.
Professionals are also aware of the difficulties of making objective assessments. Staff find fieldwork extremely difficult, despite the clarity of the regulations, they often have to make judgment calls. For example, they have to decide whether an old wreck of a car parked in the yard of an applicant should be noted as possession of a car. Informal employment is the biggest problem. A social worker noted a typical dilemma:
When all papers are all in order, but this person just shouldn’t receive MOP – according to your assessment. You see him trading on the market but the stall is not officially owned by him. You know that he draws income but cannot prove it. Eligibility criteria for child allowances are very strict and based upon document
requirements which are difficult for some people to obtain. For example, while single unemployed mothers are often in need of financial support during a divorce process, they sometimes cannot obtain relevant documents to apply for child allowances. Very poor families without a permanent residence lack adequate documentation for their apartments and assets. As a result they are denied benefits.
Access to benefits and services may improve with introducing the function of broker/facilitator who can guide clients through the complex system of benefits and services advise on applicable support and help with obtaining the relevant documentation required. The
45

formal function of facilitator has been successfully introduced in the US to help marginalized groups to better access social services and benefits. While in Serbia the CSWs are in principle expected to take on this role, it is important to make staff available specifically for this function, as otherwise this role is at risk of being crowded out by other activities, and to train staff for this work. Alternatively, NGOs could assume this role in partnership with the CSWs.
Communications with Beneficiaries
Lack of detailed information about the MOP program and its eligibility criteria is an obstacle for many beneficiaries. This is due to the small size of the MOP and the limited budget. CSWs simply do not have the incentives to expand the base of beneficiaries beyond their current caseloads, regardless of the need. Busy CSW staff also lack time to focus on outreach to new clients. Lack of training in outreach and limited availability of vehicles also prevents social workers from getting out of the office to meet with new potential beneficiaries.
According to the SLS survey, in 2003, only 73 percent of poor Roma households who had applied for the MOP actually received it – this was in contrast with 94 percent for child allowances.29 Others did not apply for the benefits in the first place. The survey pointed to a number of reasons for these gaps. For MOP, around 50 percent of the poor stated that they either did not know about the program, or did not know how to apply. For child allowances, the main reason for not applying was a perception that the household would not be eligible, highlighting a need for better understanding and awareness about the benefit.
Figure 3.1: Reasons for Not Applying for Benefits (% of Roma Household)
0%
20%
40%
60%
80%
100%
Non Poor Poor Non Poor Poor
MOP Child Allowance
Already receive it
Will not meet criterionfor selectionAdministrative Proceduretoo difficultNot aware how to apply
Not aware of program
Don't need it
Source: Own calculations based on Serbia 2003 SLS and Roma Booster; “Roma” relates to Roma households residing in settlements
In the qualitative study, current and potential MOP beneficiaries explained the difficulties that they face in getting information about programs. In some cases beneficiaries do not understand the information provided by the CSWs because of illiteracy, or lack of Serbian language ability. The available information is often confusing and not presented clearly. Beneficiaries noted that it was sometimes difficult to get correct information about regulations and procedures, increasing the time that they spend applying and/or waiting at the CSW.
Beneficiaries point out that citizens are largely uninformed about the criteria for receiving MOP, and report that many in need of income support do not know where to seek information. For the most part, beneficiaries rely on other MOP recipients for information about eligibility
29 The booster sample of Roma households included in the 2003 SLS included questions about why households did not receive benefits. These questions were not included in the main SLS.
46

and procedures. Professionals largely agree with beneficiaries who complain about unclear criteria and lack of transparency in the rules. They know that many people are not informed about their rights and eligibility for assistance. Lack of information is particularly prevalent in rural areas, and among Roma families, who often do not know about the types of assistance they may be entitled.
Costs of Receiving Benefits
Accessing benefits involves a range of formal and informal costs. Applying for the MOP benefit is a complicated process, requiring a large number of separate documents (Box 3.1). These procedures place a burden on beneficiaries and social workers alike. In addition to the large number of documents required, costs include fees for obtaining official documentation, transportation costs, and frequent requirements for renewing documents. In some cases, the institutions which issued the documents have been relocated to areas where beneficiaries cannot afford to travel. These costs are prohibitive for some households and the risks of being denied benefits deters many from applying in the first place. Respondents feel particularly discouraged by the fact that they are required to go from office-to-office to submit the various documents. Requirements for renewing documents are frequent – every six months in some cases. Respondents particularly questioned the need to present their birth certificates every six months. A beneficiary noted:
They tell me they are not sure that I’m eligible, but still advise me to gather all the documents. This means that I need to spend money not knowing whether I’ll receive something.Applicants who are not able to provide a complete set of documents for MOP and child
allowances do not receive benefits. Some beneficiaries, especially IDPs from Kosovo, face particular difficulties in acquiring residence documents, which require them to return to their birthplace to pick them up. Others, mainly Roma, do not have documents as they were not entered in the Register of Births. Refugees from Bosnia are required to return to Bosnia to obtain evidence of property ownership.
As of late 2005, Serbia still had 208,000 IDPs from Kosovo.30 While the exact breakdown of this figure is unclear, an estimated 40,000-50,000 of the IDPs are Roma, Ashkaelia and Egyptians from Kosovo. Many Roma households in particular remain unregistered, in particular those residing in settlements. Non-registration can take the form of a lack of a legal address and therefore residential registration, or individuals are simply without birth certificates, identification cards or a passport. Almost 80 percent of internally displaced Roma in 2003 did not even apply for the MOP, as compared to 45 percent of non-IDP Roma (Bodewig and Sethi, 2005).
30 UNHCR (2005), ICRC (2005).
47

Box 3.1: Documents Required to Apply for MOP and Child Allowances
According to the Serbian Law on Social Care and Provision of Social Security of Citizens, the right to MOP is based on a number of characteristics of the individual and family, such as income, family assets, the employment status and nature of the cause of unemployment of household members and others. In order to determine eligibility, the Centers for Social Work have to conduct a comprehensive review of the multiple documentation allowing an assessment of the individual’s or family’s need. As noted, many Roma households, and IDPs in particular, do not hold even basic citizenship or residential registration documents, making it difficult for the CSW staff to assess their need based on formal documentation. Such documentation includes the following:
For MOP 1. ID card 2. IDP registration card (if applicable) 3. Witness’s declaration of shared household – issued by the municipal administration in the temporary place
of residence 4. Proof of citizenship 5. Salary certificate (‘working booklet’) - issued by dislocated employer company/ institution or
Unemployment certificate – issued by the Bureau for Employment in temporary place of residence 6. Pension certificate or certificate confirming that the person does not receive pension - issued by dislocated
Pension Insurance Office (dislocated PIO) 7. Birth certificate – issued by dislocated Registry Office 8. Death certificate – issued by dislocated Registry Office (if pensioner or other family member has died) 9. Marriage certificate – issued by dislocated Registry Office (if applicable) 10. Divorce ruling – issued by court where the procedure was initiated (if applicable). 11. Certificate issued by the internal revenue service (tax administration) in temporary place of residence. 12. Certificate issued by land survey authority (cadastre) in temporary place of residence 13. Certificate confirming schooling for children over 15 14. Certificate confirming a person unfit for work issued in temporary place of residence or by dislocated PIO
(if applicable) 15. Court document certifying that the applicant cannot rely on family support (if applicable) 16. Document showing inheritance or lack of inheritance 17. Bank account statements
For Child Allowances 1. Abstract from the Register of Births for all children. 2. Certificate of Serbia and Montenegrin citizenship (issued no later than six months prior to application). 3. Copy of ID cards of adult household members, and for children, registration of permanent residence. 4. Copy of a valid medical insurance card. 5. Income statement for three months preceding the application for all household members. 6. Certificate from the tax register for the previous year for all household members and a certificate from tax
register from the birthplace of spouses. 7. Declaration of joint household. 8. Declaration of direct custody of children. 9. School certificates for primary and secondary school children. 10. Evidence on property and living accommodation (e.g. excerpt from the land registry – title, contract, notice
of tax assessment, certificate of the Republic Geodetic Bureau, Agreement on Occupancy). 11. Declaration of non-possession of liquid assets. 12. Certificate issued by the relevant health institution with evidence of the reasons for irregular schooling.* 13. Document of classification for children with disabilities.* 14. Document on extension of parental rights.* 15. Evidence on single parent status (Death Certificate of other parent, divorce certificate, certificate from military authorities, certificate from correctional institution).* 16. Evidence of unemployment.* 17. Evidence of custody, fostering (document issued by relevant custody authorities).* 18. Copy of current account card.* * Submitted only if evidence of such status is required.
Sources: Law on Social Care and Provision of Social Security of Citizens and ICRC, 2005; Logos, 2006.
48

There are also obstacles to obtaining citizenship certificates. Unregistered children cannot get refugee identification cards and sometimes families cannot afford these documents. Older people can also face difficulties because they are required to present a certificate of employment for their children, but some have lost contact with their families. These problems are shared by those who live in unregistered houses, as they lack residence documents.
Professional staff in CSWs agree that the process of assessing eligibility and submitting documents can be frustrating for both employees and beneficiaries. Their work becomes excessively administrative and bureaucratic, and makes it difficult for them to respond to the needs of their clients. The lack of a unified database for beneficiaries increases the bureaucracy and the time it takes to serve clients.
Beneficiaries wait in corridors in front of doors, they fill out forms sitting on the edge of the bench, they are forced to stand while receiving instructions and those that are illiterate require more explanations and clients are often irritated, have to come more than once and pay stamp duties.
There are also costs associated with receiving benefits. Beneficiaries are required to collect their benefits through post offices and banks – a change from past procedures when benefits were delivered through the mail. Beneficiaries noted the having to pick up their benefits in person and frequently wait in line. This is a particular challenge for the elderly and disabled and for single parents who have to arrange for childcare.
Stigma and Discrimination
The stigma associated with being a MOP beneficiary was noted as a deterrent to applying for benefits for some. Respondents in the focus groups discussed the lack of dignity they feel from being on welfare, their concern for being a burden on society, and feelings of being perceived as second-class citizens. As a result, they are reluctant to apply for assistance and do so only when all other options have been exhausted. Providers also explained some people perceive child allowances are a form of charity and are therefore reluctant to apply for benefits. Recently terminated workers were most reluctant to apply for assistance. They feel embarrassed to seek assistance, and feel like going to a CSW for help is a form of punishment. Despair and depression are common. An unemployed applicant noted: “The first time I went there my hands were shaking, I was ashamed.”
49

Box 3.2: Outreach to Roma through the Social Innovation Fund (SIF)
A project supported by the Social Innovation Fund piloted approaches for reaching poor Roma households in Southern Serbia. The project was implemented by the Association for the Improvement of Roma Settlements in partnership with Centres for Social Work in Lebane, Vladicin Han, and Bela Palanka muncipalities.
The project aimed to improve outreach of social benefits and services. A group of volunteers was trained as community advocates to work within the Roma settlements. Most volunteers were from the communities themself. They aimed to identify the barriers Roma face in accessing services, especially the lack of information on eligibility and application procedures and the issues in obtaining the necessary documentation. The project aimed to facilitate close cooperation between the volunteers and social workers in CSWs, and alleviate the heavy workload of the social workers. Both groups worked together to ensure that the clients were able to obtain the personal documents (ID cards, health care cards etc) required for accessing services.
During the initial training the social workers would accompany the volunteers in the settlements, or work with volunteers in the CSWs on the admission of the requests. Later on, the volunteers gradually assumed responsibility for the administrative work and could advise beneficiaries on how to meet the documentation requirements. Eventually the beneficiaries were better informed and able to provide more complete applications.
Beneficiaries were either identified through field work and home visits, or at the CSWs. Sometimes volunteers accompanied clients to the other service agencies, such as municipalities, or the health care administration if there was a need to obtain documents on those places. The volunteer acted as interpreters of a kind, advocating on behalf of the beneficiaries. To encourage this process further more, a small fund was made available for the payments for the documentation, for those cases where beneficiaries were unable to bear the expenses themselves.
The achievements of the project were:
Documentation obtained for beneficiaries (138 birth certificates, 182 identity cards, 24 residency certificates, 14 citizenship certificates, 136 health cards, 103 employment cards);
Positive partnerships established between the Centres of Social Work, NGOs and Roma volunteers;
Relatively low cost of obtaining the documents (e.g. administrative fees and rewards for volunteers);
A high degree of satisfaction among the participants and beneficiaries;
The most important lesson of the project was that outreach programs can be tailored to the needs of specific communities. The project demonstrated innovative approaches to the delivery of social services and benefits and illustrated that grassroots volunteers can play a role in improving public service provision. The project also contributed to building positive attitudes toward the Roma population in general and ensured better understanding of their needs amongst different stakeholders. The project highlighted the importance of outreach and participatory approaches to problem solving. The approach could be replicated in other public services or even in other areas of service delivery for Roma and non-Roma communities.
Source: Social Innovation Fund.
DDD... CCCOOONNNSSSOOOLLLIIIDDDAAATTTIIINNNGGG BBBEEENNNEEEFFFIIITTT DDDEEELLLIIIVVVEEERRRYYYImplementation matters. This chapter has discussed how the institutional arrangements
for delivery of social assistance – and particularly the MOP and child allowances – influence access and effectiveness. The resources of CSWs and LSGs, including staffing numbers, professional skills of staff and the tools at their disposal – such as vehicles and information systems, influence their capacity to do their jobs. Beneficiaries and providers alike identified opportunities for change to improve the quality of delivery and access for the poor.
50

A critical issue, with much potential to influence the effectiveness and efficiency of delivery is the division of responsibilities for administration of MOP and child allowances – both means-tested benefits, between CSWs and LSGs. Beneficiaries and providers alike saw much to gain from consolidating these responsibilities to reduce administration costs, but also the costs to beneficiaries, who need to submit separate applications and sets of documentation to two offices, as well as for staff, whose time is consumed with managing the administrative side of social welfare, rather than focusing on the individual needs of their clients.
While there is agreement on the need for reform, the precise next steps are less clear. This is largely because there are many options, and the information base needed to evaluate and choose from these options is not in place. Consolidation could involve actual merging of the two benefit programs into a single benefit, or keeping the programs separate and merging administrative functions – either under the CSWs or LSGs. Such changes will require careful attention to roles and responsibilities for administering and financing the benefits. These issues need to be considered in the overall context of increasing decentralization of social welfare in Serbia
A Single Consolidated Benefit?
The PRS, launched in 2003, proposed, as an option, “the integration of the social assistance and child allowances into a single unique transfer that could be called a family allowance.”31 The idea of a single consolidated welfare benefit, which would take into account various household characteristics in determining benefit levels, has been gaining currency in other countries. This option would be the most desirable.
A single welfare benefit would have one set of rules, administrative and institutional requirements, and source of funding. It would be transparent, low on administrative costs, and easy to communicate and understand. A single benefit could incorporate the objective of providing increased support to families with children through a benefit formula that would provide higher benefits based on the number and age of children in the family. Such an approach is currently used in Bulgaria within its social assistance system.
However, a single benefit may not be as desirable from a political economy perspective if it created the perception that child allowances were being eliminated. Child allowances in Serbia – although means-tested – have twin objectives of providing income support to the poor, as well as supporting families with children. In the context of declining fertility, support for child-rearing has a political component. A well-designed public information campaign could facilitate the reform by clearly communicating that the consolidated benefit maintains the same objectives of the child allowance, with strengthened support to the poorest families.
Responsibility for delivering the unified family allowance could be with either the LSGs or CSWs. As discussed below, the LSGs would have a comparative advantage in being the lead institution for delivering the allowance.
Delegating MOP Administration to Local Governments
A second best option would be to maintain the two separate benefits and transfer responsibility for delivery of the MOP program to LSGs. This would have the benefit of reducing administrative costs, simplifying procedures for both beneficiaries and providers, and
31 Poverty Reduction Strategy Paper for Serbia, 2003.
51

freeing social workers from verifying documentation and paperwork. Such delegation would require careful planning, to ensure that there is sufficient staff capacity in LSGs to handle the increase workload. This could include transferring some of the staff currently working on MOP in the CSWs to the LSGs. A key question to be resolved would be whether LSG staff would conduct the field visits for verifying the income and assets of beneficiaries, or whether this would continue to be done by CSW social workers.
Regardless of whether field visits are done by social workers sitting in CSWs or LSGs, close coordination between the two institutions will be essential. CSW, as the agency with main responsibility for assisting vulnerable groups, has the mandate and capacity to work closely with beneficiaries and respond to their needs. Field visits for verifying MOP should be closely coordinated with fieldwork by social workers to provide outreach and referral services – especially for clients (e.g. elderly and the disabled) who are unable to travel to apply for benefits.
Consolidating Benefit Delivery in CSWs
A third option, would be to consolidate responsibility for delivering MOP and child allowances within the CSWs. This would have all of the benefits of administrative consolidation. However, as there are fewer CSW offices than LSGs, it would leave beneficiaries with fewer locations to apply for benefits, increasing transportation costs. It would also require a substantial increase in administrative staff capacity in CSWs to handle large number of applications for child allowances (e.g. 485,000 children received benefits in 2005).
On the other hand, transferring responsibility for delivering the child allowance to CSWs could build on the successful experience of targeting the MOP, and potentially improve targeting of child allowances by drawing on the existing capacity. It would allow for a “one-stop” shop approach for beneficiaries with cash benefits and services merged into one office.
Table 3.2: Consolidating the MOP and Child Allowances at a Glance Option Pros Cons Key Preconditions and
Considerations
(i) Create a single benefit
Reduce documentation requirements; Reduce administrative costs;Simplify procedures; Improve targeting by reducing opportunities for errors across two programs.
Political economy concerns (e.g. that child benefits are being eliminated).
Benefit design needs to incorporate extra support to families with children; Public information campaign; Should LSGs or CSWs deliver? See below.
(ii) LSGs administer both benefits
Simplify procedures, reduce costs; Build on LSG capacity; Take advantage of local knowledge.
Potential weakening of targeting if CSW expertise in means-testing is not utilized.
Adequate staffing to cover workload (potential transfer of CSW staff); Coordination with CSWs on fieldwork; Information-sharing with CSWs; Coordination on field visits, referrals to social services.
(iii) CSWs administer both
Build on successful CSW targeting of MOP; Take advantage of CSW
Increase transport costs (fewer offices); Greater
Adequate staffing to cover workload (potential transfer of
52

Option Pros Cons Key Preconditions and Considerations
benefits capacity for means-testing; Link MOP with social services and other CSW provided benefits through a “one-stop shop” approach.
administrative burden for CSWs. Reduces LSG involvement in social welfare.
LSG staff).
Choosing a Way Forward
The information needed to make choices about where to locate responsibility for benefit administration is not yet available. A more detailed analysis of the current administrative costs of delivering MOP and child allowances in CSWs and LSGs is needed – including staff and other associated costs (e.g. office space, equipment, vehicles), and opportunity costs. A feasibility study looking at the costs of the three main options and the existing capacity is being needed. This should investigate options for coordinating or sharing responsibility for field work between the LSGs and CSWs, and how referrals to social services could work. Such a study could develop a set of options for piloting and evaluation in a subset of municipalities, prior to the development of a national plan and roll-out.
EEE... SSSTTTRRREEENNNGGGTTTHHHEEENNNIIINNNGGG TTTHHHEEE SSSAAAFFFEEETTTYYY NNNEEETTT::: NNNEEEXXXTTT SSSTTTEEEPPPSSSRegardless of whether the benefits are consolidated and which institution ultimately has
responsibility for administration, this chapter highlighted a number of critical areas for improving access and quality of delivery. These include improving outreach and communications, modernizing delivery through the use of technology and shared databases, simplifying eligibility criteria through reducing the number of documents required, facilitating access for vulnerable groups who lack documentation, training for front-line staff, facilitating NGO involvement, and better public information to reduce the stigma associated with social assistance.
Outreach to the Poor… A limitation of the current system is the absence of opportunities and incentives for CSW social workers to visit poor households and communities to identify and respond to their needs. Outreach should be an integral part of the work of CSWs, to facilitate access to both cash benefits and social services. Social workers need professional training in working with vulnerable groups, including attention to the specific needs of Roma, IDPs and refugees, as well as access to vehicles to reach their clients. Training on how to conduct home visits to assess benefit eligibility is important for staff in both CSWs and LSGs.
…Especially to Roma and other Excluded Groups. Focused efforts are needed to ensure that outreach is intensified in Roma settlements and other excluded communities, not generally visited by social workers. CSWs and municipal authorities as well as Roma associations can benefit from experience from the Social Innovation Fund (SIF), which has piloted new ways of social service delivery and management in partnership with NGOs, including support for Roma-centered projects. The CSWs are also possibly a key tool in overcoming service access barriers resulting from lacking residential registration (discussed further below).
Focusing CSWs on Social Work. Strengthening the focus of social workers on work with beneficiaries will require attention to human resources, to strengthen the professional skills of staff in CSWs, and to revise the outdated staffing norms for CSWs, based upon the actual workload. A human resources capacity review will be an important first step. The formal
53

function of a facilitator who can guide clients through the complex system of benefits and services, advice on applicable support and help with obtaining the relevant documentation required has been successfully introduced in the US to help marginalized groups to better access social services and benefits. While in Serbia the CSWs are in principle expected to take on this role, it is important to make staff available specifically for this function, as otherwise this role is at risk of being crowded out by other activities, and to train staff for this work. Alternatively, NGOs could assume this role in partnership with the CSWs.
Simplifying Documentation Requirements for Social Benefits. Applications for MOP and child allowances require extensive documentation, burdening beneficiaries and providers alike. In addition to the extensive number of documents, there are requirements for frequent rechecking (e.g. every six months in some cases).32 A preferred option would be to unify the document requirements for MOP and child allowances, so that they are the same for both benefits. This would be facilitated by administrative consolidation or, if possible, unifying the benefits into the proposed “family allowance.” Regardless of changes to program design and institutional responsibilities, the documentation requirements should be updated and simplified. An easy first step would be to reduce requirements for twice-yearly verification of documents for birth certificates and other documents that will not change over time.
Ensuring Registration of Roma IDPs. Roma households, and particularly Roma IDPs often lack the most basic form of documentation – residential and citizenship documents. Tackling the problem of lacking citizenship and residential registration is challenging given complex associated legal dimensions. These issues lie beyond the scope of this report. Authorities need to intensify efforts to ensure residential registration of Roma, including those residing in settlements and in particular Roma IDPs, to ensure access to municipal services even without legalizing such settlements. While a new and comprehensive registration effort is required in the long term, allowing Roma households to access, in addition to residential and citizenship registration documents, such varied types of documents such as birth certificates and marriage licenses, temporary solutions are needed in the short term. This could involve applying temporary “proxy-residential registration” through the municipal CSWs or allocating temporary numbers to households instead of addresses.
Upgrading Information Systems. There is much to be gained from improving the quality and availability of information on the administration of social benefits. Within the MLESP system, there is currently no shared database for managing the MOP program, or other social benefits. Each CSW keeps its own records, either on its own computers or on paper. Similarly, there are no shared databases with other institutions involved in social protection – for example with local governments, labor offices, or the social insurance administration. A networked inter-agency information system would improve targeting – by maintaining current information about the eligibility status of beneficiaries. Such a system should pay close attention to protecting the privacy of the population, through close attention to confidentiality of individual records and adherence with national privacy guidelines.
Implementing Public Communications. Better analysis can also contribute to efforts to improve public awareness about the social welfare system in Serbia. This is important for two main reasons: first, to improve access, since a sizeable share of the eligible population do not apply for MOP benefits because they lack information about the programs and how to apply; and second, to increase awareness among the public at large regarding the objectives and impact of
32 See box # for a complete account of paperwork requirements.
54

social welfare programs in order to overcome the stigma associated with receiving social benefits.
Improving Survey Data. A related issue is the need to improve survey data for monitoring and evaluating the effectiveness of social protection programs. This report underscores the limitations of the current databases. In particular, the HBS survey does not include sufficiently detailed questions on benefit programs to allow for analysis of the performance of specific programs. Similarly, the sample size of the HBS is too small for disaggregated analysis. The on-going efforts to improve the HBS as the main tool for poverty analysis in Serbia need to continue, with specific attention to expanding the module on social benefits, and considering the use of periodic booster surveys of the beneficiary populations to allow for detailed analysis. Such longitudinal data will be essential for monitoring the impact of future reforms.
55
CHAPTER 4: INCREASING LOCAL INVOLVEMENT IN SOCIAL WELFARE
AAA... IIINNNTTTRRROOODDDUUUCCCTTTIIIOOONNNDecentralization is an increasing policy focus in social welfare in Serbia. The
MLESP’s Strategy highlights increasing decentralization and local involvement in welfare provision as a major priority for the next phase of reforms. Decentralization is also important for European integration and demand for greater local and regional autonomy and involvement in service delivery.
Decentralization has the potential to improve social service delivery, by bringing services closer to clients and strengthening the capacity of local governments and providers to plan and deliver services, and to monitor outcomes. However, it also entails risks, particularly for social welfare. In the absence of sufficient attention to local resources and capacity, decentralization can lead to an erosion of services. It can also deepen geographic inequalities – if poorer municipalities with the least resources are unable to maintain services.
Increased participation of beneficiaries in governance and service provision has the potential to strengthen accountability of services, and eventual outcomes. Public involvement can increase the demand for quality services and strengthen incentives for providers. The World Bank’s 2003/04 World Development Report, Making Services Work for Poor People, noted that accountability of services can be strengthened through greater responsiveness of politicians and policy-makers, who in turn can influence the policies of service providers – the ‘long-route of accountability’. There is also scope for strategies to strengthen the ‘short route of accountability’, through which citizens can have a direct influence on service providers.
This section looks at considerations for increasing local government involvement in social welfare, mainly through the lens of social services. Because decentralization of social welfare can only take place within the broader context of decentralization in Serbia – with attention to the full range of issues from intergovernmental finance, to local public administration – this section does not provide a complete or in depth discussion. Rather it raises issues, which will require attention as the policy dialogue surrounding decentralization in Serbia intensifies.
BBB... DDDEEECCCEEENNNTTTRRRAAALLLIIIZZZAAATTTIIIOOONNN IIINNN SSSEEERRRBBBIIIAAA Decentralization of social welfare in Serbia can mean different things – referring to the transfer of responsibility of the financing, delivery, and/or quality control to lower levels of government. In general, the literature distinguishes between three major forms of decentralization based upon the level of authority, ranging from simple dispersion of central government responsibility to central government regional offices—deconcentration—to full privatization.
56

Decentralization has many different aspects including allowing local government representatives to be selected through local elections (political decentralization),transferring authority and responsibility for service delivery to local governments (administrative decentralization) and shifting authority to raise adequate revenues and to make expenditure decisions to the local level (fiscal decentralization). There are three main forms of decentralization:
Deconcentration occurs when lower levels of government (e.g. regional or municipal) execute functions on behalf of the central government without having decision making authority. The lower levels of government essentially function as “branch offices” of the central government. In Serbia, CSWs are deconcentrated offices of the MLESP.
Delegation is the process in which the central government transfers decision making over certain functions to relatively autonomous local governments, which have limited autonomy and are ultimately responsible to the central government. Delivery of child allowances in Serbia is currently delegated to LSGs. While local officials make decisions regarding eligibility for the benefits, they do so under centrally defined rules and central government financing.
Devolution involves the complete transfer of decision making over finance and management of public services to quasi-autonomous local government units. Devolution usually transfers responsibilities for services to municipalities where residents elect their own mayors and council members, revenues are raised locally and local governments have independent authority to make investments. Limited social services are currently devolved to LSGs in Serbia. LSGs have the discretion to initiate, deliver and finance social services in their locality.
There is significant disparity in the fiscal capacity of municipalities both in terms of total social welfare spending (additional services, residential care, one-off social assistance) and their contribution to the functioning of CSWs. In 2004, the great majority of LSGs spent limited portion of their budgets (less than 2 percent) on social welfare, mostly on one-time social assistance payments. The ratio of municipal contributions to the budgets of CSWs in 2004 varied from 0.4 percent (Aleksinac) to over 50 percent (Kragujevac, Temerin). In general, the richer cities and municipalities spend more on social welfare. With 12.5 million euro, the City of Belgrade financed additional and one-off benefits and services (63.1 percent), residential care (17.4 percent), and CSWs (19.5 percent) in 2005, and continues to spend significantly more than other cities.
Table 4.1: Social Expenditures by Municipality, 2004
Municipality Population
Republican (MLESP) contribution to the CSWs budgets (percent)
Ratio of the municipalcontribution to the CSWs budgets (percent)
Ratio of Social Welfare Funds in the Local Budgets (percent)
Belgrade – the City33
1,574,050 51.26 46.01 2.66
Kragujevac 175,182 38.47 55.29 0.21
33 Seventeen municipalities comprise the city of Belgrade.
57

Novi Sad 298,139 67.22 23.39 0.99 Nis 250,180 59.29 32.28 0.50 Bor 55,739 63.91 20.07 0.60 Aleksinac 57,044 94.58 0.44 1.75 Source: Annex 6, Strategy for Development of Social Welfare: Key Issues in Funding and Financing, DFID supported project on Social Policy Reform: Building and Strengthening State-Civil Society Partnerships to Reduce Poverty and Social Exclusion in Serbia, Belgrade, December 2005
The number of staff involved in the delivery of social benefits and services depends on the size of towns and municipalities. The vast majority of Serbian municipalities fall in the 10,000-100,000 range.34 The qualitative analysis has shown that CSWs activities are organized through different modalities of individual and team approaches and still varying number of professionals across comparable teams. At the same time, the organization of services for the administration of benefits in LSGs is almost uniform but involves a much smaller number of staff. If not properly addressed, the issue of the huge variation among municipalities in terms of their size and both local personnel and fiscal capacity may represent a major obstacle to further decentralization in Serbia.
Planning for further decentralization of social welfare benefits and services will need to be set within an overall plan for decentralization at the local level. This should include framework legislation on intergovernmental finance and local public administration, along with capacity building for implementation. At the time of writing, two important laws were in process in Serbia – on intergovernmental finance, to determine the revenue base for LSGs, and property rights, a precondition for local government borrowing.
Serbia can benefit from the experience of other countries in the region on the decentralization of social welfare benefits and services. In Romania, for example, financing of social assistance benefits was recentralized, after decentralization led to an erosion in provision (Box 4.1).
Box 4.1: Decentralization of Social Welfare in Romania, A Cautionary Tale
In October 1998 Romania passed a Law on Local Public Finance, which significantly increased financing responsibility of local governments, transferring to them the majority of responsibility for financing social assistance and child protection cash benefits and services, alongside increased responsibilities in education and housing. The Law also granted local governments with new revenue sources, including shared tax revenues with the central government, and local taxes and fees.
Implementation of the new Law proved a challenge. Total spending on social assistance and child protection – including benefits and services for the disabled and elderly – dropped nearly 40 percentage points in real terms between 1996 (when fiscal decentralization began) and 1999. Cash benefits in particular plummeted to 16 percent of 1996 levels during the period. Because of the lack of resources, local governments were forced to scale back their provision of benefits and services, or stop providing them altogether. In the area of social services, some local governments were unable to maintain recurrent expenditures, and were forced to cut back on expenses including those for maintenance, medicines and staff salaries.
34 More than one third of municipalities in Serbia has the population smaller than 20,000, while every tenth municipality is larger than 100,000 population.
58

Box 4.1 contd.
Serbia can learn from Romania’s experience in a number of areas. A few of the lessons that emerged are:
(i) The need to match expenditure responsibility with adequate revenues. While local governments were granted expanded authority, they were not provided with the commensurate revenue sources.
(ii) Similarly, there is a need for attention to implementation and capacity-building. While local governments were provided with the right to raise local taxes and fees under legislation, few local governments had the staff or expertise to actually raise or collect these new sources of financing. Technical assistance for tax policy, financial management, and budgeting were necessary prerequisites.
(iii) Transparent and simple to implement equalization measures, to address regional fiscal disparities are essential to ensure that decentralization does not deepen resource imbalances between local governments.
(iv) Strong incentives and monitoring are needed to ensure the sustainability of social welfare programs in a decentralized context. Unlike education and health, social assistance generally lacks a strong constituency to advocate on its behalf at the local level.
Following the experience of the reforms and the dramatic erosion in the safety net, Romania recentralized financing of social assistance in 2002, with the introduction of earmarked central transfers for social benefits. In 2002 spending on the main social assistance benefit was 0.28 percent of GDP, covering 366,000 households.
Sources: World Bank, 2002.
Financing of core cash benefits remains centralized in Serbia and funded through the MLESP. However, provision is localized through the LSG (for child allowances) or the CSWs (for the other transfers). In addition, LSGs and CSWs can administer and finance additional benefits if their revenues allows. Centralized financing should be maintained for as long as the revenue position of the municipalities remains narrow, and consistent and equitable financing from municipal sources cannot be guaranteed.
Lessons from other countries in the region underscore the significant risks of decentralizing the financing of social welfare programs without a well-functioning intergovernmental fiscal system that ensures adequate, sustainable and equitable financing of benefits and programs across municipalities. Without earmarked financing sources there is a high risk that funds designated for social assistance programs will be diverted elsewhere. There is also a risk that the poorest municipalities with the greatest need will have the most limited resources available for social assistance, leading to a vicious circle in which funds are not available to those who need them the most.
Experience from Romania and Bosnia and Herzegovina shows that premature decentralization of financing responsibility for social assistance benefits can undermine their provision, as institutional and financing arrangements are unable to cope with the requirements of administering cash benefits. After delivery of cash transfers collapsed in the late 1990s, Romania recentralized social assistance financing in 2002. Meanwhile, in Bosnia and Herzegovina decentralized financing mechanisms have resulted in substantial inter-regional disparities in coverage, with poorer localities providing the least amount of services. In the face of resource constraints, eligibility criteria for most benefits in
59
Bosnia are ad hoc, as local welfare offices use discretion when rationing available resources.
Lastly, Serbia only introduced a unified Republican eligibility threshold for MOP so as to ensure greater consistency of benefit financing and provision across the country. Decentralization of financing would risk undoing the positive effects of that reform.
CCC... DDDIIIVVVEEERRRSSSIIIFFFYYYIIINNNGGG SSSOOOCCCIIIAAALLL SSSEEERRRVVVIIICCCEEE PPPRRROOOVVVIIISSSIIIOOONNN:::IIINNNCCCRRREEEAAASSSIIINNNGGG CCCOOOMMMMMMUUUNNNIIITTTYYY---BBBAAASSSEEEDDD CCCAAARRREEE
A central argument for decentralization is to improve the responsiveness and efficiency of service delivery, by benefiting from local knowledge of the needs and preferences of the population. Social service reform in Serbia has the potential to benefit from this aspect of decentralization. A major focus of the reforms of social services since 2001 has been the need to shift care for vulnerable groups, particularly the elderly, disabled, and children from an institutions to community-based care. Increased local government involvement –as well as greater provision by NGOs, has the potential to improve the responsiveness of services to local needs.
However, as with cash benefits, in order to reap the benefits of bringing social services closer to communities, an adequate framework for financing, administration, quality control and monitoring needs to be in place. In the Serbian context, this will require attention to the overall fiscal framework for decentralization, capacity building for planning and delivering social welfare services at the local level, and defining a clear role for the central government in managing quality and ensuring equity across the country. The following discusses these issues in the context of the shift from institutions to community-based care in Serbia.
Moving Away from Institutions
As in other countries in the region, Serbia inherited a social welfare system characterized by an over reliance on social welfare institutions. Institutions were provided for children without parental care and children-at-risk, the disabled, pregnant women, single mothers, and the elderly. Social care institutions provide care including accommodation, board, clothing, nursing care, education, training for certain work activities and health services.
Currently, children, mentally and physically disabled persons and the elderly are the largest groups in residential institutions. Serbia places more than 1,700 children without parental care in institutions annually.35 The total number of children residing in large institutions extends to up to 2,500 when adding children with behavioral problems and disabled children. At around 200 children per 100,000 population aged 0-17 placed in residential institutions36, Serbia compares relatively well to other countries in the
35 In 2001, 2,200 children without parental care were institutionalized. There are around 10,000 children without parental care in Serbia. 36 TransMonee 2005, UNICEF.
60

Europe and Central Asia region.37 However, between 40 and 50 percent of children in institutions and foster families are placed outside their place of residence, suggesting the need for a more regional approach to care so that children can remain in their home communities.
Table 4.2: Institutions by Type and Number of Beneficiaries on December 31, 2004 Number of institutions
Type of institution/ Category of beneficiary
Number of residents
16 Children without parental care38 1,663 3 Children with behavioral problems 90
18 Persons with mental or physical disability 5,574 (622 children and 4,952 adults)39
38 Gerontology Centers and Elderly Homes 7,869 Total: 75 15,196 (or 90.7% of the overall
capacity of institutions) Source: MLESP
The capacity of the 75 public residential institutions in Serbia was 16,748 in December 2004. The total number of employees in residential institutions was 6,217 of which 2,011 were social protection and health care professionals. The institutions accommodate more than 15,000 beneficiaries a year, indicating high occupancy (more than 90%). The costs of staying in an institution are almost entirely covered by the republican budget, except for placement in elderly homes where beneficiaries -- who are financially able -- are responsible for approximately two-thirds of the costs. Still, due to long waiting lists and the lack of institutional capacities, and, on the other side, non-existence of adequate health care facilities/services, some of the needs of the elderly population may not be appropriately addressed. Expenditures on residential institutions made up 26 percent of social and child protection under the social welfare law in 2005.
Residential care can have adverse effects in a number of ways: (i) residents live in isolation; (ii) some beneficiaries are not placed appropriately due to lack of space (e.g. young people living in elderly homes); (iii) some beneficiaries are kept longer than necessary (e.g. the case of children with behavioral problems); (iv) overcrowding; (v) understaffing; and (vi) poor quality of care and facilities.
The MLESP has supported reform projects to strengthen social services, including a detailed analysis of residential institutions and plans for their transformation, needs assessment of beneficiaries and training for staff. The MLESP has initiated reorganization and transformation of large residential facilities to decrease the number of children in residential care, freeing staff and space for new forms of alternative care, such as day care centers for children with disabilities. Still, there are many beneficiaries whose needs would be better met by alternative types of services.
37 Latest available data for other countries (2003): Croatia – 286 children per 100,000 population (0-17); FYR Macedonia – 167.9 children per 100,000 population (0-17); Romania – 814.6 children per 100,000 population (0-17); Latvia – 723.7 children per 100,000 population (0-17). The rate refers to children in infant homes, orphanages, boarding homes and schools for children without parental care, disabled children, family type homes, etc. Definitions differ among countries. 38 This figure includes abandoned children, children whose parents are unknown or dead, children in infant homes and shelters, children from vulnerable families, but also 200 students in a boarding school in Uzice. 39 With many mixed children-adult institutions.
61

Alternative Forms of Care
The increased focus on alternative forms of care has been driven by an interest in responding to individuals’ needs in their communities. In addition to being less effective that residential care can also be more expensive. The costs of residential care for a child in Serbia in 2005 was estimated at $285 per month, much higher than foster care (estimated at $182). Cross-country comparisons confirm that the costs of alternative care services are lower than the cost of residential care (Table 4.3). The differences among countries and figures need to be treated with caution because of contrasting methodologies.
Table 4.3: Average Costs per Year for Residential and Non-residential Care (US dollars) Serbia (2005)40 Lithuania, Latvia (2000)
Residential care Elderly – $2,844 Disabled - $2,400 Children - $3,420
Elderly -$3,700 Disabled - $4,340 Children - $4880
Non-residential care $2,184 $1300 Source: MLESP, UNICEF/World Bank Toolkit, 2003
The MLESP has put a lot of effort into strengthening and promoting foster care, and today there are more children deprived of parental care in foster families than in residential institutions. Followed by a very strong public education campaign involving social welfare professionals and potential foster parents, between 2001-2005, the number of foster families increased from 1,573 to 2,250, as did the number of children in foster care from 2,102 to 3,078 by July 2005. The Law on Social Protection and Provision of Social Security of Citizens has been amended to include compensation for foster parents to be financed from the budget. By changing the rules, the state significantly improved this form of child protection and more funds were allocated for beneficiaries, benefits for foster parents, payments of contributions for pension insurance, and additional resources for children (e.g. school books, trips, graduation events, and transportation).
Alternative forms of care are designed to support families and individuals at home or in day care centers. The elderly and disabled are major target groups. Although community-based care is less expensive than residential care, a large number of municipalities (more than 100 out of 167) in Serbia are not able to meet the needs of its vulnerable citizens due to budget constraints and underdeveloped networks of services and social welfare programs.
40 Physical maintenance of facilities, some staff salaries, health care and some running costs not included in the calculations.
62

Table 4.4: Distribution of Responsibilities by Target GroupTarget group Alternative care Funding System in transition Children Foster care
Guardianship Other activities (counseling, clubs, shelters, group homes)
MLESP budget MLESP budget MLESP budget, cities and municipalities, NGOs
Disabled Day care centers Other activities (associations, personal assistance)
Cities and municipalities NGOs
Elderly Home-helpers Elderly clubs Other activities (day care, shelters, etc)
MLESP budget, cities and municipalities Cities and municipalities, NGOs
Public authorities continue to provide alternative forms of care, opening it up for greater provision from NGOs, local authorities, and private sector
The agenda for reforms of social welfare services is substantial. There is scope for greater NGO and private sector involvement in care to improve the availability and diversity of services. The non-governmental share of provision of social services is still small, although slowly increasing. An NGO Law, which would provide a clear framework for operation of NGOs, including promoting partnerships with public sector, has not been adopted. Private sector involvement in care provision is still unusual. The new Strategy calls for a gradual transition to more decentralized service provision and financing, which would require further capacity building and greater involvement of stakeholders at the local level.
DDD... IIIMMMPPPRRROOOVVVIIINNNGGG SSSOOOCCCIIIAAALLL SSSEEERRRVVVIIICCCEEE DDDEEELLLIIIVVVEEERRRYYY::: NNNEEEXXXTTT SSSTTTEEEPPPSSSThere is notable variation in the level of development of municipalities, and hence
their capacity to deliver social services. The central government will need to take an active role in strengthening its monitoring mechanisms to ensure a smooth transition to a more decentralized system. Simultaneously, it will be necessary to strengthen the capacity of local governments to enable them to address increased demand for services.
Building on Existing Experience. The Social Innovation Fund could play a more prominent role in covering the transitional cost of reforms (Box 4.2). Current efforts to develop alternative forms of care at the local level could be strengthened by providing continued support for the development of day care centers, particularly those for children with disabilities. The SIF can provide some early lessons on how to improve the effectiveness of services at the local level, for example through its experience of improving incentives for social workers to work in Roma communities. On the other hand, some forms of social care – particularly the remaining residential institutions – would be better regulated by the central government and should be protected from decentralization.
63

Box 4.2: Early Lessons from the Social Innovation Fund
The transition to a new system of service delivery and financing is challenging. A first step for the Serbian government was the establishment, in 2003, of a Social Innovation Fund designed to: a) gradually introduce new services and new types of service providers; b) identify and cover gaps in the social safety net; c) address immediate needs in accordance with local community priorities; d) provide better access to services to the most vulnerable; and e) encourage community mobilization and raise public awareness.
The SIF aims to diversify social service provision. NGOs, the private sector, local governments, Centers for Social Work (CSWs) and other social welfare institutions are eligible to apply for support. The first round (2003-2004) supported 87 projects targeted children at-risk, the disabled, elderly, and Roma. In 2005, the SIF has launched a second call for proposals and selected 51 projects from more than 30 municipalities. As in the first round, priority areas included: development of new social services, development of alternative forms of care, support for the disabled, and initiatives to combat child neglect and violence.
The SIF is a powerful tool for building a sustainable strategy for partnerships between the government, CSWs, public institutions, NGOs, and the private sector at local level. It enjoys widespread support in the country and among donors. The SIF aims at further developing its mechanisms for reform through: decentralization, partnership development, and capacity building at local level, an as such has the potential to be an important reform agent for the implementation of the Social Welfare Strategy.
Experiences with SIF projects vary across regions and types of activities supported, from very well designed and sustainable projects to less successful ones. The failure of individual municipalities and their partners to extend support and expand project activities should be attributed to the lack of financial resources.
In 2005, the municipalities spent relatively limited funds on social welfare programs –1.9 billion dinars compared with the MLESP planned budget of 15.6 billion dinars. There is a huge variation in the proportion of the local self-government budget spent on social welfare (from 0.1% to 5.4% and from 6 dinars to 679 dinars per capita).41 Generally, the richer cities and municipalities spend more, but there is no precise correlation between the amount spent on social welfare and revenues per capita. However, it is certainly an obstacle to poor local governments finding counterpart funding for SIF projects and other benefits and services.
The experience of the SIF shows that gaining political support at the local level and raising public awareness play a significant role, particularly in municipalities that cannot cover the cost of social welfare programs alone. The need for active involvement, both financial and political, of the central government is important for greater local involvement. Similarly, there is a need to reform local government finance and inter-governmental transfers to make it more redistributive and more equitable. In the future, municipalities would need assistance in needs assessments and budget planning and monitoring. Inter-sectoral and inter-agency coordination are necessary at all stages of project preparation and implementation.
Tailoring Services to Local Needs. Implementation of specific strategies to address poverty and expand opportunities for vulnerable groups including the Roma, internally displaced persons, the rural poor, disabled and the elderly, remains a challenge. Social inclusion involves a wide range of policy issues aimed at raising the opportunity and living conditions of vulnerable groups. New and alternative services that are gradually being introduced at the local level and that are being encouraged from the central government will have to be better planned and coordinated in order to ensure an
41 Source: MLESP.
64

integrated approach. While there are growing evidence of partnerships at the local level – for example between CSWs and local governments, there is a lack of real partnership with the central MLESP.
Coordinating Between Central and Local Governments. Stronger partnerships and better coordination between the local and central government and improved coordination across sectors (e.g. social protection, education, health, police, justice, etc.) will be important. It is expected that the implementation of the Social Welfare Strategy will provide a good opportunity for inter-ministerial cooperation. The accompanying Action Plan should facilitate exchanging information and improving inter-sectoral cooperation towards a more integrated social policy at local level.
Better coordination is also needed at the central level (i.e. within the MLESP) as the same types of activities are being supported through different programs. Parallel to the SIF program, the Fund for Financing Associations of Persons with Disabilities provides support to activities for the disabled and their environments. The Government/MLESP may consider consolidating the two programs.
Ensuring Coverage of Vulnerable Groups. Despite policies to promote a move away from institutions, the demand for institutional care is unlikely to fall in the future. One driver of demand for institutional care for elderly is the rapidly aging population. The population 65 and over is estimated to reach over 21 percent of the population by 2022.42 With existing services limited and focused on institutionalized care (operating already at full capacity), special needs such for elderly beneficiaries with health conditions (many psychiatric problems) and even terminal illnesses remain unaddressed.
Implementing and Monitoring Quality Standards. A system of quality assurance, through incentives and training of workers and managers could be introduced through development and improvement of organization and management across the sectors and better coordination of service delivery. The roles of central and local governments in implementing quality standards should be developed to ensure a framework for improvements through: ensuring incentives, shared interpretation of the standards, training and education of staff, periodic assessments, codes of ethics, and quality management tools. System of permanent professional promotion and training for all employees in CSWs and other social welfare institutions should be established and case management introduced.
Performance indicators should be used to assess services. The key would be to select a small number of measurable indicators, including the quality of performance. This would support the implementation of an adequate monitoring system. Monitoring and evaluation of social welfare programs has been weak and irregular in the past and the capacity of central and local governments has to be strengthened through capacity building. Standardized reporting systems are needed.
Providing for NGO and Private Involvement in Service Delivery. The NGO and private sector have a role to play in social service delivery. A starting point is the need for a framework NGO Law. The MLESP also needs to develop licensing and accreditation policies and mechanisms for implementation. The central level should regulate a
42 RSO estimate.
65

profession or service. Licensing assumes granting permissions to individuals to engage in certain activity and to organization that meet the minimum standards required by legislation.
Improving Information. Information system of the social welfare institutions and services is poor and underdeveloped. There is a need for unified software development, which would eventually improve the collection and use of information and establish effective lines of communication among different levels and with the citizens.
The development of an integrated social welfare system will involve improving existent services and developing new and alternative forms of care (e.g. day, home, and foster care), and provision of high quality services that are closer to citizens and can respond to their needs. A move towards a more diversified and decentralized system would entail legislative changes, capacity building at different levels, and stronger intergovernmental cooperation.
66

REFERENCES
Bodewig, C. and Sethi., A. 2005. “Poverty, Exclusion, and Ethnicity in Serbia and Montenegro: The Case of the Roma,” Discussion Paper. The World Bank.
Braithwaite, J. (2003), “A scoring formula for Bosnia and Herzegovina,” Mimeo. The World Bank: Washington, DC.
Cvetkovic, Mirko, and Ira Lieberman (2005). “Serbia: Report on Direct and Indirect Subsidies and Redundancy Payments to Socially Owned Enterprises in the Process of Restructuring/Privatization.”
Government of the Republic of Serbia. 2003. “Poverty Reduction Strategy Paper for Serbia.” Belgrade.
International Committee of the Red Cross (ICRC). 2005. The Situation of Internally Displaced Persons in Serbia and Montenegro – Household Economy Assessment,Geneva.
Lindert, K.,E. Skoufias, J. Shapiro. 2006. ”Redistributing Income to the Poor and the Rich: Public Transfers in Latin America and the Caribbean.” The World Bank, Washington, DC.
Lisanin, M. 2005. Presentation on “Financial Aspects of the Social Welfare System Reform”. Ministry of Labor, Employment and Social Policy, Republic of Serbia.
Logos. 2006. “Serbia Social Assistance and Child Protection Note: Qualitative Analyses of Social Benefit Delivery.” Report prepared for the World Bank.
Strategy for Development of Social Welfare: Key Issues in Funding and Financing, DFID supported project on Social Policy Reform: Building and Strengthening State-Civil Society Partnerships to Reduce Poverty and Social Exclusion in Serbia, Belgrade, December 2005.
Tesliuc, C. 2004. “Serbia: The Social Safety Net and the Poor,” Draft mimeo. The World Bank.
UNICEF/TransMonee 2005 - Data Indicators and Features on the State of Children in CEE/CIS and Baltic States, UNICEF
UNICEF/World Bank. 2003. Changing Minds, Policies and Lives, Improving Protection of Children in Eastern Europe and Central Asia, Redirecting Resources to Community-Based Services.
UNICEF/World Bank. 2003. Changing Minds, Policies and Lives, Improving Protection of Children in Eastern Europe and Central Asia, Improving Standards of Child Protection Services.
UNICEF/World Bank. 2003. Changing Minds, Policies and Lives, Improving Protection of Children in Eastern Europe and Central Asia, Gate-keeping Services for Vulnerable Children and Families.
Zbirni izvestaj o radu u 2004. godini ustanova socijalne zastite za smestaj korisnika u Srbiji, Ministarstvo rada, zaposljavanja i socijalne politike, Beograd, 2005.
67

Izvestaj o radu centara za socijalni rad za 2004 godinu, Ministarstvo rada, zaposljavanja i socijalne politike, Beograd, 2005.
World Bank 2004. World Development Report 2004: Making Services Work for Poor People. The World Bank: Washington, DC.
World Bank. 2003. Serbia and Montenegro Poverty Assessment, Volumes 1 and 2 Washington, DC.
World Bank. 2002. Romania: Local Social Services Delivery Study. Volume 1: Summary Report. Report No. 23492-RO.
68