series 8500a peak power meters - spanawave reference card giga-tronics model 8501a and 8502a...
TRANSCRIPT
Manual Part Number: 20790
Revision Level: D-1Configuration Code: 27Print Date: March 2009
Operation & Maintenance Manual
Series 8500APeak Power Meters
. . . . . . . . . . . . . . . . . . . . . . . . . . . . . . . . . . . . . . . . . . . . . . . Certified Product
ISO 9001 . . . . . . . . . . . . . . . . . . . . . . . . . . . . . . . . . . Certified Process
Registra: BSI, Certification No. FM 34226, Registered 04 June 1996
Giga-tronics Incorporated 4650 Norris Canyon Road San Ramon, California 94583
Telephone (925) 328-4650 or (800) 726-4442 Telefax (925) 328-4700
Customer Service: Telephone (800) 444-2878 Telefax (925) 328-4702
Web Site: www.gigatronics.com
Superceded by Revision D, March 2009

All technical data and specifications is this manual are subject to change without prior notice anddo not represent a commitment on the part of Giga-tronics Incorporated.
©Copyright Giga-tronics Incorporated 2009. All rights reserved.
Printed in U.S.A.
WARRANTYGiga-tronics Series 8500A instruments are warranted against defective
mater ia ls and workmansh ip for one year f rom date o f sh ipment .
Giga-tronics will at its option repair or replace products that are proven
defective during the warranty period. This warranty DOES NOT cover
damage resul t ing from improper use, nor workmanship other than
Giga-tronics service. There is no impl ied warranty of f i tness for a
particular purpose, nor is Giga-tronics l iable for any consequential
damages. Specification and price change privi leges are reserved by
Giga-tronics.
Model NumbersThe Series 8500A includes two models: The single-channel Model 8501A and the dual-channelModel 8502A. Apart from the number of sensors they support, the two models are identical. Bothmodels are referred to in this manual by the general term 8500A, except where it is necessary tomake a distinction between the models.
Superceded by Revision D, March 2009

© 2009 Giga-tronics Incorporated.
Errata Sheet
for
Series 8500A Peak Power Meter
Operation & Maintenance Manual
Manual P/N 20790
Issued March 10, 2009
Correction: Change in Performance Specifications
Description of Correction: This change applies to the Giga-tronics 8500A series Peak Power Meter with
the model 17071A 40 GHz Power Sensor. The change is to the measurement Power Range only:
Old 17071A specification:
750 MHz to 40 GHz
Peak Power Range: -20 to +20 dBm and CW Power Range: -40 to +20 dBm
New 17071A specification:
750 MHz to 18 GHz
Peak Power Range: -20 to +20 dBm and CW Power Range: -40 to +20 dBm
>18 GHz to 40 GHz
Peak Power Range: -20 to +0 dBm and CW Power Range: -40 to +0 dBm
All other specifications remain the same.
Superceded by Revision D, March 2009

QUICK REFERENCE CARDGiga-tronics Model 8501A and 8502A Functional Commands
This card is a summary of commands required to manually activate the functions of the Series 8500A Peak Power Meters (PPM). The commands are listed for each of the different modes of operation of the PPM(All Modes, CW, Peak, Graph, Dual Channel, and 1018B Emulation). Keys that are to be pressed for the command sequence are enclosed in brackets. For simplicity, values are given as a single command ratherthan as individual numbers (for example, 0.1 is shown as [0.1] rather than [0][.][1]). The [UNITS] command at the end or included with some of the command keystroke sequences means to press any of the three
units keys (ms, µs, or ns) to enter the values of the keyed sequence. Numbers in parenthesis after a MENU or MEM key means to press the key that number of times to reach a specific menu level.
Commands Applicable to All ModesAuto Zero Detectors [MENU] (1) [F3] [F2]Calibrate Detectors [MENU] (1) [F3] [F1]Self-Test the PPM
(during a test routine)[MENU] (11) [F2]
Service Functions [MENU] (1) [F1]Detector Offset (Channel A) [MENU] (3) [F1] [nn.nn] [dB]Detector Offset (Channel B)Frequency Correction [FREQ] (follow prompts)Frequency Correction -
User Freq/PROM[MENU] (3) [F3] [F1] [nnn.nnn] [GHz]
Frequency Correction -V/GHz/PROM
[MENU] (3) [F3] [F2] [vv.vv] [UNITS] [xx.xx][ff.ff] [GHz]
Frequency Correction - Cal Factor (dB)
[MENU] (3) [F3] [F3] [A] or [B] [nn.nn] [dB]
Change Units Between dBm and mW [MENU] (4) [F3] (toggle)Hide/Display Frequency Information [MENU] (7) [F3] (toggle)Review Detector PROM Information [MENU] (10) [F2] (ch A) or [F3] (ch B)Check Date and Time then Exit [MENU] (5) [F3] [F3]Change Date and Time then Exit [MENU] (5) [F3] [F1] [mmddyy] [UNITS]
[hhmmss] [UNITS] [F3]Set Max and Min Power Limits [MENU] (7) [F1] [nn.nn] [UNITS] [nn.nn] [dBm]Recall Setup (n) in Memory [MEM] (1) [F1] [n] [UNITS]Store Setup (n) in Memory [MEM] (1) [F2] [n] [UNITS]Recall Power-On Setup [MEM] (1) [F3]Display Current Setup [MEM] (2) [F1] [F1] or [F3] (F1 = moreDisplay Power-On Setup [MEM] (2) [F2] [F1] or [F3] (F1 = moreDisplay Setup (nn) in Memory [MEM] (2) [F3] [nn] [UNITS] [F1] (more) or [F3]
(exit)Initialize Current Setup [MEM] (3) [F1]Initialize All But Current Setup [MEM] (3) [F2]Initialize a Numbered Setup (nn) [MEM] (3) [F3] [nn] [UNITS]
CW Mode CommandsSelect CW Mode [CW]CW Averaging [MENU] (2) [F1] [nnn] [UNITS]Fast Analog Output [MENU] (10) [F1]
Graph Mode CommandsSelect GRAPH Mode [GRAPH]Select 8501A Internal Trigger and Level [MENU] (1) [F1] [nn.nn] [dBm/mW]Select 8502A Internal Trigger and Level [MENU] (1) [F1] [A] or [B] [nn.nn] [dBm/mW]Select External Trigger [MENU] (1) [F2]Peak Averaging [MENU] (2) [F2] nnn [UNITS]Set Initial Delay for Autoscaling [MENU] (9) [F2] [nn.nn] [UNITS]Set Average Value for Autoscaling [MENU] (9) [F3] [nn.nn] [UNITS]Enter Reference Delay [MENU] (4) [F1] (for ch A) or [F2] (for ch B)
[nn.nn] [UNITS]Clear Reference Delay [MENU] (4) [F1] (ch A) or [F2] (ch B) [0] [UNITS]
Change Between Cursor, Marker,and Pulse Sub-Modes PULSE/CURSOR/MARKER (triple toggle)
Cursor Sub-Mode Commands
Change Start Delay Move cursor to STRT DLY line on display; enterchange using [nn.nn] [UNITS] or spin knob
Change Window Delay Move cursor to DLY WIND line on display; enterchange using [nn.nn] [UNITS] or spin knob
Change Cursor Delay Move cursor to CSR DLY line on display; enterchange using [nn.nn] [UNITS] or spin knob
Change Internal Trigger Level Move cursor to TRG LEV line on display; enterchange using [nn.nn] [UNITS] (or spin knob); oruse [MENU] (1) [F1] [nn.nn] [UNITS]
Change Reference Power(100% Point)
Move cursor to REF PWR line on display; enterchange using [nn.nn] [UNITS]
Pulse Sub-Mode Commands
Change Pulse Width Start/End % Move cursor to PULSE WID line on display, press[nn.n] [UNITS] [nn.n] [UNITS]
Change Rise Time Start/End % Move cursor to RISE TIME line on display, press[nn.n] [UNITS] [nn.n] [UNITS]
Change Fall Time Start/End % Move cursor to FALL TIME line on display, press[nn.n] [UNITS] [nn.n] [UNITS]
Graph Mode Commands (continued)Marker Sub-Mode Commands
Change Marker 1 Percentage Move cursor to MRKR 2-1 line on display, press[*nn.n] [UNITS]
Change Marker 2 Percentage Move cursor to MRKR 3-2 line on display, press[*nn.n] [UNITS]
Change Marker 3 Percentage Move cursor to MRKR 4-3 line on display, press[*nn.n] [UNITS]
Change Marker 4 Percentage Move cursor to 4th line on display, press [*nn.n][UNITS]
* Enter [nn.n] (positive) to place the marker on the rising edge of the pulse.Enter [-nn.n] (negative) to place the marker on the falling edge of the pulse.
GPIB PlottingGPIB Plot (Paper) [MENU] (2) [F3] [F1]GPIB Plot (Transparency) [MENU] (2) [F3] [F2]Code Number Entry for Plot [MENU] (5) [F1] [nnnn] [UNITS]
(nnnn = up to 12 digits)Part Number Entry for Plot [MENU] (5) [F2] [nnnn] [UNITS]
(nnnn = up to 12 digits)Abort (Stop) Plotting Activity [MENU] (6) [F1]Enter Plotter GPIB Address [MENU] (6) [F2] [nn] [UNITS]
Peak Mode CommandsSelect Peak Mode [PEAK]Select 8501A Internal Trigger and Level [MENU] (1) [F1] [nn.nn] [dBm] [mW]Select 8502A Internal Trigger and Level [MENU] (1) [F1] [A] or [B] [nn.nn] [dBm] [mW]Select External Trigger [MENU] (1) [F2]Fast Analog Output [MENU] (10) [F1]Peak Averaging [MENU] (2) [F2] nn [UNITS]Enable Cursor Delay [↑] or [↓]Disable Cursor Delay [UNITS]Enter Reference Delay [MENU] (4) [F1] (ch A) or [F2] (ch B) [nn.nn]
[UNITS]Clear Reference Delay [MENU] (4) [F1] (ch a) and/or [F2] (ch b) [0]
[UNITS]
Other Dual Channel CommandsDetector Offset (Channel B) [MENU] (3) [F2] [nn.nn] [dB]Display Ratio A/B Power Mode [MENU] (7) [F2]Select Peak Mode for Channel A [A] [F1] (when using the Ratio Mode)Select CW Mode for Channel A [A] [F2] (when using the Ratio Mode)Select Peak Mode for Channel B [B] [F1] (when using the Ratio Mode)Select CW Mode for Channel B [B] [F2] (when using the Ratio Mode)Exit Ratio Mode [CW] or [PEAK]
IEEE & 1018B Emulation CommandsSelect PPM Listen and Talk Address [MENU] (6) [F3] [nn] [UNITS]Initiate 1018B Emulation Mode [MENU] (8) [F2]* Disable/Enable Service Request [MENU] (8) [F1] (toggle)* Automatic/Bus Command TriggerReset
[MENU] (8) [F2]
* Get Data Fast (No Display) [MENU] (8) [F3]* Set Measurement Range [MENU] (9) [F1] (for nnn.n µW)
[MENU] (9) [F2] (for nn.nn mW)[MENU] (9) [F3] (for n.nnn mW)
* Set Initial Delay for Autoscaling [MENU] (11) [F2] [nn.nn] [UNITS]* Set Averaging Value for Autoscaling [MENU] (11) [F3] [nnn] [UNITS]* End 1018B Emulation Mode [MENU] (10) [F2]* These commands are valid only in 1018B Emulation Mode.
(See other side for a Quick Reference to Menu Displays)

QUICK REFERENCE CARDGiga-tronics Model 8501A and 8502A Menu Displays
This card is a quick reference to the menus that will display when the MENU and MEMory keys are pressed. The number in parenthesis after the key is the number of times the key must be pressed to reach thedesignated menu. MENU (1) means to press the MENU key one time; MEM (2) means to press the MEMory key two times, etc. Two levels of menu displays are available. The first level includes menus for normal8500A functions. The second level are the menus used during 1018B emulation. MENU (8) in the normal mode enables or toggles the 1018B Emulation mode.
MENU Key Displays
Normal 8500A Functions
Keystrokes Menu Displayed
MENU (1) Menu = NEXT MENU
F1 set Int Trig and LevelF2 set Extrn TriggerF3 to Cal or Zero Detectors
MENU (2) Menu = NEXT MENU; Minus = PREV MENU
F1 to Enter CW Averaging NumberF2 to Enter Peak Averaging NumberF3 for GPIB Plot
MENU (3) Menu = NEXT MENU; Minus = PREV MENU
F1 to Enter Detector A OffsetF2 to Enter Detector B Offset (8502A only)F3 to Enter Source of Frequency Correction
MENU (4) Menu = NEXT MENU; Minus = PREV MENU
F1 to Enter Detector A Ref DelayF2 to Enter Detector B Ref Delay (8502A only)F3 to Select mW Format
MENU (5) Menu = NEXT MENU; Minus = PREV MENU
F1 to Enter Code NumberF2 to Enter Part NumberF3 for Read and Set Time
MENU (6) Menu = NEXTR MENU; Minus = PREV MENU
F1 to Abort Current Plotting ActivityF2 to Enter Plotter AddressF3 to Enter 8500A Listen and Talk Address
MENU (7) Menu = NEXT MENU; Minus = PREV MENU
F1 to Set Max and Min Power LimitsF2 to Select Ratio Display Mode (8502A only)F3: Hide (or Display) Frequency Information
MENU (8) Menu = NEXT MENU; Minus = PREV MENU
F2: Emulate 1018B
MENU (9) Menu = NEXT MENU; Minus = PREV MENU
F1 to Program Detector PROMF2 to Set Initial Dly Value for AutoscalingF3 to Set Averaging Value for Autoscaling
NOTE: F1 is used only with the PROM Programmer
MENU (10) Menu = NEXT MENU; Minus = PREV MENU
F1 for Fast Analog OutputF2: Review A Detector PROMF3: Review B Detector PROM (8502A only)
MENU (11) Minus = PREV MENUBe Sure No RF is Applied to DetectorPress CLEAR to Skip All TestsF1 for Service Functions F2 for Self Test
MENU Key Displays (continued):
1018B Emulation Mode Functions
Keystrokes Menu Displayed
MENU (8) (Bus Trigger Reset; SRQ Enabled)Press CLEAR to return to data display
F1 to Disable SRQ (Service Request)F2 for Automatic Trigger ResetF3 to Get Data Fast; No EL Data Display
MENU (8) (Auto Trigger Reset; SRQ Disabled)Press CLEAR to return to data display
F1 to Enable Service RequestF2 for Bus Command Trigger ResetF3 to Get Data Fast; No EL Data Display
MENU (9) Menu = NEXT MENU; Minus = PREV MENUCurrent Range Value is X
F1 for Range 1 (XXX.X µW)F2 for Range 2 (XX.XX mW)F3 for Range 3 (X.XXX mW)
MENU (10) Press CLEAR to return to data displayPress MENU for next lower level menu
F2 to end 1018B Emulation
MENU (11) (Same as MENU (8) for the normal 8500 mode.)
MENU (12) (Same as MENU (9) for the normal 8500 mode.)
MENU (13) (Same as MENU (10) for the normal 8500 mode.)
MEMory Key Displays
Keystrokes Menu Displayed
MEM (1) Press MEM for additional selections
F1 to Recall SetupsF2 to Store SetupsF3 to get Power-On Setup
MEM (2): Press CLEAR to return to data display
F1 to Display Current SetupF2 to Display Power-On SetupF3 to Display a Numbered Setup
MEM (3): Press CLEAR to return to data display
F1 to Re-Initialize the Current SetupF2 to Re-Initialize All but Current SetupF3 to Re-Initialize a Numbered Setup
(See other side for a Quick Reference to Functional Commands)

Table of Contents
About This Manual . . . . . . . . . . . . . . . . . . . . . . . . . . . . . . . . . . . . . . . . . . . . . . . . . . . . . . . . ix
Conventions . . . . . . . . . . . . . . . . . . . . . . . . . . . . . . . . . . . . . . . . . . . . . . . . . . . . . . . . . . . . . . xi
Record of Manual Changes . . . . . . . . . . . . . . . . . . . . . . . . . . . . . . . . . . . . . . . . . . . . . . . . . xiii
Special Configurations. . . . . . . . . . . . . . . . . . . . . . . . . . . . . . . . . . . . . . . . . . . . . . . . . . . . . . xv
1 • Introduction _______________________________________________________
1.1 Description . . . . . . . . . . . . . . . . . . . . . . . . . . . . . . . . . . . . . . . . . . . . . . . . . . . . . . . . . . . . . . . 1-1
1.1.1 Environmental Requirements . . . . . . . . . . . . . . . . . . . . . . . . . . . . . . . . . . . . . . . . . 1-2
1.1.2 Items Furnished . . . . . . . . . . . . . . . . . . . . . . . . . . . . . . . . . . . . . . . . . . . . . . . . . . . . 1-2
1.1.3 Items Required. . . . . . . . . . . . . . . . . . . . . . . . . . . . . . . . . . . . . . . . . . . . . . . . . . . . . 1-2
1.1.4 Tools and Test Equipment . . . . . . . . . . . . . . . . . . . . . . . . . . . . . . . . . . . . . . . . . . . 1-2
1.1.5 Cooling . . . . . . . . . . . . . . . . . . . . . . . . . . . . . . . . . . . . . . . . . . . . . . . . . . . . . . . . . . . 1-2
1.1.6 Cleaning . . . . . . . . . . . . . . . . . . . . . . . . . . . . . . . . . . . . . . . . . . . . . . . . . . . . . . . . . . 1-2
1.1.7 Receiving Inspection . . . . . . . . . . . . . . . . . . . . . . . . . . . . . . . . . . . . . . . . . . . . . . . . 1-2
1.1.8 Returning an Instrument . . . . . . . . . . . . . . . . . . . . . . . . . . . . . . . . . . . . . . . . . . . . . 1-3
1.2 System Specifications . . . . . . . . . . . . . . . . . . . . . . . . . . . . . . . . . . . . . . . . . . . . . . . . . . . . . . 1-4
1.3 Default Settings . . . . . . . . . . . . . . . . . . . . . . . . . . . . . . . . . . . . . . . . . . . . . . . . . . . . . . . . . . . 1-7
2 • Operation _________________________________________________________
2.1 General . . . . . . . . . . . . . . . . . . . . . . . . . . . . . . . . . . . . . . . . . . . . . . . . . . . . . . . . . . . . . . . . . 2-1
2.2 Installation . . . . . . . . . . . . . . . . . . . . . . . . . . . . . . . . . . . . . . . . . . . . . . . . . . . . . . . . . . . . . . . 2-1
2.2.1 PCB-Oriented Voltage Selector and Fuse Holder . . . . . . . . . . . . . . . . . . . . . . . . . 2-3
2.2.2 VDE Type Voltage and Fuse Holder. . . . . . . . . . . . . . . . . . . . . . . . . . . . . . . . . . . . 2-4
2.3 Rear Panel Description . . . . . . . . . . . . . . . . . . . . . . . . . . . . . . . . . . . . . . . . . . . . . . . . . . . . . 2-5
2.4 Front Panel Description. . . . . . . . . . . . . . . . . . . . . . . . . . . . . . . . . . . . . . . . . . . . . . . . . . . . . 2-7
2.5 Operation . . . . . . . . . . . . . . . . . . . . . . . . . . . . . . . . . . . . . . . . . . . . . . . . . . . . . . . . . . . . . . . . 2-10
2.5.1 Power On Self-Test (POST) . . . . . . . . . . . . . . . . . . . . . . . . . . . . . . . . . . . . . . . . . . 2-10
2.5.2 Warm Up Time and Temperature . . . . . . . . . . . . . . . . . . . . . . . . . . . . . . . . . . . . . . 2-10
2.6 Mode Selection . . . . . . . . . . . . . . . . . . . . . . . . . . . . . . . . . . . . . . . . . . . . . . . . . . . . . . . . . . . 2-11
2.6.1 CW Mode . . . . . . . . . . . . . . . . . . . . . . . . . . . . . . . . . . . . . . . . . . . . . . . . . . . . . . . . . 2-11
2.6.2 Peak Mode . . . . . . . . . . . . . . . . . . . . . . . . . . . . . . . . . . . . . . . . . . . . . . . . . . . . . . . . 2-11
2.6.3 Graph Mode . . . . . . . . . . . . . . . . . . . . . . . . . . . . . . . . . . . . . . . . . . . . . . . . . . . . . . . 2-13
2.7 Self-Calibration and Auto-Zeroing. . . . . . . . . . . . . . . . . . . . . . . . . . . . . . . . . . . . . . . . . . . . . 2-14
2.7.1 Self-Calibration Procedure. . . . . . . . . . . . . . . . . . . . . . . . . . . . . . . . . . . . . . . . . . . . 2-14
2.7.2 Self-Calibration Failures. . . . . . . . . . . . . . . . . . . . . . . . . . . . . . . . . . . . . . . . . . . . . . 2-15
2.7.3 Auto-Zero Function . . . . . . . . . . . . . . . . . . . . . . . . . . . . . . . . . . . . . . . . . . . . . . . . . 2-15
2.8 Measurement Procedures . . . . . . . . . . . . . . . . . . . . . . . . . . . . . . . . . . . . . . . . . . . . . . . . . . . 2-16
2.8.1 Frequency Correction, Cal Factor, and dB Offset . . . . . . . . . . . . . . . . . . . . . . . . . 2-16
2.8.2 PROM Frequency Correction . . . . . . . . . . . . . . . . . . . . . . . . . . . . . . . . . . . . . . . . . 2-16
2.8.3 User-Supplied Cal Factor . . . . . . . . . . . . . . . . . . . . . . . . . . . . . . . . . . . . . . . . . . . . 2-17
2.8.4 CW Power Measurement. . . . . . . . . . . . . . . . . . . . . . . . . . . . . . . . . . . . . . . . . . . . . 2-18
2.8.5 Peak Power Measurement . . . . . . . . . . . . . . . . . . . . . . . . . . . . . . . . . . . . . . . . . . . 2-19
2.8.6 Peak Power Measurements Using the Graph Mode . . . . . . . . . . . . . . . . . . . . . . . 2-23
2.8.7 Pulse, Cursor, and Marker Readouts . . . . . . . . . . . . . . . . . . . . . . . . . . . . . . . . . . . 2-23
2.8.8 Cursor Sub-Mode Functions . . . . . . . . . . . . . . . . . . . . . . . . . . . . . . . . . . . . . . . . . . 2-24
2.8.9 Pulse Parameters Sub-Mode Functions . . . . . . . . . . . . . . . . . . . . . . . . . . . . . . . . . 2-26
Manual No. 20790, Rev C, November 1998 i
Superceded by Revision D, March 2009

2.8.10 Marker Sub-Mode Functions . . . . . . . . . . . . . . . . . . . . . . . . . . . . . . . . . . . . . . . . . . 2-28
2.9 Digital Plotting of Graphic Data . . . . . . . . . . . . . . . . . . . . . . . . . . . . . . . . . . . . . . . . . . . . . . . 2-30
2.9.1 Plotters Supported . . . . . . . . . . . . . . . . . . . . . . . . . . . . . . . . . . . . . . . . . . . . . . . . . . 2-30
2.9.2 Procedure for Making Plots . . . . . . . . . . . . . . . . . . . . . . . . . . . . . . . . . . . . . . . . . . . 2-30
2.10 Dual Channel Measurements . . . . . . . . . . . . . . . . . . . . . . . . . . . . . . . . . . . . . . . . . . . . . . . . 2-32
2.10.1 CW, CW Measurements. . . . . . . . . . . . . . . . . . . . . . . . . . . . . . . . . . . . . . . . . . . . . . 2-32
2.10.2 Peak, Peak Measurements: Method 1. . . . . . . . . . . . . . . . . . . . . . . . . . . . . . . . . . . 2-32
2.10.3 Peak, Peak Measurements: Method 2. . . . . . . . . . . . . . . . . . . . . . . . . . . . . . . . . . . 2-33
2.10.4 Peak, CW Measurements. . . . . . . . . . . . . . . . . . . . . . . . . . . . . . . . . . . . . . . . . . . . . 2-34
2.10.5 Power Ratio Measurements . . . . . . . . . . . . . . . . . . . . . . . . . . . . . . . . . . . . . . . . . . . 2-35
2.11 High Power Measurements . . . . . . . . . . . . . . . . . . . . . . . . . . . . . . . . . . . . . . . . . . . . . . . . . . 2-37
2.11.1 Power Warning - Max/Min Power Limits . . . . . . . . . . . . . . . . . . . . . . . . . . . . . . . . . 2-37
2.12 High Power Measurement Procedures . . . . . . . . . . . . . . . . . . . . . . . . . . . . . . . . . . . . . . . . . 2-37
2.12.1 High Power Relative Measurements (8502A only) . . . . . . . . . . . . . . . . . . . . . . . . . 2-39
2.13 Special Capabilities of the PPM . . . . . . . . . . . . . . . . . . . . . . . . . . . . . . . . . . . . . . . . . . . . . . 2-40
2.13.1 Reference Delay . . . . . . . . . . . . . . . . . . . . . . . . . . . . . . . . . . . . . . . . . . . . . . . . . . . . 2-40
2.13.2 Single Pulse Measurements. . . . . . . . . . . . . . . . . . . . . . . . . . . . . . . . . . . . . . . . . . . 2-40
2.13.3 Single Pulse Measurement Using Internal Trigger . . . . . . . . . . . . . . . . . . . . . . . . . 2-40
2.13.4 Single Pulse Measurement With an External Trigger . . . . . . . . . . . . . . . . . . . . . . . 2-41
2.14 Swept Peak Power Measurements . . . . . . . . . . . . . . . . . . . . . . . . . . . . . . . . . . . . . . . . . . . . 2-42
2.15 Self-Testing the 8500A . . . . . . . . . . . . . . . . . . . . . . . . . . . . . . . . . . . . . . . . . . . . . . . . . . . . . 2-44
2.16 Frequency Display Disable/Enable . . . . . . . . . . . . . . . . . . . . . . . . . . . . . . . . . . . . . . . . . . . . 2-45
2.17 Non-Volatile Memory . . . . . . . . . . . . . . . . . . . . . . . . . . . . . . . . . . . . . . . . . . . . . . . . . . . . . . . 2-45
2.17.1 Memory Features . . . . . . . . . . . . . . . . . . . . . . . . . . . . . . . . . . . . . . . . . . . . . . . . . . . 2-45
2.18 1018B Peak Power Meter Emulation . . . . . . . . . . . . . . . . . . . . . . . . . . . . . . . . . . . . . . . . . . 2-47
2.18.1 General . . . . . . . . . . . . . . . . . . . . . . . . . . . . . . . . . . . . . . . . . . . . . . . . . . . . . . . . . . . 2-47
2.18.2 Initiating the 1018B Emulation Mode. . . . . . . . . . . . . . . . . . . . . . . . . . . . . . . . . . . . 2-47
3 • Remote Operation __________________________________________________
3.1 Introduction . . . . . . . . . . . . . . . . . . . . . . . . . . . . . . . . . . . . . . . . . . . . . . . . . . . . . . . . . . . . . . . 3-1
3.2 Remote Operating Modes . . . . . . . . . . . . . . . . . . . . . . . . . . . . . . . . . . . . . . . . . . . . . . . . . . . 3-2
3.2.1 PPM IEEE Bus Functions. . . . . . . . . . . . . . . . . . . . . . . . . . . . . . . . . . . . . . . . . . . . . 3-2
3.2.2 Front Panel Menus . . . . . . . . . . . . . . . . . . . . . . . . . . . . . . . . . . . . . . . . . . . . . . . . . . 3-3
3.2.3 Power-On Condition . . . . . . . . . . . . . . . . . . . . . . . . . . . . . . . . . . . . . . . . . . . . . . . . . 3-3
3.2.4 Remote and Local Lockout Functions . . . . . . . . . . . . . . . . . . . . . . . . . . . . . . . . . . . 3-4
3.2.5 Output Modes . . . . . . . . . . . . . . . . . . . . . . . . . . . . . . . . . . . . . . . . . . . . . . . . . . . . . . 3-4
3.2.6 Command String Format . . . . . . . . . . . . . . . . . . . . . . . . . . . . . . . . . . . . . . . . . . . . . 3-12
3.2.7 Power Measurement Data Output Format. . . . . . . . . . . . . . . . . . . . . . . . . . . . . . . . 3-12
3.3 GPIB Command Descriptions . . . . . . . . . . . . . . . . . . . . . . . . . . . . . . . . . . . . . . . . . . . . . . . . 3-14
3.3.1 Common Mode Functions . . . . . . . . . . . . . . . . . . . . . . . . . . . . . . . . . . . . . . . . . . . . 3-15
3.3.2 Measurement Data Correction . . . . . . . . . . . . . . . . . . . . . . . . . . . . . . . . . . . . . . . . . 3-17
3.3.3 Mode Selection and Control. . . . . . . . . . . . . . . . . . . . . . . . . . . . . . . . . . . . . . . . . . . 3-21
3.3.4 Commands for Retrieving Data From the PPM . . . . . . . . . . . . . . . . . . . . . . . . . . . 3-23
3.3.5 Graph Mode GPIB Operation. . . . . . . . . . . . . . . . . . . . . . . . . . . . . . . . . . . . . . . . . . 3-24
3.3.6 Marker Timing Measurements . . . . . . . . . . . . . . . . . . . . . . . . . . . . . . . . . . . . . . . . . 3-26
3.3.7 Manual Marker Placement/Timing Measurement Commands . . . . . . . . . . . . . . . . 3-29
3.3.8 Window and Cursor Control Commands . . . . . . . . . . . . . . . . . . . . . . . . . . . . . . . . . 3-31
3.3.9 Commands to Output Graphic Data to a Controller . . . . . . . . . . . . . . . . . . . . . . . . 3-33
3.3.10 Plotting Commands . . . . . . . . . . . . . . . . . . . . . . . . . . . . . . . . . . . . . . . . . . . . . . . . . 3-34
3.3.11 Programming Notes . . . . . . . . . . . . . . . . . . . . . . . . . . . . . . . . . . . . . . . . . . . . . . . . . 3-35
3.4 Service Requests and Serial Poll . . . . . . . . . . . . . . . . . . . . . . . . . . . . . . . . . . . . . . . . . . . . . 3-36
3.4.1 Error Conditions . . . . . . . . . . . . . . . . . . . . . . . . . . . . . . . . . . . . . . . . . . . . . . . . . . . . 3-37
3.5 1018B Emulation . . . . . . . . . . . . . . . . . . . . . . . . . . . . . . . . . . . . . . . . . . . . . . . . . . . . . . . . . . 3-38
Series 8500A Peak Power Meters
ii Manual No. 20790, Rev C, November 1998
Superceded by Revision D, March 2009

3.6 Status Code Decimal Values . . . . . . . . . . . . . . . . . . . . . . . . . . . . . . . . . . . . . . . . . . . . . . . . 3-41
3.7 Summary of Bus Functions. . . . . . . . . . . . . . . . . . . . . . . . . . . . . . . . . . . . . . . . . . . . . . . . . . 3-43
3.7.1 Normal PPM Operation . . . . . . . . . . . . . . . . . . . . . . . . . . . . . . . . . . . . . . . . . . . . . . 3-43
3.7.2 PPM Stand Alone Plot Operation . . . . . . . . . . . . . . . . . . . . . . . . . . . . . . . . . . . . . . 3-43
3.8 GPIB Command Summary . . . . . . . . . . . . . . . . . . . . . . . . . . . . . . . . . . . . . . . . . . . . . . . . . . 3-44
3.9 1018B Emulation Commands . . . . . . . . . . . . . . . . . . . . . . . . . . . . . . . . . . . . . . . . . . . . . . . . 3-52
3.10 Data Formats . . . . . . . . . . . . . . . . . . . . . . . . . . . . . . . . . . . . . . . . . . . . . . . . . . . . . . . . . . . . . 3-52
4 • Theory of Operation________________________________________________
4.1 Introduction . . . . . . . . . . . . . . . . . . . . . . . . . . . . . . . . . . . . . . . . . . . . . . . . . . . . . . . . . . . . . . 4-1
4.2 System Description . . . . . . . . . . . . . . . . . . . . . . . . . . . . . . . . . . . . . . . . . . . . . . . . . . . . . . . . 4-1
4.2.1 Power Supply PC Assembly (A2) . . . . . . . . . . . . . . . . . . . . . . . . . . . . . . . . . . . . . . 4-3
4.2.2 GPIB/CAL Control PC board (A3) . . . . . . . . . . . . . . . . . . . . . . . . . . . . . . . . . . . . . . 4-4
4.2.3 CPU PC Assembly (A4). . . . . . . . . . . . . . . . . . . . . . . . . . . . . . . . . . . . . . . . . . . . . . 4-8
4.2.4 Digital Delay PC Assembly (A5) . . . . . . . . . . . . . . . . . . . . . . . . . . . . . . . . . . . . . . . 4-12
4.2.5 Analog PC Assembly (A6/A7) . . . . . . . . . . . . . . . . . . . . . . . . . . . . . . . . . . . . . . . . . 4-20
4.2.6 Front Panel Interface PC Assembly (A8) . . . . . . . . . . . . . . . . . . . . . . . . . . . . . . . . 4-24
4.2.7 Calibrator PC Assembly (A12) . . . . . . . . . . . . . . . . . . . . . . . . . . . . . . . . . . . . . . . . 4-27
5 • Testing and Calibration _____________________________________________
5.1 General . . . . . . . . . . . . . . . . . . . . . . . . . . . . . . . . . . . . . . . . . . . . . . . . . . . . . . . . . . . . . . . . . 5-1
5.2 Performance Testing . . . . . . . . . . . . . . . . . . . . . . . . . . . . . . . . . . . . . . . . . . . . . . . . . . . . . . . 5-2
5.2.1 Equipment Required . . . . . . . . . . . . . . . . . . . . . . . . . . . . . . . . . . . . . . . . . . . . . . . . 5-2
5.2.2 Calibrator Return Loss Test . . . . . . . . . . . . . . . . . . . . . . . . . . . . . . . . . . . . . . . . . . 5-3
5.2.3 Calibrator Output Level Test . . . . . . . . . . . . . . . . . . . . . . . . . . . . . . . . . . . . . . . . . . 5-3
5.2.4 Instrument Plus Power Detector Linearity Test . . . . . . . . . . . . . . . . . . . . . . . . . . . 5-3
5.2.5 Power Linearity Test Setup . . . . . . . . . . . . . . . . . . . . . . . . . . . . . . . . . . . . . . . . . . . 5-4
5.2.6 Delay Accuracy Test . . . . . . . . . . . . . . . . . . . . . . . . . . . . . . . . . . . . . . . . . . . . . . . . 5-6
5.2.7 Analog Output Accuracy Test . . . . . . . . . . . . . . . . . . . . . . . . . . . . . . . . . . . . . . . . . 5-7
5.2.8 Voltage Proportional to Frequency Test . . . . . . . . . . . . . . . . . . . . . . . . . . . . . . . . . 5-7
5.2.9 Detector Return Loss Test . . . . . . . . . . . . . . . . . . . . . . . . . . . . . . . . . . . . . . . . . . . 5-7
5.2.10 Plotter Output/IEEE-488 Interface. . . . . . . . . . . . . . . . . . . . . . . . . . . . . . . . . . . . . . 5-7
5.3 Calibration Procedures . . . . . . . . . . . . . . . . . . . . . . . . . . . . . . . . . . . . . . . . . . . . . . . . . . . . . 5-8
5.3.1 Calibration Equipment Required . . . . . . . . . . . . . . . . . . . . . . . . . . . . . . . . . . . . . . . 5-10
5.3.2 Preset Conditions. . . . . . . . . . . . . . . . . . . . . . . . . . . . . . . . . . . . . . . . . . . . . . . . . . . 5-10
5.3.3 A2 Regulator Board . . . . . . . . . . . . . . . . . . . . . . . . . . . . . . . . . . . . . . . . . . . . . . . . . 5-11
5.3.4 Initialization. . . . . . . . . . . . . . . . . . . . . . . . . . . . . . . . . . . . . . . . . . . . . . . . . . . . . . . . 5-12
5.3.5 A8 Front Panel Interface Board . . . . . . . . . . . . . . . . . . . . . . . . . . . . . . . . . . . . . . . 5-12
5.3.6 A6/A7 Analog Board . . . . . . . . . . . . . . . . . . . . . . . . . . . . . . . . . . . . . . . . . . . . . . . . 5-13
5.3.7 A3 GPIB/CAL Control Board . . . . . . . . . . . . . . . . . . . . . . . . . . . . . . . . . . . . . . . . . . 5-15
5.3.8 A4 CPU Board . . . . . . . . . . . . . . . . . . . . . . . . . . . . . . . . . . . . . . . . . . . . . . . . . . . . . 5-15
5.3.9 A5 Digital Delay Board . . . . . . . . . . . . . . . . . . . . . . . . . . . . . . . . . . . . . . . . . . . . . . 5-16
5.3.10 External Interface. . . . . . . . . . . . . . . . . . . . . . . . . . . . . . . . . . . . . . . . . . . . . . . . . . . 5-19
5.3.11 Volume Adjust . . . . . . . . . . . . . . . . . . . . . . . . . . . . . . . . . . . . . . . . . . . . . . . . . . . . . 5-20
Preface
Manual No. 20790, Rev C, November 1998 iii
Superceded by Revision D, March 2009

6 • Maintenance _______________________________________________________
6.1 Introduction . . . . . . . . . . . . . . . . . . . . . . . . . . . . . . . . . . . . . . . . . . . . . . . . . . . . . . . . . . . . . . . 6-1
6.2 Periodic Maintenance. . . . . . . . . . . . . . . . . . . . . . . . . . . . . . . . . . . . . . . . . . . . . . . . . . . . . . . 6-1
6.2.1 Required Test Equipment. . . . . . . . . . . . . . . . . . . . . . . . . . . . . . . . . . . . . . . . . . . . . 6-2
6.3 Troubleshooting . . . . . . . . . . . . . . . . . . . . . . . . . . . . . . . . . . . . . . . . . . . . . . . . . . . . . . . . . . . 6-3
6.3.1 Equipment Required . . . . . . . . . . . . . . . . . . . . . . . . . . . . . . . . . . . . . . . . . . . . . . . . . 6-3
6.3.2 Power-On Failure . . . . . . . . . . . . . . . . . . . . . . . . . . . . . . . . . . . . . . . . . . . . . . . . . . . 6-3
7 • Parts Lists ________________________________________________________
7.1 Introduction . . . . . . . . . . . . . . . . . . . . . . . . . . . . . . . . . . . . . . . . . . . . . . . . . . . . . . . . . . . . . . . 7-1
7.2 Parts Lists for Series 8500A Peak Power Meters . . . . . . . . . . . . . . . . . . . . . . . . . . . . . . . . 7-1
8501A PEAK POWER METER . . . . . . . . . . . . . . . . . . . . . . . . . . . . . . . . . . . . . . . . . . . . . . . 7-1
8502A DUAL INPUT PEAK POWER METER. . . . . . . . . . . . . . . . . . . . . . . . . . . . . . . . . . . . 7-2
20512-A00 8501A CHASSIS ASSY . . . . . . . . . . . . . . . . . . . . . . . . . . . . . . . . . . . . . . . . . . . 7-3
20513-A00 8502A CHASSIS ASSY . . . . . . . . . . . . . . . . . . . . . . . . . . . . . . . . . . . . . . . . . . . 7-4
21145 FRONT SUB PANEL ASSY 8501A . . . . . . . . . . . . . . . . . . . . . . . . . . . . . . . . . . . . . . 7-5
21147 FRONT SUB PANEL ASSY 8502A . . . . . . . . . . . . . . . . . . . . . . . . . . . . . . . . . . . . . . 7-5
21146 REAR PANEL ASSY 8501A. . . . . . . . . . . . . . . . . . . . . . . . . . . . . . . . . . . . . . . . . . . . 7-6
21148 REAR PANEL ASSY 8502A. . . . . . . . . . . . . . . . . . . . . . . . . . . . . . . . . . . . . . . . . . . . 7-6
20879 EL DISPLAY MODULE ASSEMBLY . . . . . . . . . . . . . . . . . . . . . . . . . . . . . . . . . . . . . 7-7
20879-A00 EL DISPLAY MODULE SUB ASSY . . . . . . . . . . . . . . . . . . . . . . . . . . . . . . . . . . 7-7
16869 DELAY LINE ASSEMBLY. . . . . . . . . . . . . . . . . . . . . . . . . . . . . . . . . . . . . . . . . . . . . . 7-7
16932-001 INTERCONNECT PCB ASSY. . . . . . . . . . . . . . . . . . . . . . . . . . . . . . . . . . . . . . . 7-8
16932-A01 PCB ASSY PRE-WAVE,INTERCONNECT . . . . . . . . . . . . . . . . . . . . . . . . . . . . 7-8
16995 PCB ASSY, POWER SUPPLY. . . . . . . . . . . . . . . . . . . . . . . . . . . . . . . . . . . . . . . . . . 7-10
16995-A00 PCB ASSY PRE-WAVE, PWR SUPPLY . . . . . . . . . . . . . . . . . . . . . . . . . . . . . . 7-10
21014 PCB ASSY GPIB/CAL CONTROL 8500 . . . . . . . . . . . . . . . . . . . . . . . . . . . . . . . . . . 7-13
21014-A00 PCB ASSY PRE-WAVE,GPIB . . . . . . . . . . . . . . . . . . . . . . . . . . . . . . . . . . . . . . 7-13
16878 PCB ASSY., CPU . . . . . . . . . . . . . . . . . . . . . . . . . . . . . . . . . . . . . . . . . . . . . . . . . . . . 7-16
16878-A00 PCB ASSY PRE-WAVE, CPU . . . . . . . . . . . . . . . . . . . . . . . . . . . . . . . . . . . . . . 7-16
16685 P.C. ASSY, DIGITAL DELAY . . . . . . . . . . . . . . . . . . . . . . . . . . . . . . . . . . . . . . . . . . . 7-19
16685-A00 PCB ASSY PRE-WAVE, DIG. DELAY . . . . . . . . . . . . . . . . . . . . . . . . . . . . . . . . 7-20
20741 ANALOG PCB ASSY . . . . . . . . . . . . . . . . . . . . . . . . . . . . . . . . . . . . . . . . . . . . . . . . . 7-24
20741-A00 PCB ASSY PRE-WAVE, ANALOG. . . . . . . . . . . . . . . . . . . . . . . . . . . . . . . . . . . 7-24
20195 PCB ASSY, FR PNL INTERFACE . . . . . . . . . . . . . . . . . . . . . . . . . . . . . . . . . . . . . . . 7-30
20195-A00 PCB ASSY PRE-WAVE,FRT PNL INT. . . . . . . . . . . . . . . . . . . . . . . . . . . . . . . . 7-30
20526-001 PC BOARD ASSY, FRONT PANEL . . . . . . . . . . . . . . . . . . . . . . . . . . . . . . . . . . 7-33
20055-001 ASSY, 1GHZ CALIBRATOR TYPE N. . . . . . . . . . . . . . . . . . . . . . . . . . . . . . . . . 7-34
20055-A01 CALIBRATOR SUB ASSY, TYPE N. . . . . . . . . . . . . . . . . . . . . . . . . . . . . . . . . . 7-34
7.3 List of Manufacturers . . . . . . . . . . . . . . . . . . . . . . . . . . . . . . . . . . . . . . . . . . . . . . . . . . . . . . . 7-36
8 • Diagrams__________________________________________________________
8.1 Introduction . . . . . . . . . . . . . . . . . . . . . . . . . . . . . . . . . . . . . . . . . . . . . . . . . . . . . . . . . . . . . . . 8-1
8.2 Applicability. . . . . . . . . . . . . . . . . . . . . . . . . . . . . . . . . . . . . . . . . . . . . . . . . . . . . . . . . . . . . . . 8-1
Model 8501A/8502A Peak Power Meter, DWG# 20522. . . . . . . . . . . . . . . . . . . . . . . . . . . . 8-3
Interconnect PC Assy (A1), DWG# 16932-001. . . . . . . . . . . . . . . . . . . . . . . . . . . . . . . . . . . 8-5
Interconnect Circuit Schematic (A1), DWG# 21088 . . . . . . . . . . . . . . . . . . . . . . . . . . . . . . . 8-6
Power Supply PC Assy (A2), DWG# 16995 . . . . . . . . . . . . . . . . . . . . . . . . . . . . . . . . . . . . . 8-9
Power Supply Circuit Schematic (A2), DWG# 16996. . . . . . . . . . . . . . . . . . . . . . . . . . . . . . 8-10
GPIB/Cal Control PC Assy (A3), DWG# 21014 . . . . . . . . . . . . . . . . . . . . . . . . . . . . . . . . . . 8-12
GPIB/Cal Control Circuit Schematic (A3), DWG# 21015 . . . . . . . . . . . . . . . . . . . . . . . . . . . 8-13
CPU PC Assy (A4), DWG# 16878 . . . . . . . . . . . . . . . . . . . . . . . . . . . . . . . . . . . . . . . . . . . . 8-15
Series 8500A Peak Power Meters
iv Manual No. 20790, Rev C, November 1998
Superceded by Revision D, March 2009

CPU Circuit Schematic (A4), DWG# 16879 . . . . . . . . . . . . . . . . . . . . . . . . . . . . . . . . . . . . . 8-16
Digital Delay PC Assy (A5), DWG# 16685 . . . . . . . . . . . . . . . . . . . . . . . . . . . . . . . . . . . . . 8-18
Digital Delay Circuit Schematic (A5), DWG# 16686 . . . . . . . . . . . . . . . . . . . . . . . . . . . . . . 8-19
Analog PC Assy (A6/A7), DWG# 20741 . . . . . . . . . . . . . . . . . . . . . . . . . . . . . . . . . . . . . . . 8-22
Analog Circuit Schematic (A6/A7), DWG# 20742 . . . . . . . . . . . . . . . . . . . . . . . . . . . . . . . . 8-23
Front Panel Interface PC Assy (A8), DWG# 20195. . . . . . . . . . . . . . . . . . . . . . . . . . . . . . . 8-26
Front Panel Interface Circuit Schematic (A8), DWG# 20196 . . . . . . . . . . . . . . . . . . . . . . . 8-27
Front Panel Interface PC Assy (A9), DWG# 20526-001 . . . . . . . . . . . . . . . . . . . . . . . . . . . 8-30
Front Panel Interface Circuit Schematic (A9), DWG# 20527 . . . . . . . . . . . . . . . . . . . . . . . 8-31
1 GHz Calibrator Assy, DWG# 20055-001. . . . . . . . . . . . . . . . . . . . . . . . . . . . . . . . . . . . . . 8-32
1GHz Calibrator Schematic (A12), DWG# 17097 . . . . . . . . . . . . . . . . . . . . . . . . . . . . . . . . 8-33
A • Summary of Commands ____________________________________________
A.1 Introduction . . . . . . . . . . . . . . . . . . . . . . . . . . . . . . . . . . . . . . . . . . . . . . . . . . . . . . . . . . . . . . A-1
A.2 Commands Applicable to All Modes. . . . . . . . . . . . . . . . . . . . . . . . . . . . . . . . . . . . . . . . . . . A-1
A.3 CW Mode Commands . . . . . . . . . . . . . . . . . . . . . . . . . . . . . . . . . . . . . . . . . . . . . . . . . . . . . . A-3
A.4 Peak Mode Commands. . . . . . . . . . . . . . . . . . . . . . . . . . . . . . . . . . . . . . . . . . . . . . . . . . . . . A-3
A.5 Graph Mode Commands. . . . . . . . . . . . . . . . . . . . . . . . . . . . . . . . . . . . . . . . . . . . . . . . . . . . A-4
A.5.1 Change Between Cursor, Marker, and Pulse Sub-Modes . . . . . . . . . . . . . . . . . . . A-5
A.5.2 Cursor Sub-Mode Commands. . . . . . . . . . . . . . . . . . . . . . . . . . . . . . . . . . . . . . . . . A-5
A.5.3 Pulse Sub-Mode Commands. . . . . . . . . . . . . . . . . . . . . . . . . . . . . . . . . . . . . . . . . . A-5
A.5.4 Marker Sub-Mode Commands . . . . . . . . . . . . . . . . . . . . . . . . . . . . . . . . . . . . . . . . A-5
A.6 Dual Channel Operation . . . . . . . . . . . . . . . . . . . . . . . . . . . . . . . . . . . . . . . . . . . . . . . . . . . . A-6
A.6.1 CW Mode Commands . . . . . . . . . . . . . . . . . . . . . . . . . . . . . . . . . . . . . . . . . . . . . . . A-6
A.6.2 Peak Mode Commands . . . . . . . . . . . . . . . . . . . . . . . . . . . . . . . . . . . . . . . . . . . . . . A-6
A.6.3 Other Dual Channel Commands . . . . . . . . . . . . . . . . . . . . . . . . . . . . . . . . . . . . . . . A-6
A.6.4 IEEE & 1018B Emulation Commands. . . . . . . . . . . . . . . . . . . . . . . . . . . . . . . . . . . A-6
B • Menu and Memory Keys ____________________________________________
B.1 Introduction . . . . . . . . . . . . . . . . . . . . . . . . . . . . . . . . . . . . . . . . . . . . . . . . . . . . . . . . . . . . . . B-1
B.2 MENU Key Displays . . . . . . . . . . . . . . . . . . . . . . . . . . . . . . . . . . . . . . . . . . . . . . . . . . . . . . . B-1
B.2.1 Normal 8500A Functions . . . . . . . . . . . . . . . . . . . . . . . . . . . . . . . . . . . . . . . . . . . . . B-1
B.2.2 1018B Emulation Mode Functions . . . . . . . . . . . . . . . . . . . . . . . . . . . . . . . . . . . . . B-3
B.3 MEMory Key Displays . . . . . . . . . . . . . . . . . . . . . . . . . . . . . . . . . . . . . . . . . . . . . . . . . . . . . . B-4
C • Display Formats ___________________________________________________
C.1 General . . . . . . . . . . . . . . . . . . . . . . . . . . . . . . . . . . . . . . . . . . . . . . . . . . . . . . . . . . . . . . . . . C-1
C.2 Data Displays . . . . . . . . . . . . . . . . . . . . . . . . . . . . . . . . . . . . . . . . . . . . . . . . . . . . . . . . . . . . C-1
D • RF Detectors______________________________________________________
D.1 Introduction . . . . . . . . . . . . . . . . . . . . . . . . . . . . . . . . . . . . . . . . . . . . . . . . . . . . . . . . . . . . . . D-1
D.2 Detector Specifications . . . . . . . . . . . . . . . . . . . . . . . . . . . . . . . . . . . . . . . . . . . . . . . . . . . . . D-2
D.3 Electrical Description . . . . . . . . . . . . . . . . . . . . . . . . . . . . . . . . . . . . . . . . . . . . . . . . . . . . . . . D-4
D.3.1 Preamplifier PC Assembly . . . . . . . . . . . . . . . . . . . . . . . . . . . . . . . . . . . . . . . . . . . . D-4
D.3.2 PROM PC Assembly . . . . . . . . . . . . . . . . . . . . . . . . . . . . . . . . . . . . . . . . . . . . . . . . D-6
D.4 Detector Maintenance . . . . . . . . . . . . . . . . . . . . . . . . . . . . . . . . . . . . . . . . . . . . . . . . . . . . . . D-7
D.5 Detector Troubleshooting . . . . . . . . . . . . . . . . . . . . . . . . . . . . . . . . . . . . . . . . . . . . . . . . . . . D-7
D.5.1 Disassembly of Detectors . . . . . . . . . . . . . . . . . . . . . . . . . . . . . . . . . . . . . . . . . . . . D-8
D.5.2 Replacement of Detector Element . . . . . . . . . . . . . . . . . . . . . . . . . . . . . . . . . . . . . D-8
D.5.3 Reassembly of Detectors . . . . . . . . . . . . . . . . . . . . . . . . . . . . . . . . . . . . . . . . . . . . D-9
Preface
Manual No. 20790, Rev C, November 1998 v
Superceded by Revision D, March 2009

E • Options ___________________________________________________________
E.1 Introduction . . . . . . . . . . . . . . . . . . . . . . . . . . . . . . . . . . . . . . . . . . . . . . . . . . . . . . . . . . . . . . . E-1
E.2 Option 01: Rack Mount Kit . . . . . . . . . . . . . . . . . . . . . . . . . . . . . . . . . . . . . . . . . . . . . . . . . . E-1
E.3 Option 03: Rear Panel Connections . . . . . . . . . . . . . . . . . . . . . . . . . . . . . . . . . . . . . . . . . . . E-2
1 • Index _____________________________________________________________
Index . . . . . . . . . . . . . . . . . . . . . . . . . . . . . . . . . . . . . . . . . . . . . . . . . . . . . . . . . . . . . . . . . . . . . . . . Index-1
Series 8500A Peak Power Meters
vi Manual No. 20790, Rev C, November 1998
Superceded by Revision D, March 2009

List of Figures
Figure 2-1 Power Connector . . . . . . . . . . . . . . . . . . . . . . . . . . . . . . . . . . . . . . . . . . . . . . . . 2-2
Figure 2-2 PCB Voltage Selector and Fuse Holder . . . . . . . . . . . . . . . . . . . . . . . . . . . . . 2-3
Figure 2-3 VDE Voltage Selector and Fuse Holder . . . . . . . . . . . . . . . . . . . . . . . . . . . . . 2-4
Figure 2-4 Model 8502A Rear Panel . . . . . . . . . . . . . . . . . . . . . . . . . . . . . . . . . . . . . . . . . 2-5
Figure 2-5 Model 8502A Front Panel . . . . . . . . . . . . . . . . . . . . . . . . . . . . . . . . . . . . . . . . . 2-7
Figure 2-6 Typical Single Channel Peak Power Display . . . . . . . . . . . . . . . . . . . . . . . . 2-21
Figure 2-7 Typical Initial Graph Mode Display . . . . . . . . . . . . . . . . . . . . . . . . . . . . . . . . . 2-23
Figure 2-8 Typical Cursor Sub-Mode Digital Plot . . . . . . . . . . . . . . . . . . . . . . . . . . . . . . 2-24
Figure 2-9 Typical Pulse Sub-Mode Digital Plot . . . . . . . . . . . . . . . . . . . . . . . . . . . . . . . 2-26
Figure 2-10 Typical Marker Sub-Mode Digital Plot . . . . . . . . . . . . . . . . . . . . . . . . . . . . . . 2-28
Figure 2-11 Typical Signal Timing . . . . . . . . . . . . . . . . . . . . . . . . . . . . . . . . . . . . . . . . . . . . 2-33
Figure 2-12 Typical Peak Power Ratio Display . . . . . . . . . . . . . . . . . . . . . . . . . . . . . . . . . 2-35
Figure 2-13 Typical Good & Bad Cursor Delay Settings . . . . . . . . . . . . . . . . . . . . . . . . . 2-36
Figure 2-14 Detector to a High-Power Coupler Setup . . . . . . . . . . . . . . . . . . . . . . . . . . . 2-38
Figure 2-15 Detector to High Power Attenuator Setup . . . . . . . . . . . . . . . . . . . . . . . . . . . 2-38
Figure 2-16 Typical Pulse with -10 dBm Trigger Level . . . . . . . . . . . . . . . . . . . . . . . . . . . 2-40
Figure 2-17 Typical Pulsed Swept Measurement System . . . . . . . . . . . . . . . . . . . . . . . . 2-42
Figure 4-1 Series 8500A System Block Diagram . . . . . . . . . . . . . . . . . . . . . . . . . . . . . . . 4-2
Figure 4-2 GPIB/Cal Control (A3) Block Diagram . . . . . . . . . . . . . . . . . . . . . . . . . . . . . . 4-4
Figure 4-3 Voltage to Current Converter . . . . . . . . . . . . . . . . . . . . . . . . . . . . . . . . . . . . . . 4-6
Figure 4-4 CPU (A4) Block Diagram . . . . . . . . . . . . . . . . . . . . . . . . . . . . . . . . . . . . . . . . . 4-8
Figure 4-5 Digital Delay (A5) Block Diagram . . . . . . . . . . . . . . . . . . . . . . . . . . . . . . . . . . 4-12
Figure 4-6 Timing Diagram - Delay Board Functions . . . . . . . . . . . . . . . . . . . . . . . . . . . 4-14
Figure 4-7 Analog PC (A6/A7) Block Diagram . . . . . . . . . . . . . . . . . . . . . . . . . . . . . . . . . 4-20
Figure 4-8 Front Panel Interface (A8) Block Diagram. . . . . . . . . . . . . . . . . . . . . . . . . . . 4-24
Figure 4-9 Detector Calibrator (A12) Block Diagram . . . . . . . . . . . . . . . . . . . . . . . . . . . 4-27
Figure 5-1 Power Linearity Test Setup . . . . . . . . . . . . . . . . . . . . . . . . . . . . . . . . . . . . . . . 5-4
Figure 5-2 Delay Accuracy Test Setup . . . . . . . . . . . . . . . . . . . . . . . . . . . . . . . . . . . . . . . 5-6
Figure 5-3 Model 8501A/8502A Calibration Components. . . . . . . . . . . . . . . . . . . . . . . . 5-9
Figure 5-4 Typical PPM Digital Delay Display . . . . . . . . . . . . . . . . . . . . . . . . . . . . . . . . . 5-16
Figure 5-5 Typical PPM Display with A5R30 at Max cw . . . . . . . . . . . . . . . . . . . . . . . . 5-17
Figure 5-6 Typical PPM Display w/Smooth Rise Time . . . . . . . . . . . . . . . . . . . . . . . . . . 5-17
Figure 5-7 Typical PPM Sync Output Scope Display . . . . . . . . . . . . . . . . . . . . . . . . . . . 5-19
Figure D-1 Op-Amp Equivalent of Pre-Amp Circuit . . . . . . . . . . . . . . . . . . . . . . . . . . . . D-4
Figure D-2 Pre-Amplifier/Line Driver Schematic . . . . . . . . . . . . . . . . . . . . . . . . . . . . . . . . D-5
Figure D-3 PROM PC Assembly Schematic . . . . . . . . . . . . . . . . . . . . . . . . . . . . . . . . . . . D-6
Figure D-4 Detector Disassembly and Assembly Details . . . . . . . . . . . . . . . . . . . . . . . . D-10
Preface
Manual No. 20790, Rev C, November 1998 vii
Superceded by Revision D, March 2009

List of Tables _________________________________________________________
Table 2-1 Self-Test Error Flags . . . . . . . . . . . . . . . . . . . . . . . . . . . . . . . . . . . . . . . . . . . . . 2-44
Table 3-1 Status Code Values and Conditions . . . . . . . . . . . . . . . . . . . . . . . . . . . . . . . . 3-41
Table 3-2 Summary of Bus Functions . . . . . . . . . . . . . . . . . . . . . . . . . . . . . . . . . . . . . . . . 3-43
Table 3-3 GPIB Commands Format . . . . . . . . . . . . . . . . . . . . . . . . . . . . . . . . . . . . . . . . . . 3-44
Table 3-4 1018B Emulation Commands Format . . . . . . . . . . . . . . . . . . . . . . . . . . . . . . . 3-52
Table 4-1 A2 Test Points . . . . . . . . . . . . . . . . . . . . . . . . . . . . . . . . . . . . . . . . . . . . . . . . . . . 4-3
Table 4-2 A3 Test Points . . . . . . . . . . . . . . . . . . . . . . . . . . . . . . . . . . . . . . . . . . . . . . . . . . . 4-7
Table 4-3 A4 Test Points . . . . . . . . . . . . . . . . . . . . . . . . . . . . . . . . . . . . . . . . . . . . . . . . . . . 4-11
Table 4-4 A5 Test Points . . . . . . . . . . . . . . . . . . . . . . . . . . . . . . . . . . . . . . . . . . . . . . . . . . . 4-19
Table 4-5 A6/A7 Analog Test Points . . . . . . . . . . . . . . . . . . . . . . . . . . . . . . . . . . . . . . . . . 4-23
Table 4-6 A8 Interface Assembly Test Points . . . . . . . . . . . . . . . . . . . . . . . . . . . . . . . . . 4-26
Table 5-1 Required Test Equipment . . . . . . . . . . . . . . . . . . . . . . . . . . . . . . . . . . . . . . . . . 5-2
Table 5-2 Required Calibration Test Equipment . . . . . . . . . . . . . . . . . . . . . . . . . . . . . . . 5-10
Table 5-3 Multiples of 25.6 ns . . . . . . . . . . . . . . . . . . . . . . . . . . . . . . . . . . . . . . . . . . . . . . 5-18
Table 6-1 Required Test Equipment . . . . . . . . . . . . . . . . . . . . . . . . . . . . . . . . . . . . . . . . . 6-2
Table 8-1 Series 8500A Diagrams . . . . . . . . . . . . . . . . . . . . . . . . . . . . . . . . . . . . . . . . . . . 8-1
Series 8500A Peak Power Meters
viii Manual No. 20790, Rev C, November 1998
Superceded by Revision D, March 2009
About This Manual
This manual contains the following chapters and appendices to describe the operation andmaintenance of Series 8500A Peak Power Meters:
Preface: In addition to a comprehensive Table of Contents and general information about themanual, the Preface also contains a record of changes made to the manual since its publication, anda description of Special Configurations. If you have ordered a user-specific manual, please refer topage xv for a description of the special configuration.
Chapter 1: Introduction: This is an introduction to the instrument and performance parameters.
Chapter 2: Operation: This is a guide to the instrument front panel keys, display andconfiguration menus.
Chapter 3: Remote Operation: This is a guide to the GPIB remote control interface.
Chapter 4: Theory of Operation: This chapter a block diagram level description of the instrumentand its circuits for maintenance and applications.
Chapter 5: Calibration and Testing: procedures for inspection, calibration, and performancetesting are outlined in this chapter.
Chapter 6: Maintenance: This chapter contains procedures for maintenance and troubleshooting.
Chapter 7: Parts Lists: This chapter lists all components and parts and their sources.
Chapter 8: Diagrams: This chapter contains schematics and parts placement diagrams for allcircuits.
Appendix A: Summary of Commands: A summary of the commands used to operate the Series8500A front the front panel.
Appendix B: Menu and Memory Keys: A summary of the menus and functions that can beaccessed with the MENU and MEMory keys.
Appendix C: Data Display Formats: A summary of the data display formats with thecorresponding mode and detector selection switches.
Appendix D: RF Detectors: Selection data for power detectors, specifications, and calibrationprocedures.
Appendix E: Options: This appendix will be included only when necessary to describe optionsthat are available for the Series 8500A power meters.
Changes that occur after publication of the manual, and special configuration data will be insertedas loose pages in the manual binder. Please insert and/or replace the indicated pages as detailed inthe Technical Publication Change Instructions included with new and replacement pages.
Manual No. 20790, Rev C, November 1998 ix
Superceded by Revision D, March 2009

Series 8500A Peak Power Meters
x Manual No. 20790, Rev C, November 1998
Superceded by Revision D, March 2009
Conventions
The following conventions are used in this product manual. Additional conventions not includedhere will be defined at the time of usage.
Warning
WARNING
The WARNING statement is enclosed in double lines and centered inthe page. This calls attention to a situation, or an operating ormaintenance procedure, or practice, which if not strictly corrected orobserved, could result in injury or death of personnel. An example isthe proximity of high voltage.
Caution
CAUTION
The CAUTION statement is enclosed within a single heavy line andcentered in the page. This calls attention to a situation, or an operatingor maintenance procedure, or practice, which if not strictly correctedor observed, could result in temporary or permanent damage to theequipment, or loss of effectiveness.
Notes
NOTE: A NOTE highlights or amplifies an essential operating ormaintenance procedure, practice, condition or statement.
Keys
Front panel keys intended to be pressed are contained within brackets, such as [MENU], whichmeans to press the MENU key. The Menu and Memory keys may be followed by a number inparenthesis. This means to press the key that number of times to reach a specific level.
Manual No. 20790, Rev C, November 1998 xi
Superceded by Revision D, March 2009
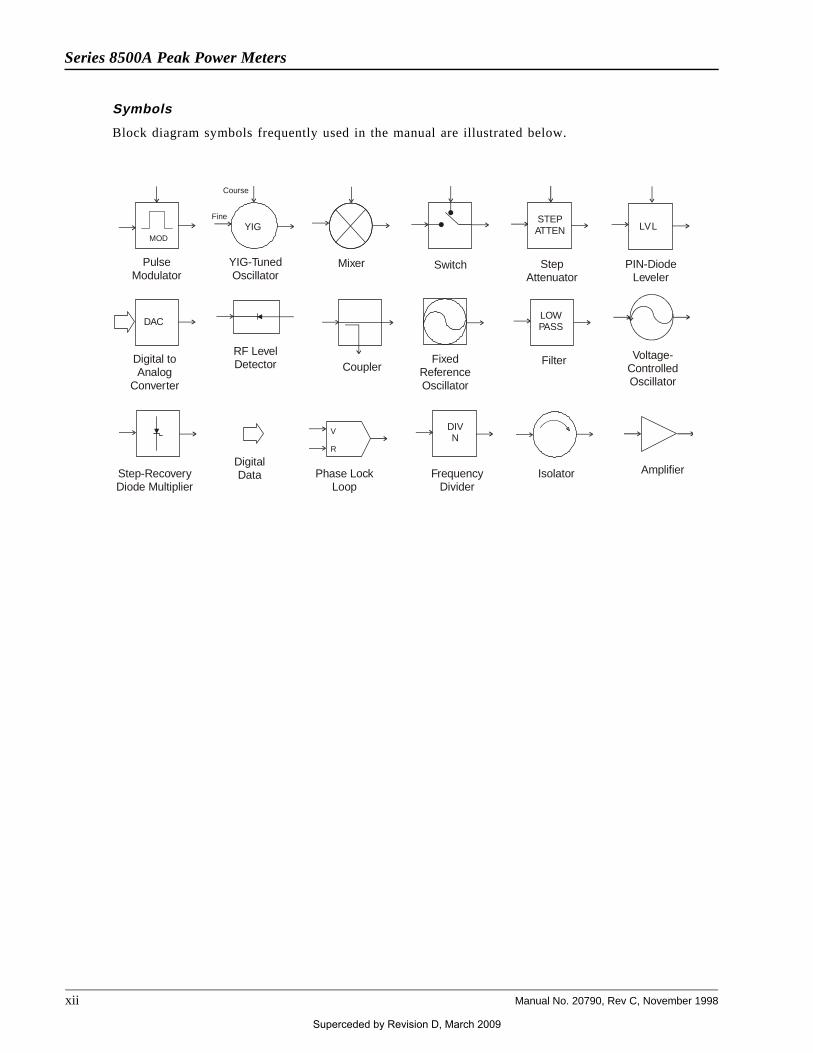
Symbols
Block diagram symbols frequently used in the manual are illustrated below.
DIVN
FrequencyDivider
PulseModulator
MOD
Course
Fine
YIG-TunedOscillator
YIGSTEP
ATTEN
StepAttenuator
RF LevelDetector Coupler
Voltage-ControlledOscillator
Mixer
FixedReferenceOscillator
Switch PIN-DiodeLeveler
LVL
Filter
Step-RecoveryDiode Multiplier
DigitalData
Digital toAnalog
Converter
DAC
Phase LockLoop
Isolator Amplifier
LOWPASS
V
R
Series 8500A Peak Power Meters
xii Manual No. 20790, Rev C, November 1998
Superceded by Revision D, March 2009

Record of Manual Changes
This table is provided for your convenience to maintain a permanent record of manual change data.Corrected replacement pages will be issued as Technical Publication Change Instructions, and willbe inserted at the front of the binder. Remove the corresponding old pages, insert the new pages,and record the changes here.
Change InstructionNumber
Change InstructionDate
DateEntered Comments
Manual No. 20790, Rev C, November 1998 xiii
Superceded by Revision D, March 2009

Series 8500A Peak Power Meters
xiv Manual No. 20790, Rev C, November 1998
Superceded by Revision D, March 2009
Special Configurations
When the accompanying product has been configured for user-specific application(s), supplementalpages will be inserted at the front of the manual binder. Remove this page and replace it with thefurnished Special Configuration supplemental page(s).
Manual No. 20790, Rev C, November 1998 xv
Superceded by Revision D, March 2009

Series 8500A Peak Power Meters
xvi Manual No. 20790, Rev C, November 1998
Superceded by Revision D, March 2009

Manual 20790, Rev. C, November 1998 1-1
1111
IIIInnnnttttrrrroooodddduuuuccccttttiiiioooonnnn
1.1 Description
The Giga-tronics 8500A Series Peak Power Meters (PPM) are designed for the analysis and powermeasurement of pulsed RF and microwave signals produced by microwave component devices.
The PPM converts RF energy to dc voltage by using balanced (dual Schottky diode), zero-biased,detectors with very fast rise times. The dc voltage is measured with an autoranging dc amplifier, and anA/D converter provides the digitized voltage to a MC68000 microprocessor. The microprocessoraccomplishes the required log functions, diode linearization, frequency response, and othermathematical functions.
The PPM can measure the power in both single and repetitive pulses as well as the power in a CWsignal. Power measurements are presented on an Electro Luminescent (EL) screen to display bothalphanumeric and graphic information. Modes of operation are indicated both by information on thedisplay and by LED lights on the front panel. Changes in mode or test parameters can be accomplishedwith the front panel keypad or, for some operations, the large spin knob on the front panel, which canbe used as an analog adjustment for certain parameters.
GPIB (IEEE Bus) setup and measurement operation are standard in the 8500A power meters. It enablesvarious other functions, such as reporting of errors, malfunctions, operational status, and self testdiagnostics.
The Model 8501A has a single detector input; Model 8502A has dual detector inputs for making ratiomeasurements. All technical and operation descriptions in this manual apply equally to both modelsunless otherwise stated.
Performance specifications for the Series 8500A are in Sectio n 1.2. Detector specifications arecontained in Appendix D. Options, if any will be detailed in Appendix E.
Power requirements are 100/120/220/240 Vac ±10%, 48-400 Hz. See Section 2.2 for Safety Precautionsand details to set the voltage and install the correct fuse for the area in which the instrument will beused.
Superceded by Revision D, March 2009

Series 8500A Peak Power Meters
1-2 Manual 20790, Rev. C, November 1998
1.1.1 Environmental Requirements
Series 8500A power meters are type tested to MIL-T-28800E, Type III, Class 5, Style E for Navyshipboard, submarine, and shore applications except as follows:
• Operating temperature range is 0 °C to 50 °C (calibrator operating temperature range is 5 °C to35 °C).
• Non-operating (storage) temperature range is -4 0°C to +7 0°C.
• Relative humidity is limited to 95% non-condensing.
• Altitude and EMI requirements are not specified.
1.1.2 Items Furnished
In addition to options and/or accessories specifically ordered, items furnished with the instrument are:
1 ea. - Power Cord1 ea. - Detachable Detector Cable (for Model 8501A), or2 ea. - Detachable Detector Cables (for Model 8502A)1 ea. - Operation and Maintenance Manual
1.1.3 Items Required
The 8500A requires an external power detector; see Appendix D for power detector specifications.
1.1.4 Tools and Test Equipment
No special tools are required to operate the Series 8500A. Test equipment required for calibration orperformance verification is described in Chapter 4.
1.1.5 Cooling
No cooling is required if the instrument is operated within its specified operating temperature range(0 to 50 °C).
1.1.6 Cleaning
The front panel can be cleaned using a cloth dampened with a mild detergent; wipe off the detergentresidue with a damp cloth and dry with a dry cloth. Solvents and abrasive cleaners should not be used.
1.1.7 Receiving Inspection
Use care in removing the instrument from the carton and check immediately for physical damage, suchas bent or broken connectors on the front and rear panels, dents or scratches on the panels, brokenextractor handles, etc. Check the shipping carton for evidence of physical damage and immediatelyreport any damage to the shipping carrier.
Each Giga-tronics instrument must pass rigorous inspections and tests prior to shipment. Upon receipt,its performance should be verified to ensure that operation has not been impaired during shipment. Theperformance verification procedure is described in Chapter 5 of this manual.
Superceded by Revision D, March 2009

Introduction
Manual 20790, Rev. C, November 1998 1-3
1.1.8 Returning an Instrument
If you are returning an instrument to Giga-tronics for any reason, including service, first contactGiga-tronics Customer Service at (800) 444-2878 or Fax at (925) 328-4702 so that a returnauthorization number can be assigned. You can also contact Customer Service over their e-mail [email protected].
To protect the instrument during reshipment, use the best packaging materials available. If possible usethe original shipping container. If this is not possible, a strong carton or a wooden box should be used.Wrap the instrument in heavy paper or plastic before placing it in the shipping container. Completelyfill the areas on all sides of the instrument with packaging material. Take extra precautions to protectthe front and rear panels.
Seal the package with strong tape or metal bands. Mark the outside of the package “FRAGILE —
DELICATE INSTRUMENT”. If corresponding with the factory or local Giga-tronics salesoffice regarding reshipment, please reference the full model number and serial number. If the instrumentis being reshipped for repair, enclose all available pertinent data regarding the problem that has beenfound.
Superceded by Revision D, March 2009

Series 8500A Peak Power Meters
1-4 Manual 20790, Rev. C, November 1998
1.2 System Specifications
Frequency Range 30 MHz to 40 GHz depending on detectors
(See the Detector Specifications in Appendix D)
Power Range (Direct input to detector):
Pulse Mode: -20 to +20 dBm
CW Mode: -40 to +20 dBm
Absolute Maximum Limit: +23 dBm (200 mW)
Accuracy The uncertainty of microwave power measurements depends onseveral factors, the most important is the effective mismatch ofboth the power detector and the RF source. Excluding mismatcheffects, the measurement uncertainties of the instrument and itspower detectors are as follows:
Calibrator Power Uncertainty
(at 0 dBm): ±1.5% (0.065 dBm)
Linearity after Automatic
Calibration: ±3% (at stable temperature)
Temperature coefficient of
linearity at ambien t±5 °C, CW
and Peak, typical: >-10 dBm negligible, 0 to 50 °C<-10 dBm ±0.5%/deg.C, 15 to 50 °C±1.0%/deg.C, 0 to 15 °C(The instrument indicates if the ±5 °C calibration range isexceeded)
Uncertainty
(due to zeroing and noise): CW: <±10 nW, 15 to 50 °C (Avg. = 500) <±20 nW, 0 to 15 °CPeak: <±3.5 mW, 15 to 50 °C (Avg. = 100) <±5.0 mW, 0 to 15 °C
Single Pulse: <±15 mW, 15 to 50 °C (typical)<±30 mW, 0 to 15 °C (typical)
Time Base Range
Graph Mode: 1.2 ns/DIV to 20 ms/DIV (12 ns to 20 0ms time window usingeither the Data Entry keyboard or the spin knob)
Resolution: 0.1 ns
Accuracy: 0 to 10 ms, ±0.2% ±1 ns; 10 ms to 5 ms, ±0.1%; 5 ms to200 ms, ±0.01%
Superceded by Revision D, March 2009

Introduction
Manual 20790, Rev. C, November 1998 1-5
Trigger Delay
Range: 0 to 200 ms, using either the Data Entry keyboard or the spinknob
Resolution: 0.1 ns
Accuracy: 0 to 10 ms, ±0.2% ±1 ns; 10 ms to 5 ms, ±0.1%; 5 ms to200 ms, ±0.01%
Triggering Modes
Internal: -20 dBm to +16 dBm limited to >2 dB and <20 dB below the peaklevel of the signal.
Duty Cycle: <50%
Trigger Rate: 10 Hz to 10 MHz
External: TTL levels, Max PRF = 1 MHz
Graph Display Mode Plots the outline of the detected pulse on the EL display. Alsoprovides readout of amplitude and timing information.
Fast Measurement Mode Available under GPIB control to provide fast data acquisition andoutput.
For an averaging number = 1, typically will be between 70 and120 measurements/second.
Also can be used to provide fast data acquisition and throughputvia a rear panel analog output for using an 8500A with a networkanalyzer to make swept frequency response tests.
Calibrator Specifications
Frequency: 1 GHz ±5%
Power Uncertainty at 1mW: ±1.5%
Return Loss at 1 mW: Greater than 25 dB
Self Calibration Time: Less than 1 minute
Connector: Type N
Superceded by Revision D, March 2009

Series 8500A Peak Power Meters
1-6 Manual 20790, Rev. C, November 1998
Auxiliary Inputs/Outputs
Monitor: Provides a voltage proportional to the detected RF envelope.Rise time is typically 20 ns, output impedance is nominally 50ohms.
Analog Output Coefficient: 100 mV/dB ±0.5 mV (0 V = 0 dBm)
Offset: ±10 mV
Trigger Input: TTL
RF Blanking: TTL open collector low during zeroing. Used to control powersource.
VPROPF: (V/GHz) Allows direct entry of frequency from RF power sourcesequipped with a VpropF output.
GPIB Interface: Per IEEE STD 488-1978
GPIB Indicators: REM, TLK, LSN, SRQ, LLO
Remote Operation Complete setup and measurement capabilities accessible viaGPIB (IEEE 488). Reporting of errors, malfunctions, operationalstatus, and self-test diagnostics available through serial pollcapability.
Direct Plot Output: Outputs hardcopy pulse profile plots, with time, date and partidentification, to a GPIB plotter.
GPIB Address: Selectable from front panel
IEEE Interface Functions: SH1, AH1, T6, L4, SR1, RL1, PP0, DC1, DT1, TE0, LE0
General Specifications
Stored Setups: Saves settings at power down, and has 10 additional setups innon-volatile memory.
Power-On Self-Test (POST): POST is optionally performed at any time. A diagnostic codeindicates the cause and location of any errors.
Reset Control
(rear panel): Returns the instrument to preset (default) condition.
Design and Construction: To the intent of MIL-T-28800C, Type III, Class 5, Style E or F,Color R
Power Requirements: 100, 120, 220, or 240 Vac ±10%, 50, 60, or 400 Hz ±5%
Power Consumption: Approximately 100 VA
Operating Temperature: 0 to 50 °C (32 to 122 °F)
Non-operating Temperature: -40 to +65 °C (-40 to +149 °F)
Superceded by Revision D, March 2009

Introduction
Manual 20790, Rev. C, November 1998 1-7
Operating Humidity
(without precipitation): 95%, ±5% to 30 °C75%, ±5% to 40 °C45%, ±5% to 50 °C
Dimensions:
Bench Mount: With Feet: 148.3 x 425.7 x 355.6 mm (5.84 x 16.76 x 14.00 in.)Without Feet: 132.6 x 425.7 x 355.6 mm (5.22 x 16.76 x 14.00 in.)
Rack Mount: 132.6 x 482.6 x 355.6 mm (5.22 x 19.00 x 14.00 in.)Conforms to EIA RS-310 Standard for a 19-inch rack.
Weight: Model 8501A: 12 kg (26 lbs)
Model 8502A: 13 kg (28 lbs)
Depending upon requirements, the following software versions and enhancements apply (See Table 1-1).
Table 1-1: 8500A Functions Related to Software Versions
S/W Version Sound Works Fast AnalogS-Mode
(FAA)Menu Wrap
2.10A YES
2.11A
2.13A YES YES
2.14A YES YES YES
Superceded by Revision D, March 2009

Series 8500A Peak Power Meters
1-8 Manual 20790, Rev. C, November 1998
1.3 Default Settings
Factory-programmed settings of various user definable functions have the following defaults wheneverthere have been no changes made in the settings by the operator during any testing routines.
The following settings are not affected by power-on, initialization, and setup store or recall:
Function Default Setting
Averaging CW: 4 samples; Peak: 4 samples
Internal Trigger Level (A & B) -10 dBm
Frequency 1.00 GHz
Offset 0 dB
Cursor Delay (A & B) 1.0000 microseconds
Start Delay 0.0000 nanoseconds
Delay Window (A & B) 10.0000 microseconds
Reference Power Level (A & B) 0 dBm
Reference Delay (A & B) 0.0000 microseconds
Cal Factor 0 dB
Mode Channel A, CW power, dBm
Trigger Mode Channel A, Internal
Pulse Width Start 50%
Pulse Width End 50%
Rise Time Start 10%
Rise Time End 90%
Fall Time Start 90%
Fall Time End 10%
Marker 1 2.5% (A and B)
Marker 2 17.8% (A and B)
Marker 3 46.9% (A and B)
Marker 4 90% (A and B)
Maximum Power +20.5 dBm
Minimum Power -45.0 dBm
Autoscale Average Number 4
Autoscale Initial Delay 75 µs
Plotter Address 6
PPM Address 4
Source of Frequency Correction a) User supplied (as input, default = 1GHz)b) VpropF - parameters not subject to store/recall or initializationc) Cal Factor - not subject to store/recall orinitialization
Frequency Display Displayed
Superceded by Revision D, March 2009

2 Operation
2.1 GeneralThe Series 8500A Peak Power Meters are very simple to operate. You only need to follow the instructionsgiven in the prompts and menus shown in the display window to set up the parameters for making ameasurement. Eleven levels of operational menus are available. Each can be accessed with the MENUkey. The type of measurement (Peak or CW) being made will also be shown in the lower right corner ofthe display to identify the mode in use.
Along with the menus and prompts in the display, the power meters produce audible clicks and beeps toindicate the occurrence (or non-occurrence) of certain events during setup and testing. The tones aredefined as follows:
Click: When a key is pressed and a click is heard, this means that the key is active and itsfunction will be included in the parameters being entered. If no click is heard, thekey is not active and not performing any function at that time.
Beep: A single beep indicates that the calibration, zeroing, or self-test functions havesuccessfully completed when they are performed. A double beep means that thefunction failed to complete. The discussion of these functions later in this chapterwill detail what problems might cause the function to fail.
There is a volume control on the rear panel of the instrument. It adjusts the audio tones to a comfortablelevel, or the audio can be turned off if desired.
NOTE: In the remainder of this chapter except where specified as the Model 8501A or8502A, the instrument may be referred to as the PPM (Peak Power Meter).
2.2 InstallationThe unit is set at the factory for operation at the normal supply voltage for the country in which it issold. The input frequency must be 50, 60, or 400 Hz ±5%. The combination of the module andtransformer design allows instrument operation of 100/120 volts with a 2.0 A Slo-Blo fuse, or 220/240volts with a 1.0 A Slo-Blo fuse.
WARNING
Before applying ac power to the instrument, be sure that the instrument is set forthe correct line voltage and that the fuses are of the correct rating.
Figure 2-4 illustrates the rear panel. Before operating the instrument, make sure the input voltage iscorrectly set and that the fuses are compatible with the applied line voltage.
Manual No. 20790, Rev C, November 1998 2-1Superceded by Revision D, March 2009

NOTE: The 8500A may be furnished with the PC-oriented voltage selector and fuse holderdescribed next, or the VDE-approved fuse holder described in the following pages. Referto the appropriate type of voltage selector and fuse holder for your power meter.
CAUTION
The instrument may be damaged if you turn it on while the voltage selector andfuses are incorrect for the applied line voltage.
The power meter is supplied with a three-conductor NEMA type power cord for connection to the powersource and safety ground, as illustrated in Figure 2-1. The current carrying conductor is black and itsreturn is white. The green wire of the power cord is for connection to earth ground. The instrument willbe properly grounded if the plug is connected to a properly installed three-prong receptacle. If athree-prong to two-prong adapter is used, be sure that the pigtail lead of the adapter is earth-grounded.
WARNING
The safety ground is connected directly to the chassis. If a 3-to-2 wire adapter isto be used, be sure to connect the ground lead from the adapter to earth ground.Failure to do this could cause the instrument to float above ground, posing a shockhazard.
EARTH GROUND
EARTH GROUND
LINE
LINE
NEUTRAL
NEUTRAL
Figure 2-1. Power Connector
Series 8500A Peak Power Meters
2-2 Manual No. 20790, Rev C, November 1998
Superceded by Revision D, March 2009
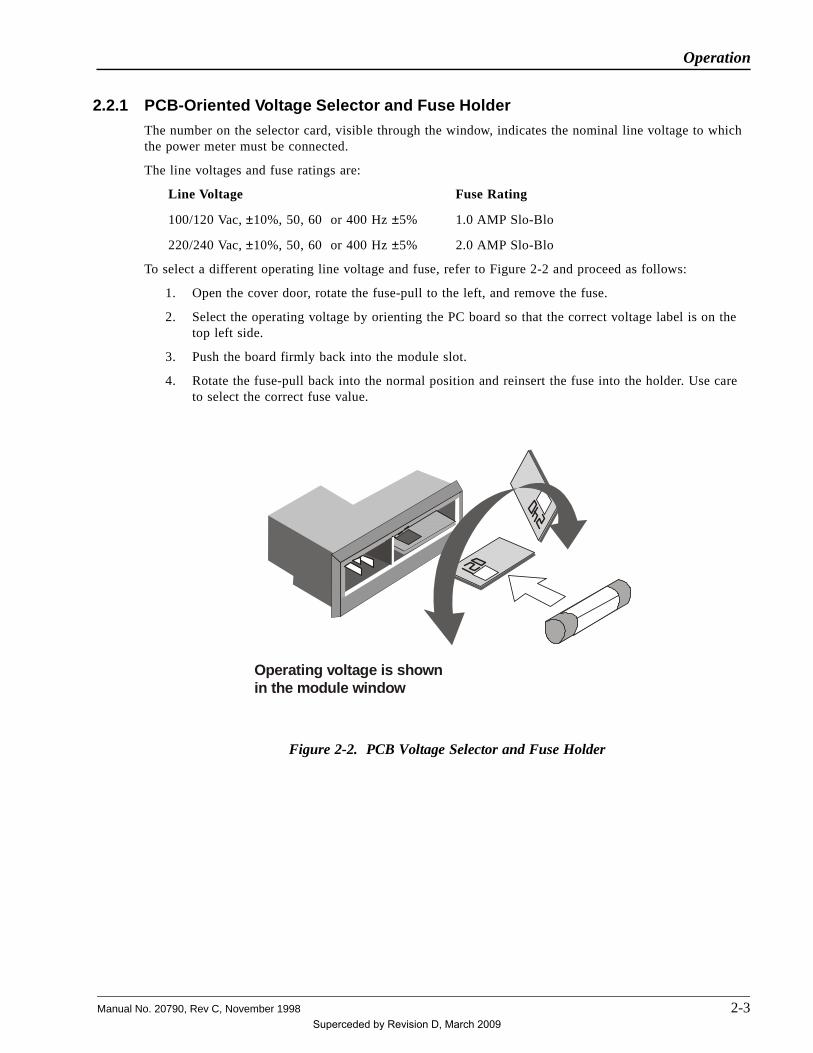
2.2.1 PCB-Oriented Voltage Selector and Fuse Holder
The number on the selector card, visible through the window, indicates the nominal line voltage to whichthe power meter must be connected.
The line voltages and fuse ratings are:
Line Voltage Fuse Rating
100/120 Vac, ±10%, 50, 60 or 400 Hz ±5% 1.0 AMP Slo-Blo
220/240 Vac, ±10%, 50, 60 or 400 Hz ±5% 2.0 AMP Slo-Blo
To select a different operating line voltage and fuse, refer to Figure 2-2 and proceed as follows:
1. Open the cover door, rotate the fuse-pull to the left, and remove the fuse.
2. Select the operating voltage by orienting the PC board so that the correct voltage label is on thetop left side.
3. Push the board firmly back into the module slot.
4. Rotate the fuse-pull back into the normal position and reinsert the fuse into the holder. Use careto select the correct fuse value.
Operating voltage is shownin the module window
Figure 2-2. PCB Voltage Selector and Fuse Holder
Operation
Manual No. 20790, Rev C, November 1998 2-3Superceded by Revision D, March 2009
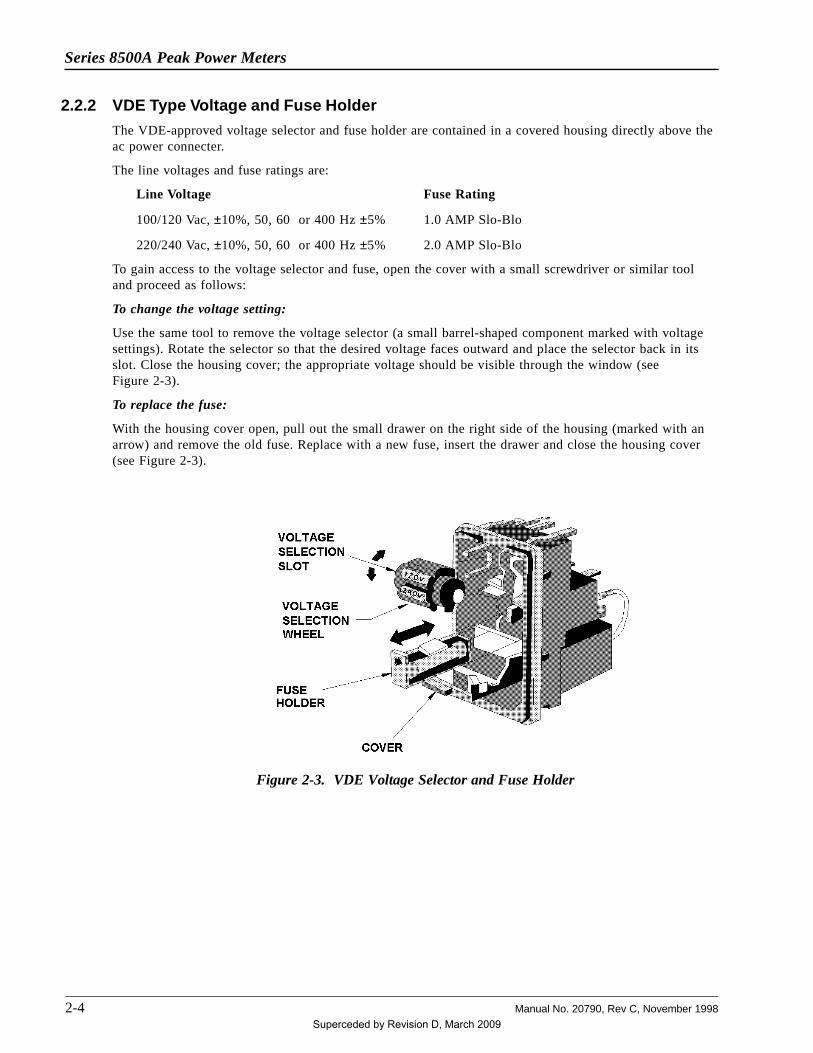
2.2.2 VDE Type Voltage and Fuse Holder
The VDE-approved voltage selector and fuse holder are contained in a covered housing directly above theac power connecter.
The line voltages and fuse ratings are:
Line Voltage Fuse Rating
100/120 Vac, ±10%, 50, 60 or 400 Hz ±5% 1.0 AMP Slo-Blo
220/240 Vac, ±10%, 50, 60 or 400 Hz ±5% 2.0 AMP Slo-Blo
To gain access to the voltage selector and fuse, open the cover with a small screwdriver or similar tooland proceed as follows:
To change the voltage setting:
Use the same tool to remove the voltage selector (a small barrel-shaped component marked with voltagesettings). Rotate the selector so that the desired voltage faces outward and place the selector back in itsslot. Close the housing cover; the appropriate voltage should be visible through the window (seeFigure 2-3).
To replace the fuse:
With the housing cover open, pull out the small drawer on the right side of the housing (marked with anarrow) and remove the old fuse. Replace with a new fuse, insert the drawer and close the housing cover(see Figure 2-3).
Figure 2-3. VDE Voltage Selector and Fuse Holder
Series 8500A Peak Power Meters
2-4 Manual No. 20790, Rev C, November 1998
Superceded by Revision D, March 2009
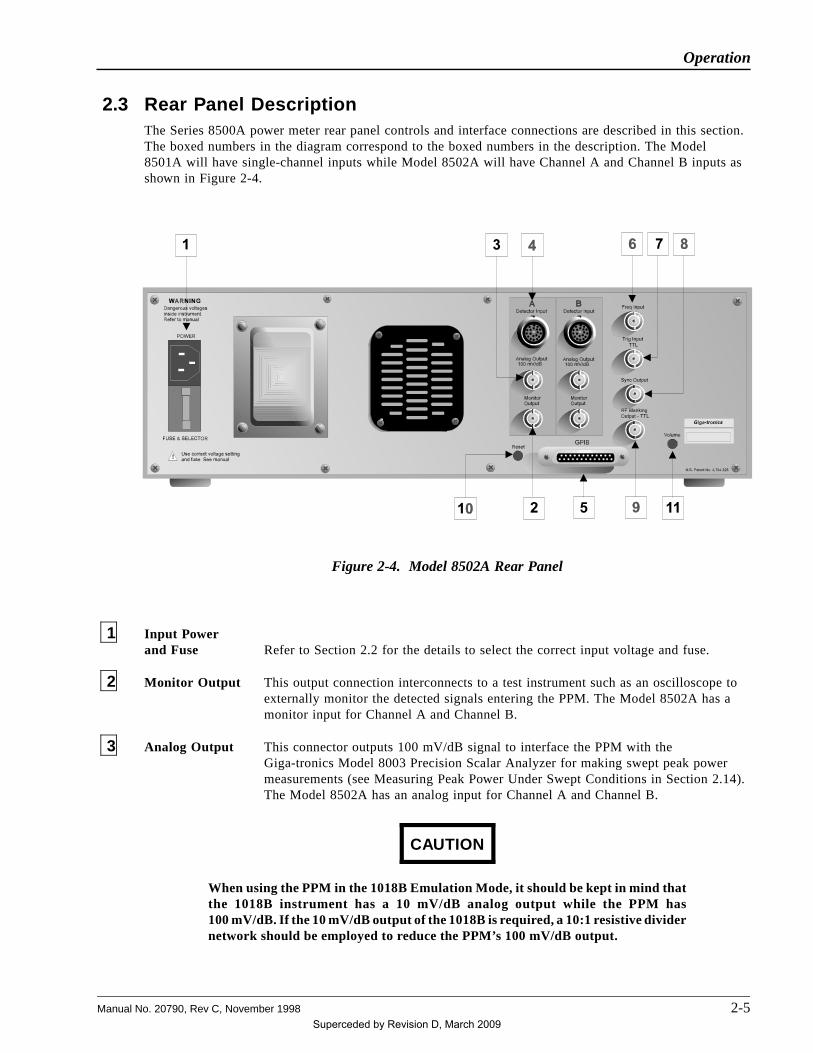
2.3 Rear Panel DescriptionThe Series 8500A power meter rear panel controls and interface connections are described in this section.The boxed numbers in the diagram correspond to the boxed numbers in the description. The Model8501A will have single-channel inputs while Model 8502A will have Channel A and Channel B inputs asshown in Figure 2-4.
1 Input Powerand Fuse Refer to Section 2.2 for the details to select the correct input voltage and fuse.
2 Monitor Output This output connection interconnects to a test instrument such as an oscilloscope toexternally monitor the detected signals entering the PPM. The Model 8502A has amonitor input for Channel A and Channel B.
3 Analog Output This connector outputs 100 mV/dB signal to interface the PPM with theGiga-tronics Model 8003 Precision Scalar Analyzer for making swept peak powermeasurements (see Measuring Peak Power Under Swept Conditions in Section 2.14).The Model 8502A has an analog input for Channel A and Channel B.
CAUTION
When using the PPM in the 1018B Emulation Mode, it should be kept in mind thatthe 1018B instrument has a 10 mV/dB analog output while the PPM has100 mV/dB. If the 10 mV/dB output of the 1018B is required, a 10:1 resistive dividernetwork should be employed to reduce the PPM’s 100 mV/dB output.
Figure 2-4. Model 8502A Rear Panel
Operation
Manual No. 20790, Rev C, November 1998 2-5Superceded by Revision D, March 2009

4 Detector Input These channel A and B inputs (single input in the 8501A) will be hole cover platesunless Option 03 (Rear Panel Connection) has been ordered. With Option 03, theDetector Input and Calibrator will be relocated from the front to the rear panel. TheCalibrator connection will be above the Serial/Code number label on the right sideof the rear panel.
5 GPIB Interface This is the interface connection for controlling the instrument through the GPIB(IEEE bus).
6 FREQ Input This is the voltage-proportional-to-frequency (VpropF) input connection thatreceives the Frequency Reference or V/GHz (V α F) output signal from an externalsignal generator. This signal provides frequency information to the PPM for detectorfrequency response correction when required.
7 TRIG Input -TTL
This connection interfaces a TTL signal source to provide an external trigger whenthis mode of operation is selected.
8 SYNC Output This output connection provides access to the sample pulse for synchronizing thePPM to an external counter.
9 RF BlankingOutput - TTL
This output interfaces a blanking TTL signal to turn off the external RF powersignal source when you want to autozero or calibrate the detectors. It is at a TTLhigh level during execution of these functions.
10 Reset This control resets the PPM to its initial power-on condition without having to turnoff the instrument.
11 Volume Control This control adjusts the volume level of the audio tones generated by the PPM. Theaudio can be turned off with this control.
Series 8500A Peak Power Meters
2-6 Manual No. 20790, Rev C, November 1998
Superceded by Revision D, March 2009

2.4 Front Panel DescriptionThe front panel controls, display, and connections are described in this section. The boxed numbers inFigure 2-5 correspond to the boxed numbers in the description. The Peak, CW, and Graph keys in bothpower meter models, and the Detector Select A and B keys of the Model 8502A contain lights in thecenter of the buttons to indicate when the functions are active.
1 Power This is the push-on push-off ac power switch to the PPM.
2 Display This is an Electro Luminescent (EL) alphanumeric and graphic display screen. Itpresents data and shows pulse waveform profiles.
3 GPIBIndicators
These LEDs indicate whether the PPM is under local or remote control and thecurrent GPIB status (REM = remote control on, LSN = listen, TLK = talk, SRQ =service request, and LLO = local lockout.)
4 F1, F2, F3Directional keysBackspace
The F1 (up) and F2 (down) directional keys are used in the Graph Mode to move thecursor (∆ icon) up and down to select any pulse or cursor parameters that are to bechanged. The F3 (backspace) key is for correcting entered text or numbers.
A secondary function of these keys is to select menu functions as the various menusare displayed.
5 Ready, New DataIndicators
These LEDs flash whenever the system is receiving a trigger. If the Ready light issteadily on and the New Data light is off, it would indicate that a trigger was notbeing received.
6 Data Entry Use this 12-button keypad to enter parameter data when instructed in the applicableprocedure.
P e a k P o w e r M e t e r M odel 8502A
7 8 9
1
0 . _ ns
m s
µs
Clear
F1 F2 F3
2 3
4 5 6G Hz kW
dB W
dBm m W
O nO ff
LL0
G P IBR EM
SRQ
LSN
T LK
Ready
New D ata
Pulse/Cursor M emFreqM enu
D etector Selec tA B
Peak C W G raph
Autoscale
D e t e c t o r I n p u t
A B
Calibrator1 G Hz
Bksp
2 6 7 8 13 17
10 11 12 15 16
14
3 4 5 91
Figure 2-5. Model 8502A Front Panel
Operation
Manual No. 20790, Rev C, November 1998 2-7Superceded by Revision D, March 2009

7 Clear The CLEAR key exits from a menu, but it clears erroneous entries while enteringdata.
8 Units:
ns/dBm mW This key enters pulse timing parameters in nanoseconds. The dBm mW functionenters a power parameter in either dBm or milliwatts.
µs/dB W This key enters pulse timing parameters in microseconds. The dB W function entersa power parameter in either dB or Watts.
ms/GHz kW This key enters pulse timing parameters in milliseconds. The GHz kW functionenters a frequency in GHz or (with offsets) a power parameter in kilowatts.
NOTE: Each of the unit keys have a secondary function. At various points in theseinstructions, the procedures will state to press any units key. This is to enter a parameterwithout units (average number), to enter units other than those listed above (start voltage),or to start a function.
9 Pulse/Cursor/Marker
This key is active only in the Graph Mode. Pressing the key cycles the PPM throughthe three sub-modes: Pulse, Cursor, and Marker. The Cursor sub-mode is convenientfor changing the time base parameters, scaling, trigger level, and cursor position.The Pulse sub-mode displays the rise time, fall time, and pulse width of the currentpulse. The Marker sub-mode displays the time between four user-defined powerlevels on the pulse.
10 Menu The MENU key enables access to the eleven main menus of the PPM. Depending onthe mode of operation, other keys can display sub-menus that pertain to theparticular function of that key. However, the MENU key will cause the routine tostep through each of the main menus each time it is pressed. As an example, if itwere pressed three times, then Menu 3 would be displayed.
Appendix B contains a description of each menu that will be accessed at eachkeystroke of the MENU key. Wherever possible, commands or user selections thatwould be used more often are located at the top of the menu structure (Menu-1through Menu-4). Less commonly used menus are located toward the bottom of themenu structure (Menu-5 through Menu-11).
11 Freq This key enters the signal frequency for the channel A and B detectors. When thePPM default setting is used, all that is required is the entry of the frequency of thespecific signal being tested.
If the PPM is in the Cal Factor or V/GHz setting, the FREQ key will allow you tochange these parameters by following the prompts.
12 MEM This key activates three memory menus. Press the key once to display memoryMenu-1. Press the key twice to display memory Menu-2, and three times formemory Menu-3. Press [CLEAR] to return the routine to the Data Display mode.
The memory menus control the non-volatile setup memories. The contents of the tenmemory locations can be stored, recalled, initialized, and displayed. The menus alsogive you the option to return to the current test setup (the test in use just before theMEM key was pressed), as well as the option to return to the initial power-on status.
Series 8500A Peak Power Meters
2-8 Manual No. 20790, Rev C, November 1998
Superceded by Revision D, March 2009
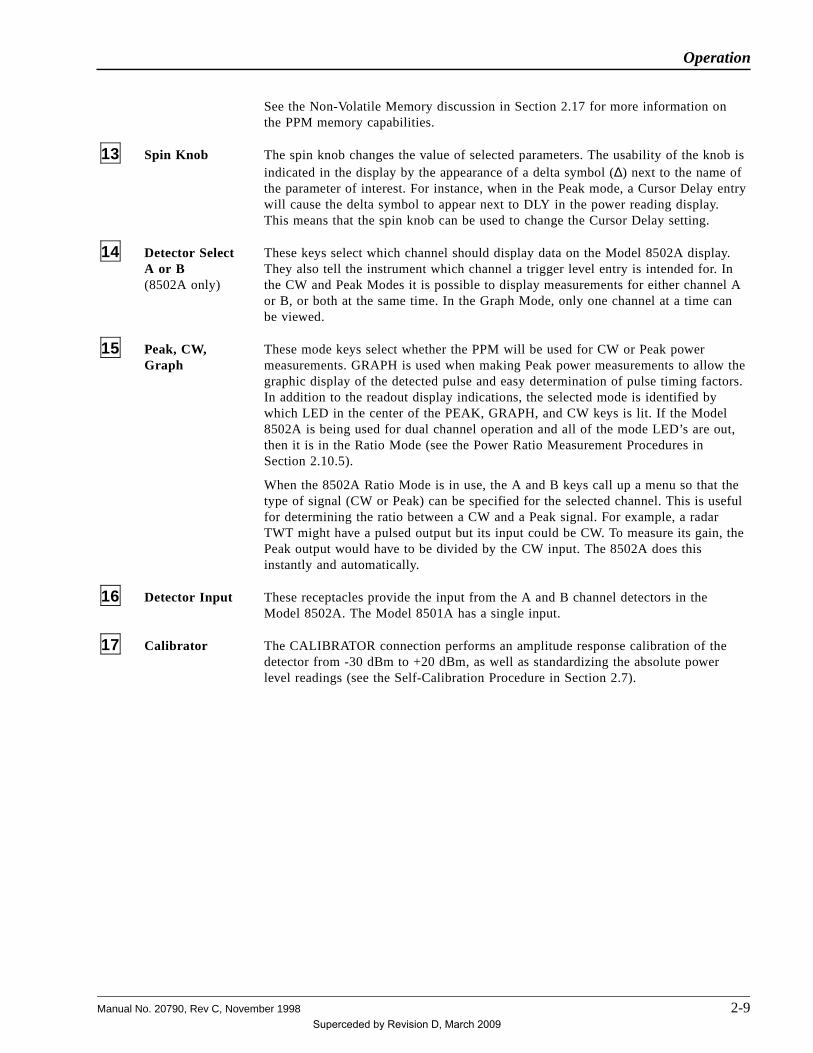
See the Non-Volatile Memory discussion in Section 2.17 for more information onthe PPM memory capabilities.
13 Spin Knob The spin knob changes the value of selected parameters. The usability of the knob isindicated in the display by the appearance of a delta symbol (∆) next to the name ofthe parameter of interest. For instance, when in the Peak mode, a Cursor Delay entrywill cause the delta symbol to appear next to DLY in the power reading display.This means that the spin knob can be used to change the Cursor Delay setting.
14 Detector SelectA or B(8502A only)
These keys select which channel should display data on the Model 8502A display.They also tell the instrument which channel a trigger level entry is intended for. Inthe CW and Peak Modes it is possible to display measurements for either channel Aor B, or both at the same time. In the Graph Mode, only one channel at a time canbe viewed.
15 Peak, CW, Graph
These mode keys select whether the PPM will be used for CW or Peak powermeasurements. GRAPH is used when making Peak power measurements to allow thegraphic display of the detected pulse and easy determination of pulse timing factors.In addition to the readout display indications, the selected mode is identified bywhich LED in the center of the PEAK, GRAPH, and CW keys is lit. If the Model8502A is being used for dual channel operation and all of the mode LED’s are out,then it is in the Ratio Mode (see the Power Ratio Measurement Procedures inSection 2.10.5).
When the 8502A Ratio Mode is in use, the A and B keys call up a menu so that thetype of signal (CW or Peak) can be specified for the selected channel. This is usefulfor determining the ratio between a CW and a Peak signal. For example, a radarTWT might have a pulsed output but its input could be CW. To measure its gain, thePeak output would have to be divided by the CW input. The 8502A does thisinstantly and automatically.
16 Detector Input These receptacles provide the input from the A and B channel detectors in theModel 8502A. The Model 8501A has a single input.
17 Calibrator The CALIBRATOR connection performs an amplitude response calibration of thedetector from -30 dBm to +20 dBm, as well as standardizing the absolute powerlevel readings (see the Self-Calibration Procedure in Section 2.7).
Operation
Manual No. 20790, Rev C, November 1998 2-9Superceded by Revision D, March 2009
2.5 OperationSingle-channel operation is essentially the same dual-channel for standard peak power and CWmeasurements. The single channel 8501A does not have a ratio measurement capability. The followinginstructions define the operation of both instruments. If a Model 8501A is being used, ignore referencesto A and B keys, distinctions between the A and B channels, and reference to two detectors. The singlechannel of the 8501A is channel A for definition purposes. If the instructions require that a distinction bemade between the two instruments, the specific model number will be given rather than PPM.
2.5.1 Power On Self-Test (POST)
1. Before turning on the power to the PPM, be sure that it is set for the correct input voltage.Procedures for setting the operating voltage are given in Section 2.2.
2. Connect a detector (detector) to the DETECTOR INPUT at channel A, using the Giga-tronicsdetector cable (P/N 16956-XXX, where XXX defines the specified length of the cable) suppliedwith the system. If a Model 8502A is to be used, detectors should be connected to channel A andB inputs for dual channel operation.
To connect the cable to the detector housing, pull back on the metal sleeve at the detector end ofthe cable, align the red dots, and make the connection. To connect the other end of the cable tothe front panel DETECTOR INPUT receptacle, again pull back the metal sleeve, align the red dotson the cable and input receptacle, and make the connection.
NOTE: The detector must be connected to the Calibrator connection on the front panel, toa 50-ohm termination, or to a signal source before initiating the POST function.
3. Turn on the power by pressing the power switch on the front panel. The PPM will perform aself-test to verify that it is operating properly.
The self-test is not identical to the one performed by selecting [MENU] (11) [F2], or by sending theSELT command over the GPIB. The POST will not report errors 5 or 6 because you may not haveremoved the RF power from the detectors, or error 10 because it sometimes fails erroneously soon afterpower on (see Self-Test Failure Indications in Section 2.15).
The PPM will automatically return to the last setup before the instrument was powered off.
2.5.2 Warm Up Time and Temperature
When initially operating the PPM, it is common to see a prompt on the display stating
RECAL: dT XXX DEGS-C.
The number of degrees shown is the difference between the present temperature of the detector and thetemperature at which it was last calibrated.
The prompt occurs only if the change in detector temperature is more than 5 °C. When this prompt isdisplayed, sufficient time should be allowed for the instrument to warm up so that accurate readings canbe taken. Variations of less than 5 °C from the calibration temperature do not result in a temperatureprompt display because minor temperature changes in the detector are monitored and compensated by the68000 microprocessor.
If the PPM continues to display the temperature prompt after 30 minutes warm up, or if the roomambient temperature changes by more than 5 °C, a Self-Calibration will be required (see the SelfCalibration Procedures in Section 2.7).
Series 8500A Peak Power Meters
2-10 Manual No. 20790, Rev C, November 1998
Superceded by Revision D, March 2009
2.6 Mode SelectionFollow these procedures to select the desired operating mode. The modes are CW, PEAK and GRAPH.
Throughout this chapter, you will be instructed to press the MENU and MEM keys. The instruction maybe followed by a number in parenthesis. This number corresponds to the menu number and indicates thenumber of times you need to press the key to reach the necessary menu.
2.6.1 CW Mode
If in the Peak or Graph mode, press [CW] to access the CW Mode.
If a menu is being displayed and you want to exit it and go to the CW Mode press [CLEAR] [CW].
If the 8502A is in the Ratio mode, selecting CW will cancel RATIO and the 8502A will display the CWpower of channel A.
In certain instances the option will be given to select the CW Mode if there is some reason that anothermode is not operating properly. For example, if a trigger had not been provided as required in the PeakMode. The purpose is to allow an escape from erroneous modes of operation.
Very few adjustments or menu selections are required to set up the unit for CW measurements. The twomajor settings that must be specified are defined as follows:
Frequency
Press [FREQ] to select the operating frequency at which the power will be measured. Normally, the PPMautomatically adjusts for detector frequency response variations by using the factory measured frequencyresponse data stored in the PROM in the detector housing. Other options are available as detailed inPROM Frequency Correction Section 2.8.2. Not compensating for the frequency response of the detectorcould result in an error in the power measurement reading.
CW Averaging
This setting selects how many samples of the signal being measured will be taken and averaged to reducenoise effects at low power levels. To adjust the averaging number, press [Menu] (2) [F1]. A numberbetween 1 and 999 averages must then be entered. The number of averages presently in effect is notindicated until the averaging menu has been entered.
Low Power Level Measurements
When the PPM is used in the CW mode for power levels below -30 dBm, its dynamic range is extendedto below -40 dBm. Under low power testing conditions it is necessary to observe the correct auto-zeroingprocedures to obtain the highest measurement accuracy. Zeroing should be done more often inenvironments where temperature changes are more drastic. See the Auto-Zero procedures in Section 2.7.3.
2.6.2 Peak Mode
While you are in the CW or Graph Mode, press [PEAK] to access the Peak mode.
If a menu is displayed and you want to exit and go to the Peak mode, press [CLEAR] [PEAK].
After this, follow the trigger setting guidelines given below. Lack of a trigger can freeze the display. Toexit either of these situations either the trigger can be set, or the CW Mode can again be accessed bypressing [CW].
To make measurements in the Peak or Graph Mode, first ensure that the system is receiving a triggersignal that will drive its timebase and crystal-based delay generator. The delay generator accuratelyplaces a sampling window at the desired time on the pulse to be measured. The different triggeringmethods are detailed below.
Operation
Manual No. 20790, Rev C, November 1998 2-11Superceded by Revision D, March 2009
Internal Triggering
The PPM can generate its own internal trigger from the detected RF video envelope at the detectoroutput. This triggering mode requires that the power of the RF pulse be greater than the internal triggerlevel. The trigger level is an adjustable threshold at which the leading rising edge of a pulse will causethe PPM to take a reading. The precise time at which a reading is taken following the trigger isdetermined by the delay generator. This function of the PPM is called Cursor Delay. See the CursorDelay functions in Section 2.8.8.
There are two trigger amplifiers in the PPM, one for the range -20 dBm to -10 dBm and another for therange -10 dBm to +16 dBm. Selecting trigger levels in the lower range (below -10 dBm) can cause thetrigger to be delayed on the order of 100 ns due to the filtering required to improve trigger stability atthese low levels. The absolute accuracy of the trigger level is about ±1/2 dB near the top of these ranges,but degrades to about ±2 dBm near the bottom.
Normally, the Trigger Level is set at -10 dBm (default). The internal trigger level can be adjusted bypressing [MENU] (1) [F1]. A trigger level value between -20 and +16 dBm can then be entered.
If there is no RF pulse present at the detector input or if the pulse amplitude is too low, the PPM will notinternally trigger. When this occurs the display will freeze, the New Data light will not be lit, and theReady light will not be on.
If a Model 8502A is being used, the routine will ask whether internal triggering is to be driven by inputsfrom channel A or channel B. Press the appropriate Detector Select [A] or [B] key. To select the InternalTrigger Mode and set the level press:
8501A: [MENU] (1) [F1] [nn.nn] [UNITS]8502A: [MENU] (1) [F1] [A] (or B) [nn.nn] [UNITS]
(nn.nn = selected trigger level numbers)
Autoscaling changes the internal trigger channel to the displayed channel.
External Triggering
For some test routines it may be desirable to provide an external trigger to the system. This can beespecially useful if the trigger pulse from the external source leads the RF pulse at the detector input by asmall amount of time. Readings can then be taken just prior to the arrival of the RF pulse, allowing closeinspection and measurement of the pulse leading edge.
To use the External Trigger Mode, connect a BNC cable from the TTL sync pulse output of the systemunder test (or pulse generator) to the Ext Trigger input on the rear panel of the PPM. To select theExternal Trigger Mode, press [MENU] [F2]. Correct operation of the External Trigger Mode can beverified by noting that the Ready and New Data lights on the front panel are flashing.
NOTE: If you attempt to operate in the External Trigger Mode without supplying therequired trigger as described above, the display will freeze, the Ready light will be on, andthe New Data light will be out.
To select External Trigger, press [MENU] (1) [F2].
Series 8500A Peak Power Meters
2-12 Manual No. 20790, Rev C, November 1998
Superceded by Revision D, March 2009

2.6.3 Graph Mode
The Graph Mode of the PPM provides graphic capabilities for the display, plotting, and analyses of RFpulse profiles. Most instrument pulse parameters can be set and changed directly from informationpresented in menus. Features are available which allow measurement of commonly required pulseparameters such as rise time, pulse width, and so forth.
When the system is operating satisfactorily in the Peak or Graph Mode, it is possible to toggle back andforth between the two modes by pressing [PEAK] or [GRAPH] whenever desired. The only exception tothis is when an 8502A is being used in the dual channel mode of operation since the Graph Mode doesnot allow dual channel operation. If a dual channel function is being used and it is desired to switch tothe Graph Mode, single channel operation must first be selected. See Dual Channel Operation inSection 2.10.
The ability to toggle back and forth between Peak and Graph Modes is useful for a number of reasons.For example, in the single channel Peak Mode, the display produces large distinct power read-outcharacters that can be read from a distance (see Figure 2-6). In addition, while in the Peak Mode, thecurrent frequency being used for the test is directly visible on the display. In the Graph Mode, the displayis primarily for inspection of the pulse profile and the frequency is not displayed to allow room on thedisplay for other important pulse profile parameters (see Figure 2-7 for a typical Graph Mode display).
All operating parameters such as trigger mode, frequency, and cursor delay are maintained in both thePeak and Graph Modes. The Graph Mode can place the cursor at a specific point on the pulse, and thenthe PEAK key can be pressed to see the power reading using the large readout characters.
Selecting the Graph Mode:
If in the Peak, CW Mode, or Ratio Modes (previous Graph or Peak Mode settings will apply), press[GRAPH]. If a menu is being displayed and you want to exit to the Graph Mode, press [CLEAR][GRAPH]. Then, to Autoscale the pulse, press [AUTOSCALE]
NOTE: While in the Graph Mode, the Autoscale function of the GRAPH key will be active.
Under some conditions, autoscaling cannot take place due to the complex shape of the pulse or othertiming factors. The PPM will then display only a part of the pulse. The reference level will be correct forrectangular pulses. The PPM will not have been able to set an appropriate Delay Window for the pulse. Itmay be possible to subsequently autoscale by changing the initial delay value for autoscaling to be closerto twice the actual pulse width for the pulse in question. This is done by pressing [MENU] (9) [F2][n.nnnn] [UNITS].
To use the Graph Mode, the triggering selection guidelines discussed Section 2.6.2 must be followed.
Operation
Manual No. 20790, Rev C, November 1998 2-13Superceded by Revision D, March 2009
2.7 Self-Calibration and Auto-ZeroingThe purpose of the PPM’s Self-Calibration function is to ensure that measurement accuracy will bemaintained despite changes in detectors, changes in detector diode temperature, or other changes thatmight occur in the PPM’s analog circuits.
During the time the instrument is performing its Self-Calibration routine, the RF output of the 1 GHzcalibrator is accurately stepped from +20 to -30 dBm. Each step is measured by an internal standard and,at each point, the calibrator output power as measured by the RF detector is compared to the standard.The power readings are then digitally adjusted by the PPM microprocessor and stored in memory. Forpower levels below -30 dBm, the system relies on the Auto-Zero function as well as the inherentrepeatability of the detector voltage output versus input power at these levels. (Refer to Section 4.2.7 fora complete description of the automatic calibration system.)
To make any type of power measurements with the PPM it will be necessary to use the appropriatecalibration and zeroing procedures to ensure the highest accuracy.
After the instrument has warmed up for 30 minutes and the mode of operation has been selected, adetector self-calibration should be performed. In addition, if the ambient room temperature changes morethan 5 °C from the temperature at which the system was last calibrated, self-calibration should also bedone. If there has been a change in the temperature of the detector of more than 5 °C since it was lastcalibrated, the difference will be shown.
2.7.1 Self-Calibration Procedure
Connect the channel A detector to the 1 GHz Calibrator output. Press [MENU] [F3] to call up the Cal orZero Detectors menu. The menu offers the following choices:
• F1 to Calibrate the Detectors
• F2 to Auto-Zero the Detectors
• F3 to Return to Data Display
Select F1 for the Detector Self-Calibration.
NOTE: The CLEAR key as well as F3, can also be used to return to data display.
The display will show the last date and time the detector was calibrated. To proceed with the calibration,press any Units key. The Self-Cal process takes about 50 seconds, during which time the statement
A (or B) CALIBRATION IN PROGRESS
will be displayed.
If a Model 8501A is in use, press [CLEAR] to return the routine to the data display (the last mode ofoperation). If the Model 8502A is being used, press [CLEAR] to bypass the channel A calibration and goto the channel B calibration.
After successful completion of the Self-Cal function, the instrument will go back to displaying data in thelast mode of operation. With the Model 8502A, either bypassing or successfully completing the channelA calibration will take the routine to the channel B calibration.
Channel B calibration is done in the same manner as the channel A calibration. The date and time of thelast B channel calibration will be presented, and the option will be given to either press any Units key tostart the cal procedure or press [CLEAR] to return to the data display.
Series 8500A Peak Power Meters
2-14 Manual No. 20790, Rev C, November 1998
Superceded by Revision D, March 2009
2.7.2 Self-Calibration Failures
In the event of a malfunction such as a burned out detector diode or if you forget to connect the detectorto the calibrator, the Self-Cal function will fail. If this occurs, the following error menu will be displayed:
A Calibration Error ExistsPress [CLEAR] to continuePress any Units key to repeat cal
Press [CLEAR] to return the instrument to the last mode of operation.
Selecting any Units key gives you the opportunity to correct a simple error such as not connecting thedetector to the calibrator. This can be accomplished, and then the Self-Cal procedure can be repeated.
See Input/Output & Calibration Failure descriptions in Section 6.3.2 for the procedure to follow if thePPM fails the Self-Cal.
2.7.3 Auto-Zero Function
To initiate the Auto-Zero function, turn off the RF power to the detector to be zeroed and then press[MENU] [F3] to get to the Self-Cal/Auto-Zero menu. Then press [F2] to Auto-Zero and follow thedisplayed prompts.
If the Model 8502A is in use, channel A must be auto-zeroed before channel B. If desired, channel A canbe bypassed by pressing [CLEAR] and going directly to channel B.
Operation
Manual No. 20790, Rev C, November 1998 2-15Superceded by Revision D, March 2009
2.8 Measurement Procedures
2.8.1 Frequency Correction, Cal Factor, and dB Offset
The Frequency Correction and Offset functions enhance measurement accuracy, and compensate fordetector amplitude and frequency response variations as well as devices residual to the test setup.
Frequency correction is selected in Menu-3. Three methods of frequency correction are available and willbe described in detail in this section. These are:
• PROM Table — User Supplied Frequency (default mode).
• PROM Table — External Frequency Input (uses the V α F output of the sweeper)
• User Supplied Calibration Factor — (allows direct entry in dB)
To select the desired mode, press [MENU] (3) [F3].
Then select F1, F2, or F3 respectively, for items a, b, or c. This will determine the functioning of theFREQ key of the instrument.
Whenever a mode is selected that uses the PROM table in the detector assembly for frequency correction,the PPM will interpolate between the discrete amplitude correction points stored in the detector PROM.This allows entry of frequencies other than those stored in the PROM, and reduces the need for operatorinterpretation and manual correction of power readings.
All of the information stored in the PROM of the detector currently in use can be reviewed by accessingMenu-10 and pressing [F2] for channel A, and/or [F3] for channel B.
2.8.2 PROM Frequency Correction
User-Supplied Frequency
This is the User-Supplied Frequency mode. It is the default mode of the instrument. Factory measuredfrequency correction data is stored in a PROM inside the detector housing, thus eliminating the need foryou to refer to a frequency correction chart and then make manual adjustments to the system for eachdiscrete frequency point. The PROM data is used by the PPM to correct for all of the detector’samplitude variations across its entire frequency range. When the system is first turned on, the PROM datastored in the detector is transferred to the main memory of the PPM.
To select the PROM Table - User Supplied Frequency mode, press [MENU] (3) [F3] [F1].
The display will then prompt for the frequency of operation to be entered. The default frequency is1 GHz, the same as that of the Calibrator. Press any Units key to complete the entry.
After selecting the PROM Table - User Supplied Frequency mode, use of the FREQ key allows entry ofthe carrier frequency and gives the microprocessor the ability to correct any detector frequency responsedeviations.
External Frequency
The purpose of the PROM Table - External Frequency input function is to allow entry of the operatingfrequency by means of an externally applied voltage. The voltage level will be proportional to thefrequency, and will be used by the PPM to correct power readings for detector frequency response.
When this function is active, the RF frequency of a sweep generator or signal source can be changed andthe PPM will convert the analog voltage input (through the rear panel FREQ Input connection) to adigital representation of the frequency. The PPM’s microprocessor uses this information to correct powerreadings according to the frequency correction table stored in the detector’s PROM.
Series 8500A Peak Power Meters
2-16 Manual No. 20790, Rev C, November 1998
Superceded by Revision D, March 2009
If the sweep generator (sweeper) is equipped with a rear panel output providing frequency information,this information will usually consist of an analog voltage proportional to the RF frequency output of thesweeper at any given time. Some sweeper manufacturers refer to this voltage as Frequency Reference,Volts/GHz (V/GHz), or Voltage-Proportional-to-Frequency (VpropF or V α F). The most commoncoefficients for this output are 1V/GHz and 0.5V/GHz.
Once the VpropF frequency correction function has been activated, the FREQ key can change theparameters for use by the VpropF function.
To activate the VpropF frequency correction function, perform the following:
1. Connect a BNC cable from the V/GHz output of the sweeper to the Frequency Input on the rearof the PPM.
2. Press [MENU] (3) [F3] [F2].
3. The instrument will then ask for the sweeper V/GHz value (normally 1 or 0.5). Press [n.n][UNITS] (where n.n is volts and UNITS is any units key).
4. The Sweeper Start Voltage is required next. If the sweeper frequency range is from 2 to 18 GHzand the sweeper V/GHz coefficient is 0.5V/GHz, then this value would normally be 2 x 0.5 = 1.Press any Units key to complete this entry.
The above steps set the frequency scaling factor for the PPM so that the analog voltage coming in fromthe FREQUENCY INPUT connection can be interpreted to the correct frequency by the PPM’smicroprocessor.
2.8.3 User-Supplied Cal Factor
If you prefer to use your own detector frequency response correction factors, the PPM provides a meansto manually correct for any detector frequency response variations (in dB). An example of when thiscould be necessary is if the data stored in the detector’s PROM might be out of date.
To activate the Cal Factor feature of the system, press [MENU] (3) [F3] [F3].
If the dual channel 8502A is being used, you will be asked to select a channel. Select A or B asappropriate.
Next, the value of the desired Cal Factor must be entered in dB. Complete the entry by pressing anyUnits key.
When using the Cal Factor mode, the frequency of operation is unknown to the PPM. Therefore, the CalFactor will be shown on the display instead of Frequency. This also serves to notify you that this mode isin effect. The readout will display the Cal Factor as CF = nn.nn dB.
NOTE: In the Cal Factor mode of operation the FREQ key alters the Cal Factor (dB), notthe frequency.
Offset
The Offset feature of the instrument digitally offsets the displayed power value within a range of -40 to+90 dB. The offset will be in effect whether the measurement is in dBm or linear power in milliwatts.
The Offset function is useful for two main purposes. (1) It provides the ability to add or subtract minorcorrection factors to correct errors that might be introduced by attenuators or other devices in the testsetup, and (2) It provides the ability to adjust the reading in high power measurement situations where itis desirable to read the correct power directly on the display despite the fact that the unattenuated powerbeing tested is well above the measurement range of the detectors.
Operation
Manual No. 20790, Rev C, November 1998 2-17Superceded by Revision D, March 2009

In the latter case, a high power coupler is required to attenuate the signal to a level that can be safelymeasured by the detectors (less than +20 dBm). If the exact coupling factor of the coupler being used isknown, the Offset feature can then be used to subtract it out. Then the display will accurately show thehigh power present at the device under test. However, the detectors only see the coupled power which hasbeen attenuated to avoid burning out the detector diode.
To offset the displayed power reading, press
8501A: [MENU] (3) [F1]8502A: [MENU] (3) [F1] (ch A) or [F2] (ch B).
After the Offset function has been selected, enter the desired offset in dB and then press any Units key.
When the Offset function has been activated, an asterisk (*) will appear next to the FREQ indication inthe display to indicate that an offset is in use. (If the Cal Factor function is in use, the asterisk will benext to the CF indication.)
The display will appear as:
*FREQ = nn.nGHz or *CF = n.nndB
2.8.4 CW Power Measurement
To make a CW measurement be sure that the PPM has warmed up for at least 30 minutes, and thenperform the following steps:
1. Select the CW Mode as described in Section 2.6.1.
2. Self-Calibrate the PPM as described in Section 2.7.
3. Determine that the power range to be measured will not exceed the maximum power capabilityof the instrument (less than +23 dBm). If it will, connect an attenuator or coupler to the outputof the device under test to bring the power down into the range of the PPM, and use theattenuator or coupler output as the measurement point for the detector attachment. If in doubt,use a 10 dB attenuator. This should prevent a mild overload that might result only in detectordegradation rather than burn out.
4. Be sure the RF power of the source is completely OFF.
5. Connect the detector to the power source being measured.
6. Auto-Zero the detector by pressing [MENU] (1) [F3] [F2] [UNITS], or, if only channel B of aModel 8502A is to be zeroed, press [MENU] (1) [F3] [F2] [CLEAR] [UNITS].
A beep indicates that a successful auto-zero has been accomplished. A double beep indicateseither there was RF power present at the detector input or there could be a failure. If a failure issuspected, then run the Self-Test procedure in Section 2.15.
7. Upon successful completion of the auto-zero function, turn on the RF power of the source to bemeasured.
8. Take into account the detector frequency response so that an accurate reading can be made at thefrequency of operation. If the External Frequency mode (i.e. PROM Table and Sweeper BackPanel) is being used, this step is unnecessary. (See PROM Frequency Correction inSection 2.8.2). The keystrokes are [FREQ] [nn.nn] [GHz]
If the PPM is in the PROM Table - User Supplied Frequency mode, nn.nn is the CarrierFrequency in GHz. If the PPM is in the User Supplied Calibration Factor mode, nn.nn is the CalFactor in dB.
9. If a coupler or attenuator is being used at the detector input, enter the attenuation value as apositive offset. For example, if an attenuator with a value of 30.2 dB at the frequency of
Series 8500A Peak Power Meters
2-18 Manual No. 20790, Rev C, November 1998
Superceded by Revision D, March 2009

operation were being used, the required offset would be entered as follows:
8501A: [MENU] (3) [F1]8502A: [MENU] (3) [F1] (ch A) or [F2] (ch B).
10. Enter the value of the offset in dB, followed by the dB Units key:
[30.2] [dB]
The PPM will now be reading CW power, and the display will look something like:
A: +35.26 dBm*FREQ=10.78 GHz CW
NOTE: +35.26 dBm represents the power at the input of the attenuator which is connectedto the detector input. The actual power at the detector input would be +35.26 - 30.2 =+5.06 dBm.
11. Select the number of samples to be taken to arrive at an average reading (default is 4 readings).Press [MENU] (2) [F1].
12. Enter the desired number followed by pressing any Units key. The number of samples that can betaken to arrive at an average can be between 1 and 999. For power levels below -30 dBm, it isrecommended that more than 100 samples be taken to reduce noise effects.
13. To change the displayed power reading from dBm to milliwatts or vice versa, press [MENU] (4) [F3].
2.8.5 Peak Power Measurement
Method 1: Peak Mode via Graph Autoscale
There are several methods that can be used to make Peak Power measurements with the system. Theeasiest method is to use the Autoscaling function in the Graph Mode. The Autoscaling function onlyoperates on pulses greater than the selected trigger level. Complex pulse shapes such as double pulsescannot always be successfully autoscaled. Methods for these situations will be covered later.
After the pulse to be measured has been successfully autoscaled, it is only necessary to press [PEAK] andthe system will read the power at the center point of the pulse. The readout will be displayed in largealphanumeric characters. For the following procedure, assume that either a single channel Model 8501Ais being used or just channel A or channel B of the dual channel 8502A.
Autoscaling Procedure - Internal Trigger
1. Connect the detector(s) to the PPM and allow it to warm up for 30 minutes. Then conduct theSelf-Cal procedure as described in Section 2.7.
2. When Self-Cal has completed, connect the channel A (or B) detector input to a pulsed signalgreater than -10 dBm (the default trigger level). Press [GRAPH] to select the Graph Mode, andthen press it again to start the Autoscaling function.
When the Autoscaling function is initiated the PPM will change to internal triggering off of thedisplayed channel. Then it will attempt to automatically select the correct Window Delay timeand Reference Power which will center the pulse on the display. The Start Delay will be set tozero. If the signal at the detector RF input is less than the trigger level (or there is no pulsepresent at the input), then the system will not trigger and the following display will appear:
Operation
Manual No. 20790, Rev C, November 1998 2-19Superceded by Revision D, March 2009

Waiting for trigger on A (or B) Detector SignalF1 for Trig Mode or Level ChangeF3 for CW Data Display
If you still desire to Autoscale at this point, the easiest thing to do is to increase the RF poweruntil the power at the detector input is greater than the trigger level. Then the system will start totrigger and the autoscaling process will begin.
The factory-set default initial delay is 75 µs (pulses wider than 75 µs or pulses less than 75 µsapart cannot be Autoscaled when using the default setting), and the default pulse averaging isfour samples for the Autoscaling function. This can be changed to allow the user to enter adifferent pulse width and averaging number by accessing Menu-9 (press the MENU key 9 times),and then following the prompts given in that menu. Once the pulse width and/or pulse averaginghas been changed from the default setting, the values will remain at the new setting whenever theinstrument is turned off and on again. The values are not affected by recalling set-ups, nor atpower-on.
3. If the previous triggering requirements have been met, the PPM will display the statement,
AUTOSCALING IN PROGRESS
4. When the Autoscaling has successfully completed, the pulse profile will be centered in thegraphics display area on the left side of the window and the top of the pulse will line up with the100% tic mark. The Cursor (displayed as a vertical line with spaces just above and below thepoint where it crosses the pulse) will be located at the center of the pulse profile. If all of theabove has occurred, you can go to the Power Display instructions given below.
Due to the many varieties of pulse widths, pulse shapes, and duty cycles that might be encountered, it isnot always possible for the PPM to autoscale. If the failure to autoscale is the result of a pulse beingpresent at the 75 µs default setting, the setting can be changed by accessing Menu-9, making the change,and then repeating the autoscaling procedure detailed in this section. It is necessary to keep the initialdelay less than the time from the trigger to the start of the second pulse since the Autoscale routinecannot handle multiple pulses in the delay window.
Autoscaling Procedure - External Trigger
When pulses are autoscaled on an external trigger, the PPM uses the internal trigger level of the selecteddetector to find the pulse. For this reason, the internal trigger level of the selected detector must be lowerthan the maximum power of the pulse. A good test is to first select internal trigger and verify that thePPM is triggering before trying external trigger autoscaling.
The external triggered autoscale will set the Start Delay to center the pulse in the delay window.However, autoscaling may not work properly if the pre-trigger is more than ten times the pulse width.
1. Press [PEAK]. The PPM will now display the power reading at the Cursor location in largealphanumeric characters, similar to the display shown in Figure 2-6. The statement
DLY = n.nnn µs
will be at the bottom of the display. This is the Cursor Delay which indicates the time differencebetween the pulse’s initial triggering point and the point where the reading was taken. If thetriggering method is changed, a given Cursor Delay does not necessarily guarantee that thepower reading will be taken at exactly the same point on the pulse as it was before.
Series 8500A Peak Power Meters
2-20 Manual No. 20790, Rev C, November 1998
Superceded by Revision D, March 2009
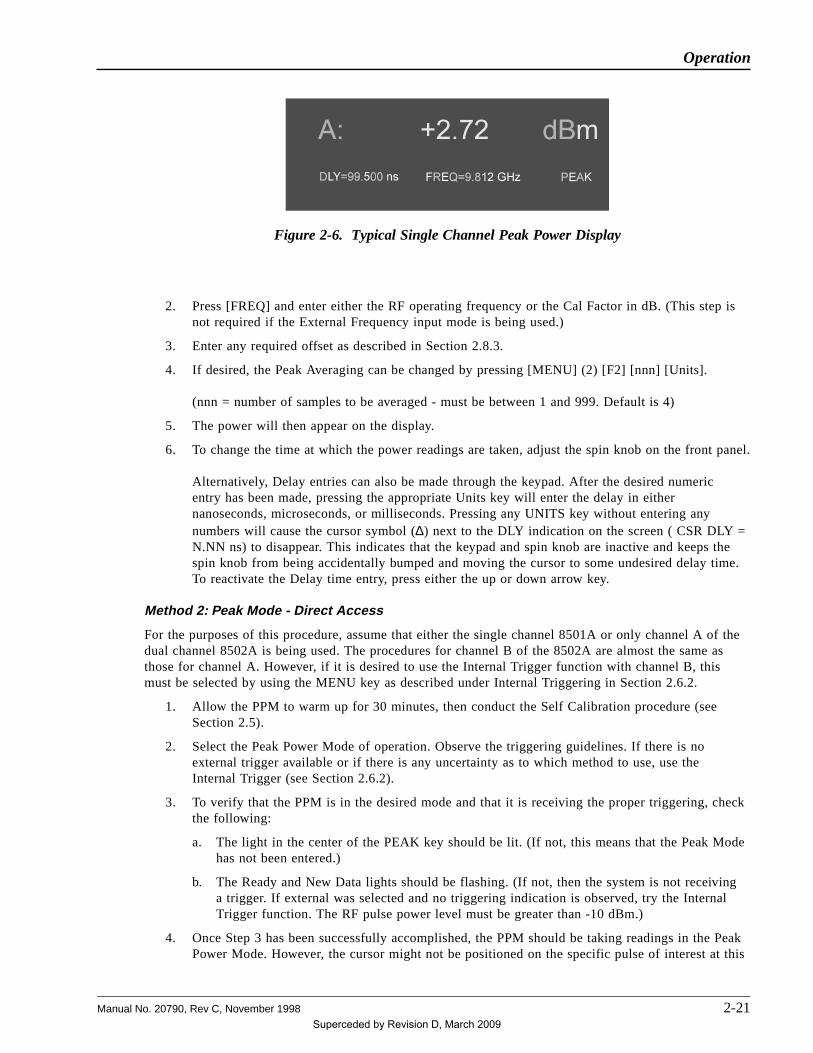
2. Press [FREQ] and enter either the RF operating frequency or the Cal Factor in dB. (This step isnot required if the External Frequency input mode is being used.)
3. Enter any required offset as described in Section 2.8.3.
4. If desired, the Peak Averaging can be changed by pressing [MENU] (2) [F2] [nnn] [Units].
(nnn = number of samples to be averaged - must be between 1 and 999. Default is 4)
5. The power will then appear on the display.
6. To change the time at which the power readings are taken, adjust the spin knob on the front panel.
Alternatively, Delay entries can also be made through the keypad. After the desired numericentry has been made, pressing the appropriate Units key will enter the delay in eithernanoseconds, microseconds, or milliseconds. Pressing any UNITS key without entering anynumbers will cause the cursor symbol (∆) next to the DLY indication on the screen ( CSR DLY =N.NN ns) to disappear. This indicates that the keypad and spin knob are inactive and keeps thespin knob from being accidentally bumped and moving the cursor to some undesired delay time.To reactivate the Delay time entry, press either the up or down arrow key.
Method 2: Peak Mode - Direct Access
For the purposes of this procedure, assume that either the single channel 8501A or only channel A of thedual channel 8502A is being used. The procedures for channel B of the 8502A are almost the same asthose for channel A. However, if it is desired to use the Internal Trigger function with channel B, thismust be selected by using the MENU key as described under Internal Triggering in Section 2.6.2.
1. Allow the PPM to warm up for 30 minutes, then conduct the Self Calibration procedure (seeSection 2.5).
2. Select the Peak Power Mode of operation. Observe the triggering guidelines. If there is noexternal trigger available or if there is any uncertainty as to which method to use, use theInternal Trigger (see Section 2.6.2).
3. To verify that the PPM is in the desired mode and that it is receiving the proper triggering, checkthe following:
a. The light in the center of the PEAK key should be lit. (If not, this means that the Peak Modehas not been entered.)
b. The Ready and New Data lights should be flashing. (If not, then the system is not receivinga trigger. If external was selected and no triggering indication is observed, try the InternalTrigger function. The RF pulse power level must be greater than -10 dBm.)
4. Once Step 3 has been successfully accomplished, the PPM should be taking readings in the PeakPower Mode. However, the cursor might not be positioned on the specific pulse of interest at this
Figure 2-6. Typical Single Channel Peak Power Display
Operation
Manual No. 20790, Rev C, November 1998 2-21Superceded by Revision D, March 2009

time.
The easiest way to ensure that all of the Peak Mode settings are at their default values is toselect Peak operation after initializing the current setup. Press [MEM] (3) [F1] [PEAK]. Thedisplay should be similar to Figure 2-6.
A display of hyphens in place of a number in the power read-out portion of the display indicatesthat the power being sampled is below the measurement range of the system. Either the overallpower of the pulse is too low, or the cursor has not been placed on a sufficiently high poweredsection of the pulse of interest. Another possibility could be no RF present. However, in thiscase, the PPM would not be triggering if Internal Triggering were being used and there was notenough RF at the detector input.)
NOTE: If the External Trigger mode is being used, the likelihood of obtaining a meaningfulpower reading at this point depends on the timing relationship between the RF pulse at thedetector input and the external trigger pulse coming in through the rear panel inputconnection of the instrument.
If the trigger pulse and the RF pulse are coincident in time, then the default Cursor Delay timeof 1 µs will probably result in the Cursor being located somewhere on the pulse. This dependson the pulse width exceeding 1 µs.
It is recommended that Internal Trigger is used before using the External Trigger mode so thatpulse information such as pulse width can be obtained. This can save the effort of having tosearch for the pulse using the Cursor Delay function — Using the Graph Mode makes searchingmuch easier.
5. As already mentioned, the cursor (∆ symbol) next to the DLY indication on the display meansthat the spin knob is active and, if turned, will alter the value of the Cursor Delay (CSR DLY).To locate the highest power point on the pulse, it is best to start at the rising edge of the pulseand move the cursor gradually up in time until the power reading reaches its maximum point.This can be done as follows:
a. Turn the spin knob counter clockwise until the Cursor Delay is zero (i.e. DLY = 0.000 ns onthe display).
b. Slowly rotate the spin knob clockwise while monitoring the power readout display. Note thatthe increments that the spin knob causes the DLY to step through will change faster as theknob is turned faster. Rotate the knob until the power readings increase. This indicates thatthe leading edge of the measured pulse being is being monitored.
c. Continue increasing the Cursor Delay until the power readings go through a peak or stay at ahigh level. If the maximum power point is passed, turn the knob counterclockwise slowly,thus reducing the cursor delay until the maximum reading is once again reached.
d. Press [FREQ] and enter either the desired RF operating frequency or the Cal Factor in dB asrequired. (This step is not necessary if the external frequency input mode is in use.)
e. Enter any required dB Offset (see Section 2.6.2).
f. The power will be displayed similar to Figure 2-6. The desired unit of power measurementcan be selected by pressing [dB/mW].
6. If difficulties arise in locating the pulse to be measured, use the Graph Mode with Autoscale.
Series 8500A Peak Power Meters
2-22 Manual No. 20790, Rev C, November 1998
Superceded by Revision D, March 2009

2.8.6 Peak Power Measurements Using the Graph Mode
It is recommended that you read the basic information pertaining to the Graph Mode in Section 2.6.3 fora better understanding of this function. The initial Graph Mode (Cursor sub-mode) display lookssomething like that shown in Figure 2-7. Pulse profiles are shown graphically on the left side of thedisplay while the right side displays the power and timing parameters pertinent to the pulse.
To use the Graph Mode for peak power measurements, follow the instructions given next for accessingthe Graph Mode:
1. Connect the detector(s) to the detector connection(s) on the front panel, and allow the system towarm up for 30 minutes. Then conduct a Self Cal as described in Section 2.7.
2. After ensuring that the pulse power of the RF source to be measured is not high enough to causedamage to the detectors (limit to less than +20 dBm), connect the channel A detector to thesource.
3. Select the Graph Mode of operation by pressing [GRAPH]. Press [AUTOSCALE] and the PPMwill attempt to autoscale the pulse on the display. If there is no pulse present at the detectorinput or if the pulse power is below -10 dBm, then the PPM will not trigger (the New Data lightwill be out).
While the PPM is Autoscaling, the display will indicate Autoscaling in Progress. When autoscaling iscomplete, the pulse will be centered in the graphics area of the display and the vertical cursor will bepositioned at the center of the pulse profile.
If the display does not indicate a pulse centered in the graphics area of the display with the verticalcursor positioned at the center of the pulse profile, then the autoscaling process was not successful.
One possible reason that the PPM might not be able to autoscale is that the RF pulse might be too wide.The default setting of the PPM for the maximum pulse width that can be autoscaled is 75 µs. If desired,this maximum setting can be changed by pressing [MENU] (9) [F2].
2.8.7 Pulse, Cursor, and Marker Readouts
On the 8500A, the Graph display mode has been enhanced to: 1) Simplify entry of timebase, triggering,and display scaling (CURSOR sub-mode), 2) Allow automatic readout of rise time, fall time, and pulsewidth (PULSE parameter sub-mode), and 3) Allow automatic readout of time differences between custommarker settings on the pulse (MARKER sub-mode).
These three functions can be accessed by pressing [PULSE/CURSOR/MARKER] to cycle the displaythrough the three sub-modes.
Figure 2-7. Typical Initial Graph Mode Display
Operation
Manual No. 20790, Rev C, November 1998 2-23Superceded by Revision D, March 2009

2.8.8 Cursor Sub-Mode Functions
The Cursor sub-mode is convenient for changing the timebase parameters of the display (the CurSoRDeLaY, the STaRT DeLaY, and the DeLaY WINDow), the scaling of the display (the REFerence PoWeR),and the trigger level if the PPM is in internal trigger mode.
CSR PWR
Indicates the power level at the location of the cursor. By pressing [MENU] (4) [F3], this can beindicated in either dBm or in Watts. This is a read-only function, and cannot be changed with the spinknob or numeric entry keypad. Placing the cursor here will prevent an accidental movement of the spinknob from changing a parameter.
CSR DLY
The Cursor Delay indication shows the amount of time after triggering has occurred that the Cursor willsample the power of the pulse. The time at which the trigger occurs is dependent on either the TriggerLevel or, if External Triggering has been activated, on the triggering signal provided by the externalsource. The delta symbol next to CSR DLY means that the Cursor Delay is adjustable by using either thespin knob or the keypad. The cursor is placed by using either the up or down arrow key.
STRT DLY
This is the Start Delay of the graphics display area on the readout. It signifies the amount of timebetween the occurrence of the trigger and when readings begin at the left side of the graphics display. Ifthe default value is still set, then the Start Delay would be set to 0.0000 ns and the left edge of thedisplay will be coincident with the timing of the trigger. However, the Start Delay may be at whatevervalue was used the last time the Graph Mode was accessed. The cursor next to STRT DLY means that thespin knob or keypad can be used to adjust the Start Delay value.
DLY WIND
The Delay Window is the amount of time between the left and right sides of the graphics display area.The default value is 10.000 µs. When the Autoscale function is used, the PPM will adjust the DelayWindow to display the pulse profile so that the trailing edge of the pulse can be seen. Autoscaling will
Figure 2-8. Typical Cursor Sub-Mode Digital Plot
Series 8500A Peak Power Meters
2-24 Manual No. 20790, Rev C, November 1998
Superceded by Revision D, March 2009

decrease the Delay Window in a 1, 2, 5 sequence as required until the trailing edge no longer disappearsfrom view off of the right side of the graphics area. The cursor next to DLY WIND means that the spinknob or keypad can be used to adjust the Delay Window value.
REF PWR
The PPM’s Reference Power nomenclature refers to the manner in which the pulse profile is displayed.Referring to the graphics area of Figure 2-7, there are four horizontal tic (division) marks on the leftvertical axis of the display. These tic marks correspond from top to bottom to the 100%, 90%, 50%, and10% power points on the pulse profile with respect to the Reference Power. The pulse profile is alwaysdisplayed in linear units. The default Reference Power is 1 mW. However, once the Autoscale functionhas been used, the Reference Power is automatically adjusted to whatever the power level is at the middleof the pulse. Therefore, the Autoscale feature not only serves to center the pulse on the time (orhorizontal) axis, it also optimizes the display positioning on the power (or vertical) axis by setting thehighest power level as the 100% Reference point.
The adjustable Reference Power level is provided to give the user flexibility in displaying the pulse, andmeasuring pulse timing parameters using the markers. This is important because it means that the PPMcan be set up to accommodate the various types of test parameters that different users might need fortheir specific measurement requirements.
NOTE: The reference power level is used as the 100% power level in the marker sub-mode, but is notused in the cursor or pulse parameter sub-modes. See the descriptions of marker sub-mode inSection 2.8.10 and cursor sub-mode in Section 2.8.8 for a more detailed explanation.
There are two ways to set the Reference Power Level on the PPM.
The first way is to move the cursor to the REF PWR (next to last) line of the displayed parameters (useeither the up or down arrow key). Then, enter the desired Reference Power level and press the appropriateUnits key (dBm for logarithmic units; mW, W, or kW for linear units).
The second way is to move the cursor to the CSR DLY line and move the cursor to the point on thedisplayed pulse profile that is desired to be 100% reference. Next, move the cursor to the REF PWR lineof the display. Then pressing any Units key will shift the pulse vertically on the screen, resulting in theselected point lining up with the 100% tic mark on the display.
Reference Power cannot be changed with the spin knob.
TRIGGER
This display indicates the present triggering mode of the PPM. TRIG LEV = -10 dBm (A TRIG =-10 dBm in the 8502A) is the default setting. It means that the PPM will trigger when the leading edge ofthe RF pulse rises above -10 dBm at the (channel A) detector input. B TRIG = (8502A only) indicatesthat the PPM is triggering off the channel B detector.
To change the Trigger Level, use either the up or down arrow key to move the cursor beside the TRIGLEV indication. The spin knob can then be used to alter the Trigger Level, or a desired number can beentered through the keypad and terminated with the dBm or mW key.
EXTERNAL means that the PPM is triggering off the TTL trigger input on the back panel regardless ofwhich channel is being displayed.
Selecting External Trigger or changing the internal trigger channel is accessed through Menu-1. SeeTriggering in Section 2.6.2.
Operation
Manual No. 20790, Rev C, November 1998 2-25Superceded by Revision D, March 2009

2.8.9 Pulse Parameters Sub-Mode Functions
Commonly used timing measurements required when analyzing pulsed RF/microwave signals are:
• Pulse Width
• Rise time
• Fall time
• Peak Power
• Repetition Rate
The pulse parameter readout allows the first four of these parameters to be measured directly by the PPMand displayed on the readout window. Auxiliary equipment may sometimes be required to measurerepetition rate.
While in the GRAPH Mode, the Pulse sub-mode routine is entered by pressing[PULSE/CURSOR/MARKER].
Pulse Rise Time, Width, and Fall Time
The PPM displays the time between three pairs of start and stop power percentages. The default valuesfor start and stop percentages are:
Measurement Start % Stop %
Rise time 10% rising edge 90% rising edge
Fall time 90% falling edge 10% falling edge
Pulse Width 50% rising edge 50% falling edge
These parameters can be set or changed as follows:
1. Press [PULSE/CURSOR/MARKER] to display the pulse parameters.
2. Move the cursor (using either the up or down arrow key) to the Pulse Width line on the display.The current Start % setting will be displayed.
Figure 2-9. Typical Pulse Sub-Mode Digital Plot
Series 8500A Peak Power Meters
2-26 Manual No. 20790, Rev C, November 1998
Superceded by Revision D, March 2009
3. The last line of the display will show the prompt:
Enter Start %.
4. Enter the desired Start % setting through the numeric keypad.
5. Press [UNITS].
6. The Enter Start % indication will change to:
Enter End %.
7. Enter the desired End % value and press [UNITS].
(Repeated pressing of any Units key will toggle the display between the Start and End values.)
8. To change the start and stop percentages for rise and fall times, move the cursor to theappropriate line and repeat Steps 3 through 7.
The relationship of 10% to 90% rise or fall time equals 2.198 time constants for a single polecircuit. Similarly, a 10% to 90% power rise or fall time equals 1.098 time constants.
For some applications it is desirable to measure rise, fall, and width in terms of the voltagewaveform instead of the power waveform. This can be done by simply modifying the appropriatestart and stop percentages. The power waveform is proportional to the square of the voltagewaveform. Therefore, to measure the voltage pulse parameters you would change the defaultpercentages to the following:
Measurement Start % Stop %
Rise time 1% rising edge 81% rising edge
Fall time 81% falling edge 1% falling edge
Width 25% rising edge 25% falling edge
The pulse rise time, fall time, and width are displayed with the appropriate time units. A displayconsisting of all dashes indicates that:
a. the instrument failed to find the peak power point, or
b. the instrument failed to find a start percentage point, or
c. the instrument failed to find a stop percentage point.
The method used to find pulse parameters is as follows. On each trace sweep, the instrument:
A. finds the 100% pulse level. Starting from the trailing edge of the pulse, the instrument looks earlierand finds the largest flat section (±1 pixel on the screen) on the top of the pulse. This level is chosenas the 100% level. If no area is flat, (such as with gaussian shaped pulses) the maximum level foundis used as the 100% level. This algorithm helps ignore the ringing and overshoot that sometimesaccompanies rectangular pulses. Note that the display scaling (i.e., the REFerence PoWeR) is notreset and is independent of the 100% level found in this step.
B. finds the rise time, fall time and width of the pulse. In order to improve the accuracy of timingmeasurements. You should set the delay window so that the pulse fills at least 20% of the screen.
Operation
Manual No. 20790, Rev C, November 1998 2-27Superceded by Revision D, March 2009

2.8.10 Marker Sub-Mode Functions
The Marker sub-mode is another completely independent way to read the time difference between userdefined points on the pulse waveform. It may, at first, seem redundant with the Pulse parameter mode.The Marker sub-mode, however, treats the 100% power point differently, and reads the differencesbetween four user-defined points on the waveform. It is intended for use in specialized applications (suchas measuring the linearity of the leading edge skirt of a navigation pulse) where the user is interested insomething other than standard rise, fall, and width measurements. This Marker sub-mode is also mostsimilar to the Marker Mode offered in the original 8500 Peak Power Meter.
The Marker sub-mode uses the user-set REFerence PoWeR as the 100% power point of the pulse. Thisallows the user to set the 100% point at other than the flat spot at the top of the pulse. For instance, the100% point can be set at the top of the pulse overshoot. The 100% point can also be set 10 dB lower thanthe top of the pulse to scale all the user-set marker percentages by 1/10. This is particularly useful to setmarker percentages to resolutions better than 0.1% of the peak power.
The default settings for marker sub-mode are set for the measurement of linearity on the leading edge ofa navigation pulse. In this particular measurement, the time between the 5%, 13.3%, 21.7%, and 30%points on the voltage waveform are compared. Equal times indicate a linear voltage waveform betweenthe 5% and 30% point on the waveform. Because markers are entered in terms of % power, thecorresponding power percentages would be 0.25%, 1.78%, 4.69%, and 9.00%. Because markers can onlybe entered to 0.1% resolution, the actual marker values are set 10 times greater or 2.5%, 17.8%, 46.9%and 90.0%. Then, to get the maximum resolution from the markers the REFerence PoWeR is set toexactly 10 dB less than the peak power of the pulse, effectively scaling all marker values by 1/10. (Thisaction must be done manually.)
To change a marker percentage setting:
1. In GRAPH mode, press [PULSE/CURSOR/MARKER] until you see a display on the right sideof the screen similar to:
∆CSR PWR = +0.91 dBmMKR 2 - 1 = 4.9000 nsMKR 3 - 2 = 5.4000 nsMKR 4 - 3 = 10.5000 ns
Figure 2-10. Typical Marker Sub-Mode Digital Plot
Series 8500A Peak Power Meters
2-28 Manual No. 20790, Rev C, November 1998
Superceded by Revision D, March 2009

2. Move the cursor (using the up or down arrow keys) to the MKR 2-1= line on the display. Thecurrent marker percentage setting for marker 1 will be displayed.
3. Enter the desired Marker 1 percentage through the numeric keypad, using any Units key toterminate the entry.
4. Repeat steps 2 and 3 at the MKR 3-2 = line to change the Marker 2 percentage, and the MKR4-3 = line to change the Marker 3 percentage. To change the Marker 4 percentage, move thecursor to the blank line just below the MKR 4-3 = line.
Operation
Manual No. 20790, Rev C, November 1998 2-29Superceded by Revision D, March 2009

2.9 Digital Plotting of Graphic Data
2.9.1 Plotters Supported
The PPM is configured to provide direct output of Graph Mode information for hardcopy recording on adigital plotter. This is done without the necessity of using a computer or GPIB controller. The followingplotters (and any other 100% compatible plotters) are supported:
Hewlett-Packard Model 7440A
Hewlett-Packard Model 7470A
Hewlett-Packard Model 7475A
All of the above plotters must be configured with the option for GPIB usage.
2.9.2 Procedure for Making Plots
The procedure for making plots with the PPM is quite simple. Plots can be made when in the GraphMode and Marker sub-mode, and the plots will be essentially duplications of the information shown onthe PPM display at the time the plot function is activated.
Two different plotting speeds can be selected by the PPM. These are: a Fast Plot for use with normalplotting paper, and a Slow Plot for making plots using transparent paper (film).
To make a (fast) paper plot, press [MENU] (2) [F3] [F1]
To make a (slow) transparency plot, press [MENU] (2) [F3] [F2].
When the PPM has drawn a complete pulse profile on its display, it is ready to act as a GPIB controller.If the PPM is part of a GPIB system, it is up to the user to be sure that no front panel plot function isinitiated to ensure correct operation of the system.
The following steps are required to generate an X-Y hardcopy plot:
1. Connect a GPIB cable from the PPM’s rear panel GPIB connection to the plotter’s GPIB inputconnection.
2. Choose a GPIB address for the plotter, and set its address switches according to the instructionsin its operating manual. (Address 6 is recommended; see Step 3.)
3. Select the plotter address for the PPM by pressing [MENU] (6) [F2] [nn] [UNITS].
Where nn is the plotter address. The default address to which the PPM sends data is 6. If theplotter address is changed from the default value of 6, it will remain at the new value untilanother value is entered. That is, it is not reset at power-on or any other time until intentionallychanged again.
4. Check that the plotter pens are installed and operating properly. Following the manufacturer’sinstructions, insert paper into the plotter and prepare it to plot.
5. If it is required or desired, enter a Code number or Part number to be printed on the plot. If noCode and Part numbers are selected, numbers previously entered will be plotted. The defaultnumbers are blank.
a. Enter the Code number as follows:
[MENU] (5) [F1] [n] [UNITS]
(n is a number up to 12 digits.)
Series 8500A Peak Power Meters
2-30 Manual No. 20790, Rev C, November 1998
Superceded by Revision D, March 2009

b. Enter the Part number as follows:
[MENU] (5) [F2] [n] [UNITS]
(n is a number up to 12 digits).
6. The date and time are always plotted. The date and time are obtained from the internal, real-timeclock of the PPM which is kept alive by a battery when the instrument is turned off. If it isdesired to check and/or change the date and time before plotting, press [MENU] (5) [F3] [F3] (ifclock is correct)
or, to change the clock, [MENU] (5) [F3] [F1] [mmddyy] [UNITS] [hhmmss] [UNITS] [F3]
where mmddyy = month, day, year; and hhmmss = hours, minutes, seconds
7. Enter the Graph Mode. The Delay Difference Timing will be plotted if it has been activated onthe readout. See Figures 2-8, 2-10, and 2-9 for examples of the types of plots available from thePPM.
8. Before the PPM can make a plot, it must first complete one sweep of the pulse profile. Assumingthe profile is completed, press [MENU] (2) [F3] [F1] for a paper plot or [MENU] (2) [F3] [F2]for a transparency plot.
9. If there is any GPIB bus error, an alarm will sound. This indicates that when the PPM checkedthe IEEE Bus, it was unable to activate the plotter. Some possible causes for this might be anincorrect address setting, the plotter not set up correctly, or the plotter is turned off or out ofpaper. If this situation occurs, press [F2] to return the PPM to its previous mode of operation.This feature allows PPM operation to continue despite bus hang-ups.
The GPIB bus error alarm consists of 2 audible beeps and a display of GPIB BUS ERROR
A single beep indicates that there are no problems, and that plotting will begin as soon as the trace hasbeen drawn on the display screen.
Once the plot has started, control of the PPM can be regained before the plot has finished. This gives theability to proceed with further testing without having to wait for the plotter to complete its task.
If it is necessary to Abort the plot for some reason, press [MENU] (6) [F1]. The plot will be terminatedas soon as possible.
Operation
Manual No. 20790, Rev C, November 1998 2-31Superceded by Revision D, March 2009
2.10 Dual Channel MeasurementsDual channel measurements are available only when using the Model 8502A power meter. The dualchannel capability of the Model 8502A provides two very useful functions. These are:
• Display of power measured by two channels simultaneously.
• Display of the power ratio between two channels.
Applications for these two functions are many and varied. Dual channel measurements allow two pointsin a system to be measured with one power meter. The PPM can simultaneously measure both channels ineither the CW or Peak Power Modes.
The Ratio function allows relative measurements to be made in either CW or Peak. It is also possible toratio Peak to CW or CW to Peak. These functions are useful for gain and loss measurements under CWor Peak conditions (or a combination of the two).
2.10.1 CW, CW Measurements
The following procedure is used for making dual channel CW measurements:
1. After power-on, press [CW] to access the CW Mode. Press [MEM] (3) [F1] for the PPM to useits default values, if desired. Wait approximately 30 minutes for the PPM to warm up.
2. Self-Calibrate both channels. Press [MENU] (1) [F3] [F1].
3. Follow the instructions displayed by the PPM to connect the appropriate detector to theCalibrator when prompted.
4. Connect the detectors to the device(s) or system to be tested.
5. The PPM will now be displaying the CW power for channel A. To display the CW power forboth channels, press [B].
6. Select the frequency of operation or cal factor as necessary for detector response correction bypressing [FREQ].
7. Enter any required display offsets.
8. To return to single channel operation, use the Detector Select A and B keys as required.
2.10.2 Peak, Peak Measurements: Method 1
1. Follow the procedure given in Section 2.10.1, except press [PEAK] in Step 1 instead of CW.
2. If the PPM is triggering, it will display the peak power in both channels. The following defaultsettings are in effect if the PPM has been initialized.
a. Internal Trigger from channel A set at -10 dBm (i.e. pulse at channel A causes trigger ifgreater than -10 dBm)
b. Frequency = 1.00 GHz
c. Chan A Cursor Delay = 1.0000 µs
d. Chan B Cursor Delay = 1.0000 µs
e. Spin knob active on channel A Cursor Delay as indicated by ∆ next to CSR DLY
3. If the PPM’s New Data and Ready lights are flashing, a trigger is occurring and measuringshould be possible. Try adjusting the channel A Cursor Delay by turning the spin knob until theCSR DLY reads 0.0000 ns. The Delay can then be increased slowly until the reading is beingtaken on the desired part of the pulse.
Series 8500A Peak Power Meters
2-32 Manual No. 20790, Rev C, November 1998
Superceded by Revision D, March 2009
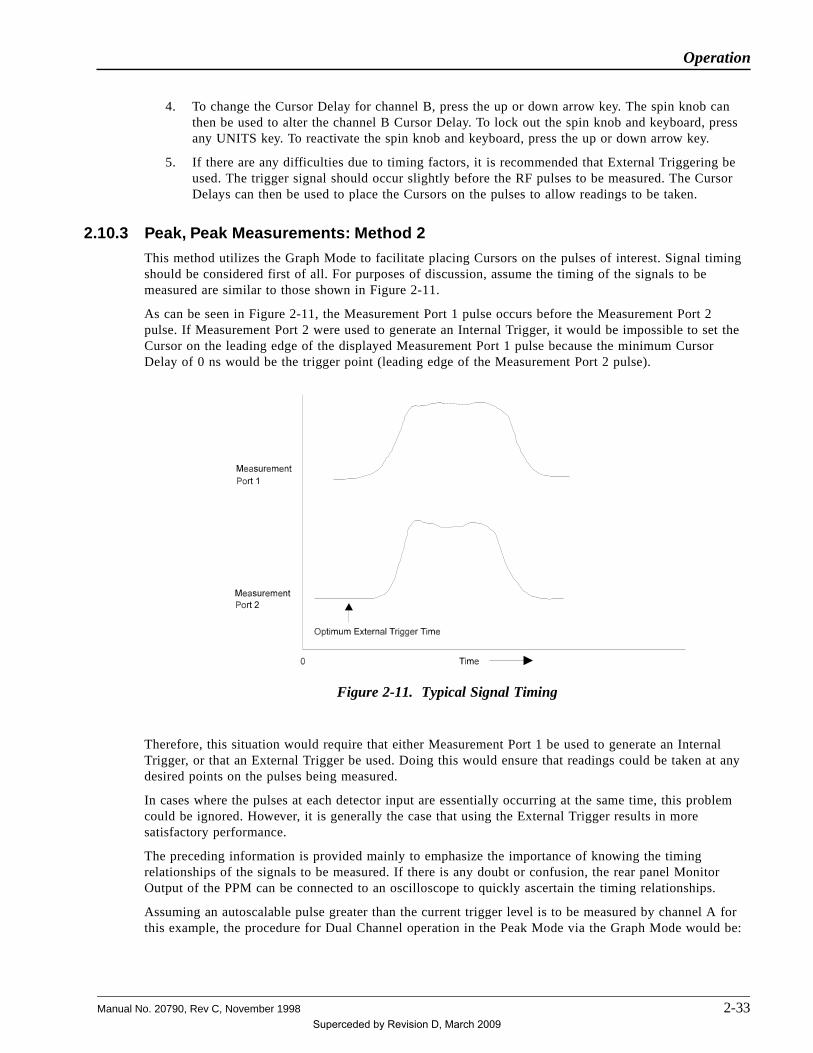
4. To change the Cursor Delay for channel B, press the up or down arrow key. The spin knob canthen be used to alter the channel B Cursor Delay. To lock out the spin knob and keyboard, pressany UNITS key. To reactivate the spin knob and keyboard, press the up or down arrow key.
5. If there are any difficulties due to timing factors, it is recommended that External Triggering beused. The trigger signal should occur slightly before the RF pulses to be measured. The CursorDelays can then be used to place the Cursors on the pulses to allow readings to be taken.
2.10.3 Peak, Peak Measurements: Method 2
This method utilizes the Graph Mode to facilitate placing Cursors on the pulses of interest. Signal timingshould be considered first of all. For purposes of discussion, assume the timing of the signals to bemeasured are similar to those shown in Figure 2-11.
As can be seen in Figure 2-11, the Measurement Port 1 pulse occurs before the Measurement Port 2pulse. If Measurement Port 2 were used to generate an Internal Trigger, it would be impossible to set theCursor on the leading edge of the displayed Measurement Port 1 pulse because the minimum CursorDelay of 0 ns would be the trigger point (leading edge of the Measurement Port 2 pulse).
Therefore, this situation would require that either Measurement Port 1 be used to generate an InternalTrigger, or that an External Trigger be used. Doing this would ensure that readings could be taken at anydesired points on the pulses being measured.
In cases where the pulses at each detector input are essentially occurring at the same time, this problemcould be ignored. However, it is generally the case that using the External Trigger results in moresatisfactory performance.
The preceding information is provided mainly to emphasize the importance of knowing the timingrelationships of the signals to be measured. If there is any doubt or confusion, the rear panel MonitorOutput of the PPM can be connected to an oscilloscope to quickly ascertain the timing relationships.
Assuming an autoscalable pulse greater than the current trigger level is to be measured by channel A forthis example, the procedure for Dual Channel operation in the Peak Mode via the Graph Mode would be:
Figure 2-11. Typical Signal Timing
Operation
Manual No. 20790, Rev C, November 1998 2-33Superceded by Revision D, March 2009

1. Connect the channel A detector to the RF source (port) that is believed to be generating a pulsebefore the second source (port) to be measured (i.e. Measurement Port 1). If the pulses of thetwo sources are coincident, use either port.
2. Connect the channel B detector to the second source (port).
3. Select the Graph Mode in channel A, and press [GRAPH] to Autoscale.
4. After the pulse has been successfully Autoscaled, set the Cursor to the desired measurementpoint.
5. Make a note of the Window and Cursor Delays. (The Start Delay will be 0.0000 ns afterAutoscaling.)
6. Press Detector Select [B] to switch to the channel B Graph Mode.
7. Set the Window and Cursor Delays to the same values as were noted in Step 5. If the pulse is notvisible on the readout, gradually increase the Start Delay until the entire pulse is on the screen.
8. Set the Cursor Delay to the point on the pulse where it is desired to take a measurement. ChannelA and B Cursors should now be placed wherever dual channel readings are to be taken. This canbe verified by pressing Detector Select [A] or [B] as necessary to check that the Cursors areproperly positioned.
9. Select the Peak Mode of operation by pressing [PEAK].
10. Select Dual Channel operation by pressing Detector Select A. Make sure that the LEDs in thecenter of the Detector Select A and B keys are lit. This signifies that the PPM is in the DualChannel Mode. The display should be similar to the following:
A: +0.65 dBm, 30.600 nsB: -4.65 dBm, 39.700 ns
FREQ = 1.00 GHz, PEAK
2.10.4 Peak, CW Measurements
If it is desired to measure Peak power on one channel and CW on the other channel, the procedure is thesame as when measuring Peak Power on both channels with some minor differences. These differencesare:
1. The channel used to make the Peak power measurement determines the triggering of the PPM.For low amplitude signals (below -20 dBm in the Peak Mode), use external triggering.
2. It is not necessary to use the Graph Mode or any Delay settings on the channel that will bemeasuring CW as the power will be continuous, and it makes no difference at what time the CWis sampled.
3. Even though one channel is displaying CW power, the PPM operates as though both channelswere in the Peak Mode. CW averaging has no effect on the reading. The rate at which the RF issampled and averaged is determined by the characteristics of the Peak power channel.
Series 8500A Peak Power Meters
2-34 Manual No. 20790, Rev C, November 1998
Superceded by Revision D, March 2009

2.10.5 Power Ratio Measurements
To make ratio measurements, the power measured by both channels must be within the specified powermeasurement range of the PPM system. When operating in CW, this power range is -40 to +20 dBm. Inthe Peak Mode, this power range is -20 to +20 dBm. Power readings taken in the Ratio Mode outside ofthese ranges will result in an error display.
The Ratio Mode only provides the ratio of A/B, not vice versa. The PPM can ratio two CW signals, twoPeak signals, or a combination of both. The following procedures show how to perform each of theseratio’ing operations.
Ratio’ing Two CW Signals
This is the easiest ratio function of the PPM. Proceed as follows:
1. Allow the PPM to warm up for at least 30 minutes. Then Self-Calibrate both channels. Frompower-on, press [CW] [MENU] (1) [F3] [F1].
Follow the displayed prompts to complete the Self-Cal. After Self-Cal has completed, the PPMwill be measuring CW power in channel A.
2. Select the Ratio Display Mode by pressing [MENU] (7) [F2].
3. The default mode for power ratio measurements is for Peak power on both channels. To set bothchannels for CW operation, press [A] [F2] [B] [F2].
The PPM will now be reading the ratio of A/B. Normally this is expressed in dB, however, it can also beexpressed as a linear reading (such as 19654 EXP=-4) by pressing [dB/mW]. The display indicates thattwo CW signals are being ratio’ed by displaying CW/CW in the lower right hand corner of the display.
Remember that the frequency of operation or Cal Factor must be entered using the FREQ key, and anydesired Offsets should also be included. These two functions are described in Sections 2.8.3 and 2.8.4.
Ratio’ing Two Peak Signals
The point in time at which readings of Peak power are taken in both channels for ratio’ing purposes isdetermined by the setting of the Cursor Delay. Although it is most desirable that both pulses beingmonitored occur at exactly the same time, in practice this would be a very rare event. Therefore, thesignals to be measured must be carefully evaluated to ensure that accurate readings are taken.
The Cursor Delay must be set so that samples are being taken on both the channel A and B pulses. SeeFigures 2-12 and 2-13 for an examples of good and bad Cursor Delay settings in this situation.
The following are guidelines that can be used when ratio’ing two Peak signals:
1. Make a single channel Peak measurement using the Graph Mode (Autoscaling is recommended).
2. Set the Cursor Delay so that the power reading (CSR PWR) is being taken close to the center ofthe pulse (see Figure 2-12).
Figure 2-12. Typical Peak Power Ratio Display
Operation
Manual No. 20790, Rev C, November 1998 2-35Superceded by Revision D, March 2009

3. Verify that the Cursor Delay setting is adequate for both channels by switching to the otherchannel. Use the same Start, Window, and Cursor Delays as in the first channel. If the pulsesoccurred at the same time, the Cursor would be close to the center of the pulse sampled by theother channel (see Figure 2-13).
4. Switch channels, checking to be sure that the Cursor is not placed close to the edge of either ofthe pulses being sampled.
5. Once the Cursor has been satisfactorily set, to activate the Ratio Display Mode press [MENU](7) [F2].
The default setting for the type of signal being used by both channels is Peak. This is verified by PK/PKbeing displayed in the lower right hand corner of the readout. If this is not the case, select Peak operationby pressing [A] [F1] [B] [F1].
The PPM should now be displaying the ratio of the two pulses (similar to Figure 2-12). Be sure to usethe FREQ key and Offset function if necessary.
Ratio’ing Peak to CW Signals
This function is very useful in many applications such as traveling wave tube (TWT) testing that requirethe measurement of gain under pulsed conditions. This could be a problem when the TWT has a CWinput and a pulsed output. The PPM easily performs this type of measurement using the followingprocedure:
1. Make a single channel Peak measurement at the port of the device under test that has the pulsedsignal.
2. Set the Cursor at the desired point on the displayed pulse profile. Using the Graph Mode is thesimplest way to do this.
3. Select the Ratio Mode by pressing [MENU] (7) [F2].
4. Set which channel will be CW by pressing [B] [F2] (if channel B is to be CW) or [A] [F2], (ifchannel A is to be CW).
5. Set which channel is to be Peak by following the same procedure as above, only press [F1]instead of [F2].
The lower right hand corner of the readout will indicate which channel is CW and which isPEAK. Whichever indication is farthest to the right side will be channel B.
G O O D B A D
Figure 2-13. Typical Good & Bad Cursor Delay Settings
Series 8500A Peak Power Meters
2-36 Manual No. 20790, Rev C, November 1998
Superceded by Revision D, March 2009

2.11 High Power MeasurementsOne of the most important things to remember when using the PPM is that it employs balanced, zerobias, Schottky diode detectors as power detectors. Due to this highly sensitive, highly accurateconfiguration, the maximum power that the detectors can handle before burning out is +23 dBm(200 mW). This limitation is regardless of duty cycle.
2.11.1 Power Warning - Max/Min Power Limits
The PPM has a built-in warning system to advise you of mild overloads to the detectors. Large overloadswhich are usually the result of a failure in the device under test or leaving an attenuator out of the testsetup, cannot be prevented because of the speed at which these failures happen. However, you will beadvised by a prompt when the power level exceeds the preset power warning level.
The default value for the MAX Power warning point is +20.5 dBm. You can set this to anywhere between-10 and +21 dBm.
The PPM also has a lower level limit (MIN). This is mainly used to avoid displaying power readingsoutside the lower power range of the instrument. When the power level being measured by the PPM isbelow the lower level limit, the readout will display a series of dashes to indicate that the power beingmeasured is too low for the PPM to take an accurate measurement.
The default value for the MIN Power warning point is -45.0 dBm. You can set this anywhere between -15and -50 dBm. To change the MAX and MIN power limits, press [MENU] (7) [F1] [mm.mm] [dBm][nn.nn] [dBm], where mm.mm is the maximum power limit, and nn.nn is the minimum power limit.
2.12 High Power Measurement ProceduresThe procedure for making absolute CW or Peak power measurements under high power conditions is asfollows:
1. Approximate the Peak power of the signal to be measured.
2. After 30 minutes warm-up, Self-Cal the PPM detectors.
3. Choose an appropriate attenuator or coupler to be used in the test setup to reduce the powerbeing measured to a safe level for the detectors. The power at the detector input must be lessthan +20 dBm.
4. When making this approximation, be sure to use worst case power levels. If in doubt, a 10 dBattenuator can be used directly on the detector input in addition to the selected high powercoupler or attenuator.
5. Ensure that the RF power of the source to be measured is turned OFF.
6. Connect the high power coupler to the RF source to be measured as shown in Figure 2-14. If ahigh power attenuator is used, connect as shown in Figure 2-15.
7. Connect the PPM detector with its attenuator to the coupled output of the high power coupler(Figure 2-14), or to the output of the high power attenuator (Figure 2-15).
Operation
Manual No. 20790, Rev C, November 1998 2-37Superceded by Revision D, March 2009

8. Auto-Zero the PPM by pressing [MENU] (1) [F3] [F2] [UNITS].
If a dual channel 8502A is being used, follow the prompts given on the display. Select any Unitskey or CLEAR as necessary to Zero the desired channel(s).
9. Turn on the RF power of the source under test.
10. If measuring a pulsed signal, it is important that the Cursor be placed on the pulse. This can bedone by using the PPM’s Autoscale feature which is activated in the Graph Mode by pressing[AUTOSCALE]. If this method is not possible, try using the Internal Trigger with the level set at-20 dBm. Then set the Cursor at 0.0000 ns and increase the Cursor Delay gradually until theCRS PWR is at its maximum.
Figure 2-14. Detector to a High-Power Coupler Setup
Figure 2-15. Detector to High Power Attenuator Setup
Series 8500A Peak Power Meters
2-38 Manual No. 20790, Rev C, November 1998
Superceded by Revision D, March 2009

If the New Data light on the front panel of the PPM does not flash, then the instrument is nottriggering. If the trigger level is at -20 dBm and no trigger occurs, there might not be enoughpower at the detector input to be able to measure. If this is the case, recheck the calculations thatwere made to decide what attenuation levels were required to prevent detector burnout. Ifnecessary, reduce the attenuation at the detector input by 10 dB to increase the power so that thePPM will trigger.
NOTE: If a TTL Trigger signal is available from the source being measured, then using theExternal Trigger Mode is advisable. If an oscilloscope is available, the PPM’s rear panelMONITOR OUTPUT(s) can be used to determine the proper timing settings for theinstrument.
11. Once the PPM is reading power as desired, press [FREQ] and enter the frequency of operation(or Cal Factor).
12. To obtain the absolute power output of the RF source being measured, use the PPM’s Offsetfeature to offset the displayed values by the combined attenuation values of the coupler and/orattenuators being used in series with the detectors. Most couplers and attenuators haveattenuation versus frequency response curves supplied that can be used for exact entry of therequired offset. To enter the Offset, press [MENU] (3) [F1] [nn.nn] [dBm].
Where nn.nn is the Offset desired. For channel B offset on the 8502A, use F2 instead of F1. When theOffset feature is in use, this will be shown on the display by an asterisk (*) next to the FREQ or CFindication.
2.12.1 High Power Relative Measurements (8502A only)
The procedure for making a gain or loss measurement is the same as for absolute power, but requiresactivating the Ratio Display function of the 8502A. The Offset feature compensates for external devicesbefore entering the Ratio Mode (see Power Ratio Measurement Procedures in Section 2.12 for moreinformation on ratio’ing).
Operation
Manual No. 20790, Rev C, November 1998 2-39Superceded by Revision D, March 2009

2.13 Special Capabilities of the PPM
2.13.1 Reference Delay
To facilitate making timing measurements relative to some event other than the trigger (such as thefalling edge of a pulse), it is possible to shift the PPM time coordinates by using Reference Delay. ThePPM subtracts the Reference Delay from the Cursor Delay and Start Delay, in effect shifting the zerotime reference from the trigger time to a time after the trigger by the amount of the Reference Delay. Toset the Reference Delay press [MENU] (4) [F1] (for Ch A or [F2] for Ch B) [nn.nn] [UNITS].
2.13.2 Single Pulse Measurements
Measurement of a single pulse can be done with the PPM by operating in the Peak Mode. (The GraphMode cannot be used for single pulse measuring.)
Two methods are available for making single pulse power measurements. These are discussed in the nexttwo sub-sections.
2.13.3 Single Pulse Measurement Using Internal Trigger
To make a single pulse measurement using the Internal Trigger, it must first be decided how long afterthe trigger has occurred that the measurement should be taken. For example, in the single pulse shown inFigure 2-16, the PPM trigger level is set to -10 dBm. If the Cursor Delay were set to 0.0000 ns, then thepower measurement would be taken at the trigger point. In this case, this is not on the top of the pulsebeing measured.
To measure power at the top of the pulse as required in most applications, the Cursor Delay needs to beset at around 5 µs. Therefore, to accurately make Peak power measurements using the Internal Triggermode of operation, you must have some idea of the pulse width boundaries to be tested.
In cases where the rise time of the pulse is known to be repeatable and the pulse width is known never tobe below, say, 8 µs, you could set the Cursor Delay to 5 µs. This decision would allow measurement ofall pulse widths greater than 5 µs without the necessity of altering the Cursor Delay.
Figure 2-16. Typical Pulse with -10 dBm Trigger Level
Series 8500A Peak Power Meters
2-40 Manual No. 20790, Rev C, November 1998
Superceded by Revision D, March 2009

Single pulse measurements cannot be made with the same accuracy as repeating pulse trains. This isprimarily due to the fact that there is no way to eliminate noise that might be present in the test setup.For repetitive pulse trains, averaging can be used to eliminate errors due to noise.
The procedure for making a single pulse measurement is as follows:
1. Allow the PPM to warm up for 30 minutes, then conduct a Self-Cal.
2. Select the Peak Mode of operation. If there is no pulse at the detector input there will be notrigger. If this is the case, the display will either be blank or frozen with the last data that wastaken. The Ready light should be lit, the New Data light will be dark.
3. Set the Trigger Mode to Internal, and then set the trigger level as desired.
4. Set the Cursor Delay to the desired time following the trigger that the measurement is to betaken. Press [GRAPH]. Move the cursor to CSR DLY. Enter the desired delay (for this example,use 5 µs) through the keypad, and terminate with the ms, µs, or ns key. Then press [PEAK].
5. Set the Peak Pulse Averaging number to 1.
6. Connect the detector to the RF source to be measured.
7. When a pulse of sufficient amplitude to cause a trigger enters the detector input, the PPM (in thiscase) will take a reading 5 µs later. The Peak power being measured at the time of the CursorDelay will then be frozen on the display until the next pulse or trigger occurs.
2.13.4 Single Pulse Measurement With an External Trigger
Making a single pulse measurement using an External Trigger is done with the same limitations as withthe Internal Trigger. However, it is possible to control exactly when the power reading is taken bysupplying a TTL trigger to the PPM’s rear panel trigger input at the appropriate time.
The PPM is set to External Trigger by pressing [MENU] (1) [F2].
The trigger signal must arrive coincident with or before the RF pulse to be measured when measuringwith the External Trigger. If the power reading needs to be taken exactly at the time that the triggeroccurs, then the Cursor Delay is set to 0.0000 ns. If the pulse to be measured arrives after the trigger,then set the Cursor Delay so that the power reading will be taken at the desired point on the pulse.
Operation
Manual No. 20790, Rev C, November 1998 2-41Superceded by Revision D, March 2009

2.14 Swept Peak Power MeasurementsThe frequency response and power level characteristics of pulsed signals can be measured under sweptfrequency conditions by combining the capabilities of the Giga-tronics PPM with those of theGiga-tronics Model 8003 Scalar Network Analyzer.
The Analyzer’s normalization memory can be used to subtract out residual test setup responses, thusallowing direct readout of the frequency response of the device under test. There are a variety ofapplications where this ability can be very useful such as:
• Pulsed TWT testing
• Microwave frequency performance of pulsed radar systems
• Return Loss
• VSWR Measurements under Pulsed Conditions
• and others.
Figure 2-17 illustrates a typical setup for measuring swept peak power.
If a Giga-tronics Scalar Analyzer system is not available, a conventional oscilloscope can be used by firstdisplaying the PPM’s output, and then marking the system tracking errors on the CRT in grease pencil forvisual correction.
The PPM is normally used in the Peak Mode for this type of testing. Most PPM settings would be thesame as when measuring a single frequency pulsed signal. In order to use the Swept/Pulse system withany degree of accuracy, the pulse repetition rate must be considerably faster than the speed at which theRF sweep takes place. This is determined mostly by the setting of the sweep generator’s sweep speed.
The PPM is capable of reading better than 100 pps, and the output level will be at 100 mV/dB. Sweptmeasurements can also be made simultaneously from channels A and B of the 8502A, but the PPM’sreading rate will be somewhat slower.
It is very convenient to use the sweep generator’s Frequency Reference signal to continually inform thePPM as to what the RF frequency is at any given time. (Frequency Reference is synonymous withV/GHz, VpropF, etc.) Using this feature ensures that, as the sweep generator changes frequency, the PPM
Figure 2-17. Typical Pulsed Swept Measurement System
Series 8500A Peak Power Meters
2-42 Manual No. 20790, Rev C, November 1998
Superceded by Revision D, March 2009

knows to alter its frequency correction accordingly. The PPM then uses the proper frequency correctionaccordingly. The PPM then uses the proper frequency correction for the detector(s) at each discretefrequency point without necessitating any operator input or any calculations (see Section 2.8.2 moreinformation on the interfacing of external frequency signals.)
To make swept frequency measurements under pulsed conditions, equipment should be set up similar toFigure 2-17. The measurement routine is initiated by pressing [MENU] (10) [F1].
During the time that the fast analog output mode is active, the display window will indicate:
FAST ANALOG OUTPUTMEASUREMENT MODE
Press [MENU] to exit
Operation
Manual No. 20790, Rev C, November 1998 2-43Superceded by Revision D, March 2009

2.15 Self-Testing the 8500APrior to performing a self-test during a testing routine (at some point after the instrument has been turnedon), the detector must either be connected to the Calibrator Output on the front panel, to a 50-ohmtermination, or to a signal source which has the RF power turned OFF.
The Self-Testing feature of the PPM is provided as a quick health check of the instrument. The PPMperforms a Self Test each time it is powered on. To initiate the Self-Test function at other times:
First remove all RF power from the detector. Then press [MENU] (11) [F2]. While the Self-Test is inprogress, the following will be displayed:
Performing Self-TestCLOCK/CALENDER INDICATES(day) (date) (time) (year)System version # = n.nn
At the successful completion of the Self-Test, the PPM will display Self Test Completed: Passed. A beepwill then sound, and the PPM will return to its previous display mode.
If some type of failure is detected by the PPM’s microprocessor during the Self-Test, the display willindicate:
SELF TEST FAILED! - PRESS CLEARERROR NUMBER(S): 11, 8, etc.
Table 2-1 gives a listing of the error numbers and their associated meanings.
Error Cause
01 -5.2 V Supply
02 Memory Bad
03 Excessive A Channel Offset
04 A Channel Gain Error
05 Excessive B Channel Offset
06 B Channel Gain Error
07 A Channel Analog Output DAC
08 B Channel Analog Output DAC
09 Delay 8555s (ICs)
10 Delay Time Error
11 Calibrator Bridge Voltage Error
Press [CLEAR] to bring back the display of the last setup before Self-Test. However a failed Self-Testindicates a problem of some kind, and it is recommended that the PPM not be used for measuring until itis checked according to the procedures given in the Troubleshooting instructions in Chapter 6.
Table 2-1. Self-Test Error Flags
Series 8500A Peak Power Meters
2-44 Manual No. 20790, Rev C, November 1998
Superceded by Revision D, March 2009

2.16 Frequency Display Disable/EnableIf there is some reason (such as classified testing) why it might be desired not to have the frequency ofoperation displayed while measurements are being taken, this can be done by using the F3 key of MENU(7) as a toggle for this function.
Pressing [MENU] (7) [F3] the first time will replace the frequency numbers at the bottom of the displaywindow with asterisks.
When you desire to return to the normal frequency display mode, press [MENU] (7) [F3] again and thenumbers indicating the frequency will return.
2.17 Non-Volatile MemoryThe PPM Non-Volatile Memory is intended to Store front panel settings for later Recall. This isparticularly useful when complicated setups are in use. Usage of this feature can save many menuselections that might otherwise have to be entered every time the instrument is used.
The PPM stores all front panel information pertaining to the present setup in a memory location calledCurrent Setup. When the PPM is turned off, Stored setups and the Current setup in memory are kept aliveby a Lithium battery (exceptions are detailed in Section 1.3). The battery will ensure that the contents ofthe memory will be preserved for about six months.
When the PPM has been turned on and Self-Test either completed or bypassed, the opportunity will bepresented to select Last Setup at Turn-Off. If it is desired to use the PPM in the same manner as when itwas last used, this feature of the Non-Volatile Memory is very convenient. Other features of theNon-Volatile Memory will be discussed next.
2.17.1 Memory Features
To access the Memory features of the PPM, press [MEM]. There are three levels of menus accessible bysequentially pressing the MEM key. The menus accessed through the Memory key are detailed inAppendix B. If you mistakenly access the Memory menu, press [CLEAR] to return to the Data DisplayMode.
Store Setup
The PPM has 10 Non-Volatile Memories for storing front panel setups. These are numbered from 1through 10. To store the present PPM front panel setup in one of these 10 memories, press [MEM] (1)[F2] [nn] [UNITS].
Where nn is the number of the memory where the setup is to be stored (between 1 and 10). If no numberwere entered, the operation would be aborted when any Units key was pressed and the PPM would returnto data display.
Recall Setup
To Recall a previously stored setup, press [MEM] (1) [F1] [nn] [UNITS].
Where nn is the number of the memory to be recalled (from 1 to 10). If no number is pressed, theoperation is aborted when any Units key is pressed and the PPM will return to data display.
Get Power-On Setup
To retrieve from memory the front panel setup that was operative the last time the instrument was usedbefore power-off or the rear panel RESET button was used, press [MEM] (1) [F3]
Operation
Manual No. 20790, Rev C, November 1998 2-45Superceded by Revision D, March 2009
NOTE: This selection will erase the Current selection. It is advisable to store the setup ina numbered memory before executing the command.
Display Setups
When one of the Display Setup features of the PPM is activated, the panel settings of the selected setupare shown on the display. This is useful if it is desired to determine the exact parameters that were usedfor a particular setup, and allows checking whether or not the various settings are correct before makingany measurements.
1. To Display the contents of the Current setup, press [MEM] (2) [F1]. The PPM will then displaythe current instrument status readout in a screen by screen display mode. To scroll to the nextscreen display, press the F1 key for More. To exit and return to the Data Display Mode, press F3.
2. To Display the contents of the Power-On setup, press [MEM] (2) [F2]. The PPM will thendisplay the Power-On instrument status readout screen by screen. To scroll to the next screen,press [F1] for More. To exit and return to data display, press [F3].
3. To Display a numbered memory setup, press [MEM] (2) [F3] [nn] [UNITS], where nn is thenumber of the memory (between 1 and 10) that is to be displayed. If no number is entered, theoperation is aborted when any Units key is pressed and the PPM returns to data display.
The PPM will display the instrument status readout of the Memory screen by screen. To scroll to the nextscreen display, press [F1] for More. To exit and return to data display, press [F3].
Initializing Setups
This feature of the PPM allows the initializing of the current setup, a numbered memory setup, or all butthe current setup (see Section 1.3). Initializing resets the selected setup’s parameters to the factory defaultsettings. Certain parameters are not initialized. The Initializing function can be useful if, for some reason,you get lost or have difficulty interpreting readings due to the complexity of a particular setup.Initializing also allows parameter settings to be made from a known status.
1. To Initialize the Current setup, press [MEM] (3) [F1].
NOTE: This selection will erase the Current setup. It is advisable to store the setup in anumbered memory before executing the command.
2. To Initialize all memory setups except for the Current setup, press [MEM] (3) [F2]. It is a goodidea to Display the contents of the numbered memory setups before executing this command tosee if it is desired to retain any of the setups in question.
3. To initialize a numbered Memory setup, press [MEM] (3) [F3] [nn] [UNITS], where nn is thenumber of the memory (between 1 and 10) to be initialized. If no number is entered, theoperation is aborted when any Units key is pressed and the routine will return to data display.
Series 8500A Peak Power Meters
2-46 Manual No. 20790, Rev C, November 1998
Superceded by Revision D, March 2009

2.18 1018B Peak Power Meter Emulation
2.18.1 General
The Giga-tronics Model 1018, 1018A, and 1018B series of peak power meters were the predecessors tothe Model 8501A/8502A meters. This 1018 series was first produced in 1969, and has had several designup-grades. In 1978 Pacific Measurements, Inc. (now known as the Giga-tronics Power MeasurementsDivision) added limited IEEE Bus capability to the 1018, but no provision was available for controllingfront panel states. Only the cursor delay, trigger or reset, and the taking of data was remotely controllable.
The purpose of the 1018B emulation mode is to provide a means for current users of the 1018B toquickly adapt to using the 8501A/8502A meters in automatic systems. While perfect emulation is notpossible, the PPM can mimic certain operations of the 1018B. This emulation relates only to GPIB (IEEEBus) operations. That is, the ability to reset, trigger, alter the cursor delay, and take a power reading overthe bus. See Section 3.5 for detailed information on GPIB operations with the PPM.
Although software written for the 1018B series would not take advantage of many of the new features ofthe PPM, the emulation capability can allow work to continue while new software is being written for thePPM.
NOTE: To use the 1018B software with the PPM in the 1018B Emulation Mode, thesoftware must be written so that the talk and listen addresses of the PPM are both the same.For further information, see Section 3.5.
2.18.2 Initiating the 1018B Emulation Mode
To initiate the 1018B Emulation Mode, press [MENU] (8) [F2].
Thereafter, MENU (8) selects settings relating to the way in which the PPM will emulate the 1018B. Seethe Menu-8 listing in Appendix B for a listing of available settings. To know which selections to make,three questions must be answered regarding how the 1018B is presently being used on the IEEE Bus.These are:
1. Is SRQ Enabled or Disabled?
2. Is the instrument set up to output data upon being talk-addressed (automatic trigger reset), ordoes the instrument require a trigger reset (a GET or ? command) to take a data point?
The 1018B emulation is incompatible with the Ratio Mode, and once the routine is in the 1018BEmulation Mode, the Fast Analog Output function cannot be accomplished. For furtherinformation, see Section 3.5.
3. What is the Talk/Listen address? (they must be the same.)
Based on these questions, use MENU (8) to select the appropriate settings. Press [MENU] (6) [F3] to setthe PPM listen and talk addresses.
Once the above has been done, it should be possible to swap a Model 1018B with option 05 (GPIB) witha Model 8501A or 8502A meter and continue operations.
To terminate the 1018B Emulation Mode, press [MENU] (10) [F2].
Operation
Manual No. 20790, Rev C, November 1998 2-47Superceded by Revision D, March 2009

Series 8500A Peak Power Meters
2-48 Manual No. 20790, Rev C, November 1998
Superceded by Revision D, March 2009

3 Remote Operation
3.1 IntroductionThis chapter describes remote operation of the Series 8500A Peak Power Meters using the GeneralPurpose Interface Bus (GPIB), and provides all of the basic information required to begin programmingas easily as possible. After you are familiar with the Model 8501A/8502A Peak Power Meter (PPM)commands and functions, controlling the instrument through the GPIB should be fairly simple. Afirst-time user of the PPM should read the General Information in Section 3.2 before attempting tooperate the PPM over the GPIB.
Appendix A to this manual contains a summary of command codes.
This chapter contains the following information:
• General Information; Bus Functions; Menus; Modes of Operation; IEEE Output Modes; StringFormats; Data Formats; Descriptive material on how the PPM functions over the GPIB;Simple Sample Programs
• Command Descriptions by Function; Command Syntax; Sample Programs
• Service Request (SRQ) Functions; Error Conditions
• Giga-tronics Model 1018B Emulation; Limitations; Explicit and Implied 1018B Emulation
• Status Code Values - Normal; Command Errors; Operation Errors; Task Completion Codes,Normal and Abnormal; Critical Errors
• Summary of Bus Functions Implemented on the Model 8501A/8502A Power Meters
• Command Summary Table (Alphabetical Listing)
The PPM allows several modes of GPIB operation. Power measurements can be taken in a variety ofmodes and formats. These range from simple CW measurements to complex graphic display capabilitiesof pulse profiles, complete with timing information.
The 1018B emulation feature allows the 8501A/8502A to be installed in most test systems where the1018B was previously used, without the need for immediate reprogramming. The emulation can facilitatethe usage of the PPM with the older 1018B software while writing new codes is under way.
Manual No. 20790, Rev C, November 1998 3-1Superceded by Revision D, March 2009

3.2 Remote Operating ModesThis section describes the various methods and modes that are used for remotely controlling the PPMthrough the GPIB. Typical sample programs illustrating the use of commands are provided.
3.2.1 PPM IEEE Bus Functions
Remote operation of the PPM is accomplished through the GPIB under the control of a remotecontroller/calculator. Bus functions are implemented using the notation of the IEEE-488 1978specification. These are given in the Bus Functions Summary in Section 3.7.
The following is the general order of events when operating through the GPIB:
1. Parsing of Command String.
2. Actions taken:
a. Autoscale, if requested.
b. Power measurement, and so forth.
c. Output of data upon TACS (Talker Active State)
It is necessary to wait for certain events to complete before sending new commands. Examples of suchcommands are AUTO and Marker Placement. If the PPM is placed in TACS and then untalked or if a newcommand string is sent, then the taking of data will be terminated as will the autoscale function if it isnot yet complete. Failure of autoscale will result in a service request and the error condition of 60.
Completion will be signaled by the SRQ reporting either success or failure. If the command is AUTO andMarker Placement, it is necessary to wait for AUTO success or failure, and then Marker Placementsuccess or failure before expecting any time measurement output data from the PPM.
The controller should time out if the PPM does not complete the appropriate service requests in areasonable amount of time; allowing for the autoscale average number, pulse repetition rate, etc.
It is recommended that commands be sent after Device Clear from the controller to guarantee the state ofthe instrument. See Section 1.3 for the default settings.
Any pulse profile related command (DUMG, Plot commands, and marker placement commands) willperform their operation on the collected data when they are received.
Throughout this IEEE Bus operation, delays handled as arguments to commands sent to the PPM arelisted as nnnnnn.nn µs. The PPM will accept resolution down to 0.1 ns or 0.0001 µs. A total of eightdigits are allowed. The position of the decimal point can vary. Arguments should not be sent with excessdigits to the right of the decimal point.
Series 8500A Peak Power Meters
3-2 Manual No. 20790, Rev C, November 1998
Superceded by Revision D, March 2009
3.2.2 Front Panel Menus
See Appendix B for a listing of menus that can be accessed with the front panel MENU and MEM keys.Appendix C contains illustrations of top level menu formats.
Before attempting to control the PPM over the GPIB, it should be kept in mind that there are variousfront panel menu selections that will affect bus activity. The front panel menu selections relating to theGPIB will include the following capabilities:
1. Enter the PPM address
[MENU] (6) [F3] [nn] [UNITS]
NOTE: This is most important as the PPM will not respond to bus commands unless thishas been correctly accomplished.
2. Enter the plotter address
[MENU] (6) [F2] [nn] [UNITS]
The address entries are self-explanatory; valid values are 0 to 30. The addresses entered arestored in non-volatile memory and need to be entered only when they change, but not whenpower is turned off and on again.
3. Emulate 1018B (see Section 3.5). The instrument will always power-on in the normal PPM modeand not the 1018B emulation mode.
4. Plot (see Plot Output Mode in Section 3.2.5).
5. Stop current plotting activity (see Stand Alone Plot Output Mode in Section 3.2.5).
3.2.3 Power-On Condition
When the PPM is first turned on, it will automatically go into its Power-On Self-Test (POST) function.When POST has completed, the routine returns to the last setup before the instrument was powered off.After POST, the instrument will be ready to receive instructions from the GPIB controller to go to theRemote state.
The address to place the PPM in Remote at power-on will be the same address that was used beforepower-off (the default address is 4).
Remote Operation
Manual No. 20790, Rev C, November 1998 3-3Superceded by Revision D, March 2009

3.2.4 Remote and Local Lockout Functions
The PPM accepts commands or output data only through the bus when it is in the Remote state. It isplaced in the Remote state by listen-addressing the instrument with REN asserted, per the IEEE-488 1978standard. The PPM will ignore talk-addressing when it is not in the Remote state. Any Group ExecuteTrigger (GET) command or any data sent to the instrument when it is addressed while not in Remote willresult in an error condition, and a service request will be generated if SRQ is enabled.
When in the Remote state, the front panel keys will not be active except for an escape sequence to returnto local control. The escape sequence is initiated by pressing [MENU]. At that time the PPM will suspendall operations, including IEEE Bus interaction. The measurement being displayed on the front panel willbe replaced with a prompt to press F1 to return to local control, or F2 to abort the local escape sequence.The instrument will not respond to any other keystrokes. If F1 is pressed, the instrument will return tolocal control and resume normal manual operation. If F2 is pressed, the instrument will resume normaloperations in the Remote state as though no action had occurred. Once the unit has been returned toLocal control, it will return to Remote control the next time it is Listen-Addressed (LADS) with RENasserted.
Another method to return to Local is achieved by sending a GTL (Go To Local) command from the GPIBcontroller. The PPM will return to the Local control state when it receives this command, and can then bereturned to the Remote state the next time it is listen-addressed with REN asserted.
Besides the return to local escape sequence and the GTL universal command, the PPM will also exit theRemote state when the REN line goes low.
After the PPM has entered the Remote state, a Local Lockout command can be sent to disable the use ofthe front panel. This feature is intended to prevent accidental changes in front panel settings orinterruption of the program.
When the instrument is in the Local Lockout mode, the Return to Local escape sequence activated by theMENU key is disabled. There is no way to regain control from the front panel once Local Lockout hasbeen commanded.
To go to the Local Lockout mode, the Local Lockout (LLO) bus command must be sent to the PPM. TheLLO light on the PPM’s front panel will not be turned on at that time, but the instrument will be in theLLO state. At the next change in the state of the instrument, either a change in the addressed state of thePPM on the GPIB or any keystroke made on the front panel, the LLO light will turn on. If a front panelkeystroke is made, it is ignored and will not affect the state of the instrument. Subsequent attempts tocontrol the unit from the front panel will also be ignored.
3.2.5 Output Modes
The PPM outputs data over the GPIB in the following six output modes:
• Update Trigger Reset
• Update Data Continuously
• Plot
• Temperature Difference
• Status Byte
• Stand Alone Plot
The PPM can be in only one output mode when it is talk-addressed. For example, the unit cannot beprogrammed to plot and then immediately output the difference in temperature since the last calibration.If the PPM receives more than one output mode instruction, the most recent command will supersede allprevious output commands.
Series 8500A Peak Power Meters
3-4 Manual No. 20790, Rev C, November 1998
Superceded by Revision D, March 2009

The instrument must always be in an output mode. It sends output information when it receives acommand to initiate another output mode, or when a current output mode is completed and terminatesitself. The self terminating modes are Plot, Output Temperature Difference Since Calibration, OutputStatus Byte, and Stand Alone Plot. When these modes complete, the PPM will not send any more datauntil it is untalked (the Stand Alone Plot untalks itself). When untalked, the default output mode becomeseither Update Data Trigger Reset or Update Data Continuously, depending on which mode was lastinitiated. When power is first applied to the instrument, the default output mode is Update Data TriggerReset.
Before selecting any of the PPM Output Modes described above, required parameters should be set sothat the PPM data that is taken will be valid. For example, plotting commands will not work unless thePPM has been set to the Graph Mode.
Update Trigger Reset Output Mode
A string of four characters (UPDT) must be sent over the bus to the PPM to access this mode ofoperation. If you are using BASIC on an HP Series 200 computer, the command might look like:
OUTPUT 704; UPDT
where:
OUTPUT is the GPIB command to send the letters following the semicolon.The 7 in 704 is the HP instruction that the output is to go via the GPIB interface.The 04 in 704 is the Listen/Talk address of the PPM. The Listen/Talk address must be set withthe MENU key on the PPM’s front panel (see the Menu (6) description in Appendix B).
In the Update Trigger Reset Mode, the PPM will not send any data until it receives a trigger reset. Whenthe trigger reset is received through the GPIB, the instrument is set to record the next measurement. If theinstrument is in the Peak or Graph Mode, the measurement (power reading at the cursor location) will betaken the next time the instrument is triggered. Triggering can be either internal or external, depending onhow the instrument has been configured. The recorded measurement data will be output through the GPIBwhen the PPM next enters TACS (Talker Active State).
The trigger reset can take one of the following two forms:
A. The universal GPIB command, GET (Group Execute Trigger), can be sent over the bus when thePPM is listen-addressed, or
B. The controller can send the UPDN (Up-date Data Now) command to transfer the last data taken tothe GPIB buffer (e.g. OUTPUT 704; UPDN).
When the PPM completes the measurement and has the data ready to output, it will request service if it isnot in TACS and has SRQ enabled. Entering TACS will clear the service request if the instrument has notalready been serviced directly by the GPIB controller program.
Remote Operation
Manual No. 20790, Rev C, November 1998 3-5Superceded by Revision D, March 2009

The procedure to trigger reset the PPM with the GET command consists of the following steps:
1. Listen-address the PPM.
2. Send the GET universal command.
3. Talk-address the PPM.
4. Release ATN to set the PPM in TACS.
If in the Peak Mode, send the pulse to trigger the PPM.
If the pulse is sent before the PPM is in TACS, an SRQ will be generated if SRQ has beenenabled. Entering TACS will clear the SRQ.
5. Read the power measurement string as it is sent by the PPM. The string will be terminated with acarriage return followed by a line feed character sent with EOI.
The procedure to trigger reset the PPM with the UPDN command is the same as using the universal GETcommand except that after Step 1 when the PPM has been listen-addressed, the command string UPDNshould be sent. The power measurement data output format is discussed in Section 3.2.7.
Sample Program:
10 PRINT CHR$(12); 20 ! THIS PROGRAM USES THE 30 ! UPDATE TRIGGER RESET MODE 40 ! OF THE PPM TO COLLECT 50 ! POWER MEASUREMENT DATA. 60 ! UPDN RESETS THE PPM. IT 65 ! IS THEN READY OR ARMED. 70 ! THE PPM WILL SEND DATA 80 ! AFTER RECEIVING THE UPDN 90 ! COMMAND.100 ! 110 ! DATA ENTERED AS A STRING120 ! D$ IS DISPLAYED, AND THEN130 ! REPEATED CONTINUOUSLY.140 !150 OUTPUT 704; UPDT160 OUTPUT 704; UPDN170 ENTER 704;D$180 DISP D$190 GO TO 160200 END
NOTE: In the Dual Channel Mode, it is necessary to read the IEEE Bus twice to get A andB channel data.
Series 8500A Peak Power Meters
3-6 Manual No. 20790, Rev C, November 1998
Superceded by Revision D, March 2009

Update Data Continuously Output Mode
A string of four characters (UPDC) must be sent to the PPM to access this mode of operation:
If you are using BASIC with an HP Series 200 computer, the command might look like:
OUTPUT 704; UPDC
where:
OUTPUT is the GPIB command to send the letters following the semicolon.The 7 in 704 is the HP instruction that the output is to go via the GPIB interface.The 04 in 704 is the Listen/Talk address of the PPM. This address must be set from the frontpanel with the MENU key (see the MENU (6) description in Appendix B).
In the Update Data Continuously Mode, the PPM is ready to send a continuous stream of data pointswhile it is in TACS (Talker Active State). Upon entering TACS, the PPM will initiate a trigger reset andbe ready to record the next measurement. If the instrument is in the Peak or Graph Modes, themeasurement (power reading at the cursor location) will be taken the next time the instrument istriggered. Triggering can be either internal or external, depending on how the PPM has been configured.
Upon continuous triggering, measurement data points separated by commas will be sent by the PPM.Measurement data will continue to be sent through the GPIB, separated by commas, every time a triggeroccurs until the instrument has been untalked.
Sample Program:
10 ! THIS PROGRAM USES UPDC 20 ! UPDATE DATA CONTINUOUSLY. 30 ! THE DATA IS SENT BY THE PPM 40 ! WHEN IT IS TALK ADDRESSED 50 ! WITH THE ENTER STATEMENT 60 ! 70 OUTPUT 704; UPDC 80 ! 90 ! TAKE 10 READINGS AND100 ! DISPLAY THEM:110 FOR I=1 TO 10120 ENTER 704 USING K,#;A$,A(I)130 DISP A(I)140 NEXT I150 END
Remote Operation
Manual No. 20790, Rev C, November 1998 3-7Superceded by Revision D, March 2009

Plot Output Mode
In this mode the PPM sends HPGL plotter commands to plot a pulse on a compatible plotter. The PPMcommand PLOT initiates the capturing of a pulse and relevant information that will be plotted when thePPM enters TACS. The procedure to plot a graph over the GPIB consists of the following steps:
1. Prepare the PPM by entering the Graph Mode and obtaining the desired pulse profile to beplotted as shown in the PPM’s display window. Also select which sub-mode you want becausethe data shown on the plot is different for each sub-mode. For example, selecting the Markersub-mode will cause the marker values to be shown at the bottom of the plot.
2. Send the PLOT command to the PPM.
3. Listen-address the plotter.
4. Talk-address the PPM.
5. Release ATN, putting the PPM in TACS.
The PPM will terminate the plot with a carriage return followed by a line feed sent with EOI. Ifnecessary, the plot can be aborted by the untalking of the PPM during transmission of the plot.
Whenever the PLOT command is sent to the PPM while it is in the Graph Mode, the PPM will plot agraph of the selected Cursor, Pulse, or Marker sub-mode. See Figures 2-8, 2-10 and 2-9 for typical plotsof Graph sub-mode pulse profiles.
The following commands are used when it is desired to have any serial or code numbers appear on ahardcopy plot.
PLPNxxxxxx......
(x = string of 12 or less charactersPlot part number, ASCII string)
PLCNxxxxxx......
(x = string of 12 or less charactersPlot code number, ASCII string)
Any printable character is allowed, including spaces, except that all leading spaces prior to the firstnon-space character are stripped off, and not included in the number of characters in the string. Thestring must be terminated by a semicolon which is not printed. Therefore, no semicolons can becontained within a label string.
Sample Program:
10 ! THIS PROGRAM DEMONSTRATES 20 ! HOW TO MAKE THE PPM OUTPUT 30 ! A PULSE PROFILE DISPLAYED 40 ! IN THE GRAPH MODE TO A 50 ! DIGITAL PLOTTER. 60 ! 70 ! C$ AND P$ ARE STRINGS 80 ! THAT CAN BE SENT SO THAT A 90 ! CODE NUMBER & PART NUMBER100 ! ARE PRINTED ON THE PLOT BY110 ! THE PPM.120 !130 C$=ABCDEFGHIJKL140 P$=123456789012150160 ! AFTER ENTRY INTO THE GRAPH170 ! MODE, THE FOLLOWING
Series 8500A Peak Power Meters
3-8 Manual No. 20790, Rev C, November 1998
Superceded by Revision D, March 2009
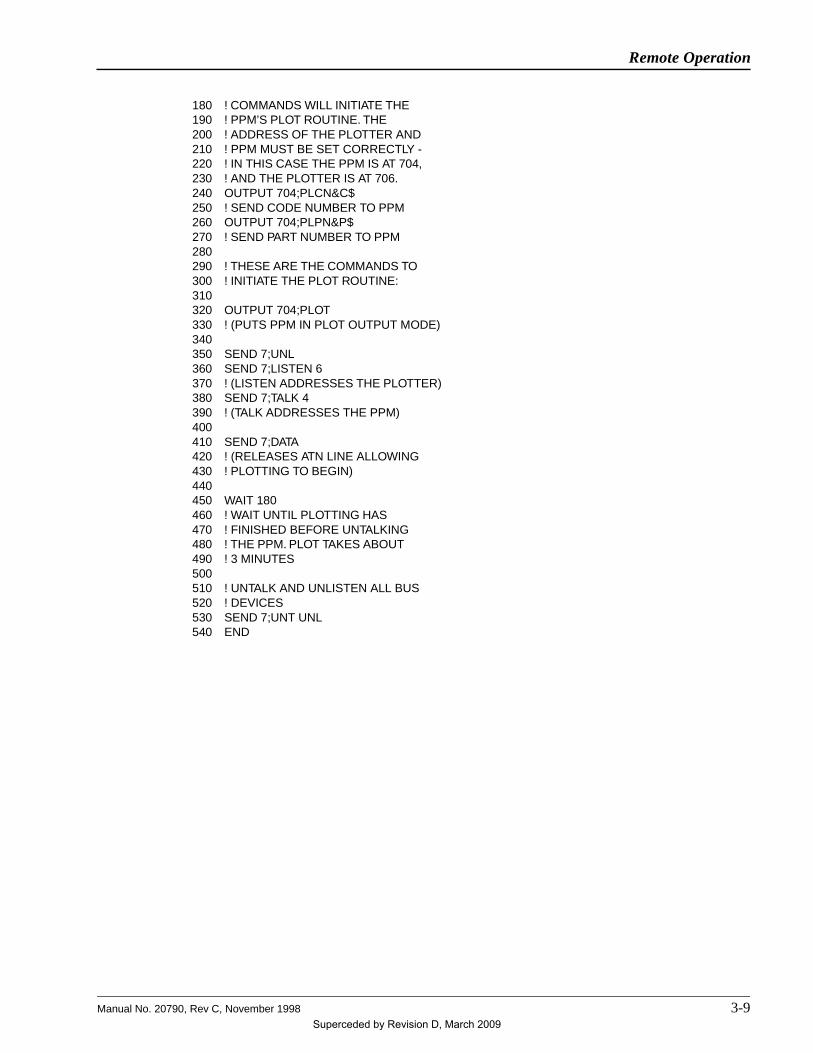
180 ! COMMANDS WILL INITIATE THE190 ! PPM’S PLOT ROUTINE. THE200 ! ADDRESS OF THE PLOTTER AND210 ! PPM MUST BE SET CORRECTLY -220 ! IN THIS CASE THE PPM IS AT 704,230 ! AND THE PLOTTER IS AT 706.240 OUTPUT 704;PLCN&C$250 ! SEND CODE NUMBER TO PPM260 OUTPUT 704;PLPN&P$270 ! SEND PART NUMBER TO PPM280290 ! THESE ARE THE COMMANDS TO300 ! INITIATE THE PLOT ROUTINE:310320 OUTPUT 704;PLOT330 ! (PUTS PPM IN PLOT OUTPUT MODE)340350 SEND 7;UNL360 SEND 7;LISTEN 6370 ! (LISTEN ADDRESSES THE PLOTTER)380 SEND 7;TALK 4390 ! (TALK ADDRESSES THE PPM)400410 SEND 7;DATA420 ! (RELEASES ATN LINE ALLOWING430 ! PLOTTING TO BEGIN)440450 WAIT 180460 ! WAIT UNTIL PLOTTING HAS470 ! FINISHED BEFORE UNTALKING480 ! THE PPM. PLOT TAKES ABOUT490 ! 3 MINUTES500510 ! UNTALK AND UNLISTEN ALL BUS520 ! DEVICES530 SEND 7;UNT UNL540 END
Remote Operation
Manual No. 20790, Rev C, November 1998 3-9Superceded by Revision D, March 2009

Temperature Difference Output Mode
This mode determines the difference in temperature for each detector since it was last calibrated. Themode provides a means to maintain measurement accuracy by allowing the software to determine when adetector Self-Cal is required. If detector temperature difference information is desired, the commandDTMP is sent to the PPM. The instrument will then be ready to output a data string in the followingformat (x and y = temperature reading digits; s = polarity):
DTPAsxx.x,DTPBsyy.y(CR)(LF-EOI)
This will be true with both the Model 8501A and 8502A instruments. If a detector is not present, thedigit portion of the string will read +00.0. The zeros can either mean no change in temperature differenceor no detector present. With the 8501A, the B reading will always be zeros.
Sample Program:
10 ! THIS PROGRAM EXTRACTS 20 ! TEMPERATURE INFORMATION 30 ! FROM THE PPM SO THAT A 40 ! CONTROLLER CAN DETERMINE 50 ! IF A SELF-CAL IS REQUIRED. 60 ! IF THE TEMP SINCE LAST SELF- 70 ! CAL IS MORE THAN +/-5 DEG-C, 80 ! SELF-CAL IS RECOMMENDED 90 DIM A$(19)100110120 OUTPUT 704;DTMP130 ENTER 704;A$140 DISP A$150 END
Status Byte
The PPM uses this mode to send its status byte as a character string. The value sent is the internal statusvalue. It is not exactly the same as the byte sent during a serial poll in which bit-7 is high when serviceis being requested (see Service Requests in Section 3.4). The character string sent out to represent thestatus value will consist of a four character head, STAT, followed by three digits. This output mode canonly be active when SRQ is disabled. Service request status bytes are not buffered when SRQ is disabled,so only the most recent status value will be output. The status value is followed by a carriage return,followed by a line feed sent with EOI.
Stand Alone Plot Output Mode
Plotting Without Using a Controller:
The PPM uses this mode to send HPGL digital plotter commands to plot a pulse, much as it does in thePlot Mode. The difference is that stand alone plots are initiated by commands from the front panel of thePPM. This is to allow plotting without the use of a controller (see Digital Plotting of Graphic Data inSection 2.9).
Stand Alone Plot Output Mode: PPM Internal Procedures:
These actions are performed by the PPM when the Stand Alone Plot is initiated from the front panel.Before the PPM can output plotter information, it is necessary to first enter the Graph Mode of operation.Chapter 2 of this manual contains the information required to prepare for and produce digital plots ofGraph Mode and Marker sub-mode data. The following paragraphs describe the PPM’s internalprocedures for GPIB interaction when front panel plots are to be made.
Series 8500A Peak Power Meters
3-10 Manual No. 20790, Rev C, November 1998
Superceded by Revision D, March 2009

When the PPM has drawn a complete pulse profile on its display, it is ready to act as a GPIB controller.When the plot routine is activated, the PPM checks to make sure that there is no other active controlleron the bus. If the PPM is in the Remote state, it implies that a controller is present and registers as aGPIB bus error. Also, all PPM service requests are generated by action on the GPIB, and are clearedwhen REN is not asserted (see Remote and Local Lockout in Section 3.2.4). Therefore, if the PPMinternally detects any abnormal status condition in its status byte, it will assume that there was recentactivity on the bus involving a controller and refuse to proceed further with the plot. It will also attempt aservice request to see if there is any response from the controller.
If the PPM does not detect an indication of another controller, it will assume that it is the onlycontroller-capable device on the bus, and will act as the system controller. Depending on the systemconfiguration, these checks made by the instrument may not be perfect.
NOTE: For proper system operation, no active controller can be on the bus when the frontpanel function is initiated.
While the PPM is checking the state of the bus, it will display the message Checking GPIB Interface, andthe keyboard will be inactive.
If the PPM does detect an indication of a controller on the bus, or if the PPM takes control of the bus andattempts to address the plotter but does not get a handshake, a GPIB bus error message will be displayedand a prompt will require F2 to be pressed to continue. If the PPM does not detect a bus error, a beepwill sound and normal operation will resume while the plot is being sent over the GPIB. Once plottinghas begun, control of the front panel will be returned to local.
NOTE: If you want to add serial and code numbers to the plot, use the procedure forMaking Plots in Section 2.9.
Remote Operation
Manual No. 20790, Rev C, November 1998 3-11Superceded by Revision D, March 2009

3.2.6 Command String Format
Control of the PPM is accomplished by using four-character mnemonic commands. Some of these requireone or more numerical entries (arguments). The command structure is intended to be taken literally; thereare no optional formats. Thus, if two arguments are specified for a command, both must be given for thecommand to be processed.
A character string is terminated with a line feed character and/or an EOI. Carriage returns are ignored.Therefore, a carriage return/line feed sequence will act as a string terminator and will be treated as a linefeed. More than one command (and respective arguments) can be sent in a command string as long as thestring does not exceed 128 characters, including the terminator. If an EOI is sent and the last character isnot a line feed, only 127 characters can be sent. None of the commands can be processed until the stringis terminated, and then they will be processed in the order they were given (see Output Modes inSection 3.2.5 regarding conflicting output commands).
When the command string is received, it is first checked for syntax and numerical values, and commandsare reviewed to make sure they are valid. If a syntax error or an invalid data error is detected, or theexecution of the command string would lead to an operation error, then none of the commands will beexecuted and a service request will be generated if SRQ is enabled.
A very forgiving syntax is allowed since the PPM can distinguish between any command and anyargument, with no separator character required between commands or a command and its argument. Theonly time a separator character is required is between arguments when the command has two or morearguments. A separator is defined to be a space, a comma, or a semi-colon. Any number of separators areallowed before the first command, between a command and an argument, between arguments, betweenthe last argument of a command and the next command, or at the end of the string without effecting thePPM’s interpretation of the command string. Commands can be in upper or lower case format.
An argument consists of a digit string which can optionally be preceded by a positive (+) or negative (-)sign. If no sign is present, the number is assumed to be positive. The digit string can also contain adecimal point if desired. The dimension of each argument is fixed, therefore no dimensional identifier isneeded or allowed, only a number. This will be described in the command description to follow. 1018Bcommand arguments follow a different format as is discussed in Section 3.5.
3.2.7 Power Measurement Data Output Format
The measurement data output formats transmitted by the PPM over the GPIB depend on whether the PPMis in the dBm or W power mode of operation. These modes are entered by using GPIB commands asdescribed in Section 3.3.3 or, when the PPM is not in the Remote mode, by pressing [dB/mW] on thefront panel.
Power measurements over the GPIB are taken only during the Update Trigger Reset or Update DataContinuously output modes (see Section 3.2.5).
To initiate a power measurement over the GPIB, a command is sent to the PPM from the controller andthen talk-addressed. When the PPM is triggered, it will transmit its data through the GPIB to thecontroller. See the following command descriptions for the commands required to take data. Themeasurement data strings are discussed in subsequent sections.
Log (dBm) Data Format
When the PPM is in the dBm mode (as indicated in the display), the first three letters of the data stringare DBM. This indicates that the data represents a dBm value. The following letter indicates whichdetector (channel A or B) was taking the measurement. This is followed by a polarity sign, and then astring of five digits with a decimal point after the third digit.
Each measurement taken in the Update Trigger Reset Mode will be terminated by a carriage returnfollowed by a line feed sent with EOI. Measurements taken in the Update Trigger Continuously Modewill be separated with commas. Examples are:
Series 8500A Peak Power Meters
3-12 Manual No. 20790, Rev C, November 1998
Superceded by Revision D, March 2009

Update Trigger Reset Mode:
DBMA-012.73(CR)(LF-EOI)DBMB+002.47(CR)(LF-EOI)
Update Data Continuously Mode:
DBMA+016.74DBMA+018.23DBMA+017.34(and so on)
The actual measurement string (less terminating and delimiting characters for each data point) willalways be 11 characters long.
Linear Power Data Format
When the PPM is in the linear power mode (as indicated in the display), the first three characters of thedata string will be PWR. This indicates that the measurement is a linear value, with the units always inWATTS. As with DBM, the next character indicates which detector (channel A or B) was taking themeasurement. This is always followed by a value in engineering notation. The value consists of fourdigits and a decimal point. These are followed by an E, then a polarity sign and two more digits. Thedigits following the E are always multiples of three. This makes it easier to determine if the data is beinggiven in terms of microwatts, milliwatts, nanowatts, etc.
Each measurement taken in the Update Data Trigger Reset mode will be terminated by a carriage returnfollowed by a line feed sent with EOI. Measurements taken in the Update Data Continuously mode willbe separated by commas. Examples are:
Update Data Trigger Reset mode:
PWRA31.61E-06(CR)(LF-EOI)for 31.61 microwatts
PWRB634.7E-03(CR)(LF-EOI)for 634.7 milliwatts
Update Data Continuously mode:
PWRA64.98E-06,PWRA65.23E-06,PWRA89.32E-06,
and so on
The actual measurement string (less terminating or delimiting characters for each data point) will alwaysbe 13 characters long.
Remote Operation
Manual No. 20790, Rev C, November 1998 3-13Superceded by Revision D, March 2009

3.3 GPIB Command DescriptionsThere are approximately 100 different commands available to program the 8500A for use on the GPIB.This section provides functional information pertaining to the commands with the least complex materialcovered first.
For most applications the automatic features of the PPM provide easy methods of making pulsedmeasurements. However, a great deal of flexibility and control is available if you prefer to work with rawdata.
An alphabetical listing of all commands is in the Command Summary in Table 3-3.
The PPM has the following general capabilities:
• The ability to measure and output CW or Peak power, or a Ratio of two signals in Linear(Watts) or Log (dBm) format.
• In some applications, the PPM can output the microwave frequency at which the powermeasurement is being taken.
• Graphically display pulse profiles automatically.
• Markers can be defined on the pulse.
• Rise time, fall time, and pulse width can be measured and output automatically.
• Time differences between selected markers can be measured and output automatically.
• Self-test capabilities are built in.
• The PPM Calibration function automatically linearizes the detector over a 50 dB power rangefor the most accurate power measurements.
• The temperature of the detectors can be monitored to verify whether the detector should becalibrated.
• The PPM makes use of a PROM with stored frequency response data contained in the RFdetector assembly. The instrument uses the stored data to automatically compensate fordetector frequency response variations. A rear panel connector is available on the unit toconnect a V/GHz (V α F) signal to allow for automatic frequency selection and correction ofmeasured power.
• The use of balanced detectors enhances accuracy when used in situations where evenharmonics are present.
• Setups can be stored or recalled to and from the PPM’s non-volatile memory by GPIBcommands as well as manually through the front panel.
• Graph displays can be plotted on digital plotters. In addition, data pertaining to a pulse profilecan be output to the controller.
• A Data Fast mode disables the front panel display, allowing faster bus operation.
• Frequency information can be hidden when the PPM is used for classified testing.
NOTE: The Model 8501A instrument will respond to the same command sets as the Model8502A. The only exception is that the 8501A responds only to commands relating tochannel A.
Series 8500A Peak Power Meters
3-14 Manual No. 20790, Rev C, November 1998
Superceded by Revision D, March 2009
Instrument functions that take a specific amount of time to complete will be noted with an asterisk (*) inthe following discussion.
During the time the PPM is processing a function such as calibration, zeroing, or self test, the instrumentwill continue to be active on the bus. Any new commands may not be received if previous activity is notalready completed. No output will be given and, if any commands are sent by the controller, only the firstbyte will be accepted. The PPM will then send Not Ready for Data until the function is complete.
When the particular function completes, the PPM will request service and send SRQ if SRQ has beenenabled. Successful completion of the task is verified by checking the value of the status byte. A listingof Status Codes is given in Section 3.6. If SRQ has not been enabled, the controller can only learn theresult of the operation by asking for the status byte with the STAT command.
3.3.1 Common Mode Functions
Calibration Commands
It is advisable to use the PPM’s SRQ capabilities to monitor whether the calibration has completed and issuccessful or not. A serial poll can be conducted and the returned Status value interpreted. SeeSection 3.4 for SRQ features, and Section 3.6 for applicable Status Code values.
* CALA Calibrate channel A detector
* CALB Calibrate channel B detector
Temperature Difference Since Last Calibration Commands
DTMP Output the Difference in the temperature of each detector since calibration. Thiscommand causes the temperature to be read from each detector (or whatever detectoris connected). It will be formatted as described under Temperature Difference OutputMode in Section 3.2.5, and is useful for determining whether recalibration ofdetectors should take place. Normally the PPM can maintain accuracy within ±5 °Cof the temperature of calibration.
Autozero Detectors Commands
* ZERA Zero channel A detector
* ZERB Zero channel B detector
Store or Recall Setup Commands
STORnn Store current PPM settings in non-volatile setup memory number n.n = number between 1 and 10.
RECLnn Recall PPM setting from non-volatile memory n, and make it the current setting.n = number between 0 and 10. Setup number 0 cannot be used for storage. It is thelast setup before power was turned off or the PPM received a Device Clear from theGPIB controller.
Hide and Unhide Frequency Information Commands
FQHD Hide the frequency information
FQDS Display the frequency information
Remote Operation
Manual No. 20790, Rev C, November 1998 3-15Superceded by Revision D, March 2009

Output Status Byte Information Command
STAT Output status byte. This command will only be effective when SRQ is disabled. If itis received while SRQ is enabled, a service request will be generated.
Typical Program Lines:
OUTPUT 704;STATENTER 704;A$PRINT A$
SRQ Related Commands
SRQE Enable SRQ
SRQD Disable SRQ
UNDD Disable SRQ only for under-range conditions. (Permits continuing data outputwithout undesired SRQ interference.)
UNDE Enable SRQ for under-range conditions.
Power Limits
The purpose of setting power limits is to alert the controller of two possibilities having occurred. Theseare:
A. Over-range: Warns that the detector (or other component) may have been damaged, and data takenmay be invalid.
B. Under-range: Warns that the power level being measured is low and may be inaccurate.
The PPM can be enabled to generate an SRQ for under-range conditions. The point at which the PPMsends an SRQ is determined by the MINP command. Data output during an under-range condition is asfollows:
Log Mode: -99.99dBm
Linear Mode: 0.000E-99
Over-range conditions always generate an SRQ (if SRQ is enabled), but normal data is still output. Itshould be kept in mind that if the detector is exposed to power levels in excess of +23 dBm, not only willthe PPM’s measurement accuracy be degraded, but damage or complete destruction of the detector’sdiode element can occur.
The commands for setting power limits are:
MAXPsnn.nn Set power level (in dBm) for over-range condition.s = polarity; n = dBm; +21.00 max, -10.00 min.
MINPsnn.nn Set power level (in dBm) for under-range condition.s = polarity; n = dBm; -15.00 max, -50.00 min.
Series 8500A Peak Power Meters
3-16 Manual No. 20790, Rev C, November 1998
Superceded by Revision D, March 2009

3.3.2 Measurement Data Correction
The manner in which the PPM is able to make very fast peak power measurements is dependent on theusage of zero bias schottky diode detectors as power sensing elements. These diodes have typicalrise-times of less than 10 nanoseconds making them useful for pulsed RF applications. However, atmicrowave frequencies, it is necessary to compensate for the detector’s non-linearity with frequency.
Each Giga-tronics detector used in the PPM has a built-in PROM which contains frequency correctiondata. Depending on the mode of operation, the PPM can be instructed to automatically subtract out thefrequency non-linearity error from the power measurement being made.
The PPM needs to know the frequency of operation for this automatic correction to take place. This canbe done at the front panel, over the GPIB, or by the use of the Voltage Proportional to Frequency feature(V α F). The V α F is an analog voltage connected to the PPM’s rear panel EXTERNAL FREQUENCYinput connection. A voltage is usually available from most sweepers called V/GHz with a coefficient of1V/GHz. This voltage can be converted to digital information by the PPM, and used as a frequency inputinstead of having to enter it by some other means.
In addition to automatic frequency correction, it may be desired in some applications to use manualcorrections based on specific measurements rather than the factory-supplied data in the detector’s PROM.This is known as Cal Factor. (Some power meters on the market use the term % efficiency, but it isbasically the same thing.) Cal Factor is expressed in dB, and is the amount of power that must be addedto or subtracted from the measurement so that the data will be correct.
Another Data Modifier called Offset can also be used. Complex microwave test setups sometimes includeattenuators or couplers to reduce high power signals to safe levels that can be measured by delicateinstruments such as the PPM. The Offset feature allows the subtraction of residual attenuator or couplererrors from the measurement.
The preceding Data Correction commands will be discussed in the following sections.
Detector PROM Correction: User Supplied Frequency
FREQff.ff
(Where ff.ff is the frequency of the correction.)
Correction is determined by taking a user-supplied frequency (ff.ff) and referencing data in a PROM inthe detector.
Min Value: 0.01 GHzMax Value: 110.00 GHz
Sample Program:
10 ! THIS PROGRAM SETS THE 20 ! FREQUENCY FOR DETECTOR 30 ! RESPONSE CORRECTION FOR 40 ! THE PPM 50 ! 60 F=5.25 ! PPM FREQUENCY SETTING 70 ! 80 ! SEND COMMAND TO PPM 90 OUTPUT 704 USING 100; FREQ,F100 IMAGE 4A,DDD.DD110 END
Remote Operation
Manual No. 20790, Rev C, November 1998 3-17Superceded by Revision D, March 2009

Detector PROM Correction: External Frequency
(V/GHz/Freq Ref)
FPRVvv.vv,ss.ss,mm.mm
(Where v, s and m are the arguments to scale the voltage input at the PPM FREQUENCY INPUTconnection.)
Correction to be applied for the frequency response of the detector will be determined from threeuser-supplied values to properly reference data in the PROM in the detector. The three arguments arerespectively:
A. A coefficient representing the voltage proportional to frequency of the sweeper’s V/GHz or Freq Refoutput:
Min Value: 0.10V/GHzMax Value: 10.00V/GHz
The most common values for this coefficient are 0.5 and 1.00V/GHz. Consult the instruction manualfor the sweeper being used to obtain the correct coefficient.
B. The minimum coefficient voltage corresponding to the minimum frequency of the sweeper:
Min Value: 0.0VMax Value: +19.000V
Example: If the sweeper’s V/GHz is 0.5V and the minimum start frequency is 2.0 GHz, then thisvalue would be 2 x 0.5 = 1V.
C. The minimum frequency of the sweeper:
Min Value: 0 GHzMax Value: 110.00 GHz
Sample Program:
10 ! PPM EXTERNAL FREQUENCY MODE 20 G=5 ! VOLTS/GHZ 30 V=1 ! V/GHZ START FREQUENCY 40 F=2 ! SWEEPER START FREQUENCY 50 OUTPUT 704 USING 60;FPRV,G,V,F 60 IMAGE 4A,3(DD.DD) 70 END
Series 8500A Peak Power Meters
3-18 Manual No. 20790, Rev C, November 1998
Superceded by Revision D, March 2009

External Frequency (V/GHZ) and Output Frequency to Controller Command
FPVOvv.vv,ss.ss,mm.mm
(Where v, s, and m are the arguments required to scale the voltage input at the PPM’s rear panelFREQUENCY INPUT connection.) These are the same as described previously for FPRV.
This command causes the same action as the FPRV command but in addition, asks the PPM to output tothe controller the converted frequency information from the PPM’s rear panel external frequency input.
NOTE: When using FPVO and operating in the UPDC mode, there will be a stack buildup. Old frequency and power data will be output in applications such as swept powermeasurements.
Sample Program:
10 ! PPM EXTERNAL FREQUENCY PLUS 20 ! FREQUENCY OUTPUT MODE 30 OUTPUT 704;UPDT ! SELECT OUTPUT 40 ! MODE. SELECT EXTERNAL FREQ 50 ! MODE AND COLLECT A DATA 60 ! POINT AND ITS FREQUENCY 70 G=5 ! VOLTS/GHZ 80 V=1 ! V/GHZ START FREQUENCY 90 F=2 ! SWEEPER START FREQUENCY100 IMAGE 4A,3(DD.DD)110 OUTPUT 704 USING 100;FPVO,G,V,F120 TRIGGER 704130 ENTER 704 USING 4A,7D,X,4A,6D;A$,B,C$,D140 PRINT USING K,;POWER ,A$, IS ,B150 PRINT USING K,;FREQ ,C$, IS ,D, GHZ160 END
Remote Operation
Manual No. 20790, Rev C, November 1998 3-19Superceded by Revision D, March 2009
User-Defined Detector Calibration Factor Commands
Detector calibration factor for channel A in dB (cc.cc):
DCFAcc.cc
Min Value: -9.99 dBMax Value: +9.99 dB
Detector calibration factor for channel B in dB (cc.cc):
DCFBcc.cc
Min Value: -9.99 dBMax Value: +9.99 dB
Sample Program:
10 ! THIS PROGRAM SHOWS HOW TO USE 20 ! THE PPM CAL FACTOR FEATURE 30 ! 40 ! CHANNEL A CAL FACTOR 50 ! COMMAND FOR 2.56 dB: 60 OUTPUT 704;DCFA;2.56 70 ! 80 ! CHANNEL B CAL FACTOR 90 ! COMMAND FOR 2.56 dB100 OUTPUT 704;DCFB;2.56110 ! 120 END
Offsetting Measured Data: dB Offset Commands
Channel A offset:
OFFAsnn.nn
(s = polarity; nn.nn = dB value)
Min Value: -40.00 dBMax Value: +90.00 dB
Channel B offset:
OFFBsnn.nn
(s = polarity; nn.nn = dB value.)
Min Value: -40.00 dBMax Value: +90.00 dB
Series 8500A Peak Power Meters
3-20 Manual No. 20790, Rev C, November 1998
Superceded by Revision D, March 2009
3.3.3 Mode Selection and Control
This section describes the various modes of operation available with the PPM, with the exception of thesub-mode functions of the Graph Mode. These are described in Section 3.3.5.
Commands or functions that affect a specific mode of operation are either given or referred to in thefollowing command listings. It should be kept in mind that it is sometimes possible to combine modes,therefore care must be taken to observe the rules and arguments set forth.
Select Log or Linear Power Measurement Format Commands
DBMW dBm measurement format display and GPIB output.
WATT Linear measurement format (mW) display and GPIB output.
Typical Program Line:
OUTPUT 704;WATT
Select Measurement Mode Commands
(Except Graph and Ratio Modes)
CW Power Commands
CWPA CW power, channel A
CWPB CW power, channel B
CWAB CW power, channels A & B
A CW related command is:
AVCWnnn
Select number of averages n for CW power measurements. Higher numbers reduce noise effects andstabilize readings at low power levels.
(n = number between 1 and 999)
Peak Power Commands
The Peak Power Mode must be used very carefully. Power measurements in this mode depend on theoccurrence of a trigger, and the positioning of the cursor on the pulse to be measured. For moreinformation, refer to Selecting Peak Power Operation in Section 3.2.5.
To enter the Peak Power Mode use:
PKPA Peak Mode for Channel A only
PKPB Peak Mode for Channel B only
PKAB Peak Mode for Channels A & B
Remote Operation
Manual No. 20790, Rev C, November 1998 3-21Superceded by Revision D, March 2009

Related Peak Power Commands
AVPK Select number of averages, n, for Peak power measurements. Higher numbers willreduce noise effects and provide more stability at low power levels.
(n = number from 1 to 999 - higher than 4 is recommended).
TRGAsnn.nn Internal trigger level, channel A
TRGBsnn.nn Internal trigger level, channel B(s = polarity; n = dBm)Min Value: -10.00 dBmMax Value: +16.00 dBm
TRGE External triggering
NOTE: It is important to remember that no data can be taken in the Peak Mode unless atrigger is occurring. This is indicated by the flashing of the New Data light on the frontpanel. See External Triggering in Section 3.2.5.
RDLAnnnnnn.nn Set channel A reference delay. (Arbitrary timing point to which other timingmeasurements are related.) (n = microseconds)
RDLBnnnnnn.nn Set channel B reference delay. (Arbitrary timing point to which other timingmeasurements are related.) (n = microseconds)Min Value: 0 µsMax Value: 213999.97 µs
CDLAsnnnnnn.nn Set channel A cursor delay. Sets timing position of the Cursor on the graphicdisplay. The Cursor is the vertical line located where the power reading (CSR PWR)is being taken. [Timing is related to the Reference Delay (REF DLY)].(n = microseconds; s = polarity)
CDLBsnnnnnn.nn Set cursor delay for channel B. Sets timing position of the Cursor on the graphicdisplay. The Cursor is the vertical line located where the power reading (CSR PWR)is being taken. [Timing is relative to the Reference Delay (REF DLY)].(n = microseconds; s = polarity)Min Value: 0 - Reference DelayMax Value: 213999.97 µs - Reference Delay
Sample Program:
10 D=1 ! CURSOR DELAY IN 20 ! MICROSECONDS 30 ! 40 ! CHANGE CHANNEL A CURSOR 50 ! DELAY 60 OUTPUT 704;CDLA;D 70 ! 80 ! CHANGE CHANNEL B CURSOR 90 ! DELAY100 OUTPUT 704;CDLB;D110 END
Series 8500A Peak Power Meters
3-22 Manual No. 20790, Rev C, November 1998
Superceded by Revision D, March 2009

3.3.4 Commands for Retrieving Data From the PPM
UPDC Select Update Data Continuously Mode. The PPM will output a continuous streamof power measurement data points separated by commas. Every time the PPMreceives a trigger a new data point is added to the stream. The formats discussed inA and B below can then occur:
A. When using the FREQ, CALA (A Cal Factor), CALB (B Cal Factor), or FPRV (Rear PanelFrequency Input) methods for detector frequency response correction (NOT FPVO), the PPM’s LinearMode data output string for Channel A will be:
PWRAnn.nnEsnn,PWRAnn.nnEsnn,PWRAnn.nnEsnn
(n = linear power in watts; Esnn = exponent)
This example shows a data string for 3 triggers. Subsequent triggers will produce more data pointsseparated by commas in the form of PWRAnn.nnEsnn. If channel B is in use, the header before the datapoints would be PWRB instead of PWRA.
The PPM’s dBm mode data output string for channel A will be:
DBMAsnnn.nn,DBMAsnnn.nn,DBMAsnnn.nn
(s = polarity; n = dBm)
This example shows a data string for 3 triggers. Subsequent triggers will produce more data pointsseparated by commas in the form of DBMAnn.nnEsnn. If channel B is in use, the header before the datapoints would be DBMB instead of DBMA.
B. When using the FPVO (Rear Panel Frequency Input and Frequency Output) method for detectorfrequency response correction, the PPM’s Linear Mode data output string for Channel A will be inthe following form:
PWRAmm.mmEsee,FRQAfff.ffE+09,PWRAnn.nnEsee,FRQAggg.ggE+09
(m = first power data point;f = first frequency data point;n = second power data point;g = second frequency data point;Esee = exponent for power in watts;E+09 indicates frequency is in GHz.)
This example shows a data string for 2 triggers. Subsequent triggers will produce more data pointsseparated by commas in the form of PWRAnn.nnEsnn,FRQAfff.ffE+09. If Channel B is being used, theheaders before the data points would be PWRB and FRQB. See above for a description of dBm headerand data formats.
UPDT Select Update Data Trigger Reset Output Mode. Prepares the PPM for powermeasurement data taking routines using UPDN.
UPDN Update Data Now. Take a power reading when the next trigger occurs. Thiscommand is only operational if the PPM is in the Update Trigger Reset Mode. SeeUPDT.
The PPM will output a single data point each time UPDN is received. The output formats are the same asthose described under UPDC. If FPVO is being used, the frequency at which the power measurement wastaken is also output. See UPDC and FPVO.
Remote Operation
Manual No. 20790, Rev C, November 1998 3-23Superceded by Revision D, March 2009

3.3.5 Graph Mode GPIB Operation
Using the Graph Mode instead of the Peak Mode allows autoscaling of a pulse, and provides you with adisplay of the pulse. The Pulse and Marker sub-modes allow automatic timing measurements to be made.You must first place the PPM in the appropriate sub-mode before using the timing measurementcommand.
In the Graph Mode, the PPM can use a plotter to draw the shape of the pulse. In the Cursor sub-mode,the delay and trigger parameters are written on the plot. The Pulse and Marker sub-modes add the resultsof their respective timing measurements.
Delay values used by the instrument (Cursor, Start, and Marker, but not Window) are all displayed andoutput relative to the Reference Delay at the time the delays are specified. When the Reference Delay ischanged, it will effect all of the other indicated delay values.
The real timing of the functions described above (relative to the trigger) remains the same, but thedisplayed and GPIB output times of these functions are all in relation to the Reference Delay. When theReference Delay changes, the other delays change accordingly. For example, if the Cursor Delay was 5 nsand the Reference Delay was increased by 2 ns, the Cursor Delay would decrease to 3 ns. Therefore,Reference Delay entries should always be made first. Most applications and measurements will notrequire changing the Reference Delay from its default setting of 0.000 nanosecond.
The information to be given next is in ascending order of complexity. All functions that provide resultson an automatic basis will be covered first. This should reduce programming time by allowing the PPM’sinternal software to take care of various tasks such as rise time.
Obviously, there are some types of pulses that cannot easily be measured automatically. If it is requiredthat algorithms be devised to extract pulse information, the PPM should serve this purpose well by usingthe manual commands and functions which will be covered later in this section.
Graph Sub-Mode Selection Commands
GRFA Select Graphic display mode (Cursor sub-mode), channel A.
GRFB Select Graphic display mode (Cursor sub-mode), channel B.
MRKA Select Marker sub-mode display, channel A.
MRKB Select Marker sub-mode display, channel B.
PULA Select Pulse Parameters sub-mode, channel A.
PULB Select Pulse Parameters sub-mode, channel B.
Automatic Functions of the Graph Mode
The following commands will instruct the PPM to automatically carry out a procedure of some kind. Inmost cases, only instrument settings are made. In some cases, settings are made and appropriateinformation is output to the controller.
When using the PPM’s graphic capabilities, it should be kept in mind that any operations are onlyapplicable to Pulse measurements. All pulse operations require a trigger of some kind. Therefore, beforeattempting GPIB operations it is advised to become familiar with the manual operation of the PPM. Toensure that the instrument will trigger properly, the Internal Channel A, Internal Channel B, or theExternal Trigger function must be selected.
NOTE: Failure to trigger for any pulse operation over the GPIB will result in placing thePPM in a Waiting for Trigger state.
Series 8500A Peak Power Meters
3-24 Manual No. 20790, Rev C, November 1998
Superceded by Revision D, March 2009

Reading and Defining Pulse Parameters
The following commands read the current values set for the pulse parameters:
* PUFT Get Pulse Fall Time. The unit will respond with:
FALAddddddE-e (If channel A selected)FALBddddddE-e (If channel B selected)
(d = seconds; e = exponent)
NOTE: *PUFT, *PURT, and *PUWD operate only in the Graph Mode.
* PURT Get Pulse Rise Time. The unit will respond with:
RISAddddddE-e (If channel A selected)RISBddddddE-e (If channel B selected)
(d = seconds: e = exponent)
* PUWD Get Pulse Width. The unit will respond with:
WIDAddddddE-e (If channel A selected)WIDBddddddE-e (If channel B selected)
(d = seconds: e = exponent)
The following commands set new values for the pulse parameters:
PUFSddd Set Pulse Fall Time - Start %.
Where d = % expressed in 0.1% units. Allowable range is 1 to 999 (0.1% to 99.9%)
PUFEddd Set Pulse Fall Time - End %
Where d = % expressed in 0.1 % units. Allowable range is 1 to 999 (0.1% to 99.9%)
PURSddd Set Pulse Rise Time - Start %
Where d = % expressed in 0.1% units. Allowable range is 1 to 999 (0.1% to 99.9%)
PUREddd Set Pulse Rise Time - End %
Where d = % expressed in 0.1 % units. Allowable range is 1 to 999 (0.1% to 99.9%)
PUWSddd Set Pulse Width - Start %
Where d = % expressed in 0.1 % units. Allowable range is 1 to 999 (0.1% to 99.9%)
PUWEddd Set Pulse Width - End %
Where d = % expressed in 0.1% units. Allowable range is 1 to 999 (0.1% to 99.9%)
Remote Operation
Manual No. 20790, Rev C, November 1998 3-25Superceded by Revision D, March 2009
Automatic Window Delay Selection Related Commands (Autoscaling)
* AUTO Autoscale Current Pulse Profile. If SRQ is enabled, it will be sent at the completionof Autoscaling. Successful Autoscaling can be determined by checking the value ofthe Status byte.
AVASnnn Select the Number of Averages, n, for Autoscaling (1 to 999). This command can beuseful when attempting to Autoscale a pulse in a noisy environment. The morestable the pulse to be Autoscaled is, the less averages required. This setting isindependent of other averaging settings such as AVCW or AVPK.
The number of averages set by this command is never reset to a default value (noteven by a Device Clear command). Therefore, it is advisable to set the desired valueprior to commencing the Autoscaling function, or to set it once at the beginning ofthe program and not change its value again.
ASDLnnnnnn.n Select Maximum Expected Pulse Width for Autoscaling. The purpose of thiscommand is to allow autoscaling of narrow pulses with high repetition rates.(n = 0.5 to 200,000 microseconds).
The maximum expected pulse width set by this command is never reset to a defaultvalue (not even by a Device Clear command). Therefore, it is advisable to set this tothe desired value prior to activating the Autoscale function.
3.3.6 Marker Timing Measurements
A trigger must occur on a consistent basis to make repeatable pulse measurements for profilingoperations. Erratic pulse trains or profiles can lead to errors or confusion. In situations where pulsewidths or repetition rates are likely to continually vary, it would be better to make single pulsemeasurements in the Peak Mode. However, to make single pulse measurements, you should know wherethe Cursor Delay should be set to make the measurement.
The commands in the Automatic Timing description in this section allow for easy measurement of themost commonly desired pulse parameters. These include rise time, fall time, pulse width andcombinations thereof. The automatic measurements are determined by conventions commonly used in themicrowave industry. For example, rise time would be from the 10% to 90% power points on the leadingedge of the pulse. However, there are still some gray areas which must be taken into account when youuse these automatic timing functions.
These gray areas include deciding what point on the pulse should be considered as the 100% powerreference point for the PPM to use when determining the rise time, fall time, and pulse width.
It is obvious that, in most situations, it is more desirable to use the center of the pulse as the referencepoint. Special situations can, of course, occur where the setting of the reference point would be somewhatarbitrary.
The PPM handles the above problems in two ways. The first method is when Autoscaling is used. TheReference Power level is automatically set to a point more or less centered in time between the 3 dBpoints on the pulse. The power axis of the display is also adjusted so that the point selected as thereference point is set to the top of the display as 100%.
The second method is to allow you to set the Reference Power at some desired level. Powermeasurements can be taken at different points along the top of the pulse to find the optimum point atwhich to set the Reference Power. These decisions are based on the types of pulses it is expected will beencountered.
Series 8500A Peak Power Meters
3-26 Manual No. 20790, Rev C, November 1998
Superceded by Revision D, March 2009

Reference Power Related Commands
PRFAsnn.nn Set Channel A Reference Power for graphic display. Sets 100% power referencepoint as a reference for automatic timing measurements. It also serves to center thepulse on the power axis so that displays and plots of pulses with low amplitudes areexpanded to show more resolution.(s = polarity; nn.nn = dBm value)
PRFBsnn.nn Set Channel B Reference Power for graphic display. Sets the 100% power referencepoint as a reference for automatic timing measurements. It also serves to center thepulse on the power axis so that displays and plots of pulses with low amplitudes areexpanded to show more resolution.(s = polarity; nn.nn = dBm value)Min Value: -60.00 dBm, Max Value: +110.00 dBm
Sample Program:
10 P=0 ! CHANNEL A REFERENCE 20 ! POWER IN DBM 30 ! 40 ! CHANGE CHANNEL A REFERENCE 50 ! POWER 60 OUTPUT 704;PRFA;P 70 ! 80 ! CHANGE CHANNEL B REFERENCE 90 ! POWER100 OUTPUT 704;PRFB;P110 END
NOTE: RPOA and RPOB are operable only in the Graph Mode.
RPOA Output Current Reference Power for Channel A. If the PPM is in the linear mode itwill output:
RFALnn.nnEsnn
(nn.nn = Watts; Esnn = exponent)
If the PPM is in the dBm mode it will output:
RFADsnn.nn
(nn.nn = dBm; s = polarity)
RPOB Output Current Reference Power for Channel B. Linear mode output is:
RFBLnn.nnEsnn
(nn.nn = Watts; Esnn = exponent)
The dBm mode output is:
RFBDsnn.nn
(nn.nn = dBm; s = polarity)
Remote Operation
Manual No. 20790, Rev C, November 1998 3-27Superceded by Revision D, March 2009

Automatic Timing Measurement Commands
When making timing measurements, the delay window should be set so that the time to be measuredcorresponds to at least one third of the total delay. For example, do not use a delay window of 10 µs tomeasure rise times faster than 3 µs; go to a shorter delay window.
(Note: *RISE, *FALL, *PLWD, *RSFL, and *RSWD are operable only in the Marker Mode)
*RISE Measure and output rise time of the displayed pulse profile. Rise time is from the10% power point to the 90% power point on the rising edge of the pulse. Outputformat for channel A is:
RISAnn.nnnEsnn
(n = seconds; Esnn = exponent)
Output format for channel B is:
RISBnn.nnnEsnn
*FALL Measure and output fall time of the displayed pulse profile. Fall time is from the90% power point to the 10% power point on the falling edge of the pulse. Outputformat for channel A is:
FALAnn.nnnEsnn
(n = seconds; Esnn = exponent)
Output format for channel B is:
FALBnn.nnnEsnn
*PLWD Measure and output pulse width of the displayed pulse profile. Pulse width is thetime between the 50% power points on the rising and falling edges of the pulse.Output format for channel A is:
WIDAnn.nnnEsnn
(n = seconds; Esnn = exponent)
Output format for channel B is:
WIDBnn.nnnEsnn
*RSFL Measure and output rise time and fall time of the displayed pulse profile. Fordefinitions, see *RISE and *FALL descriptions. Output format for channel A is:
RISAnn.nnnEsnn,FALAnn.nnnEsnn
(n = seconds; Esnn = exponent)
Output format for channel B is:
RISBnn.nnnEsnn,FALBnn.nnnEsnn
Series 8500A Peak Power Meters
3-28 Manual No. 20790, Rev C, November 1998
Superceded by Revision D, March 2009

*RSWD Measure and output rise time and pulse width of displayed pulse profile. Fordefinitions of rise time and pulse width, see *RISE and *PLWD descriptions. Outputformat for channel A is:
RISAnn.nnnEsnn,WIDAnn.nnnEsnn
(n = seconds; Esnn = exponent)
Output format for channel B is:
RISBnn.nnnEsnn,WIDBnn.nnnEsnn
*WDFL Measure and output pulse width and fall time of displayed pulse profile. Fordefinition of fall time and pulse width, see *FALL and *PLWD descriptions. Outputformat for channel A is:
WIDAnn.nnnEsnn,FALAnn.nnnEsnn
(n = seconds; Esnn = exponent)
Output format for channel B is:
WIDBnn.nnnEsnn,FALBnn.nnnEsnn
3.3.7 Manual Marker Placement/Timing Measurement Commands
The PPM has a very forgiving command syntax. It is possible to send many commands in one string. Forexample, it is possible to use one string to place four different markers and then have the PPM outputtwo pairs of delay differences.
Due to the upgrading of the software functions in the 8500A instruments, some of the commands shownin this section will not be required when new code is written for the 8501A/8502A meters. Thecommands are retained in this manual for users with programs written for older 8500 instruments, andwho want to cross-reference for the new 8500A instruments. If old code has been written for an 8500instrument and includes some of these commands, the program will still operate with the 8500A but thecommands will have no function. The term No Op is used in the descriptions for these commands. Thecommands that fall into this category will be defined.
The MRKA (or B) command must always be executed before any other marker bus commands will beaccepted.
MKPRn,xx.x
Place Marker n (1 to 4) on the rising edge of the pulse at the % reference power defined by xx.x, andoutput the delay. The specified % reference must be between 0.1% and 99.9%. If channel A is in use, thePPM will output:
MRKAm,snn.nnnEsnn
If channel B is in use, the PPM will output:
MRKBm,snn.nnnEsnn
(m = marker number; s = polarity; nn.nnn = delay in seconds; Esnn = exponent)
MKPFm,xx.x
Place marker n (1 to 4) on the falling edge of the pulse at the reference power defined by xx.x, andoutput the delay. The specified reference power must be between 0.1% and 99.9%. If channel A is in use,the PPM will output:
Remote Operation
Manual No. 20790, Rev C, November 1998 3-29Superceded by Revision D, March 2009
MRKAm,snn.nnnEsnn
For channel B, the output is:
MRKBm,snn.nnnEsnn
(m = marker number; s = polarity; nn.nnn = delay in seconds; Esnn = exponent)
Because markers are always placed in the 8500A, the MKDF and MKPA commands described next willtake only the latest computation and send it over the bus if they are included in the command string forthe 8500A. The MKDF-1 command is a No Op command because markers are always placed.
MKDFm,n
Place marker numbers m and n according to their previously defined % reference powers and positions onthe pulse profile, and output the difference between their respective delays. If channel A is in use, thePPM will output:MDFA,m-n,nn.nnnEsnn.
If -1 is the argument for MKDF, markers m and n must have been previously defined for automaticplacement. Otherwise the default settings will be used. The defaults are:
• M1 = 2.5%
• M2 = 17.8%
• M3 = 46.9%
• M4 = 90%
If channel B is in use, the PPM will output:
MDFB,m-n,nn.nnnEsnn
(m = first marker number defined;n = second marker number defined;nn.nnn = the delay of m minus n in seconds;Esnn = exponent)
MKPA Place all four markers according to their previously defined % reference powers andpositions on the pulse profile and output their respective delays. For channel A, theoutput is:
MRKA1,snnn.nnEsnn;2,snnn.nnEsnn;3,snnn.nn Esnn;4,snnn.nnEsnn
If channel B is in use, the output is:
MRKB1,snnn.nnEsnn;2,snnn.nnEsnn;3,snnn.nn Esnn;4,snnn.nnEsnn
The numbers 1, 2, 3 & 4 represent the marker numbers to be used. The snn.nnEsnn following eachmarker number is the delay time of that marker with respect to the reference delay.(s = polarity; nnn.nn = delay in seconds; Esnn = exponent.)
The arguments between each set of marker information are separated by a semi-colon.
If a marker number cannot be used for some reason or if the PPM could not place the marker, an SRQwill be generated and the marker will not be placed. Then the instrument will output a delay of 0.0000E-99 seconds for that marker. If all markers are placed successfully, a service request will be generatedand the status condition will be 31. If one or more markers are not placed for the reasons describedabove, then the status condition will be 37 after SRQ.
Since markers are set at percentages of reference power and then the delay is computed by the 8500Ainstruments, the MKDA and MKDB commands described next are classed as No Op with the 8500Ainstruments.
Series 8500A Peak Power Meters
3-30 Manual No. 20790, Rev C, November 1998
Superceded by Revision D, March 2009
MKDAm,snnnnnn.nn
Set Marker Number m to Desired Delay, n, in microseconds on Channel A. (200,000 microsecondsmaximum)
MKDBm,snnnnnn.nn
Set Marker Number m to Desired Delay, n, in microseconds on Channel B. (200,000 microsecondsmaximum)
Since marker information is constantly being updated in the 8500A, the MKCA and MKCB commandsdescribed below are No Op with the 8500A instruments.
MKCAm Clear Marker Number m on Channel A.
MKCBm Clear Marker Number m on Channel B.
The preceding two commands clear both the current marker delay and any definition of automatic markerplacement. In other words, they define the marker not to be placed.
3.3.8 Window and Cursor Control Commands
Some commands can be used in the Graph Mode as well as the Peak Mode of operation. Peak powermeasurements are made by placing the Cursor at the desired time point on the pulse to be measured. TheCursor Delay is with respect to the Reference Delay. Therefore, in the Peak Mode of operation, it ispossible to set the Reference Delay and the Cursor Delay. These two commands are repeated here for usein the Graph Mode of operation.
Reference Delay is primarily used only in situations where you want to pick an arbitrary point on thepulse as the reference to which all other timing measurements are to be made. One example might consistof a gaussian shaped TACAN radar pulse that is slightly distorted. You might want to make timingmeasurements with respect to the highest point on the pulse. You might also want to know the timing ofthe 3 dB point of the pulse with respect to its peak. When in doubt, the Reference Delay should be set to0.0000 nanoseconds.
Besides the Reference Delay and Cursor Delay, the Start Delay and Window Delay can also be controlled.When the Reference Delay is 0, the Start Delay is the time between the occurrence of a trigger and thebeginning of the display of information on the PPM’s graphic display. The Window Delay is the timewindow shown on the PPM display. By expanding or contracting the window, it is possible to view awider or narrower pulse as desired. If Autoscaling is used, the PPM makes these settings automatically.
RDLAnnnnnn.nn Set Channel A Reference Delay. This is an arbitrary reference point for referencingother timing measurements.
Min. Value: 0 µs, Max. Value: 213999.97 µs
(n=microseconds)
RDLBnnnnnn.nn Set channel B Reference Delay. This is an arbitrary reference point for referencingother timing measurements.
Min. Value: 0 µs, Max. Value: 213999.97 µs
(n = microseconds)
CDLAsnnnnnn.nn Set Cursor Delay for Channel A. Sets the timing position of the Cursor on thegraphic display, or for Peak measurements. The Cursor is the vertical line on thedisplay where the power reading (CSR PWR) is taken. (Timing is relative to theReference Delay.)
Remote Operation
Manual No. 20790, Rev C, November 1998 3-31Superceded by Revision D, March 2009

(n = microseconds; s = polarity)Min. Value: 0 - Reference Delay, Max. Value: 213999.97 µs - Reference Delay
CDLBsnnnnnn.nn Set Cursor Delay for Channel B. Sets the timing position of the Cursor on thegraphic display, or for Peak measurements. The Cursor is the vertical line on thedisplay located where the power reading (CSR PWR) is taken. (Timing is relative tothe Reference Delay.)(n = microseconds; s = polarity)Min. Value: 0 - Reference Delay, Max. Value: 213999.97 µs - Reference Delay
CDOA Output Current Channel A Cursor Delay. The PPM will output:
CDLAsnn.nnnEsnn
(s = polarity; nn.nnn = delay in seconds; Esnn = exponent)
CDOB Output Current Channel B Cursor Delay. The PPM will output:
CDLBsnn.nnnEsnn
(s = polarity; nn.nnn = delay in seconds; Esnn = exponent)
SDLAsnnnnnn.nn Start Delay for Channel A. Sets timing position of left side of graphic display.Timing is relative to the Reference Delay.(n = microseconds; s = polarity)Min. Value: 0 - Reference Delay, Max. Value: 213999.97 µs - Window Delay -Reference Delay
SDLBsnnnnnn.nn Start Delay for Channel B. Sets timing position of left hand side of graphic display.Timing is relative to the Reference Delay.(n = microseconds; s = polarity)Min. Value: 0 - Reference Delay, Max. Value: 213999.97 µs - Window Delay -Reference Delay
WDLAnnnnnn.nn Delay Window for Channel A. Sets the amount of time from the left side to the rightside of the graphic display.
WDLBnnnnnn.nn Delay Window for Channel B. Sets the amount of time from the left to the right sideof the graphic display.(n = microseconds; s = exponent)Min. Value: 12 ns, Max. Value: 213999.97 µs - Start Delay - Reference Delay
Series 8500A Peak Power Meters
3-32 Manual No. 20790, Rev C, November 1998
Superceded by Revision D, March 2009
3.3.9 Commands to Output Graphic Data to a Controller
The PPM can be programmed to output data in several ways as described in Section 3.2.5. When workingwith graphic displays it may be useful to enter the entire pulse profile into the controller. Once data hasarrived at the controller, various programmed operations can be conducted. For example, you canprogram the controller to calculate the peak-to-peak pulse flatness. The advantage of this method of dataacquisition is that it is not necessary to go through the procedure of placing the cursor, taking a powerreading, and then repeating the procedure until all points of interest are entered into the controller.
The PPM graphic display dump capability allows the controller to use one command to fetch 118 datapoints along the pulse profile, as well as any pertinent timing settings relating to the profile beingexamined.
DUMG
Output All 118 Power Measurement Points of the Displayed Pulse Profile. If Channel A is in use,the PPM will output:
RDLAnn.nnnEsnn,SDLAnn.nnnEsnn,WDLAnn.nnnEsnn,PWRAnnn.nnEsnn,nnn.nnEsnn, (repeats until all 118 data points have been output)
(Esnn = exponent)
The PPM outputs the Reference Delay (RDLA) in seconds (nn.nnn), then the Start Delay (SDLA), andthen the Window Delay (WDLA). This information is followed by the 118 power readings representingthe pulse profile. All fields and data points are separated by commas. The header for the power readingsis PWRA. The power readings take the form of nnn.nnEsnn; where nnn.nn is always in Watts, and Esnnis the exponent.
When the PPM outputs using Channel B, the headers change to indicate B channel:
RDLB SDLB
WDLB PWRB
Remote Operation
Manual No. 20790, Rev C, November 1998 3-33Superceded by Revision D, March 2009

3.3.10 Plotting Commands
As previously mentioned, there is very little reason to plot or conduct graphic operations in the GraphMode. All of the operations conducted through the GPIB can be accomplished in the Marker Mode. (Thisis not completely true in the manual mode of operation.) Therefore, it is assumed that the PPM is in theMarker Mode of operation when executing any of the commands listed in this section for makinghardcopy plots.
As described in the Stand Alone Plot Output Mode description, the PPM has two different plottingmodes. The Stand Alone Plot mode should not be used when the instrument is under the control of aremote controller. Also, the Stand Alone Plot mode should not be initiated from the front panel of thePPM when the instrument is under GPIB control.
NOTE: For proper system operation, make sure that no active controller is on the bus whenthe front panel function is initiated.
Before a plot is made, you might want to enter a part number or code number that can be used forreference. These commands are summarized in the following description.
PLCNaaaaaaaaaaaa
Set Code Number for plot to ASCII string represented by up to 12 characters (a).
PLPNbbbbbbbbbbbb
Set Part Number for plot to ASCII string represented by up to 12 characters (b).
PLOT Plot pulse profile currently displayed. Marker information will be plotted if the PPMis in the marker sub-mode. Pulse information will be plotted if the PPM is in thepulse sub-mode.
There is also a sample program in Section 3.2.5 showing how to format the requiredlisten and talk addressing procedures.
PLTT This is the same as the PLOT command, but at a slower speed for transparency plots.
PLTM Change to Marker sub-mode, and then Plot.
PTTM Same as PLTM, but at a slower speed for transparency plots.
NOTE: If you want to save a plot on disk exactly as it would have been plotted by a digitalplotter, the entire HPGL plot string can be entered into a variable in the GPIB controllerusing the following program:
10 DIM A$(CCCCC) ! NEED VARIABLE SIZE 20 ! HERE 30 OUTPUT 704;PLOT 40 ENTER 704;A$ ! ENTER PLOT HPGL 50 ! COMMANDS. 60 ! ADD PROGRAM LINES HERE TO 70 ! STORE A$••100 END
A$ can be recalled later from the disk file for plotting.
Series 8500A Peak Power Meters
3-34 Manual No. 20790, Rev C, November 1998
Superceded by Revision D, March 2009

When plots are output from the PPM, the pulse profile will always be in a linear format including whenthe reference power is labeled in dBm.
3.3.11 Programming Notes
The programming commands for the PPM can be strung together as long as the maximum lengthlimitations specified in the General Information discussion are not exceeded.
This feature enables procedures to be formatted in a logical manner, and reduces the overall number ofprogramming lines required. The following sample program shows how this can be done.
10 CLEAR 704! DEVICE CLEAR 20 OUTPUT 704;ASDL200,AVAS25,AUTO 30 OUTPUT 704;PLCNabcdefg;PLPNqwerty; 40 RSFL,PLTM 50 SEND 7;UNL 60 SEND 7;LISTEN 6 70 SEND 7;TALK 4 80 SEND 7;DATA 90 WAIT 180100 SEND 7;UNT UNL110 END
Line 20: Sets the maximum pulse width for autoscaling to 200 microseconds; sets the averaging forautoscaling to 25 averages; instructs the PPM to autoscale.
Lines 30 & 40: Set the code numbers for the plot to abcdefg; sets the part number for the plot to qwerty;instructs the PPM to find the rise and fall times of the displayed pulse; instructs the PPM to place themarkers as defined and to plot the displayed pulse profile.
The remaining lines in the sample program are used for bus handling.
Care should be exercised when grouping commands. If conflicting commands are sent in the same string,the last one to be received will be implemented. For example:
OUTPUT 704;MRKA,CDLA5,PKPA
This program line would result in the cursor delay being set at 5 µs, but the PPM would enter thechannel A Peak Mode, not the Marker Mode as indicated by the MRKA portion. In other words, the PPMdoes not execute any of the commands until (CR) (LF) are received at the end of the program line.
Remote Operation
Manual No. 20790, Rev C, November 1998 3-35Superceded by Revision D, March 2009

3.4 Service Requests and Serial PollThe ability of the PPM to request service over the GPIB can be enabled or disabled by a GPIB command.The PPM’s power-on default status enables the SRQ function of the instrument. Usually a service requestis generated to report a significant condition to the controller, and the status byte will not be cleared untilit is read; REN is disasserted; or the instrument is reset. The exception to this is the output-readycondition which will also be cleared when the data is read. If SRQ is disabled the status bytes are notsaved, but the current condition is available to be read using the STAT command.
All SRQs are buffered in the PPM. If another error condition is detected after the first value has beenread, then the SRQ will remain asserted with the second value in the status byte. Up to 16 statusconditions can be buffered in this way. Once a non-zero condition is read from the PPM, the status byteshould be read until it becomes zero by taking appropriate action. For example, if the error wereover-range power, over-range SRQs will continue until the error is fixed.
When the controller reads the status byte through the GPIB via a serial poll, the 7th bit will always behigh if the PPM was requesting service. Thus, the actual value of the PPM status will be the byte that isread minus the 7th bit. When the PPM’s status is read by the STAT command (when SRQ is disabled),the byte that is sent out always has the 7th bit as zero (see 3.2.5). Any status condition that has the sixthbit high will indicate abnormal device operation. In decimal form, this is the case for any status code ofvalue greater than or equal to 32.
Sample Program:
10 ! THIS PROGRAM USES SERIAL POLL 20 ! AND SRQ TO DETERMINE IF THE 30 ! PPM SUCCESSFULLY AUTOSCALED 40 ! AS INSTRUCTED. 50 ! 60 A=0 70 ! ENABLE GPIB INTERRUPT 80 ON INTR 7 GOSUB 180 90 ENABLE INTR 7;2100 !110 ! ENABLE PPM SRQ120 OUTPUT 704;SRQE130 ! INSTRUCT PPM TO AUTOSCALE140 OUTPUT 704;AUTO150 !160 ! SRQ WAIT LOOP170 GOTO 160180 ! SRQ HANDLING ROUTINE:190 ! CONDUCT SERIAL POLL, AND200 ! PUT STATUS BYTE VALUE IN210 ! VARIABLE A220 A=SPOLL(704)230 ! SUBTRACT 64 FROM STATUS240 ! BYTE TO GET STATUS CODE250 ! NUMBER CORRECT. AUTOSCALING260 ! RETURNS A CODE OF 27.270 !280 A=A-64290 IF A=27 THEN GOTO 330300 DISP AUTOSCALING PROBLEM310 GOTO 340320 RETURN330 DISP AUTOSCALING OK340 BEEP350 END
Series 8500A Peak Power Meters
3-36 Manual No. 20790, Rev C, November 1998
Superceded by Revision D, March 2009

3.4.1 Error Conditions
When it is first activated, the PPM will check to see if there has been a change in its internal software.An SRQ will be sent over the bus if any change is detected. The PPM will attempt to capture the PROMdata from the detector(s), and will also check the detector’s serial number(s) to see if there has been adetector change. The instrument will also detect a change in detectors that occurs at any time during atest and measurement operation. When detectors are changed, the instrument will request service andcalibration will be required. No data can be taken over the GPIB until recalibration has been completed,or the detector has been removed or changed for the detector that was last calibrated.
If the instrument detects a power over range condition, it will send an SRQ. If data is being collected tobe output over the bus, the data will still be available in memory and can be read out. However, if thepower level was outside the PPM’s normal range the data may not be accurate. This data may still givesome idea of what power was being measured. If a serious over-range condition occurred, detectordamage may have resulted.
If an under-range condition occurs when the PPM is operating under bus control and it is not collectingdata to be sent over the bus in the Update Data Trigger Reset, or Update Data Continuously Modes, thenthe instrument will not signal the controller (with a service request) that the under range condition hasoccurred. Instead, the data display will display the standard under range message of ———. However, ifthe instrument is collecting data to send over the bus and the data is under range, then the PPM willrequest service (if SRQ is enabled) to report the condition if you asked for it to be reported. If theinstrument is in the Update Data Trigger Reset Mode, the under range condition will be reported (via aserial poll) before the output ready condition. The data that will be output over the bus, if the data is stillrequested, will be an impossible value to indicate to the controller that an under range condition hasoccurred and that the data is not valid. If the log (dBm) mode were in use, the instrument would output areading of -999.99 dBm. In the linear mode, the reading will be 000.00E-99.
Remote Operation
Manual No. 20790, Rev C, November 1998 3-37Superceded by Revision D, March 2009

3.5 1018B EmulationEmulation of the 1018B instrument is accessed through the front panel.
The differences in the 1018B emulation mode to standard 8501A/8502A PPM operation are as follows:
Commands
The command set is limited to the three following 1018B commands:
Command Argument
? Update data, behaves exactly as the UPDN PPM command
< nnn Sets cursor delay to a value between 0 and 9.99 µs
> nnn Sets cursor delay to a value between 0 and 99.9 µs
One to three digits are required, no sign or decimal point is allowed.
The instrument will only read the first 1018B command it receives and ignore the balance of anycommand string it receives. If the string does not start with a valid 1018B command, the instrument willignore the entire string and take no action.
Output Data Modes
There are two output data modes in the 1018B Emulation Mode. These are Update Data Trigger Resetand Update Data Continuously. The default state upon entering the 1018B Emulation Mode is UpdateTrigger Reset. After that, the output mode can be changed from the front panel (see the Front PanelMenus description Section 3.2.2). The two modes work in exactly the same way as with the PPM exceptthat the data output format is different.
Output Format
The data will always be output in a string consisting of a polarity sign, four digits, a comma, one lastdigit with a value of 0 - 3, a carriage return, and then a line feed character (all data lines low) sent withEOI. The first four digits represent the measurement, and the last digit after the comma indicates therange.
Range Data Format
0 snnn.n dBm1 snnn.n microwatts2 snn.nnn milliwatts3 sn.nnn milliwatts
NOTE: The sign will always be positive for linear values.
Examples:
-0147.0(CR)(LF)(NULL - EOI) = -14.7 dBm
+1257.3(CR)(LF)(NULL - EOI) = +1.257 mW
In the Update Continuously Mode, a continuous string of these measurements will be sent, including theterminating characters, until the PPM is untalked.
Series 8500A Peak Power Meters
3-38 Manual No. 20790, Rev C, November 1998
Superceded by Revision D, March 2009
Remote State
As in the regular PPM operation mode, the instrument must be in the REMOTE state to accept anycommands over the GPIB or to output any data. However, unlike the standard PPM operation, the frontpanel is fully active while in the REMOTE state and more Menu options will become active in 1018Bemulation (see the Front Panel Menus discussion in this section). This imposes two requirements for theoperator. One is the fact that a cursor delay will be accepted on either the front panel or over the GPIB.The most recent cursor delay will determine the measurement. The other difficulty is that a measurementand not a menu prompt must be displayed on the screen for the instrument to be able to collect data. Ifthe controller tries to collect data while the PPM has a front panel menu displayed, the PPM will take noaction until it returns to displaying data on the front panel. Then it will collect and output the data. Also,there is no return to local escape sequence while in REMOTE since the front panel is not locked out.There is no local lockout feature either.
Serial Poll
The serial poll feature operates similar to the 1018B serial poll function. The only time SRQ is assertedis if an output is ready and the value of the status byte is zero.
Front Panel Menus
The front panel menu will include three options regarding GPIB control when in the 1018B emulationmode. These options represent capabilities which can be set on the 1018B front panel, but not on thePPM in general usage. This is because each of these options are directly controllable over the GPIB innormal PPM usage.
Disable/Enable SRQ: This allows the SRQ capability to be enabled or disabled with the same effectsas the SRQE and SRQD PPM GPIB commands. Whatever option is offered,enable or disable, will be the opposite of the current state.
Update on TriggerReset/Continuous:
This sets the Output Mode. The choice offered will be the opposite of thecurrent mode. Upon entering the 1018B emulation mode, the Output Modewill be set to Update on Trigger Reset.
End 1018B Emulation Mode:
This prompt will replace the menu prompt that initiated the 1018B EmulationMode.
Analog Output
When using the PPM in the 1018B Emulation Mode, it should be kept in mind that the 1018B instrumenthas a 10 mV/dB Analog Output while the PPM has 100 mV/dB. If the 10 mV/dB output of the 1018B isrequired, a 10:1 resistive L attenuator can be placed on the PPM’s output.
Two Detectors
The Model 8502A has two detectors instead of only one as does the 1018B. When in the 1018BEmulation Mode, either detector can be used with the choice made through the front panel. It is up to theoperator to know which detector is active when the command is given over the GPIB to change cursordelay or to take a measurement. If both detectors are active, the instrument will ignore any GPIBcommands and not be able to output any data.
Reference Delay, Correction of Carrier Frequency, and Offset vs 1018B Direct Mode
A correction will always be made on the carrier frequency. However, to simulate the 1018B direct modeif desired, the reference delay and offset features of the PPM can be negated by setting both to zero viathe front panel.
Remote Operation
Manual No. 20790, Rev C, November 1998 3-39Superceded by Revision D, March 2009

Over and Under Range Conditions
The maximum value that the 1018B can output is 19.99 mW. Any power reading over that will just resultin a reading of 19.99 mW when in the linear mode. In the log mode, the reading could be displayed up to099.99 dBm. The minimum values are 000.0 µW in the linear mode or a reading of -099.9 dBmindicating an under range condition in the log mode.
1018B Features Not Emulated by the PPM
Following is a list of the differences in GPIB operation when the Model 1018B Peak Power Meter isreplaced on the bus with a Model 8501A or Model 8502A Peak Power Meter (PPM):
1. The PPM has no ability to be directly triggered with a GET command. It can only reset itstrigger to capture the next pulse that will trigger the instrument.
2. The PPM has no talk only mode.
3. Whereas the 1018B allowed completely independent talk and listen addresses, the PPM musthave the same talk and listen addresses. The addresses are set as one via the front panel.
4. The 1018B locks out the front panel delay setting capability while in the REMOTE state. Thefront panel delay setting ability remains active on the PPM when in the REMOTE state of the1018B Emulation Mode.
5. The 1018B will take commands and output data even if it is not in the REMOTE state. Thisrequires the instrument to be in REM.
Series 8500A Peak Power Meters
3-40 Manual No. 20790, Rev C, November 1998
Superceded by Revision D, March 2009

3.6 Status Code Decimal ValuesThe decimal values of the various status codes minus the 7th bit are as listed below.
To determine the value with the 7th bit high, add 64 to the values listed in Table 3-1.
DecimalValue
Condition
0 Operation normal, no condition to report
1 Output ready to be sent over GPIB
10 Self test passed
20 Calibration passed
25 Autozero passed
27 Autoscaling completed and passed
31 If RISE, PLWD, FALL, RSFL, RSWD, WDFL, PUFT, PURT, OR PUWD all measurementssuccessfully made
33 Command string syntax error, command(s) not processed
34 Command string has invalid argument, command(s) not processed
35 Command string(s) incomplete when unlistened, string(s) sent so far are lost, command(s) notprocessed
36 PPM command buffer overflow. Limit of 128 character string exceeded. String lost, nocommands processed
37 Cannot execute MKDF, markers to be measured are undefined. No command(s) processed
38 Command not executed, PPM not in REMOTE state
39 Command not implemented, no commands processed
40 GET sent when not in REMOTE
41 GET or UPDN command sent when not in the Update Data Trigger Reset Output Mode. IfUPDN command, no command(s) processed
43 Not in Graph Mode or Marker sub-mode, must be in Graph Mode for AUTO (AutoscaleGraph), or PLOT commands to function. Must be in Marker sub-mode for marker commandsto function. No command(s) processed
44 Autoscaling, PLOT, DUMG, pulse parameter, or a marker placement command has beenspecified in the command string and a mode change requested later at some point in the samecommand string. Mode change not processed
45 STAT command sent while SRQ enabled, STAT command not active
46 SRQ buffer overflow, SRQ enabled and not being read quickly enough by the controller
48 Cannot enter Fast Measurement Mode. Either in linear, graph, or marker mode. Nocommand(s) processed
49 Cannot execute RECL or WATT commands, or any graph or marker commands in the FastMeasurement Mode. No command(s) processed
50 Error in reading PROM data from detector A
51 Error in reading PROM data from detector B
Table 3-1. Status Code Values and Conditions
Remote Operation
Manual No. 20790, Rev C, November 1998 3-41Superceded by Revision D, March 2009

DecimalValue
Condition
52 Calibration aborted for lack of a detector
53 Calibration passed, but with PROM read error
54 Calibration failed with PROM read error
55 Calibration failed
57 Autozero aborted for lack of detector
58 Autozero fail
59 Autoscaling aborted for lack of detector
60 Autoscaling interrupted by GPIB bus command, no trigger received
61 Unable to Autoscale
63 Unable to place markers specified or required to make a pulse parameter measurement
170 Self test failed
See Self-Test Failure Indications in Section 3.6 for a description and possible causes pertaining to Error Numbers 01through 11. These will be decimal values 170 through 180, respectively
184 New software detected. Must recalibrate both detectors
185 Serial numbers don’t match. Must recalibrate A and B detectors.
186 Serial number doesn’t match. Must recalibrate detector A
187 Serial number doesn’t match. Must recalibrate detector B
189 Instrument operation failure. PPM will probably need to be reset
190 Under range. Measurement not accurate
191 Over range. Damage to instrument may have occurred
Series 8500A Peak Power Meters
3-42 Manual No. 20790, Rev C, November 1998
Superceded by Revision D, March 2009
3.7 Summary of Bus Functions
3.7.1 Normal PPM Operation
The bus functions for normal PPM operation (under GPIB control) are defined in Table 3-2:
Code Function
SH1 Complete source handshake capability
AH1 Complete acceptor handshake capability
T6 Basic talker and serial poll capability, unaddressed as a talker if listen addressed, no talk onlymode
TE0 No talk-address extension capability
L4 Basic listener capability; unaddressed as a listener if talk-addressed — no listen-only mode
LE0 No listen-address extension capability
SR1 Complete service request capability (when SRQ enabled)
RL1 Complete remote local interface capability with local lockout capability
PP0 No parallel poll capability
DC1 Complete device clear capability [responds to device clear (DCL) and selective device clear(SDC)]
DT1 Complete device trigger capability [responds to group execute trigger (GET)]
C0 No controller capability
3.7.2 PPM Stand Alone Plot Operation
When the PPM is in the Stand Alone Plot mode, two functions will exhibit different capabilities. TheTalker and Controller functions are redefined as follows:
T5: Same as T6 capability except it has talk-only capability while plotting.
C1, C3, & C28: System controller capability with the ability to send REN and interface messages, butwith no capability to send IFC, respond to SRQ, conduct parallel poll, or pass control.
Table 3-2. Summary of Bus Functions
Remote Operation
Manual No. 20790, Rev C, November 1998 3-43Superceded by Revision D, March 2009

3.8 GPIB Command SummaryA summary of the GPIB commands referenced in this chapter are listed alphabetically in Table 3-3. Whenarguments are not required, the argument column is blank. If the command is not intended to make thePPM output a data string, the output string will indicate ’none’. Arguments are represented by lowercasecharacters while commands and output string headers (always four characters) are uppercase. Theposition of the decimal point can vary in Delay commands.
Command Argument
ACBC Select Ratio Mode - Channel A (CW) to Channel B (CW) / none
ACBP Select Ratio Mode - Channel A (CW) to Channel B (Peak) / none
APBC Select Ratio Mode - Channel A (Peak) to Channel B (CW) / none
APBP Select Ratio Mode - Channel A (Peak) to Channel B (Peak) / none
ASDLnnnnnn.nn Select Initial Delay Used for Autoscaling Pulse Profile / none(n = microseconds; 200,000 maximum)
AUTO Autoscale Current Pulse Profile / none
AVASnnn Select Averaging Value Used for Autoscaling Pulse Profile / none(n = 1 to 999)
AVCWnnn Select Number of Averages for CW Power Measurement / none(n = 1 to 999)
AVPKnnn Select Number of Averages for Peak Power Measurement / none (n = 1 to 999)
CALA Calibrate Channel A Detector. Takes time to complete - SRQ can monitor successful(or unsuccessful) completion / none
CALB Calibrate Channel B Detector. Takes time to complete - SRQ can monitor successful(or unsuccessful) completion / none
CDLAnnnnnn.nn Set Channel A Cursor Delay / none(n = microseconds; 213,999.97 - Ref Dly maximum; 0 - Ref Dly minimum) Positionof decimal point may vary. Cursor Delay is in respect to the Reference Delay. IfReference Delay = 0, then the Cursor Delay is with respect to the trigger.
CDLBnnnnnn.nn Set Channel B Cursor Delay / none (see CDLA)
CDOA Read Out Current Channel A Cursor Delay / PPM will output:
CDLAsnn.nnnEsnn
s = polarity; n = Cursor Delay in seconds (decimal point may shift); Esnn =exponent value in engineering notation
CDOB Read Out Current Channel B Cursor Delay / PPM will output:
CDLBsnn.nnnEsnn
(see CDOA)
CWAB Select Dual Channel Mode: CW Both Channels / none
CWPA Select Channel A Only: CW Power / none
CWPB Select Channel B Only: CW Power / none
Table 3-3. GPIB Commands Format
Series 8500A Peak Power Meters
3-44 Manual No. 20790, Rev C, November 1998
Superceded by Revision D, March 2009
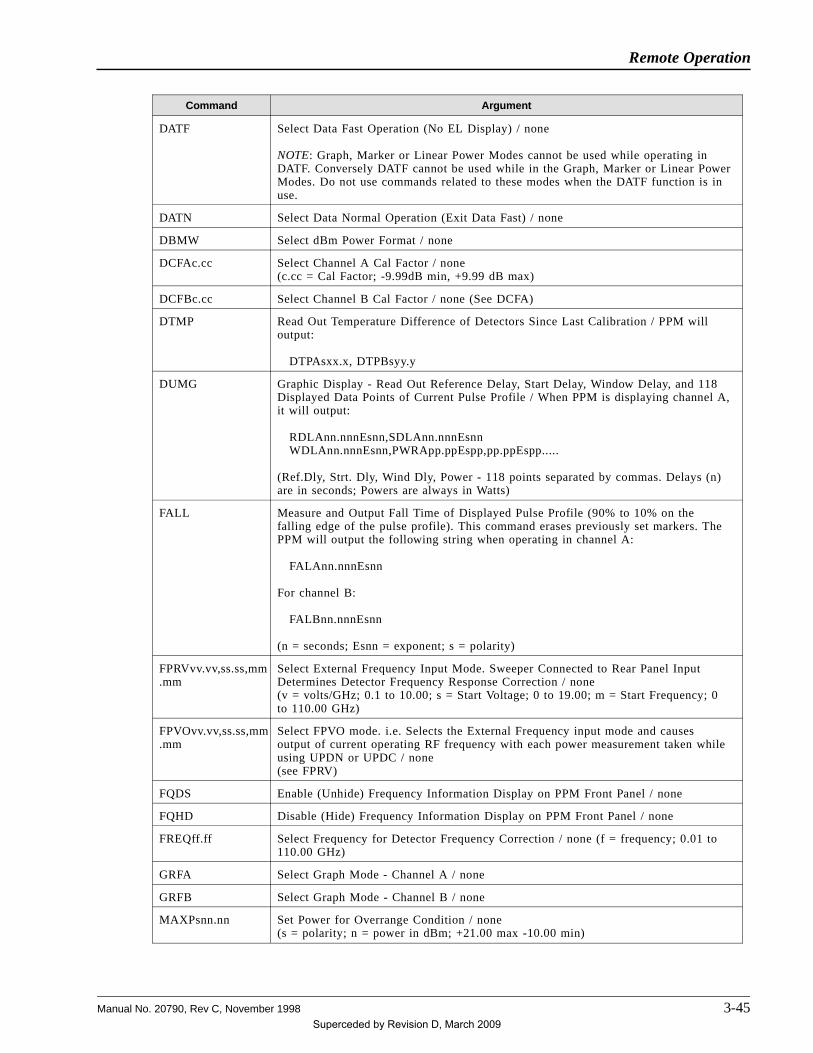
Command Argument
DATF Select Data Fast Operation (No EL Display) / none
NOTE: Graph, Marker or Linear Power Modes cannot be used while operating inDATF. Conversely DATF cannot be used while in the Graph, Marker or Linear PowerModes. Do not use commands related to these modes when the DATF function is inuse.
DATN Select Data Normal Operation (Exit Data Fast) / none
DBMW Select dBm Power Format / none
DCFAc.cc Select Channel A Cal Factor / none(c.cc = Cal Factor; -9.99dB min, +9.99 dB max)
DCFBc.cc Select Channel B Cal Factor / none (See DCFA)
DTMP Read Out Temperature Difference of Detectors Since Last Calibration / PPM willoutput:
DTPAsxx.x, DTPBsyy.y
DUMG Graphic Display - Read Out Reference Delay, Start Delay, Window Delay, and 118Displayed Data Points of Current Pulse Profile / When PPM is displaying channel A,it will output:
RDLAnn.nnnEsnn,SDLAnn.nnnEsnnWDLAnn.nnnEsnn,PWRApp.ppEspp,pp.ppEspp.....
(Ref.Dly, Strt. Dly, Wind Dly, Power - 118 points separated by commas. Delays (n)are in seconds; Powers are always in Watts)
FALL Measure and Output Fall Time of Displayed Pulse Profile (90% to 10% on thefalling edge of the pulse profile). This command erases previously set markers. ThePPM will output the following string when operating in channel A:
FALAnn.nnnEsnn
For channel B:
FALBnn.nnnEsnn
(n = seconds; Esnn = exponent; s = polarity)
FPRVvv.vv,ss.ss,mm.mm
Select External Frequency Input Mode. Sweeper Connected to Rear Panel InputDetermines Detector Frequency Response Correction / none(v = volts/GHz; 0.1 to 10.00; s = Start Voltage; 0 to 19.00; m = Start Frequency; 0to 110.00 GHz)
FPVOvv.vv,ss.ss,mm.mm
Select FPVO mode. i.e. Selects the External Frequency input mode and causesoutput of current operating RF frequency with each power measurement taken whileusing UPDN or UPDC / none(see FPRV)
FQDS Enable (Unhide) Frequency Information Display on PPM Front Panel / none
FQHD Disable (Hide) Frequency Information Display on PPM Front Panel / none
FREQff.ff Select Frequency for Detector Frequency Correction / none (f = frequency; 0.01 to110.00 GHz)
GRFA Select Graph Mode - Channel A / none
GRFB Select Graph Mode - Channel B / none
MAXPsnn.nn Set Power for Overrange Condition / none(s = polarity; n = power in dBm; +21.00 max -10.00 min)
Remote Operation
Manual No. 20790, Rev C, November 1998 3-45Superceded by Revision D, March 2009

Command Argument
MINPsnn.nn Set Power for Underrange Condition / none(s = polarity; n = power in dBm; -15.00 max -50.00 min)NOTE: Some of the following marker commands are no longer necessary whenwriting code pertaining to markers for the 8500A instruments. See Section 3.3.7
MKCAn (No Op command with the 8500A)Clear Marker Number Selected on Channel A / none(n = marker number to clear; 1 to 4)
MKCBn (No Op with the 8500A)Clear Marker Number Selected on Channel B / none(n = marker number to clear; 1 to 4)
MKDAn,dddddd.dd (No Op with the 8500A) Select Channel A Marker Delay number n and set the delayto d / none(n = marker number to clear; 1 to 4; d = marker delay in microseconds; 200,000max)
MKDBn,dddddd.dd (No Op with the 8500A) Select Channel B Marker Delay number n and set the delayto d / none (See MKDA)
MKDFa,b Place Markers (a and b) which were previously selected and Output Their DelayDifference (a - b) Marker differences can also be de-selected - See MKDF-1 / Whenthe PPM is in channel A it will output:
MDFA,a-b,nn.nnnEsnn
(a = first marker; b = second marker; result will be the marker a delay minus themarker b delay)
MKDF-1 (No Op with the 8500A) Deselect all Marker Difference Pairs / none
MKPA Autoplace All Four Markers as previously selected and Output Their Delays / If thePPM is in Channel A it will output:
MRKA1,nn.nnnEsnn;2,nn.nnnEsnn;3,nn.nnnEsnn;4,nn.nnnEsnn
If the PPM is in channel B it will output the same as above only with MRKB header.(1, 2, 3 and 4 = marker numbers; n = delay in seconds; Esnn = exponent)
MKPFa,xx.x Place Given Marker on Falling Slope of Pulse Profile at the Selected % PowerReference and Output Its Delay / When the PPM is in channel A it will output:
MRKAa,nn.nnnEsnn
When the PPM is in channel B it will output:
MRKBa,nn.nnnEsnn
(a = marker number; 1 to 4; x = percent of reference power to place marker; 0.1%min 99.9% max; n = delay in seconds; Esnn = exponent)
MKPRa,xx.x Place Given Marker on Rising Slope of Pulse Profile at the Selected % PowerReference and Output Its Delay / When in channel A the PPM will output:
MRKAa,nn.nnnEsnn
When in channel B the PPM will output:
MRKBa,nn.nnnEsnn
(See MKPF)
MRKA Select Channel A Marker Sub-Mode / none
MRKB Select Channel B Marker Sub-Mode / none
Series 8500A Peak Power Meters
3-46 Manual No. 20790, Rev C, November 1998
Superceded by Revision D, March 2009

Command Argument
OFFAsnn.nn Set Channel A Offset / none(s = polarity; n = dB offset; -40.00 min +90.00 max)
OFFBsnn.nn Set Channel B Offset / none (See OFFA)
PKAB Select Dual Channel Mode: Peak Power Both Channels / none
PKPA Select Channel A Only: Peak Power Mode / none
PKPB Select Channel B Only: Peak Power Mode / none
PLCNx Set Code Number to be Plotted / none(x = ASCII string of 12 characters or less)
PLOT Plot Pulse Profile Currently Displayed GPIB interface must be managed correctly.PPM will output pulse profiles with relevant marker information (or without ifdesired) using HPGL graphics codes to a compatible digital plotter. See Plot OutputMode in Section 3.2.5 for plotting instructions.
PLPNx Set Part Number to be Plotted / none(x = ASCII string of 12 characters or less)
PLTM Change to Marker Sub-Mode and immediately begin plotting / See PLOT(This command ensures that the placement of markers is based on the same powermeasurement data as is sent to the plotter for increased accuracy of markerplacement on the hardcopy plot.)
PLTT Plot Pulse Profile Currently Displayed at Slower Speed for Transparencies / Same asPLOT but slower pen speed.
PLWD Measure and Output Pulse Width of Pulse Profile Currently Displayed (50% point onrising edge of pulse to 50% point on the falling edge of the pulse). This commanderases previously set markers / The PPM will output the following string whenoperating in channel A:
WIDAnn.nnnEsnn
For channel B:
WIDBnn.nnnEsnn
PRFAsnn.nn Set Channel A Reference Power for Graphic Display / none(s = polarity; n = dBm value; +110.00 max -60.00 min)
PRFBsnn.nn Set Channel B Reference Power for Graphic Display(s = polarity; n = dBm value; +110.00 max -60.00 min)
PTTM Change to Marker Sub-Mode and plot at Slower Speed for Transparencies / Same asPLTT but with slower pen speed.
PUFE Set Pulse Fall Time - End % / none[n = % expressed in 0.1% units; 1 to 999 (0.1% to 99.9%)]
PUFS Set Pulse Fall Time - Start % / none[n = % expressed in 0.1% units; 1 to 999 (0.1% to 99.9%)]
PUFT Measure and output fall time of the pulse profile displayed in the Pulse Parameterssub-mode. / The PPM will output the following string when operating in Channel A:
FALAnnnnn.nEsnn
For Channel B:
FALBnnnnn.nEsnn
(n = seconds; Esnn = exponent; s = polarity)
PULA Select Channel A only: Pulse Parameter submode / none
Remote Operation
Manual No. 20790, Rev C, November 1998 3-47Superceded by Revision D, March 2009
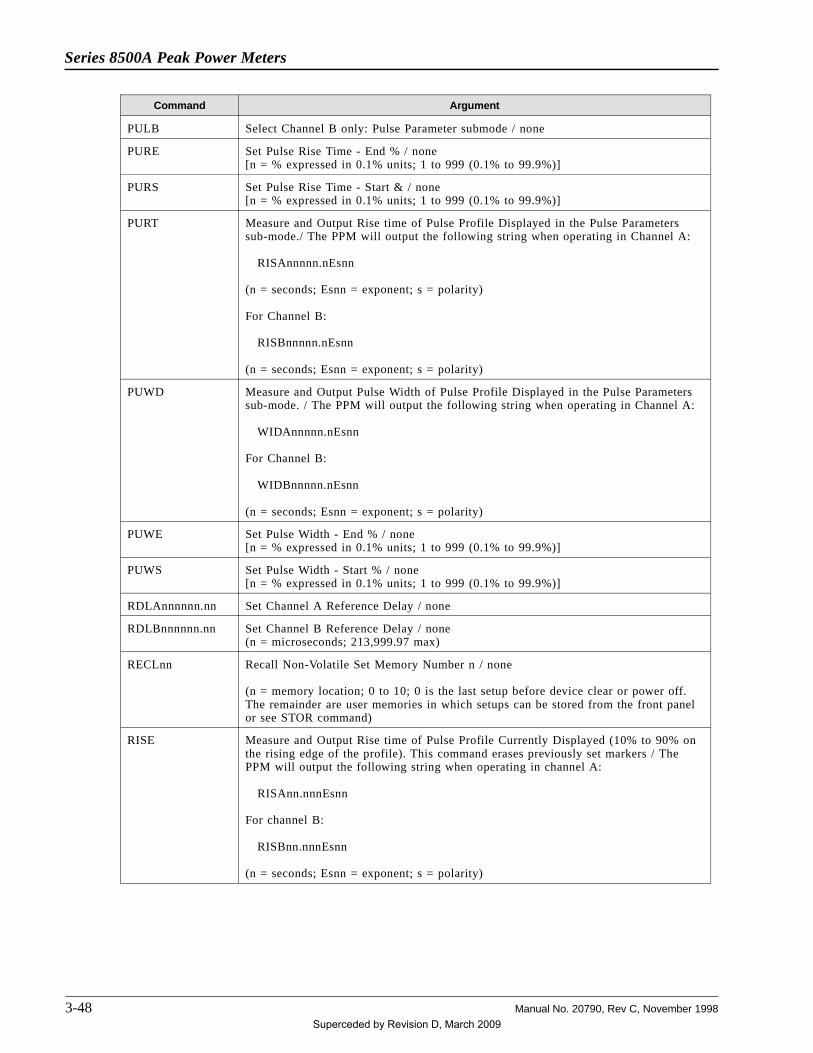
Command Argument
PULB Select Channel B only: Pulse Parameter submode / none
PURE Set Pulse Rise Time - End % / none[n = % expressed in 0.1% units; 1 to 999 (0.1% to 99.9%)]
PURS Set Pulse Rise Time - Start & / none[n = % expressed in 0.1% units; 1 to 999 (0.1% to 99.9%)]
PURT Measure and Output Rise time of Pulse Profile Displayed in the Pulse Parameterssub-mode./ The PPM will output the following string when operating in Channel A:
RISAnnnnn.nEsnn
(n = seconds; Esnn = exponent; s = polarity)
For Channel B:
RISBnnnnn.nEsnn
(n = seconds; Esnn = exponent; s = polarity)
PUWD Measure and Output Pulse Width of Pulse Profile Displayed in the Pulse Parameterssub-mode. / The PPM will output the following string when operating in Channel A:
WIDAnnnnn.nEsnn
For Channel B:
WIDBnnnnn.nEsnn
(n = seconds; Esnn = exponent; s = polarity)
PUWE Set Pulse Width - End % / none[n = % expressed in 0.1% units; 1 to 999 (0.1% to 99.9%)]
PUWS Set Pulse Width - Start % / none[n = % expressed in 0.1% units; 1 to 999 (0.1% to 99.9%)]
RDLAnnnnnn.nn Set Channel A Reference Delay / none
RDLBnnnnnn.nn Set Channel B Reference Delay / none(n = microseconds; 213,999.97 max)
RECLnn Recall Non-Volatile Set Memory Number n / none
(n = memory location; 0 to 10; 0 is the last setup before device clear or power off.The remainder are user memories in which setups can be stored from the front panelor see STOR command)
RISE Measure and Output Rise time of Pulse Profile Currently Displayed (10% to 90% onthe rising edge of the profile). This command erases previously set markers / ThePPM will output the following string when operating in channel A:
RISAnn.nnnEsnn
For channel B:
RISBnn.nnnEsnn
(n = seconds; Esnn = exponent; s = polarity)
Series 8500A Peak Power Meters
3-48 Manual No. 20790, Rev C, November 1998
Superceded by Revision D, March 2009

Command Argument
RPOA Read Out Current Channel A Reference Power / The PPM will output channel Areference power in the following format:
If operating in the Linear Power Mode:
RFALxx.xxEsnn
(x = power in Watts; Esnn = exponent)
If operating in the dBm power format:
RFADsnnn.nn
(s = polarity; n = reference power in dBm)
RPOB Read Out Current Channel B Reference Power. (Readout is the same as RPOA,substituting B or A)
RSFL Measure and Output Rise and Fall Times of Pulse Profile Currently Displayed. SeeFALL and RISE for definitions used for fall and rise times / When operating inchannel A the PPM will output:
RISAnn.nnnEsnn,FALAnn.nnnEsnn
When operating in channel B:
RISBnn.nnnEsnn,FALBnn.nnnEsnn
(n = delay in seconds; Esnn = exponent)
RSWD Measure and Output Rise time and Pulse Width of Pulse Profile Currently Displayed.See RISE for definition of rise time. Pulse width is the time between the 50% powerpoint on the pulse’s rising edge and the 50% point on it’s falling edge / Channel Areadout is:
RISAnn.nnnEsnn,WIDAnn.nnnEsnn
Channel B readout is:
RISBnn.nnnEsnn,WIDBnn.nnnEsnn
SDLAnnnnnn.nn Set Channel A Start Delay / none
(n = microseconds; position of decimal may vary.Max = 213,999.97 µs - Window Delay - Reference Delay;Min = 0 - Reference Delay.Start Delay is with respect to the Reference Delay. If Reference Delay is 0 then StartDelay is coincident with the trigger.)
SDLBnnnnnn.nn Set Channel B Start Delay / none (see SDLA)
SELT Initiate Self-Test. Can be used with SRQ for a health check. See Service Requests inSection 3.4.
SRQD SRQ Disable. See Service Requests in Section 3.4
SRQE SRQ Enable. See Service Requests in Section 3.4
STAT Output Status Byte. This command is only effective when SRQ is disabled. If sentwhile SRQ is enabled an SRQ will be generated. The PPM will output:
STATnnn
(n = decimal number representing current Status Byte. See Status Byte Output inSection 3.2.5 and Service Requests in Section 3.4)
Remote Operation
Manual No. 20790, Rev C, November 1998 3-49Superceded by Revision D, March 2009

Command Argument
STORnn Store Current PPM Settings in Non-Volatile Set-Up Memory Number n / none(n = number between 1 and 10)
TRGAsnn.nn Select Channel A Internal Trigger and Set Level in dBm / none(s = polarity; n = trigger level - +16 dBm max -20 dBm min)
TRGBsnn.nn Select Channel B Internal Trigger and Set Level in dBm / none (See TRGA)
TRGE Select External Trigger Mode / none
UNDD Disable PPM SRQ for Underrange Conditions. See Service Requests in Section 3.4 /none
UNDE Enable PPM SRQ for Underrange Conditions. An SRQ will be generated if thepower level measurement data is below the level set by MINP / none
UPDC Select Update Data Continuously Output Mode. The PPM will output a continuousstream of power measurement data points separated by commas. Every time the PPMreceives a trigger a new data point is added to the stream. The formats describedbelow can occur.
When using the FREQ, DCFA (A Cal Factor), DCFB (B Cal Factor), or FPRV (RearPanel Frequency Input) methods for detector frequency response correction, thePPM’s Linear Mode data output string for channel A will be:
PWRAnn.nnEsnn,PWRAnn.nnEsnn,PWRAnn.nnEsnn
(n = linear power in Watts; Esnn = exponent)
This example shows a data string for 3 triggers. Subsequent triggers will producemore data points separated by commas in the form of PWRAnn.nnEsnn. Forchannel B the header before the data points would be PRWB instead of PWRA.
The PPM’s dBm Mode output for channel A would be:
DBMAsnnn.nn,DBMAsnnn.nn,DBMAsnnn.nn
(s = polarity; n = dBm)
This example shows a data stream for 3 triggers. Subsequent triggers will producemore data points separated by commas in the form of DBMAsnn.nn. For channel Bthe header before the data points would be DBMB instead of BDMA.
When using the FPVO (Rear Panel Frequency Input and Output) method for detectorfrequency response correction, the PPM’s Linear Mode data output string forchannel A will be in the form:
PWRAmm.mmEsee,FRQAfff.ffE+09,PWRAnn.nnEsee,FRQAggg.ggE+09
(m = first power data point;f = first frequency data point;n = second power data point;g = second frequency data point;Esee = exponent for power in Watts;E+09 indicates frequency is in GHz)
This example shows a data stream for 2 triggers. Subsequent triggers will producemore data points separated by commas in the form ofPWRAnn.nnEsnn,FRQAfff.ffE+09. If the PPM is in channel B the headers before thedata points would be PWRB and FRQB. See preceding NOTE for descriptionof dBm header and data formats.
Series 8500A Peak Power Meters
3-50 Manual No. 20790, Rev C, November 1998
Superceded by Revision D, March 2009

Command Argument
UPDN Update Data Now. i.e: Take a power reading when the next trigger occurs. Thiscommand is only operational if the PPM is in the Update Trigger Reset Mode. SeeUPDT./ The PPM will output a single data point each time UPDN is received. Theoutput formats are the same as those described under UPDC except that each datapoint is not followed by a comma. Instead each point is followed by a carriagereturn followed by a line feed sent with EOI. If FPVO is being used, the frequencyat which a power measurement was taken is output also. See UPDC and FPVO.
UPDT Select Update Date Trigger Reset Output Mode. Prepares the PPM to take powerreadings using UPDN or GET / none
WATT Select Linear Power Format / none
WDFL Measure and Output Pulse Width and Fall-times of Pulse Profile CurrentlyDisplayed. See FALL for definition of fall time. Pulse width is the time between the50% point on the pulse’s rising edge and the 50% point on it’s falling edge / Whenoperating in channel A the PPM will output:
WIDAnn.nnnEsnn,FALAnn.nnnEsnn
For Channel B the output is:
WIDBnn.nnnEsnn,FALBnn.nnnEsnn
(n = delay in seconds; Esnn = exponent)
WDLAnnnnnn.nn Set Channel A Delay Window / none(n = microseconds; position of decimal point may vary. 0.012 µs min; 213,999.97 -Start Delay - Reference Delay max)
WDLBnnnnnn.nn Set Channel B Delay Window / none(See WDLA)
ZERA Autozero Channel A Detector. Takes time to complete - SRQ can monitor successful(or unsuccessful) completion / none
ZERB Autozero Channel B Detector. Takes time to complete - SRQ can monitor successful(or unsuccessful) completion / none
*IDN? Identification Query - Output Model; Software Version. The PPM will output:
Giga-tronics,8501A,0,VERnn.nn
8501A = model number;
0 = N/A;
VER = software version;
n = number of the software version. If using a Model 8502A, 8501A would bereplaced by 8502A
Remote Operation
Manual No. 20790, Rev C, November 1998 3-51Superceded by Revision D, March 2009

3.9 1018B Emulation Commands1018B Emulation commands will be in the following format:
Command Argument
<NNN Set Delay 0 to 9.99 microseconds (1018B Emulation) / none(nnn = delay in hundredths of microseconds)NOTE: A decimal point cannot be sent in the argument string.
>NNN Set Delay 0 to 99.9 microseconds (1018B Emulation) / none(nnn = delay in tenths of microseconds.)NOTE: A decimal point cannot be sent in the argument string.
? Update Data (1018B Emulation).Causes a trigger reset when in the update or trigger modes. The PPM will outputpower measurement data the next time a trigger occurs.
3.10 Data FormatsData will be in the following formats:
dBm Mode:
snnnn,0(CR)(LF)(NULL EOI)
(Interpret snnnn,0 as nnn.n dBm)
Range 1: (microwatts)
snnnn,1(CR)(LF)(NULL EOI)
(Interpret snnnn,1 as nnn.n µW)
Range 2: (milliwatts)
snnnn,2(CR)(LF)(NULL EOI)
(Interpret snnnn,2 as nn.nn mW)
Range 3: (milliwatts)
snnnn,3(CR)(LF)(NULL EOI)
(Interpret snnnn,3 as n.nnn mW)(s = polarity; linear always +; n = power value)
NOTE: When operating in the Linear Mode, the range is determined from the linear rangethat has been set from the front panel.
Table 3-4. 1018B Emulation Commands Format
Series 8500A Peak Power Meters
3-52 Manual No. 20790, Rev C, November 1998
Superceded by Revision D, March 2009
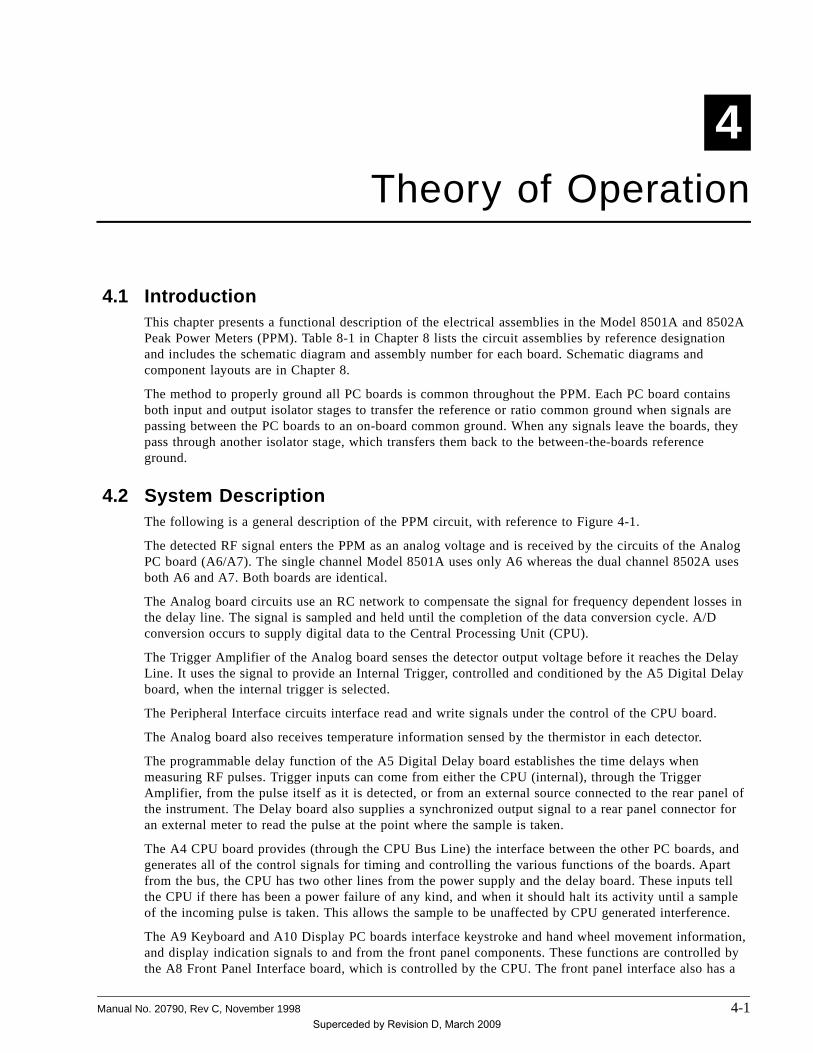
4 Theory of Operation
4.1 IntroductionThis chapter presents a functional description of the electrical assemblies in the Model 8501A and 8502APeak Power Meters (PPM). Table 8-1 in Chapter 8 lists the circuit assemblies by reference designationand includes the schematic diagram and assembly number for each board. Schematic diagrams andcomponent layouts are in Chapter 8.
The method to properly ground all PC boards is common throughout the PPM. Each PC board containsboth input and output isolator stages to transfer the reference or ratio common ground when signals arepassing between the PC boards to an on-board common ground. When any signals leave the boards, theypass through another isolator stage, which transfers them back to the between-the-boards referenceground.
4.2 System DescriptionThe following is a general description of the PPM circuit, with reference to Figure 4-1.
The detected RF signal enters the PPM as an analog voltage and is received by the circuits of the AnalogPC board (A6/A7). The single channel Model 8501A uses only A6 whereas the dual channel 8502A usesboth A6 and A7. Both boards are identical.
The Analog board circuits use an RC network to compensate the signal for frequency dependent losses inthe delay line. The signal is sampled and held until the completion of the data conversion cycle. A/Dconversion occurs to supply digital data to the Central Processing Unit (CPU).
The Trigger Amplifier of the Analog board senses the detector output voltage before it reaches the DelayLine. It uses the signal to provide an Internal Trigger, controlled and conditioned by the A5 Digital Delayboard, when the internal trigger is selected.
The Peripheral Interface circuits interface read and write signals under the control of the CPU board.
The Analog board also receives temperature information sensed by the thermistor in each detector.
The programmable delay function of the A5 Digital Delay board establishes the time delays whenmeasuring RF pulses. Trigger inputs can come from either the CPU (internal), through the TriggerAmplifier, from the pulse itself as it is detected, or from an external source connected to the rear panel ofthe instrument. The Delay board also supplies a synchronized output signal to a rear panel connector foran external meter to read the pulse at the point where the sample is taken.
The A4 CPU board provides (through the CPU Bus Line) the interface between the other PC boards, andgenerates all of the control signals for timing and controlling the various functions of the boards. Apartfrom the bus, the CPU has two other lines from the power supply and the delay board. These inputs tellthe CPU if there has been a power failure of any kind, and when it should halt its activity until a sampleof the incoming pulse is taken. This allows the sample to be unaffected by CPU generated interference.
The A9 Keyboard and A10 Display PC boards interface keystroke and hand wheel movement information,and display indication signals to and from the front panel components. These functions are controlled bythe A8 Front Panel Interface board, which is controlled by the CPU. The front panel interface also has a
Manual No. 20790, Rev C, November 1998 4-1Superceded by Revision D, March 2009

high voltage switching power supply for the Electro-Luminescent (EL) display. The Ready and New Datalights on the front panel are turned on and off by control signals sent through A9 from the delay board.
The A3 GPIB/Cal Control board provides the interface to the GPIB, and contains the circuitry requiredfor controlling the operation of the automatic detector Calibrator (A12). It also interfaces with thePROMs in the detectors, contains the sound generator circuits, and provides an RF blanking output toturn off RF power when zeroing the instrument.
The A12 Calibrator assembly contains the 1 GHz Programmable Calibration Source that furnishes aprecise signal for automatic calibration of the PPM detectors.
KEYBO AR D
G PIBIN TERFAC E
PRO G R AM M ABLEDELAY
A5
A3
A8
C PU
A4
D ISPLAY
A 10 (thru A8)
SAM PLE/H O LD
A/D C O N VERTER
A6/A7
D elay Line
C O M P N ET
A6/A7
M O D EL 8502A:
C hanne l A show n;C hanne l B is iden tica l
C PU BU S
C ALIBRATO RC O N TR O LLER
A3
1 G H z
PRO G R AM M ABLE
C ALIBR ATIO N
SO U R C E
A12
Int
Ext
C alibrator
1 G H z O utput
TriggerInput
PR O G R AM M ABLE
IN TER FACE
A6/A7
TRIG AM P
A6/A7
Sam ple P ulse
D ETEC TO R ASSY
D ETEC TO RThermR F
Input
G PIBInput/
O utput
Figure 4-1. Series 8500A System Block Diagram
Series 8500A Peak Power Meters
4-2 Manual No. 20790, Rev C, November 1998
Superceded by Revision D, March 2009

4.2.1 Power Supply PC Assembly (A2)
(See schematic diagram #16996 in Chapter 8.
The Power Supply PC board generates the +5 Vdc and +15 Vdc power sources required by theinstrument. Since both voltages are produced in a similar manner, this discussion will cover only the+5 V circuitry.
The +5 Vdc produced on the board is the master voltage regulator for the system. It takes its referencefrom CR21 and compares it with the output voltage between the +5 V Sense and +5 V Common lines.Sensing is in the circuit composed of R41, R43, R66, and adjustable at R42. Q7 and Q5 are regulatingtransistors with the regulation voltage available at TP9 for checking.
-5 V is slaved from the +5 V and regulated through Q9 and Q10. Both the plus and minus voltages arecompared with ground, and both have current limiting. The +5 V circuit is sensitive to the voltage dropacross R29, which is controlled in parallel through Q6. U2A is the current limiter for +5 V, and U3A isthe current limiter for -5 V. U4 compares the unregulated +5 V with the reference from U5. If its outputis too low, the AC Fail signal will tell the CPU that the power is about to fail. R61, CR19, and C21 willkeep the voltage supply at U4 up long enough for the +5 V to drop to a logic zero threshold after theinstrument goes to a power-off state.
A2 Test Points
The test points in Table 4-1 can be checked for the correct signals on the A2 Power Supply board:
Test Point Description
TP1 Reads the current in the +15 V drive circuitry
TP2 Reads the current in the -15 V drive circuitry
TP3 +15 V
TP4 +15 V Common Sense
TP5 -15 V
TP6 +15 V Common
TP7 Reads the current in the +5 V drive circuitry
TP8 Reads the current in the -5 V drive circuitry
TP9 +5 V Sense
TP10 -5 V Sense
TP11 5 V Common Sense
Table 4-1. A2 Test Points
Theory of Operation
Manual No. 20790, Rev C, November 1998 4-3Superceded by Revision D, March 2009

4.2.2 GPIB/CAL Control PC board (A3)
See Figure 4-2 and schematic diagram #21015 in Chapter 8.
The GPIB/Cal Control PC board circuitry performs a number of functions. The board is the interface tothe detector PROMs. It contains the sound generator for clicks and beeps as described in Chapter 3, andit also has the GPIB interface and calibrator control circuitry.
With reference to Sheet 1 of DWG# 21015, the GPIB interface is through U1, buffered by U2 and U4.U1 performs the proper interfacing between the GPIB and the data and address lines, and the chip select
Figure 4-2. GPIB/Cal Control (A3) Block Diagram
Series 8500A Peak Power Meters
4-4 Manual No. 20790, Rev C, November 1998
Superceded by Revision D, March 2009
and read/write lines. Control signals to activate the sound generator come through U8, which alsointerfaces with the PROMs in each detector. A special 4-bit-wide data bus is connected to each detector,and a clock signal common to both detectors sequentially counts the address from 0 to 2048.
Q1 and Q2 switch on and off the +5 V supply to the channel A detector PROM, and Q3 and Q4 do thesame for the channel B detector PROM. When the +5 V is switched on, the address counter at thedetector is reset to zero.
U8 also has an RF Blanking output signal used during a calibration routine to turn off any input from theRF source. The sound generator is controlled by U8 through an amplifier consisting of U11A and Q8,with the volume adjustable at R2. U7 is a frequency divider that takes a 3 MHz input and divides it bytwo so that the sound generator gets the 1.5 MHz input it needs for proper operation.
A major function performed by the GPIB/Cal Control board circuitry is to provide the control signalsrequired to operate the automatic RF detector Calibrator.
With reference to DWG# 21015, Sheet 2, and Figure 4-2, PPI U9 performs several functions. One is thecontrol of switches U12A, B, & C and U11B, C & D. These switches are drivers for the pin diodeswitches in the Calibrator, which switch in or out the required attenuation (as shown by the lines on theright side of the schematic). Since the three sets of two switches each operate the same, we will look atthe action of U12A & B.
When a logic signal is generated from the B0 output of U9, the signal is applied to two inputs ofopposite polarity (U112A, pin 6, is the minus input and U12B, pin 3, is the plus input). If the logic signalis high, this will force pin 7 of U12A to be driven negative and pin 1 of U12B will be driven positive.This will turn on the pin diode switch in the Calibrator, which will switch in the desired attenuation (inthis case, the 10 dB attenuator). If a logic zero comes from the B0 output of U9, then the reversecondition will be true and the attenuator will be switched out because current will be forced through theattenuator in the opposite direction.
PPI U9 also interfaces the U10 14-bit DAC with the incoming data bus lines. The interface consists of abyte wide data bus from U9 port A, two control lines from U9 ports C0 and C1 to U10 ports A0 and A1,and a write enable signal from U9 port C3 to U10 WR. The CS port on U10 is not used. Signals from A0and A1 control the operation of U10 so that a write operation can either load the data into the DACinternal register’s least significant byte or through DB0 to DB5 to the most significant byte or to transferthe register data to the DAC output.
U13 and U10 work together as a standard inverting operational amplifier. The loaded data connects theVREF input through a resistive network to an internal summing junction. The data is also connected to thefeedback signal from the RFB input through an internal fixed value resistance, and to the inverting inputof U13. Since VREF has a value of -10 V, the output of U13 pin 6 will range from 0 to 10 V.
Shown to the lower right of U10 on the schematic is a summing junction which receives one signal fromU13 through R15, and potentiometer R16 (CALIB SET), which is in parallel with R74. A second signalthen comes from the thermistor bridge circuit of U16 and Q5. The bridge circuit uses the thermistor inthe Calibrator as one leg of a bridge. The bridge is self-balancing, and always seeks a voltage level thatwill keep it in balance. When the system is first turned on, the thermistor will have a high resistancebecause it is cold. This unbalanced condition will cause a maximum voltage level to be present at TP9.The voltage level will stay high until the thermistor warms up to a point where the bridge is balanced.Then the voltage level at TP9 will drop. Due to negative feedback, it will seek a level just sufficient tomaintain a balance in the bridge. The bridge voltage is fed back into the summing junction through R18.
The system has two modes of operation controlled by U17A & B which are, in turn, controlled by eithera high or low output from the B7 connection of U9. In one mode, the circuit measures the voltage of thebridge (initiated by a low output from B7); in the other mode of operation, the circuitry controls thebridge voltage (initiated by a high output from B7). When it is required to measure the bridge voltage,the Calibrator must be turned off so the voltage that selects the measuring mode also turns off theoscillator. The reason for this is that the ambient voltage of the bridge must be measured with no RFapplied. U17B has two parts, one of which serves to invert the logic signal through pin 14 which is the
Theory of Operation
Manual No. 20790, Rev C, November 1998 4-5Superceded by Revision D, March 2009
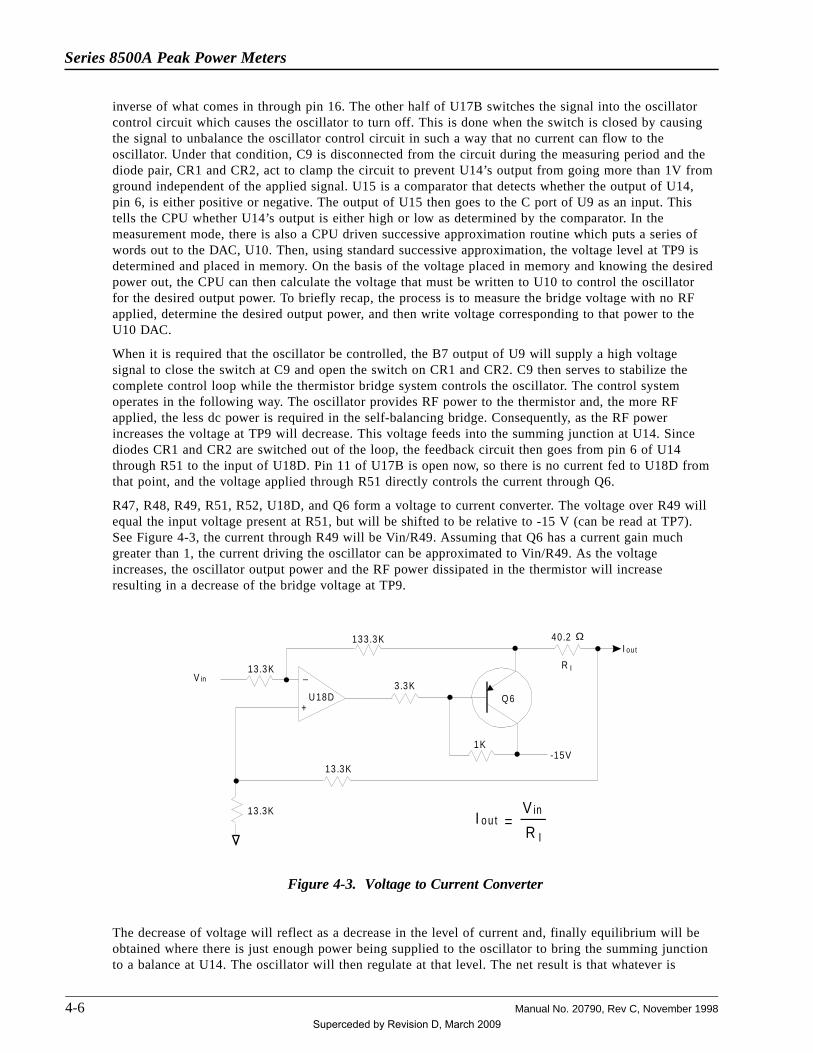
inverse of what comes in through pin 16. The other half of U17B switches the signal into the oscillatorcontrol circuit which causes the oscillator to turn off. This is done when the switch is closed by causingthe signal to unbalance the oscillator control circuit in such a way that no current can flow to theoscillator. Under that condition, C9 is disconnected from the circuit during the measuring period and thediode pair, CR1 and CR2, act to clamp the circuit to prevent U14’s output from going more than 1V fromground independent of the applied signal. U15 is a comparator that detects whether the output of U14,pin 6, is either positive or negative. The output of U15 then goes to the C port of U9 as an input. Thistells the CPU whether U14’s output is either high or low as determined by the comparator. In themeasurement mode, there is also a CPU driven successive approximation routine which puts a series ofwords out to the DAC, U10. Then, using standard successive approximation, the voltage level at TP9 isdetermined and placed in memory. On the basis of the voltage placed in memory and knowing the desiredpower out, the CPU can then calculate the voltage that must be written to U10 to control the oscillatorfor the desired output power. To briefly recap, the process is to measure the bridge voltage with no RFapplied, determine the desired output power, and then write voltage corresponding to that power to theU10 DAC.
When it is required that the oscillator be controlled, the B7 output of U9 will supply a high voltagesignal to close the switch at C9 and open the switch on CR1 and CR2. C9 then serves to stabilize thecomplete control loop while the thermistor bridge system controls the oscillator. The control systemoperates in the following way. The oscillator provides RF power to the thermistor and, the more RFapplied, the less dc power is required in the self-balancing bridge. Consequently, as the RF powerincreases the voltage at TP9 will decrease. This voltage feeds into the summing junction at U14. Sincediodes CR1 and CR2 are switched out of the loop, the feedback circuit then goes from pin 6 of U14through R51 to the input of U18D. Pin 11 of U17B is open now, so there is no current fed to U18D fromthat point, and the voltage applied through R51 directly controls the current through Q6.
R47, R48, R49, R51, R52, U18D, and Q6 form a voltage to current converter. The voltage over R49 willequal the input voltage present at R51, but will be shifted to be relative to -15 V (can be read at TP7).See Figure 4-3, the current through R49 will be Vin/R49. Assuming that Q6 has a current gain muchgreater than 1, the current driving the oscillator can be approximated to Vin/R49. As the voltageincreases, the oscillator output power and the RF power dissipated in the thermistor will increaseresulting in a decrease of the bridge voltage at TP9.
The decrease of voltage will reflect as a decrease in the level of current and, finally equilibrium will beobtained where there is just enough power being supplied to the oscillator to bring the summing junctionto a balance at U14. The oscillator will then regulate at that level. The net result is that whatever is
3.3K
133.3K
13 .3K-15V
13.3K
13.3K
1K
U 18D
_
+Q 6
R IV in
I ou t
R I=
V inI ou t
40.2 Ω
Figure 4-3. Voltage to Current Converter
Series 8500A Peak Power Meters
4-6 Manual No. 20790, Rev C, November 1998
Superceded by Revision D, March 2009

written into the U10 DAC will force the voltage at the thermistor bridge to the desired level to producethe required power level from the oscillator.
U18A is the buffer for the incoming +10V reference voltage. Q10 and Q11 are controlled by the B6connection of U9 to provide a signal which can supply current to turn on a relay external to the PPM forspecial applications.
A3 Test Points
The test points in Table 4-2 can be checked for the correct signals on the A3 GPIB/Cal Control board:
Test Point Description
TP1 +5 V
TP2 5 V Common
TP3 -15 V
TP4 15 V Common
TP5 Output of the control amplifier for the Calibrator control. Itsvoltage (ranging from a few hundred mV to 10 V) will be relatedto the power required by the Calibrator.
TP6 +15 V
TP7 Measure from TP7 to TP3 to give an indication of the currentthrough the oscillator. Will be between 1 and 30 mA.
TP8 +10 V
TP9 Output of the thermistor bridge. Typically will have a voltage ofabout 7 V under ambient conditions.
Table 4-2. A3 Test Points
Theory of Operation
Manual No. 20790, Rev C, November 1998 4-7Superceded by Revision D, March 2009

4.2.3 CPU PC Assembly (A4)
See Figure 4-4 and schematic diagram #16879 in Chapter 8.
Figure 4-4. CPU (A4) Block Diagram
Series 8500A Peak Power Meters
4-8 Manual No. 20790, Rev C, November 1998
Superceded by Revision D, March 2009
The CPU (Central Processing Unit) PC board controls all of the functions of the instrument. The CPU islogically divided between those circuits shown on Sheet 1 of DWG# 16879 and those shown on Sheet 2of DWG# 16879.
Sheet 1 of DWG# 16879 shows the following CPU functions:
• The Microprocessor (MPU)
• Address Decoding and Handshake
• Unbuffered Memory
• Reset Timer
• Interrupt Priority Decoder
• Data Buffers
Sheet 2 of DWG# 16879 shows the following CPU functions:
• External Memory
• Real Time Clock
• Backup Battery circuit
Starting with Sheet 1 of DWG# 16879 and going in the same sequence as shown above, the functionaloperation of each CPU sub-circuit is described as follows:
The Microprocessor
The Microprocessor is a Motorola 68000 MPU. It has a 16-bit data bus, 32-bit internal registers, and runson a 6-MHz clock frequency. If you need to see the timing of the MPU in its various modes of operation,it is recommended that you refer to the manufacturer’s manual.
Address Decoding and Handshake
This circuit performs the address decoding for the memories and other devices included on the CPUboard and elsewhere in the instrument. It generates the device select signals for the various components,creates the proper timing for each device, and performs the necessary handshaking for the transfer of databetween the CPU and the different devices.
U18A & B, U20B, and U19C decode address lines 20 through 23 to select the multiplexer U34. Theaddress strobe AS is active when the address lines hold a valid address.
Address lines 16, 17, 18, and 19 select one of the 16 outputs of the multiplexer, which will be used as thedevice select line (CS0 through CS15). CS0 through CS7 address the memories; CS8 through CS13address different I/O devices; and CS15 addresses devices that require a handshake according to the 6800protocol.
U15A, U38, U19A, D & E, and U16 create the proper timing and handshaking for each device category.When selecting one of the memories, U15A will produce a direct DTACK (Data Transfer ACKnowlege)signal to U12 through NAND gate U21C. The MPU will then execute the data transfer withoutintroducing any additional wait states. When selecting one of the I/O devices (CS8 through CS13), theoutput of U38D goes high thus enabling the shift register, U16, which is clocked by the 6 MHz systemclock. After three clock pulses, output QC goes high creating an active CE signal that is used by theAnalog PC board circuitry. After another clock pulse QD goes high, is inverted in U19A, and creates adelayed DTACK through U21C. The MPU responds by inserting a corresponding number of wait states inthe data transfer which allows the device to time the data transfer. DTACK can also be received from anyexternal device connected to the CPU bus that has its own address decoding circuits.
When CS14 or CS15 are selected, U19E will generate a VPA (Valid Peripheral Address) signal throughNAND gate U21B. This tells the MPU that a valid 6800 device has been addressed, and the MPU willrespond by generating a data transfer according to the 6800 protocol. The E and VMA (Valid Memory
Theory of Operation
Manual No. 20790, Rev C, November 1998 4-9Superceded by Revision D, March 2009
Address) outputs are used in this protocol. There is an external input to the VPA, and the VPA is alsoused in the interrupt process.
NAND gate U20A and inverter U40A provide an active low signal when a device outside the buffers isaddressed.
Unbuffered Memory
The memory inside the buffers consists of two 8Kx8 bits of RAM and two 32Kx8 bits of ROM with theRAMs kept alive by a battery when the instrument is turned off. NAND gate U26D (also batterypowered) is deselected by the AC FAIL signal when the instrument is off to protect the contents of thememory. Each pair of memories use the 16-bit wide data bus and are addressed with one device selectsignal. The upper and lower data bytes are selected in OR gate U14 by letting the Upper Data Strobe(UDS) and Lower Data Strobe (LDS) gate the R/W output from the MPU to produce the Lower dataWrite Enable (L.WE), Upper data Write Enable (U.WE), Lower data Output Enable (L.OE), and Upperdata Output Enable (U.OE) signals.
Reset Timer
The U17 reset timer consists of a 555 monostable pulse generator. When the instrument is turned on orwhen the reset button on the back panel is pressed it generates a 0.5 second pulse to reset the MPU.U22A & B give separate open collector inputs to the RESET and HALT inputs. U22C provides the HALTsignal which comes from the Delay board. The RESET pin of the MPU is a bidirectional line, and theMPU can generate its own resets. Diode CR1 enables the AC Fail to Halt the MPU. This is necessary toensure that the MPU is not trying to make a data transfer to the non-volatile RAMs or Real Time Clockwhen they are being deselected by the AC Fail signal.
Interrupt Priority Decoder
The U37 Interrupt Priority Decoder interfaces the three interrupt priority lines (IPL0, IPL1, and IPL2) tothe seven interrupt request lines (IRQ1 through IRQ7). The three output lines of U37 will have encodedthe number of the highest priority input line that has been driven low. As can be seen on the schematic,the AC Fail line is connected to the highest priority interrupt input. The lowest priority interrupt input isconnected to the Real Time Clock for timed interrupts.
Data Buffers
Data buffers U7, U8, U9, U13, U32, and U33 give an increased drive capability to all of the signals onthe CPU bus that require the increased capacity. They are enabled by U40A from the Address Decodercircuit. This will happen each time none of the Unbuffered Memories have been selected. The R/W signaldetermines the direction of data flow in the bidirectional buffers used with the data bus lines.
External Memory
The External Memory interfaces the buffered CPU bus. It consists of two pairs of 8Kx8 bits of RAM(U5, U6, U30, and U31), and three pairs of 32Kx8 bits of ROM (U2, U3, U4, U27, U28, and U29).
Real Time Clock
The Real Time Clock, U1, interfaces the Buffered CPU bus. Data transfer follows the 6800 compatibleprotocol with the E and VMA signals to produce the handshaking required for the transfer. U23A & B,U24A & B, U25B and U26B control U1. To see the timing used in the data transfer, it is recommendedthat the manufacturer’s data sheet for U1 (Motorola Type MC-146818P) be consulted. C47 adjusts thefrequency of the internal clock of U1. The 32.768 kHz frequency can be monitored at TP6. The RealTime Clock also provides a timed Interrupt Request signal (IRQ1) used by the CPU operating system. Itsfrequency is software programmable, and can be monitored at TP7. The Real Time Clock is deselected bythe AC Fail line through U26B.
Series 8500A Peak Power Meters
4-10 Manual No. 20790, Rev C, November 1998
Superceded by Revision D, March 2009
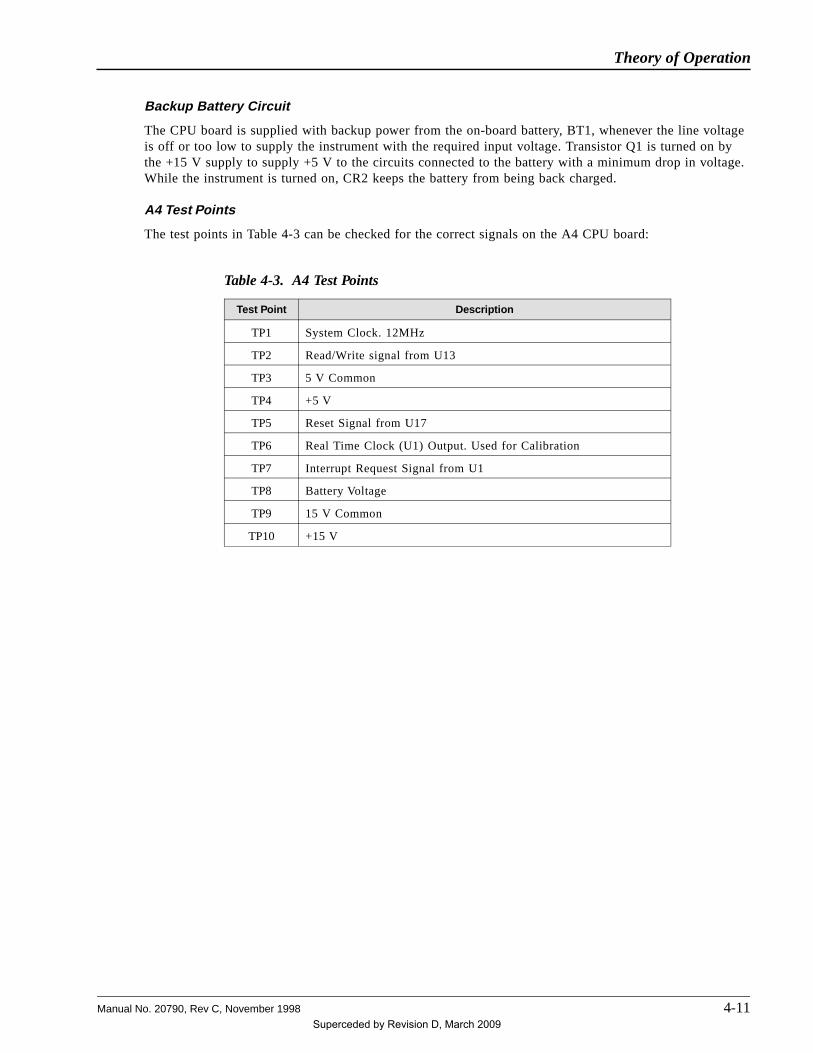
Backup Battery Circuit
The CPU board is supplied with backup power from the on-board battery, BT1, whenever the line voltageis off or too low to supply the instrument with the required input voltage. Transistor Q1 is turned on bythe +15 V supply to supply +5 V to the circuits connected to the battery with a minimum drop in voltage.While the instrument is turned on, CR2 keeps the battery from being back charged.
A4 Test Points
The test points in Table 4-3 can be checked for the correct signals on the A4 CPU board:
Test Point Description
TP1 System Clock. 12MHz
TP2 Read/Write signal from U13
TP3 5 V Common
TP4 +5 V
TP5 Reset Signal from U17
TP6 Real Time Clock (U1) Output. Used for Calibration
TP7 Interrupt Request Signal from U1
TP8 Battery Voltage
TP9 15 V Common
TP10 +15 V
Table 4-3. A4 Test Points
Theory of Operation
Manual No. 20790, Rev C, November 1998 4-11Superceded by Revision D, March 2009

4.2.4 Digital Delay PC Assembly (A5)
See Figure 4-5, Figure 4-6, and schematic diagram #16686 in Chapter 8.
The Digital Delay PC board circuitry establishes time delays that may be desired when examining samplepulses. Delays can be set in increments of 0.1 ns up to about 430 ms.
As can be seen in Figure 4-5, there is a complex interaction between each of the sub-functions of thedelay board circuitry. This section describes the sequence of events that occur in the delay board startingwith the reset of the circuits, and continuing through the generating of the pulse sample outputs. Adetailed description of individual circuitry blocks on the Digital Delay PC board follows the sequence ofevents.
Figure 4-5. Digital Delay (A5) Block Diagram
Series 8500A Peak Power Meters
4-12 Manual No. 20790, Rev C, November 1998
Superceded by Revision D, March 2009
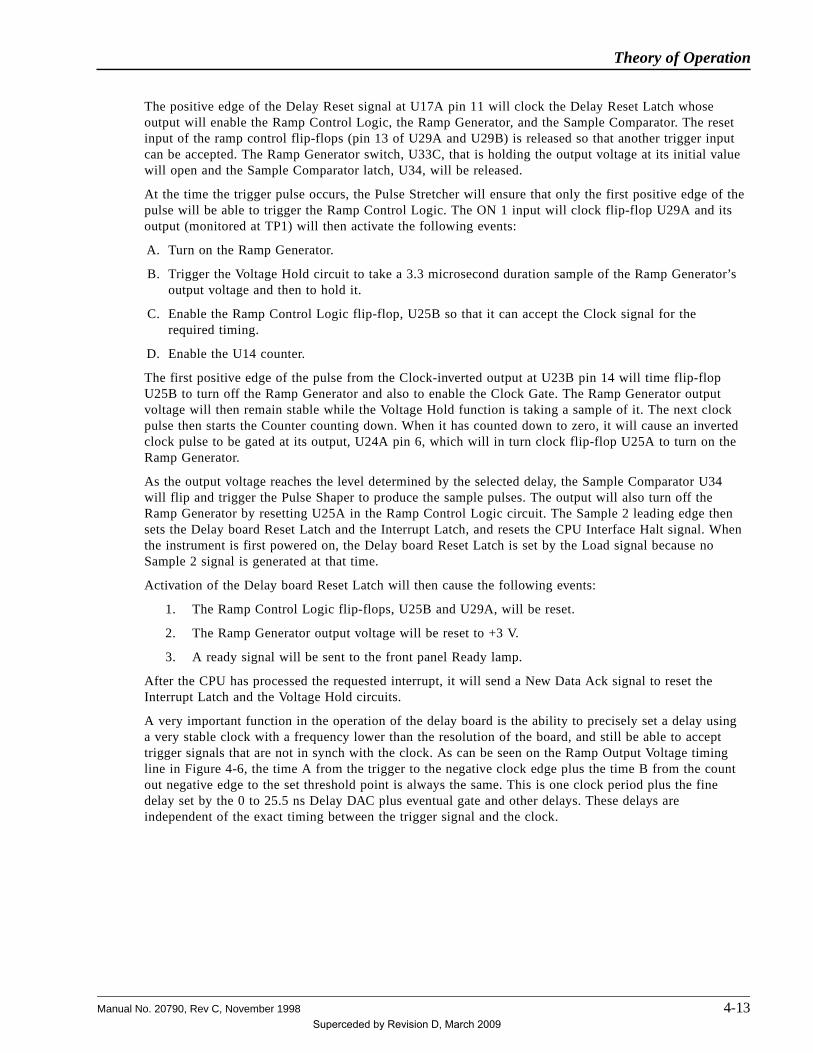
The positive edge of the Delay Reset signal at U17A pin 11 will clock the Delay Reset Latch whoseoutput will enable the Ramp Control Logic, the Ramp Generator, and the Sample Comparator. The resetinput of the ramp control flip-flops (pin 13 of U29A and U29B) is released so that another trigger inputcan be accepted. The Ramp Generator switch, U33C, that is holding the output voltage at its initial valuewill open and the Sample Comparator latch, U34, will be released.
At the time the trigger pulse occurs, the Pulse Stretcher will ensure that only the first positive edge of thepulse will be able to trigger the Ramp Control Logic. The ON 1 input will clock flip-flop U29A and itsoutput (monitored at TP1) will then activate the following events:
A. Turn on the Ramp Generator.
B. Trigger the Voltage Hold circuit to take a 3.3 microsecond duration sample of the Ramp Generator’soutput voltage and then to hold it.
C. Enable the Ramp Control Logic flip-flop, U25B so that it can accept the Clock signal for therequired timing.
D. Enable the U14 counter.
The first positive edge of the pulse from the Clock-inverted output at U23B pin 14 will time flip-flopU25B to turn off the Ramp Generator and also to enable the Clock Gate. The Ramp Generator outputvoltage will then remain stable while the Voltage Hold function is taking a sample of it. The next clockpulse then starts the Counter counting down. When it has counted down to zero, it will cause an invertedclock pulse to be gated at its output, U24A pin 6, which will in turn clock flip-flop U25A to turn on theRamp Generator.
As the output voltage reaches the level determined by the selected delay, the Sample Comparator U34will flip and trigger the Pulse Shaper to produce the sample pulses. The output will also turn off theRamp Generator by resetting U25A in the Ramp Control Logic circuit. The Sample 2 leading edge thensets the Delay board Reset Latch and the Interrupt Latch, and resets the CPU Interface Halt signal. Whenthe instrument is first powered on, the Delay board Reset Latch is set by the Load signal because noSample 2 signal is generated at that time.
Activation of the Delay board Reset Latch will then cause the following events:
1. The Ramp Control Logic flip-flops, U25B and U29A, will be reset.
2. The Ramp Generator output voltage will be reset to +3 V.
3. A ready signal will be sent to the front panel Ready lamp.
After the CPU has processed the requested interrupt, it will send a New Data Ack signal to reset theInterrupt Latch and the Voltage Hold circuits.
A very important function in the operation of the delay board is the ability to precisely set a delay usinga very stable clock with a frequency lower than the resolution of the board, and still be able to accepttrigger signals that are not in synch with the clock. As can be seen on the Ramp Output Voltage timingline in Figure 4-6, the time A from the trigger to the negative clock edge plus the time B from the countout negative edge to the set threshold point is always the same. This is one clock period plus the finedelay set by the 0 to 25.5 ns Delay DAC plus eventual gate and other delays. These delays areindependent of the exact timing between the trigger signal and the clock.
Theory of Operation
Manual No. 20790, Rev C, November 1998 4-13Superceded by Revision D, March 2009
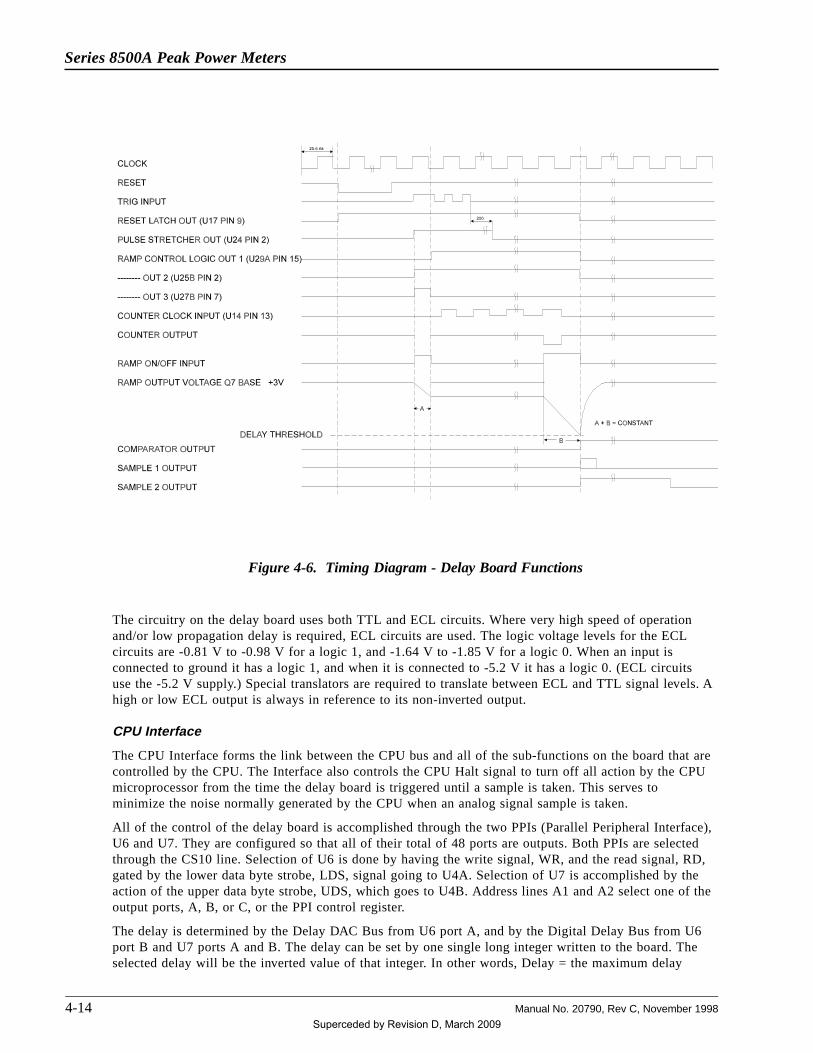
The circuitry on the delay board uses both TTL and ECL circuits. Where very high speed of operationand/or low propagation delay is required, ECL circuits are used. The logic voltage levels for the ECLcircuits are -0.81 V to -0.98 V for a logic 1, and -1.64 V to -1.85 V for a logic 0. When an input isconnected to ground it has a logic 1, and when it is connected to -5.2 V it has a logic 0. (ECL circuitsuse the -5.2 V supply.) Special translators are required to translate between ECL and TTL signal levels. Ahigh or low ECL output is always in reference to its non-inverted output.
CPU Interface
The CPU Interface forms the link between the CPU bus and all of the sub-functions on the board that arecontrolled by the CPU. The Interface also controls the CPU Halt signal to turn off all action by the CPUmicroprocessor from the time the delay board is triggered until a sample is taken. This serves tominimize the noise normally generated by the CPU when an analog signal sample is taken.
All of the control of the delay board is accomplished through the two PPIs (Parallel Peripheral Interface),U6 and U7. They are configured so that all of their total of 48 ports are outputs. Both PPIs are selectedthrough the CS10 line. Selection of U6 is done by having the write signal, WR, and the read signal, RD,gated by the lower data byte strobe, LDS, signal going to U4A. Selection of U7 is accomplished by theaction of the upper data byte strobe, UDS, which goes to U4B. Address lines A1 and A2 select one of theoutput ports, A, B, or C, or the PPI control register.
The delay is determined by the Delay DAC Bus from U6 port A, and by the Digital Delay Bus from U6port B and U7 ports A and B. The delay can be set by one single long integer written to the board. Theselected delay will be the inverted value of that integer. In other words, Delay = the maximum delay
Figure 4-6. Timing Diagram - Delay Board Functions
Series 8500A Peak Power Meters
4-14 Manual No. 20790, Rev C, November 1998
Superceded by Revision D, March 2009
minus the set value. The trigger level is determined by the Trig Level Bus. It requires 10 bits of datawhich are sent from U6 port C and U7 ports C0 and C1. The trigger is selected by Trig Select 0 and TrigSelect 1 from U7 ports C2 and C3. The delay board’s interrupt acknowledgment, New Data Ack, comesfrom U7 port C7.
The Load, Reset, and CPU Halt signals are generated by U1, U2, and U3. If U2 multiplexes U7 ports C2and C3 into the Y0 line, it tells the circuit to do nothing. Into the Y1 line means to reset, into the Y2 linetells it to load, and into the Y3 line indicates Halt Enable. To set the Halt signal, Halt Enable sets thelatch U3A. Then, when Y1 is addressed, the following will happen:
1. The monostable pulse generator, U1, will generate a reset signal at the point where the negativeedge of the signal at Y1 occurs.
2. After that, the positive edge of the signal at Y1 will clock U3B which will produce the Haltsignal.
The Halt function will be reset by a signal through the Sample 2 line. If no sample has beentriggered, it can be reset by the CPU Reset or the interrupt requests corresponding to datareceived from the keyboard or through the GPIB. This is done by resetting latches U3A andU3B. The Reset also activates the Software Trigger. This will be ignored by the delay circuitsunless soft trigger has been selected.
Trig Threshold
The Trig Threshold circuit sets the level for the internal Trig Comparators. It accepts data from the TrigLevel Bus, and produces a voltage between 0 and 2.5 V, which is sent to the comparators.
The Trig Threshold circuitry consists of the 10-bit DAC, U40, amplifier U41B, and associatedcomponents. Its output is determined by the data present on the Trig Level Bus, and can be monitored atTP15. The amplitude range is 0 to 10.23 V with 10 mV resolution. Registers R16 and R17 form a voltagedivider to give a level between 0 and 2.56 V which is sent to the Trig Comparators.
Internal Trig Comparators
The Internal Trig Comparators consist of one fast comparator each for channel A and channel B InternalTrigger Signals. The comparators also contain over-voltage protection at each of the inputs to protectthem against voltages higher than a maximum of 3.0 V.
The Internal Trig Comparators function is accomplished by using one dual, fast ECL output comparator.Its recommended maximum input voltage is 3 V. Each input is protected against over-voltage by anidentical circuit. On channel A, the input is connected to the emitter of Q13. The base of Q13 isconnected to 2.1 V which is derived from the +15 V supply through R8 and R9. When the voltage isgreater than 2.1 V plus the VBE(ON) of Q13, Q13 will then have a low resistance to ground that willserve to limit the comparator input voltage. The non-inverted outputs of the channel A and channel Bcomparators can be monitored at TP14 and TP15.
Trig Select
The Trig Select is a digital multiplexer that selects either the Internal trigger from channel A or B, asoftware trigger generated by the CPU, or an external trigger from a source connected to the instrumentrear panel, all controlled through the CPU interface.
The Trig Select circuitry consists of an ECL 4-wide 4-3-3-3 input, AND/OR gate U30, and a TTL-ECLtranslator, U31, for the trigger select lines. The trigger inputs are active lows, and are selected when thetwo remaining inputs of the OR gate are low. The output goes low when the selected trigger input goeslow.
Theory of Operation
Manual No. 20790, Rev C, November 1998 4-15Superceded by Revision D, March 2009

Trig Pulse Stretcher
The Trig Pulse Stretcher makes sure that the delay board is triggered only by the first leading edge ofeach trigger pulse. It stretches the pulse to 200 ns after the last trailing edge of the pulse. In this way, allglitches shorter than 200 ns will be removed from the pulse. Its input comes from the Trig Select circuit,and its output goes to the Ramp Control Logic.
The Pulse Stretcher function is initiated by the monostable multivibrator, U26, which is configuredthrough its E+ and E- inputs by flip-flop U29B to accept only a negative sloping trigger, and by the2-input OR gate U24C. All action takes place in the ECL format.
To better understand the operation of the Pulse Stretcher, assume that the output of U29B has beenclocked but not reset. The input would then be low. When the input goes high, the first thing that happensis that the output of the OR gate goes high. Then, the output of U29B will be reset causing the secondinput of the OR gate to go high. When the input goes low it will trigger U26 into generating a 200 nsoutput pulse. U26 can be triggered so that if the input signal contains more pulses that are less than200 ns apart, the output will stay low until 200 ns after the last negative edge. When the output of U26goes back to the high condition (the reset input of U29A is then low). U29A is clocked and the invertedoutput goes low. Since this means that both inputs of U24C are low, the output of the Pulse Stretcher willnow go low.
After the PPM is first turned on, it is necessary to give the Pulse Stretcher one trigger input pulse(generated by the soft trigger function) to initialize it.
Clock
The Clock is a stable crystal controlled square wave generator. It operates at 39.0625 MHz to give a25.6 ns period.
The Clock consists of U23A,B & C, and Y1. U23A is a positive feedback amplifier with the Y1 crystal.U23C provides a dc bias to the input and U23B is an output buffer. The frequency is adjusted with C79.The clock frequency can be measured with a high impedance probe at TP5.
Clock Gate
The Clock Gate provides the timing to the Counter when either in the count mode or in the delay datamode. When counting, the clock is enabled with a clock enable signal from the Ramp Control Logic and,when loading, it is enabled by a load signal from the CPU Interface.
The Clock Gate consists of AND gates U28A and U28B whose outputs are OR’d in U27C. The clock isconnected to both U28A and U28B, and can be gated by either the load signal on U28A pin 4 or by theRamp Control Logic Out 2 on U28B pin 7.
Counter
The Counter establishes a coarse delay time. It is controlled by the Digital Delay Bus and the load signalfrom the CPU Interface. The clock gives it a resolution from 25.6 ns to a maximum delay of about430 ms. The output is the selected clock pulse with just one gate delay with respect to the clock.
The Counter consists of high speed ECL binary counter U14, five TTL binary counters U9, U12, U11,U10, and U9 (with the first one being S-TTL), and the clock input. ECL delay data is translated fromTTL by U13. It is clocked from the Clock circuitry. During the delay count, the multiplexer U16 selectsthe Terminal Count (TC connection) of U14 as the clock input to U8, and the Carry Out (CO connection)of U8 as the clock input to U12, U11, U10, and U9. U11, U10, and U9 operate in a look-ahead, carrymode. U19A, U20A, and U24A are using the U8 Terminal Count and the U8 and U9 Carry Out to selectthe first clock pulse after the counter has counted up to a full count.
When all of the counters are loaded, they have to be provided with one clock pulse while the Load inputis low (Parallel Enable for U14) to execute the load. In U14, this is done by the Clock Gate circuit. For
Series 8500A Peak Power Meters
4-16 Manual No. 20790, Rev C, November 1998
Superceded by Revision D, March 2009

the other counters, the load signal will be executed by having the multiplexer U16 delay the negativeedge of the signal and inverting the signal using U15A, B & C.
Delay Board Reset Latch
The Delay board reset latch resets the board to accept the first trigger pulse after the reset isaccomplished. The reset signal comes from the CPU through the Interface. The Latch resets the RampControl Logic, the Ramp Generator, the Voltage Hold, the Sample Comparator latch, and the Readyoutput that controls the Ready and New Data lamps on the front panel of the instrument.
The Delay board Reset Latch function is accomplished by flip-flop U17A. Inverter U15E and NAND gateU20D are used so that U17A can be set by both the Sample 2 and Reset signals.
Ramp Generator
The Ramp Generator produces an accurate ramp for the 0 to 25.6 ns delay. The Reset input presets thevoltage at the output to a 3.0 V bias. When turned on by the ON/OFF input, the voltage drops at a ratethat can be adjusted with the Delay Adjust potentiometer. The output voltage can be held at a fixed valuefor a long period of time with the Voltage Hold circuit.
The Ramp Generator is driven by a dc current sink consisting of U32A, Q9, and Q10. U32 compares thevoltage at R32 with a voltage reference provided by CR2, R29, R30, and R31. The output of U32,boosted in darlington configuration, will regulate the current through R32 to I = Vref/R32. The currentwhich forms the slope of the ramp is adjusted by R30 (DELAY ADJ). Q5 and Q6 are configured as adifferential pair driven by the differential outputs of the ECL gate U27B. When the Ramp Generator isoff, the current flows from ground. When it is on, it discharges C14 at a rate equal to dV/dT = I/C. Thestarting voltage is provided by the +10 V reference through R44 and R45 when switch U33C is closed.
Voltage Hold
The Voltage Hold circuit holds the output voltage of the Ramp Generator during the time it is waiting forthe count output from the Counter. It consists of a double buffered sample and hold amplifier with inputand output tied together. It is reset by the New Data Ack signal from the CPU Interface. The Sampleinput from the Ramp Control Logic samples the voltage for 33 µs and then holds the voltage. The holdmechanism only prevents the voltage from increasing, not from decreasing. A controlled current leakageensures that the droop of the voltage is positive, and thus is taken care of by the Voltage Hold circuit.
The Voltage Hold circuit consists of amplifiers U37A & B, analog switches U33A & B, monostablevibrator U22A, and NAND gates U20B & C. The output of U37B sinks all leakage current injected to theRamp Generator output voltage mode. R46 provides a controlled leakage to ensure that the leakage ispositive. Diode CR1 ensures that U37B will not prevent the voltage from decreasing when the RampGenerator is turned on. U37’s output voltage can be monitored at TP9. U37A serves as a buffer amplifier.Its output can be sampled and held by analog switches U33A & B. Before the sample is taken, U33B isclosed to keep the voltage at 3.0 V. When the sample is triggered, U22A produces a 3.3 µs pulse closingU33A. The leading edge of the pulse will also set the flip-flop formed by U22B & C whose output willopen U33B. During the sampling period, C9 will be charged and will then hold the voltage.
Sample Comparator
The Sample Comparator compares the output from the Ramp Generator with the output voltage from the0 to 25.6 ns Delay circuit. It has a latch input from the Delay board Reset Latch. The latch prevents anychange in the output of the comparator from the time the sample is triggered to the time the delay boardis reset so that no spurious samples will be taken.
The Sample Comparator consists of ECL comparator U34, Q7, and Q8. Q7 and Q8 increase the inputimpedance of the comparator, and to stabilize the input bias current. U34 has a latch input that will keepthe output of the comparator from changing when driven ECL low. U34’s output can be monitored atTP11.
Theory of Operation
Manual No. 20790, Rev C, November 1998 4-17Superceded by Revision D, March 2009

Ramp Control Logic
The Ramp Control Logic controls the sequence of events that are required to generate the selected timedelay. The Reset input enables the circuit to accept the first positive edge from the trigger pulse. The ON1 input accepts the trigger pulse to turn on the Ramp Generator, enable the Counter, and to initiate theVoltage Hold. The OFF 1 input, consisting of the first negative edge of the clock signal after the trigger,turns off the Ramp Generator and enables the Clock Gate. The ON 2 signal comes from the Counter’scount output and turns on the Ramp Generator. The OFF 2 signal consists of the Sample Comparatoroutput which turns off the Ramp Generator when the sample is taken.
TP1 can be used as an oscilloscope trigger when testing the Delay board.
Zero to 25.5 ns Delay
This circuit consists of a DAC controlled by the Delay DAC Bus through the CPU Interface circuitry. Itsets the proper levels for a delay between 0 and 25.5 ns with an accuracy of 0.1 ns. Its output goes to theSample Comparator.
The 0 to 25.5 ns Delay is set by the 8-bit DAC U35 and amplifier U32B. The output is biased by R37from the +10 V reference, and has a range of -0.5 V to +0.994 V full scale with 5.86 mV resolution. Theoutput voltage can be measured at TP6.
Pulse Shaper
The Pulse Shaper is triggered by the Sample Comparator and provides the sample signals to the samplerson the analog boards. It also provides a synch signal to the rear panel SYNCH OUTPUT connector of theinstrument. The synch signal is simultaneous with the 15 ns wide Sample 1 signal. The Sample 2 signalis also used in the CPU Interface to end the halt signal to the CPU. Sample 2 also goes to the InterruptLatch and the Delay board Reset Latch to prevent any triggering from occurring until after the delayboard has been reset.
The Pulse Shaper consists of an ECL monostable multivibrator, U38, which will provide a 15 ns pulse.U35 provides buffered differential outputs to the Sample 1 line and the Synch Out signal. U22 provides a4.3 ms Sample 2 pulse.
Interrupt Latch
The Interrupt Latch output goes directly to the CPU interrupt request input to alert the CPU that a samplehas been taken. It is reset by the New Data Ack signal coming from the CPU Interface when the analogboard has finished with the sampled voltage.
The Interrupt Latch consists of a D-type flip-flop, U17B. It is clocked by the Sample 2 line to produce aninterrupt request New Data signal to the CPU, and is reset through the New Data Ack. line.
Series 8500A Peak Power Meters
4-18 Manual No. 20790, Rev C, November 1998
Superceded by Revision D, March 2009

A5 Test Points
The test points in Table 4-4 can be checked for the correct signals on the A5 Delay Line board:
Test Point Description
TP1 Output of U29A. Trigger signal that tells when the board has beentriggered and reset. Can trigger a scope when testing the board.Signal goes low at trigger and high at sample time.
TP2 -5.2 V
TP3 5 V Common
TP4 +5 V
TP5 Clock Frequency (C79 adjusts)
TP6 Output of U36, U37 DAC, which determines the 0 to 25.5 nsthreshold.
TP7 U34 comparator input
TP8 U34 comparator input
TP9 U37B hold amplifier output
TP10 10 V Reference
TP11 U34 comparator output
TP12 5 V Common
TP13 U39 comparator output (trigger signal)
TP14 U39 comparator output (trigger signal)
TP15 U40. Trigger level DAC
TP16 +15 V
TP17 15 V Common
TP18 -15 V
Table 4-4. A5 Test Points
Theory of Operation
Manual No. 20790, Rev C, November 1998 4-19Superceded by Revision D, March 2009

4.2.5 Analog PC Assembly (A6/A7)
The Analog PC circuitry accepts, converts to digital, and conditions the analog voltage coming from thechannel A and B RF detectors. A6 is the reference designation for the channel A board, and A7 is thedesignation for the channel B board. Both boards are configured the same. The Model 8501A meter usesonly A6.
Refer to Figure 4-7 and sheet 1 of schematic diagram #20742 in Chapter 8.
Figure 4-7. Analog PC (A6/A7) Block Diagram
Series 8500A Peak Power Meters
4-20 Manual No. 20790, Rev C, November 1998
Superceded by Revision D, March 2009

The signal from the delay line is applied to a fast sample and hold circuit (CR16 to 19 and U29) with asample pulse width of 15 ns. Next is a second sample and hold circuit (U28) with a pulse width ofapproximately 4 µs. The second sample and hold circuit is to ensure that the sampled signal that ispresent will not change in amplitude while it is being held. The signal is held during the time from whenthe sample is taken to the completion of the data conversion cycle. U28 can either use the sampled signal,or take the signal directly from the input without using the sampling circuitry.
There are four stages of gain available after the signal reaches U28. The gain can be either 1 or 8 througheach stage. The circuits are composed of U27 with a fixed gain of 2, amplifier U26, U18, low pass filterU19, U11 which is the third gain stage, and U12 which is the amplifier for the fourth gain stage. All fourstages are used only in the CW mode and give a total gain of just over 8,000. In the peak pulse mode thelast two amplifiers (U11 and U12) are not used, so the total gain will be 64.
After the four gain stages, there is a multiplexer circuit that allows the selection of either the measuredsignal from the detector or the voltage from the thermistor in the detector. U21B will generate a voltageproportional to the thermistor temperature. This voltage goes to U20, and then to the ADC.
U16, U17A, B & C, and U9 comprise a circuit that will give the absolute value and determine thepolarity sign of the signal. U16 ensures that the voltage is steady during the conversion time. It receivesthe status (when conversion is occurring) from A to D converter U7. The D to A conversion circuitformed by U8, U14A, and U21A give an analog output proportional to the power level being sensed bythe detector.
The system 10 V reference voltage comes from the U7 A to D converter. U14C gives the +10 Vreference, and U14B gives the -10 V reference. During the automatic self test routine of the instrument,the signal from the DAC (U8, U14, and U21) is tested to assure that these components are operatingproperly.
As an example of signal flow through the analog circuitry, when the first signal sample is directed to thefast sample and hold circuit, it comes in through the Sample 1 line (on the left side of the schematic) as abalanced ECL signal, and then goes to differential receiver Q2 and Q3.
When a trigger is sent, Q2 produces a current pulse to trigger blocking oscillator Q4. The blockingoscillator generates a 20 V pulse approximately 30 ns long at the secondary of T1. This pulse overcomesthe reverse bias normally applied to the sampling bridge (CR16 - CR18), and drives a heavy currentthrough it, thus connecting sampling capacitor C72 to the input signal during the sampling interval.
R120 gives a controlled discharge of C72 between the samples. This is done so that whenever a sample isto be taken, C72’s voltage is close to zero to set it to the same condition for each of the samples. Thereason for this is to assure repetitive accuracy for every sample of the specific signal being measured.U29 is a high impedance amplifier.
The second signal sample comes into the board through the line labeled Sample 2, and goes to a circuitwhich includes switch U25D, holding capacitor C70, and isolation amplifier U28. R136 serves the samepurpose as R120 (to control C70’s discharge). Setting the zero (or close to zero) dc offset level requiredwhile sampling is in progress is controlled at R112 (Sample Zero), and can be monitored at TP5.
Selection between the CW or peak power mode signals is through the U25A & B switches. U25A & Bcan also select the +15 V signal through U13A. This allows the gain of the various stages to be separatelychecked using a known input. U27 has a fixed gain of 2. U25C (on the negative input of U27) ispermanently closed, and improves the common mode rejection of the amplifier.
Each of the four selectable gain stages are identical. The first is a comparator (U23) where the inputsignal is compared with a fixed level. Then, the signal from each of the stages is sent to the U6 latch. U6can operate in several different modes. When measurements are being taken, the latch is in theautoranging mode. This means that the inputs for the latch are the signals from the comparators. Theoutputs, which directly follow the inputs in the autoranging mode, are controlling the switch and the gaincircuits. The first gain stage, U22A, determines whether the gain will be 1 or 8 by selecting different
Theory of Operation
Manual No. 20790, Rev C, November 1998 4-21Superceded by Revision D, March 2009

feedbacks. If the routine is in a mode where several samples are being averaged, the first sample will bein the autorange mode and be amplified by the selected gain.
When autoranging is inactive (latch output is high impedance), the latch interfaces with outputs from theCPU to allow the CPU to control the gain. This mode is used during calibration or self test to allow thegain to be manually selectable.
U19 is a filter that can be selected to be either in or out of the gain loop. In the CW mode it is in theloop, but in the pulse mode it is not used to allow for a faster settling time during the analog to digitalconversion. U19 is switched in or out of the loop by U15A.
U16 is an integrated sample and hold amplifier directly controlled by the status signal from the U7 A/Dconverter. When U7 is given the command to convert, the status signal goes active and stays active untilthe conversion has completed. Then U17B, C, and D rectify the signal to give a positive output that issent to one of the inputs of the U6 latch. Input 2D1 of U6 determines the positive or negative status ofthe signal. U7 interfaces directly to the data bus, and has a built-in 10 V voltage reference usedthroughout the system. R13 adjusts the value of the 10 V reference.
The thermistor interface circuit, U21B, uses the resistance of the detector’s thermistor in conjunction withthe 10 V reference to determine the temperature of the detector diodes. This output is then sent to theU20 multiplexer.
U8 is a 12 bit DAC. U21 gives a fixed offset so that there will be a resolution of exactly 2 mVcorresponding to 0.02 dB when R47 is adjusted to the proper gain setting. The total range is from +30 to-50 dBm.
Refer to sheet 2 of schematic diagram #20742. The board first has an RC network that compensates forthe frequency dependent losses in the delay, to assure correct pulse response. The signal is sent from theboard to the delay line. Sheet 2 also shows the buffer amplifiers used with the trigger signals and monitoroutputs. The input to these amplifiers comes from the detector output voltage before it reaches the delayline (at the point where the detector cable interfaces with the instrument). PPI U1 has all of the outputcontrol signals and status inputs as well as an interface to the CPU bus.
The trigger amplifier consists of OpAmp U30, high speed buffer U31, analog switch U32, and peripheralcircuitry. U30 and U31 form a composite amplifier with U31 transmitting the ac information throughC106, and U30 transferring the dc information through R165. R113 adjusts the dc offset of U30. Analogswitch U32 sets the gain of U30 either to unity or to 10. In the X10 gain range the rise time of thetrigger signal is slower. The monitor output is taken from U33, and is not corrected for offset.
U2A, B, C & D and U3A, B, C & D are the final address decoders. The chip select line, the Address line(A14), and data strobes choose whether to activate the A to D or D to A converter, or to activate PPI U1which is controlled by the data bus and will interface read or write signals through the A1 and A2 lines.
Sheet 3 of DWG# 20742 shows the voltage input and grounding configurations for all of the IC’s on theAnalog PC board.
Series 8500A Peak Power Meters
4-22 Manual No. 20790, Rev C, November 1998
Superceded by Revision D, March 2009

A6/A7 Test Points
The test points in Table 4-5 can be checked for the correct signals on the A4 CPU board:
Test Point Description
TP1 Reference Common
TP2 +10 V Reference
TP3 Output of the analog DAC
TP4 Analog output as seen on the rear panel connection
TP5 Output of the 2nd sample and hold
TP6 +5 V
TP7 5 V Common
TP8 -5 V
TP9 +15 V
TP10 -15 V
TP11 15 V Common
TP12 Can be used as scope trigger
TP13 0 Vdc adjust readout point
Table 4-5. A6/A7 Analog Test Points
Theory of Operation
Manual No. 20790, Rev C, November 1998 4-23Superceded by Revision D, March 2009

4.2.6 Front Panel Interface PC Assembly (A8)
The Front Panel Interface PC board powers and controls the instrument display (through U1, U2, U3, andU7); provides the interface to the keyboard and front panel indicator lamps (through U2, U4, and U7);and interfaces with the spin knob on the front panel.
Refer to Figure 4-8 and sheet 1 of schematic diagram #20196.
Figure 4-8. Front Panel Interface (A8) Block Diagram
Series 8500A Peak Power Meters
4-24 Manual No. 20790, Rev C, November 1998
Superceded by Revision D, March 2009

U11 interfaces with the CPU, the data bus, chip select lines, read/write lines, the A1 address line, and theclock input line. The output of U11 goes directly to the display. U1 is a 69K RAM to store what is beingshown on the display. This means that there is a separate data address and data bus between U11 and theU1 memory. U2 (the display and keyboard interface) has logic for the selection of the read and writefunctions. It has a number of scan lines (outputs) designated SL0, SL1, SL2, and SL3 that go to thekeyboard. Connection is made between one of the lines and one of the return lines (RL) to tell thecircuitry which key was pressed. The scan lines are also connected to the peripheral drive circuit so that,together with the output lines A0 through B3 (connected to U7), the control of which indicator lamp is tobe turned on is accomplished.
Refer to Sheet 2 of schematic diagram #20196. The circuit receives its input from the stepper motor thatinterfaces with the spin knob on the front panel. The output is a signal that corresponds to 16 differentkeys in the keyboard interface circuitry. Each one is equal to a speed at which the stepper motor is beingturned. Also, there are two other lines on the interface IC (U17B) that sense that the spin knob is in useand what direction it is being turned (U12B through RL0 through 7, and SL0 & 1). This signal is input toU14A & B.
The stepper motor creates two sinusoidal signals that are 90 degrees out of phase with each other. Thevoltages of these signals are proportional to the speed of rotation of the spin knob. That is, the higher thefrequency (speed of rotation), the higher the voltage. U14A & B are low pass filters with the cut-offfrequency determined by the slowest speed the spin knob can be turned (a small fraction of a Hertz). Asthe frequency increases, the level builds until it reaches a constant amplitude. The amplitude is input totimers U8A & B and used so that if the input level is above 2/3 of the level of the supply voltage, thenthe output will be high. If the input goes below 1/3 of the supply voltage level, it will go to zero. Thefunction is similar to a Schmitt trigger with levels of 1/3 and 2/3 of the supply voltage.
U8A & B output a train of square waves which are also 90 degrees out of phase with each other. Thesquare waves go through RC networks, and then give four inputs to U10. Each one of the inputsrepresents an up or down-going edge of one of the U8A & B square waves. The output is a pulse train ofshort pulses that indicate when the spin knob is being moved. U21A receives the pulse train, and U17A,B, C & D decode the direction of movement. If the knob is turned in one direction, U21B will have thesame pulse train. When the knob is turned in the other direction, the pulse train will not be present.
Flip flop U18A is a gate controlled by the data input signal. From U12A the signal goes to monostableoscillator U17A so that when the knob is first turned an approximate 100 ms pulse is generated (read atTP6). While this pulse is high, the U16 4-bit counter counts the number of pulses from the spin knob.The more pulses that are counted, the faster the rotation of the knob. When the count reaches 15, a carryout is generated and U9B stops the counter from starting back at zero. Thus the maximum count of 15 ispreserved, indicating the fastest spin knob rotation. When the U17A 100 ms timer ends, the U17Bmonostable outputs a SHIFT signal for approximately 20 ms. This tells the U2 keyboard decoder that thespin knob was moved. The four bit count from U16 is coded onto RL0 - RL7 by the U5 demultiplexerand part of PAL U10. PAL U10 gates the scan lines SL0 and SL1 with the highest order bit from U16 tocontrol U5. If the count is 0 - 7, the three lower order bits from the counter are coded onto R0 - R7 byU5 when SL0 goes high. If the count is 8 - 15, the three lower order bits are coded out when SL1 goeshigh. The state of the CNTRL signal from flip-flop U18B indicates whether the spin knob was turningclockwise or counterclockwise.
Refer to sheet 3 of schematic diagram #20196. This is the circuitry which supplies power to the display.Linear regulator U22 regulates the +12 V down from the unregulated +20 V. The higher voltages arestepped up from the unregulated +20 V by a switching fly-back power supply. U19 is a current modeswitching regulator IC which runs the supply. U19 controls the output voltages by varying the duty cycleof FET Q1, the power switch. The current through Q1 is limited by U19-3 which monitors the voltageacross sense resistor R44. The rise time of the flyback voltage is controlled by a damping networkcomposed of C60, R32, and R41. The frequency of U19 operation is fixed at about 100 kHz by timingcomponents R37 and C53.
Theory of Operation
Manual No. 20790, Rev C, November 1998 4-25Superceded by Revision D, March 2009
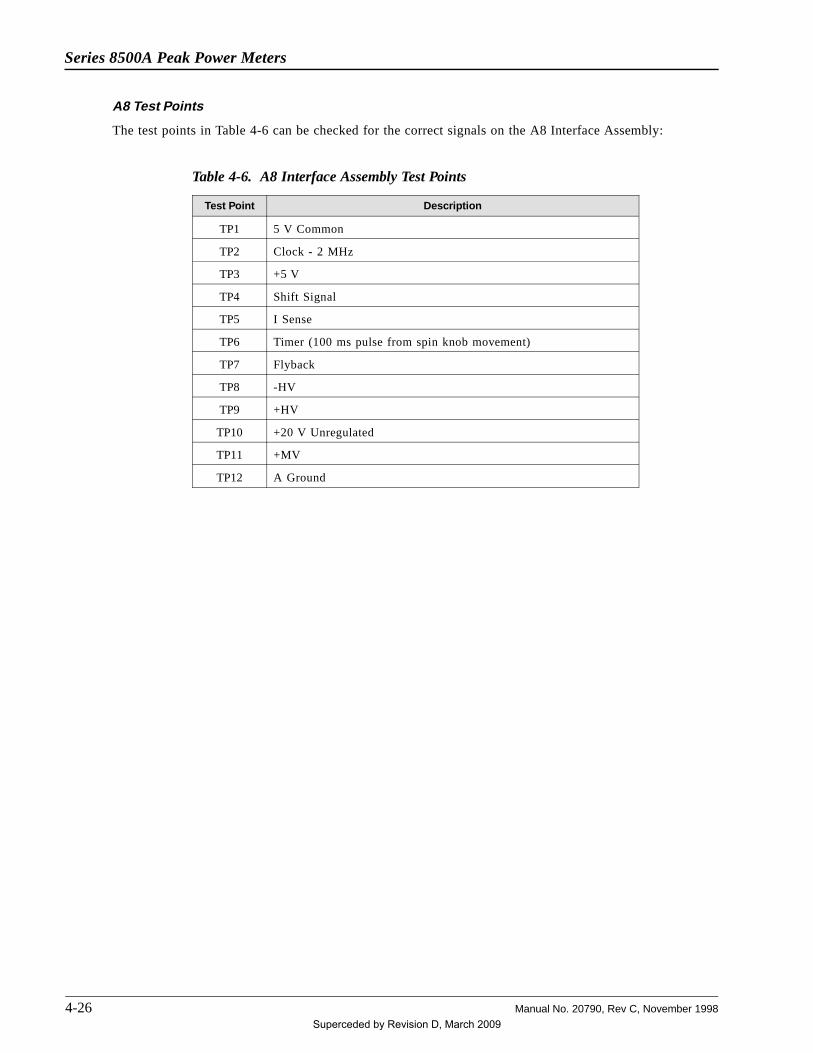
A8 Test Points
The test points in Table 4-6 can be checked for the correct signals on the A8 Interface Assembly:
Test Point Description
TP1 5 V Common
TP2 Clock - 2 MHz
TP3 +5 V
TP4 Shift Signal
TP5 I Sense
TP6 Timer (100 ms pulse from spin knob movement)
TP7 Flyback
TP8 -HV
TP9 +HV
TP10 +20 V Unregulated
TP11 +MV
TP12 A Ground
Table 4-6. A8 Interface Assembly Test Points
Series 8500A Peak Power Meters
4-26 Manual No. 20790, Rev C, November 1998
Superceded by Revision D, March 2009
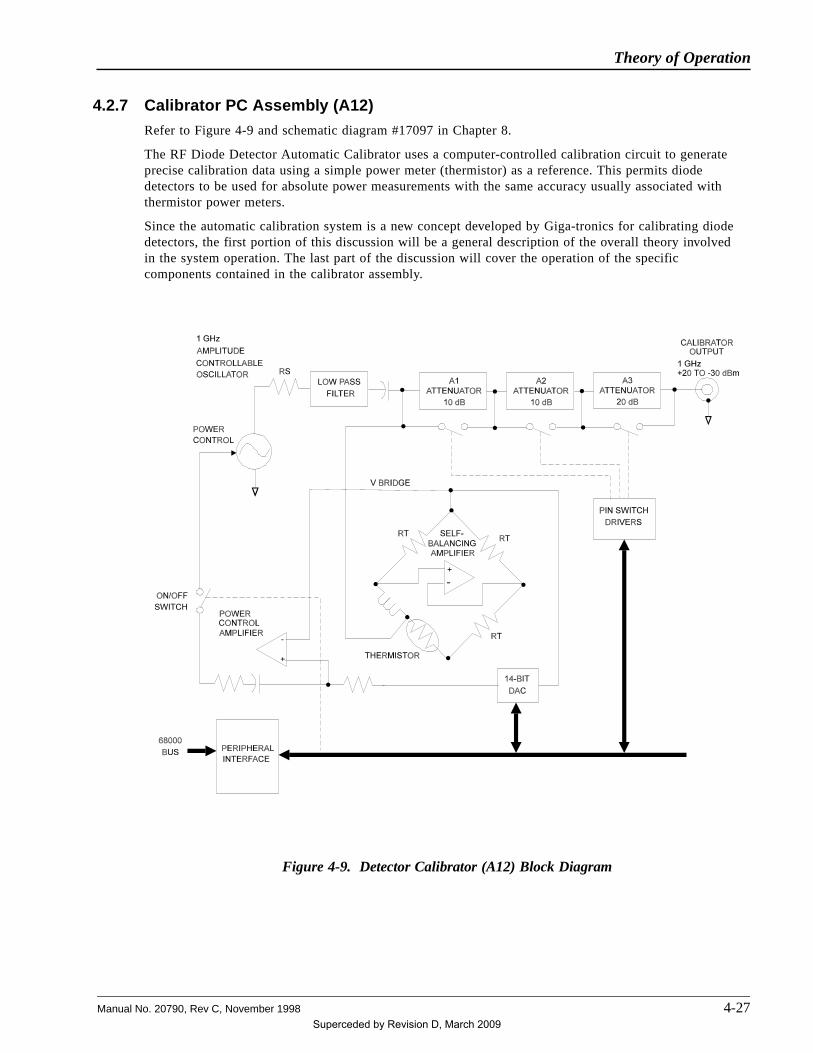
4.2.7 Calibrator PC Assembly (A12)
Refer to Figure 4-9 and schematic diagram #17097 in Chapter 8.
The RF Diode Detector Automatic Calibrator uses a computer-controlled calibration circuit to generateprecise calibration data using a simple power meter (thermistor) as a reference. This permits diodedetectors to be used for absolute power measurements with the same accuracy usually associated withthermistor power meters.
Since the automatic calibration system is a new concept developed by Giga-tronics for calibrating diodedetectors, the first portion of this discussion will be a general description of the overall theory involvedin the system operation. The last part of the discussion will cover the operation of the specificcomponents contained in the calibrator assembly.
Figure 4-9. Detector Calibrator (A12) Block Diagram
Theory of Operation
Manual No. 20790, Rev C, November 1998 4-27Superceded by Revision D, March 2009

The system consists of an amplitude-controllable oscillator operating at a fixed frequency of 1 GHz. Aportion of the RF output is coupled into a thermistor leveling circuit which is physically mounted insidethe metal housing of the calibrator assembly. Referring to Figure 4-9, the thermistor is maintained at afixed resistance by applying a dc bias current through it. This is achieved by using a self-balancingWheatstone bridge with the thermistor inserted in one leg of the bridge. The amount of power required tomaintain the thermistor at the fixed resistance, RT, is constant so that the RF power plus the dc powerdissipated at the thermistor equals a constant. This constant can be determined by switching the RFpower off and measuring the bridge voltage.
The oscillator output power can then be set by measuring this ambient bridge voltage and calculating thedc voltage which would balance the bridge when the oscillator has the required power output. When thisrequired bridge voltage is written to the DAC on the GPIB/Cal Control PC board, the feedback causes theoscillator to settle to the selected RF power.
The above technique allows the calibrator output power to be precisely controlled over a dynamic rangeof approximately 15 dB. The dynamic range is increased by passing the oscillator power through a set ofswitched attenuators. The attenuators are designed to allow attenuation values of 0, 10, 20, 30, and40 dB. The overall gain is adjusted so that the 20 dB stage will provide a precise 0 dBm reference with aspecific power level out of the oscillator.
Integrated control of the calibrator and detector permits errors in the other attenuator stages to becompletely removed in the following manner.
With a particular attenuator switched in, the processor sets the oscillator output power to precisely 9 mWand measures the detector voltage. The next level of attenuation is switched in, and a successiveapproximation algorithm finds the oscillator power (about 90 mW) which will give precisely the samedetector voltage. By dividing the two powers, the relative attenuation of the two ranges is obtained. Sincethe 20 dB range is adjusted to give a 0 dBm absolute reference, the absolute effective attenuation of eachrange can be calculated.
The automatic calibration system generates a table of detector voltages that are equivalent to a knownlevel of input power. This is done by applying many different input powers to the detector, measuring theamplified detector output, and storing the result. The calibration procedure is completely automatic, andthe entire process including the range switching, attenuator measurements, and detector calibration takesless than one minute.
Since there is 15 dB of dynamic range in the thermistor leveled oscillator and 40 dB of attenuationavailable for insertion, the calibrator operates over a total 55 dBm dynamic range. Below -33 dBm, thediode detector itself is linear (square law), so the total dynamic range of the system will be 60 dB (-40 to+20 dBm).
The frequency response of each individual RF detector is measured over its entire specified range at thefactory, and the information is stored in a ROM that is an integral part of the detector. Then, during themeasurement of an unknown signal, the frequency response information contained in the detector’s ROMand the amplitude table generated by the calibration system are combined so that if a voltage equal to,say, -10 dBm is generated by the calibrator, the instrument looks at that voltage, compares it to its table,and by interpolating between data points knows that specific voltage level equals -10 dBm. In this way,offset and gain errors in the detector amplifiers are removed and the system has the capability ofmeasuring power over the full dynamic range of the detector with just as much accuracy as the powerthat is produced from the calibrator.
Refer now to DWG# 17097. Q1, together with the Base and Emitter Resonators, is the 1 GHzcontrollable oscillator. A portion of the signal from Q1 is coupled to a thermistor leveling circuit throughthe Low Pass Filter to remove harmonics, and through the quarter wave choke to allow connection to oneend of the thermistor, RT1. The other end of the thermistor is connected to RF ground through an RFbypass line labeled FL5. RT1 samples the RF signal at the output of the low pass filter, and that sampleis sent to the control circuitry on the GPIB/Cal Control PC board. The control circuit has a feedbacksystem involving some amplifiers and associated circuitry as described in the GPIB/Cal Control board
Series 8500A Peak Power Meters
4-28 Manual No. 20790, Rev C, November 1998
Superceded by Revision D, March 2009

discussion. The output from this feedback system controls the Q1 oscillator so that the total power inRT1 is maintained at a constant level.
Following the thermistor leveling circuit is a series of pin diode attenuators comprising three stages ofattenuation (10 dB, 10 dB, and 20 dB) for a total capability of 40 dB. These stages are switched in andout by control signals from the GPIB/Cal Control board. In the first 10 dB stage, if the current throughthe attenuator is flowing in the direction required to turn on the series diode, CR2, then the attenuator isbypassed and minimum attenuation occurs. If the control current is in the other direction, CR2 is turnedoff and CR1 and CR4 will conduct so that 10 dB of signal will be lost. The other stages are similarlyswitched in and out to allow attenuation from 0 to 40 dB in 10 dB stages. The output then goes to theCAL connector.
R3 supplies current from the -10 to -13 V control voltage source to the emitter of Q1, and R1 and R2 arebias resistors to provide a -10 V bias to the base of Q1.
Theory of Operation
Manual No. 20790, Rev C, November 1998 4-29Superceded by Revision D, March 2009

Series 8500A Peak Power Meters
4-30 Manual No. 20790, Rev C, November 1998
Superceded by Revision D, March 2009
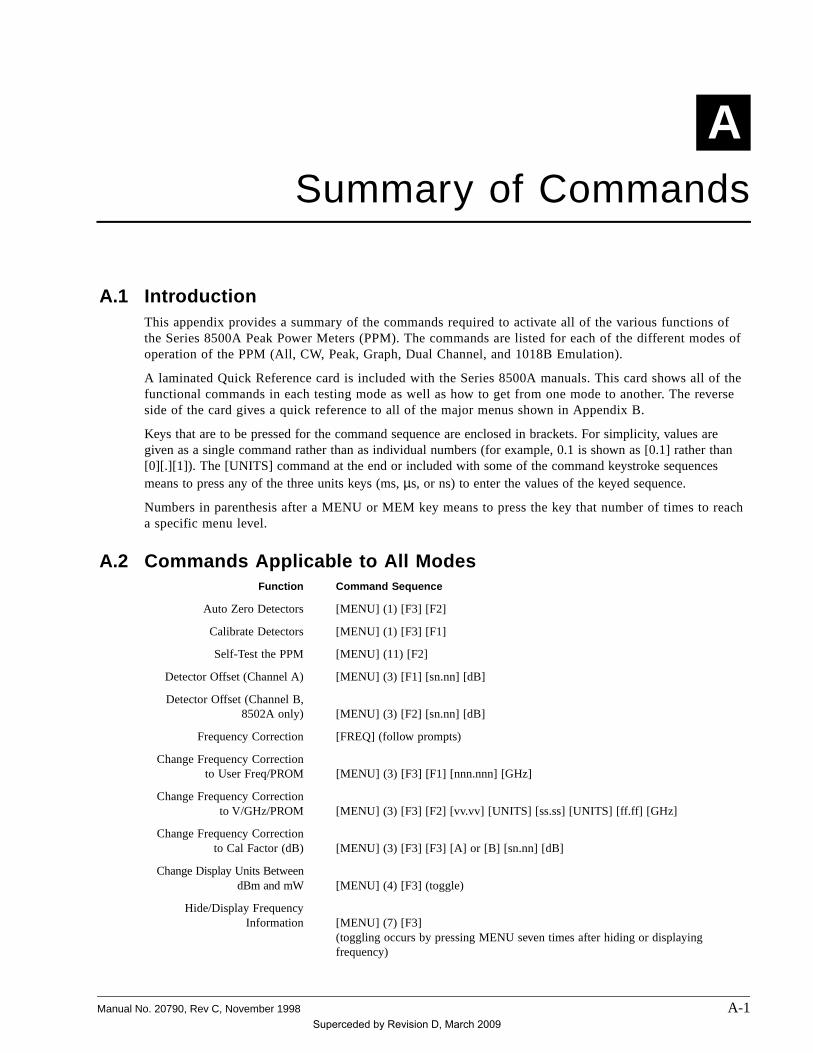
A Summary of Commands
A.1 IntroductionThis appendix provides a summary of the commands required to activate all of the various functions ofthe Series 8500A Peak Power Meters (PPM). The commands are listed for each of the different modes ofoperation of the PPM (All, CW, Peak, Graph, Dual Channel, and 1018B Emulation).
A laminated Quick Reference card is included with the Series 8500A manuals. This card shows all of thefunctional commands in each testing mode as well as how to get from one mode to another. The reverseside of the card gives a quick reference to all of the major menus shown in Appendix B.
Keys that are to be pressed for the command sequence are enclosed in brackets. For simplicity, values aregiven as a single command rather than as individual numbers (for example, 0.1 is shown as [0.1] rather than[0][.][1]). The [UNITS] command at the end or included with some of the command keystroke sequencesmeans to press any of the three units keys (ms, µs, or ns) to enter the values of the keyed sequence.
Numbers in parenthesis after a MENU or MEM key means to press the key that number of times to reacha specific menu level.
A.2 Commands Applicable to All ModesFunction Command Sequence
Auto Zero Detectors [MENU] (1) [F3] [F2]
Calibrate Detectors [MENU] (1) [F3] [F1]
Self-Test the PPM [MENU] (11) [F2]
Detector Offset (Channel A) [MENU] (3) [F1] [sn.nn] [dB]
Detector Offset (Channel B,8502A only) [MENU] (3) [F2] [sn.nn] [dB]
Frequency Correction [FREQ] (follow prompts)
Change Frequency Correctionto User Freq/PROM [MENU] (3) [F3] [F1] [nnn.nnn] [GHz]
Change Frequency Correctionto V/GHz/PROM [MENU] (3) [F3] [F2] [vv.vv] [UNITS] [ss.ss] [UNITS] [ff.ff] [GHz]
Change Frequency Correctionto Cal Factor (dB) [MENU] (3) [F3] [F3] [A] or [B] [sn.nn] [dB]
Change Display Units BetweendBm and mW [MENU] (4) [F3] (toggle)
Hide/Display FrequencyInformation [MENU] (7) [F3]
(toggling occurs by pressing MENU seven times after hiding or displayingfrequency)
Manual No. 20790, Rev C, November 1998 A-1Superceded by Revision D, March 2009

Function Command Sequence
Review Detector PROMInformation [MENU] (10) [F2] (for A) or [F3] (for B)
Check Date and Time then Exit [MENU] (5) [F3] [F3]
Change Date and Time then Exit [MENU] (5) [F3] [F1] [mmddyy] [UNITS] [hhmmss] [UNITS] [F3]
Set Max and Min Power Limits [MENU] (7) [F1] [nn.nn] [UNITS] [nn.nn] [dBm]
Frequency or Cal Factor orV/GHz [FREQ] (follow prompts)
Recall Setup in Memory (n) [MEM] (1) [F1] [n] [UNITS]
Store Setup in Memory [MEM] (1) [F2] [n] [UNITS]
Recall Power-On Setup [MEM] (1) [F3]
Display Current Setup [MEM] (2) [F1] [F1] or [F3] (F1 = more, F3 = exit)
Display Power-On Setup [MEM] (2) [F2] [F1] or [F3] (F1 = more, F3 = exit)
Display Setup in Memory [MEM] (2) [F3] [nn] [UNITS] [F1] (more) or [F3] (exit)
Reinitialize Current Setup [MEM] (3) [F1]
Reinitialize All But Current Setup [MEM] (3) [F2]
Reinitialize a Numbered Setup(nn) [MEM] (3) [F3] [nn] [UNITS]
A.3 CW Mode CommandsFunction Command Sequence
Select CW Mode [CW]
CW Averaging [MENU] (2) [F1] [nnn] [UNITS]
Fast Analog Output [MENU] (10) [F1]
A.4 Peak Mode CommandsFunction Command Sequence
Select Peak Mode [PEAK]
Select 8501A Internal Triggerand Level [MENU] (1) [F1] [nn.nn] [dBm] [mW]
Select 8502A Internal Triggerand Level [MENU] (1) [F1] [A] or [B] [nn.nn] [dBm] [mW]
Select External Trigger [MENU] (1) [F2]
Fast Analog Output [MENU] (10) [F1]
Peak Averaging [MENU] (2) [F2] nnn [UNITS]
Enable Cursor Delay [↑] or [↓]
Disable Cursor Delay [UNITS]
Enter Reference Delay [MENU] (4) [F1] (for ch A) or [F2] (for ch B) [nn.nn] [UNITS]
Clear Reference Delay [MENU] (4) [F1] (for ch a and/or [F2] for ch b of the 8502A) [0] [UNITS]
Series 8500A Peak Power Meters
A-2 Manual No. 20790, Rev C, November 1998
Superceded by Revision D, March 2009

A.5 Graph Mode CommandsFunction Command Sequence
Select Graph Mode (fromsingle channel operation only) [GRAPH]
Autoscale [AUTOSCALE]
Select 8501A Internal Triggerand Level [MENU] (1) [F1] [nn.nn] [dBm] [mW]
Select 8502A Internal Triggerand Level [MENU] (1) [F1] [A] or [B] [nn.nn] [dBm] [mW]
Select External Trigger [MENU] (1) [F2]
Peak Averaging [MENU] (2) [F2] nnn [UNITS]
Enter Reference Delay [MENU] (4) [F1] (for ch A) or [F2] (for ch B) [nn.nn] [UNITS]
Clear Reference Delay [MENU] (4) [F1] (for ch A) or [F2] (for ch B) [0] [UNITS]
GPIB Plot (Paper) [MENU] (2) [F3] [F1]
GPIB Plot (Transparency) [MENU] (2) [F3] [F2]
Code Number Entry for Plot [MENU] (5) [F1] [nnnn] [UNITS] (nnnn = up to 12 digits)
Part Number Entry for Plot [MENU] (5) [F2] [nnnn] [UNITS] (nnnn = up to 12 digits)
Abort (Stop) Plotting Activity [MENU] (6) [F1]
Enter Plotter GPIB Address [MENU] (6) [F2] [nn] [UNITS]
Set Initial Delay forAutoscaling (normal PPM
operation) [MENU] (09) [F2] [nn.nn] [UNITS]
Set Averaging Value forAutoscaling (normal PPM
operation) [MENU] (09) [F3] [nnn] [UNITS]
*Set Initial Delayfor Autoscaling
(1018B emulation operation) [MENU] (11) [F2] [nn.nn] [UNITS]
*Set Averaging Valuefor Autoscaling
(1018B emulation operation) [MENU] (11) [F3] [nnn] [UNITS]
*Valid only after 1018B Emulation has been entered
A.5.1 Change Between Cursor, Marker, and Pulse Sub-ModesPULSE/CURSOR/MARKER Triple toggle
A.5.2 Cursor Sub-Mode Commands Function Command Sequence
Change Start Delay Movecursor to STRT DLY line on
display, enter change using [nn.nn] [UNITS] or spin knob
Change Window Delay Movecursor to DLY WIND line on
display, enter change using [nn.nn] [UNITS] or spin knob
Summary of Commands
Manual No. 20790, Rev C, November 1998 A-3Superceded by Revision D, March 2009

Change Cursor Delay Movecursor to CSR DLY line ondisplay, enter change using [nn.nn] [UNITS] or spin knob
Change Internal Trigger LevelMove cursor to TRG LEV lineon display, enter change using [nn.nn] [UNITS] (or spin knob), or use
[MENU] (1) [F1] [nn.nn] [UNITS]
Change Reference Power(100% Point) Move cursor to
REF PWR line on display,enter change using [nn.nn] [UNITS]
A.5.3 Pulse Sub-Mode CommandsFunction Command Sequence
Change Pulse Width Start andEnd Percentages Move cursor to
PULSE WID line [nn.n] [UNITS] [nn.n] [UNITS]
Change Rise Time Start andEnd percentages Move cursorto RISE TIME line on display [nn.n] [UNITS] [nn.n] [UNITS]
Change Fall Time Start andEnd Percentages Move cursor
to FALL TIME line on display [nn.n] [UNITS] [nn.n] [UNITS]
A.5.4 Marker Sub-Mode CommandsFunction Command Sequence
Change Marker 1 PercentageMove cursor to MRKR 2-1 line
on display [snn.n] [UNITS]
Change Marker 2 PercentageMove cursor to MRKR 3-2 line
on display [snn.n] [UNITS]
Change Marker 3 PercentageMove cursor to MRKR 4-3 line
on display [snn.n] [UNITS]
Change Marker 4 PercentageMove cursor to 4th line on
display [snn.n] [UNITS]
NOTE: Entering nn.n (positive) places the marker on the rising edge. Entering -nn.n (negative) places the marker on the falling edge.
Series 8500A Peak Power Meters
A-4 Manual No. 20790, Rev C, November 1998
Superceded by Revision D, March 2009
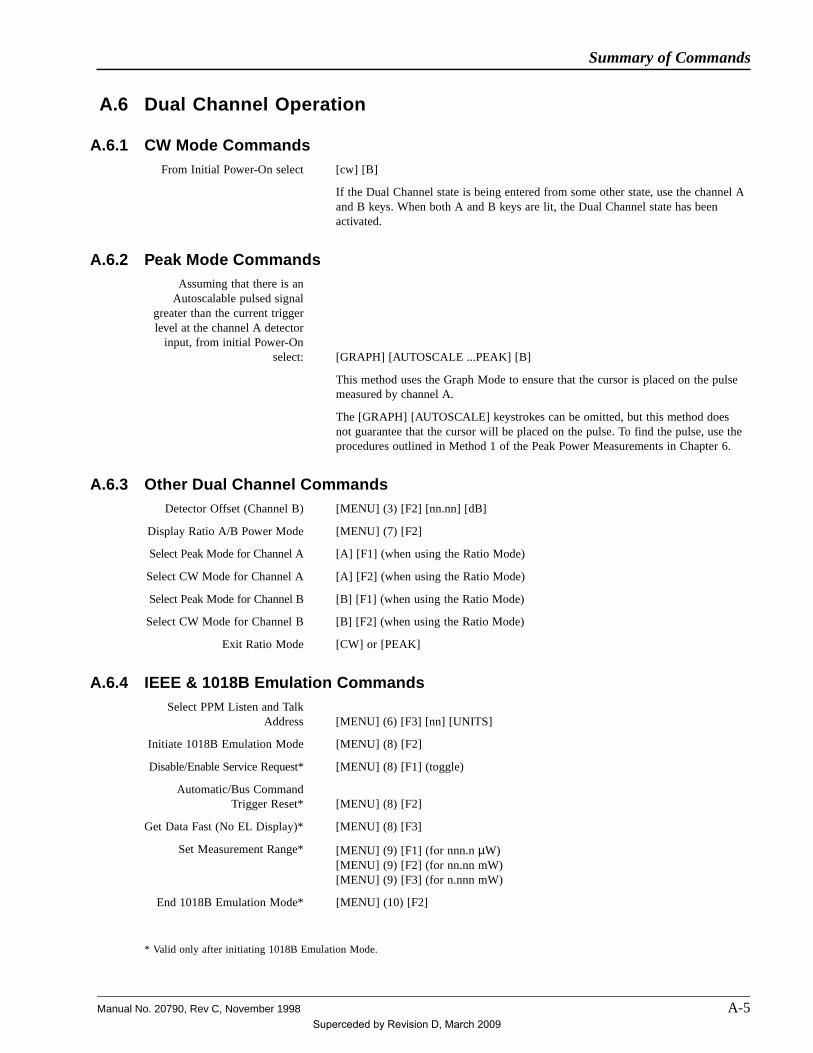
A.6 Dual Channel Operation
A.6.1 CW Mode CommandsFrom Initial Power-On select [cw] [B]
If the Dual Channel state is being entered from some other state, use the channel Aand B keys. When both A and B keys are lit, the Dual Channel state has beenactivated.
A.6.2 Peak Mode CommandsAssuming that there is an
Autoscalable pulsed signalgreater than the current triggerlevel at the channel A detector
input, from initial Power-Onselect: [GRAPH] [AUTOSCALE ...PEAK] [B]
This method uses the Graph Mode to ensure that the cursor is placed on the pulsemeasured by channel A.
The [GRAPH] [AUTOSCALE] keystrokes can be omitted, but this method doesnot guarantee that the cursor will be placed on the pulse. To find the pulse, use theprocedures outlined in Method 1 of the Peak Power Measurements in Chapter 6.
A.6.3 Other Dual Channel CommandsDetector Offset (Channel B) [MENU] (3) [F2] [nn.nn] [dB]
Display Ratio A/B Power Mode [MENU] (7) [F2]
Select Peak Mode for Channel A [A] [F1] (when using the Ratio Mode)
Select CW Mode for Channel A [A] [F2] (when using the Ratio Mode)
Select Peak Mode for Channel B [B] [F1] (when using the Ratio Mode)
Select CW Mode for Channel B [B] [F2] (when using the Ratio Mode)
Exit Ratio Mode [CW] or [PEAK]
A.6.4 IEEE & 1018B Emulation CommandsSelect PPM Listen and Talk
Address [MENU] (6) [F3] [nn] [UNITS]
Initiate 1018B Emulation Mode [MENU] (8) [F2]
Disable/Enable Service Request* [MENU] (8) [F1] (toggle)
Automatic/Bus CommandTrigger Reset* [MENU] (8) [F2]
Get Data Fast (No EL Display)* [MENU] (8) [F3]
Set Measurement Range* [MENU] (9) [F1] (for nnn.n µW)[MENU] (9) [F2] (for nn.nn mW)[MENU] (9) [F3] (for n.nnn mW)
End 1018B Emulation Mode* [MENU] (10) [F2]
* Valid only after initiating 1018B Emulation Mode.
Summary of Commands
Manual No. 20790, Rev C, November 1998 A-5Superceded by Revision D, March 2009

Series 8500A Peak Power Meters
A-6 Manual No. 20790, Rev C, November 1998
Superceded by Revision D, March 2009

B Menu and Memory Keys
B.1 IntroductionThis appendix is a quick reference to the menus that can be accessed through the MENU and MEMorykeys. The number in parenthesis after the key is the number of times the key must be pressed to reach thedesignated menu. MENU (1) means to press the key one time; MENU (2) means to press the key twotimes, etc.
The key display information in this appendix is duplicated on the laminated Quick Reference cardshipped with the manual. The opposite side of the card contains a Summary of Commands described inAppendix A.
Two levels of menu displays are available. The first level includes menus for normal 8500A functions.The second level are the menus used during 1018B emulation. MENU (8) in the normal mode enables ortoggles the 1018B Emulation mode.
B.2 MENU Key Displays
B.2.1 Normal 8500A Functions
Keystrokes Menu Displayed
MENU (1) Menu = NEXT MENU
F1 set Int Trig and LevelF2 set Extrn TriggerF3 to Cal or Zero Detectors
MENU (2) Menu = NEXT MENU; Minus = PREV MENU
F1 to Enter CW Averaging NumberF2 to Enter Peak Averaging NumberF3 for GPIB Plot
MENU (3) Menu = NEXT MENU; Minus = PREV MENU
F1 to Enter Detector A OffsetF2 to Enter Detector B OffsetF3 to Enter Source of Frequency Correction
NOTE: F2 does not apply to the Model 8501A
Manual No. 20790, Rev C, November 1998 B-1Superceded by Revision D, March 2009

MENU (4) Menu = NEXT MENU; Minus = PREV MENU
F1 to Enter Detector A Ref DelayF2 to Enter Detector B Ref DelayF3 to Select mW Format
NOTE: F2 does not apply to the Model 8501A
MENU (5) Menu = NEXT MENU; Minus = PREV MENU
F1 to Enter Code NumberF2 to Enter Part NumberF3 for Read and Set Time
MENU (6) Menu = NEXTR MENU; Minus = PREV MENU
F1 to Abort Current Plotting ActivityF2 to Enter Plotter AddressF3 to Enter 8500A Listen and Talk Address
MENU (7) Menu = NEXT MENU; Minus = PREV MENU
F1 to Set Max and Min Power LimitsF2 to Select Ratio Display ModeF3: Hide (or Display) Frequency Information
NOTE: F2 does not apply to the Model 8501A
MENU (8) Menu = NEXT MENU; Minus = PREV MENU
F2: Emulate 1018B
MENU (9) Menu = NEXT MENU; Minus = PREV MENU
F1 to Program Detector PROMF2 to Set Initial Dly Value for AutoscalingF3 to Set Averaging Value for Autoscaling
NOTE: The MENU (9) F1 function is designed to be used only in conjunction withthe Giga-tronics PROM Programming Accessory Kit
If F1 is pressed without any requirement for using the PROM programming device,a long series of sub-menus must be stepped through to escape from the routine. Tocircumvent this, press the RESET button on the rear of the instrument to escapeback to the last measurement mode.
MENU (10) Press CLEAR to return to data display
F1 for Fast Analog OutputF2: Review A Detector PROMF3: Review B Detector PROM (8502A only)
Series 8500A Peak Power Meters
B-2 Manual No. 20790, Rev C, November 1998
Superceded by Revision D, March 2009
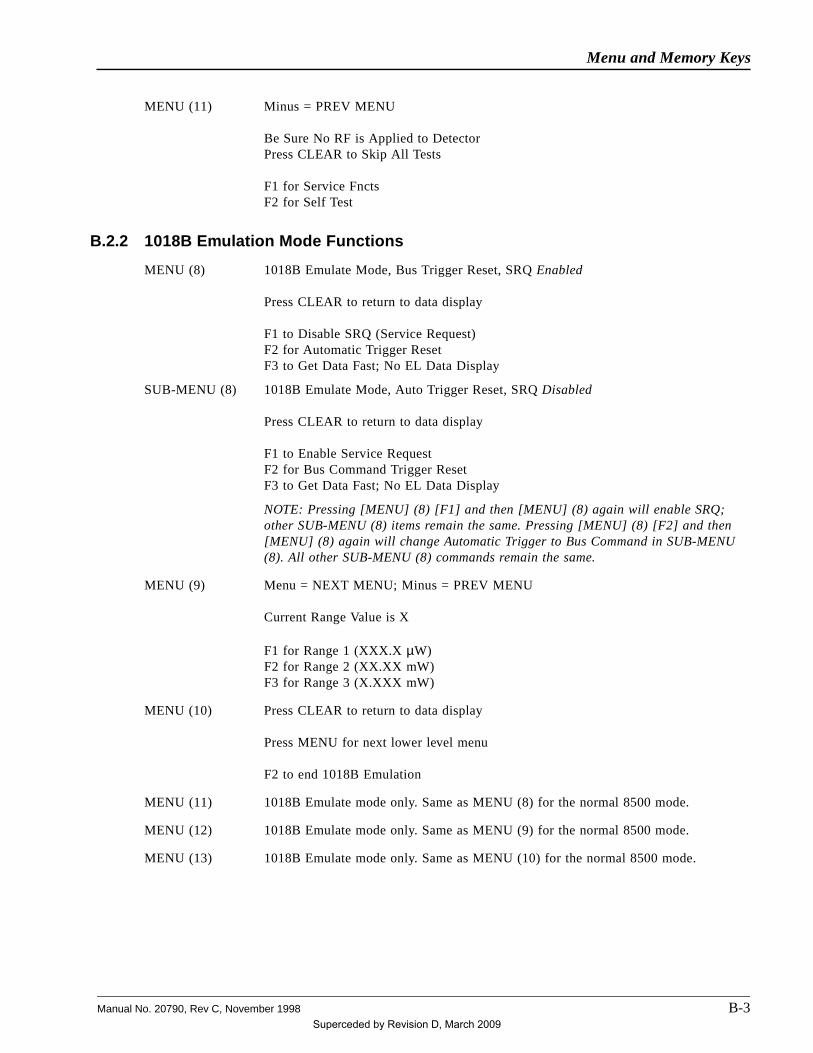
MENU (11) Minus = PREV MENU
Be Sure No RF is Applied to DetectorPress CLEAR to Skip All Tests
F1 for Service FnctsF2 for Self Test
B.2.2 1018B Emulation Mode Functions
MENU (8) 1018B Emulate Mode, Bus Trigger Reset, SRQ Enabled
Press CLEAR to return to data display
F1 to Disable SRQ (Service Request)F2 for Automatic Trigger ResetF3 to Get Data Fast; No EL Data Display
SUB-MENU (8) 1018B Emulate Mode, Auto Trigger Reset, SRQ Disabled
Press CLEAR to return to data display
F1 to Enable Service RequestF2 for Bus Command Trigger ResetF3 to Get Data Fast; No EL Data Display
NOTE: Pressing [MENU] (8) [F1] and then [MENU] (8) again will enable SRQ;other SUB-MENU (8) items remain the same. Pressing [MENU] (8) [F2] and then[MENU] (8) again will change Automatic Trigger to Bus Command in SUB-MENU(8). All other SUB-MENU (8) commands remain the same.
MENU (9) Menu = NEXT MENU; Minus = PREV MENU
Current Range Value is X
F1 for Range 1 (XXX.X µW)F2 for Range 2 (XX.XX mW)F3 for Range 3 (X.XXX mW)
MENU (10) Press CLEAR to return to data display
Press MENU for next lower level menu
F2 to end 1018B Emulation
MENU (11) 1018B Emulate mode only. Same as MENU (8) for the normal 8500 mode.
MENU (12) 1018B Emulate mode only. Same as MENU (9) for the normal 8500 mode.
MENU (13) 1018B Emulate mode only. Same as MENU (10) for the normal 8500 mode.
Menu and Memory Keys
Manual No. 20790, Rev C, November 1998 B-3Superceded by Revision D, March 2009

B.3 MEMory Key DisplaysThe following menus are activated by repeatedly pressing the MEM key. MEM (1) indicates to press thekey once. MEM (3) indicates to press the MEM key three times.
MEM (1) Press [MEM] for additional selections
F1 to Recall SetupsF2 to Store SetupsF3 to get Power-On Setup
MEM (2) Press [CLEAR] to return to data display
F1 to Display Current SetupF2 to Display Power-On SetupF3 to Display a Numbered Setup
MEM (3) Press [CLEAR] to return to data display
F1 to Initialize the Current SetupF2 to Initialize All but Current SetupF3 to Initialize a Numbered Setup
Series 8500A Peak Power Meters
B-4 Manual No. 20790, Rev C, November 1998
Superceded by Revision D, March 2009

C Display Formats
C.1 GeneralThis appendix illustrates the major display formats that will be presented in each operating mode. Thefront panel function keys are illustrated that will produce the corresponding display. Darkened keys in thefollowing illustrations will be turned on to produce the corresponding display at the left.
C.2 Data Displays
MODE DATA DISPLAY MODEL 8501A MODEL 8502A
CHANNEL A
CW MODE
CHANNEL A
PEAK MODE
CHANNEL A
GRAPH MODE
Model 8502A channel B displays are same as above, except with the B key turned on and B: shown on the display.
DUAL CHANNEL
CW MODENA
Manual No. 20790, Rev C, November 1998 C-1Superceded by Revision D, March 2009

MODE DATA DISPLAY MODEL 8501A MODEL 8502A
DUAL CHANNEL
PEAK MODE
NA
DUAL CHANNEL
RATIO MODE
(A = PK Signal)(B = PK Signal)
NA
For ratio’ing various types of signals to each other, the indication in the lower right corner would be:A = Peak; B = CW = PK/CW: Both A & B = CW = CW/CW: A = CW; B = Peak = CW/PK
ANY MODEError Indicated
Display Blank or FrozenNo Trigger Occurring
Ready = ON
New Data = OFF
Ready = ON
New Data = OFF
SELECT
A OR BCHANNEL
NA
OR
Series 8500A Peak Power Meters
C-2 Manual No. 20790, Rev C, November 1998
Superceded by Revision D, March 2009

D RF Detectors
D.1 IntroductionThe detectors used with the Series 8500A Peak Power Meters (PPM) are dual diode. They contain apreamplifier/line driver, a correction PROM with an address counter, and a thermistor to measure thetemperature of the detector mounting. Since diode detection is used, there is an inherent non-linearity thatmust be compensated before the detector can be used for power measurements. Compensation is doneautomatically by a special calibration routine performed by the PPM that steps the power output of aninternal RF source from -30 dBm to +20 dBm, and then records the resultant output voltage of thedetector at each step. A conversion table is automatically calculated and stored in non-volatile RAM sothat the detectors will remain calibrated when the PPM is turned off and back on again. This processtakes less than a minute and can be performed at any time.
The detectors are either high or low speed. The high speed has a rise time of 15 ns and a minimumfrequency of 750 MHz for accurate measurements. The low speed detector has a rise time of 750 ns and aminimum frequency of 30 MHz. The difference between the two is totally in the diode element. The lowspeed element contains an additional filter capacitor that slows the pulse response time and allows lowerRF frequency operation.
The diode element is field replaceable. After replacement, the correction PROM must be replaced withone that has been programmed with the diode’s new video resistance and frequency characteristics.
Manual No. 20790, Rev C, November 1998 D-1Superceded by Revision D, March 2009

D.2 Detector Specifications
Det.Model
FrequencyRange
PowerRange
Max. Power(Peak or Avg)
MaximumVSWR
RFConn
HIGH SPEED — 15 ns
16936 750 MHz to18.5 GHz
-20 dBm to +20 dBm (Pulse)-40 dBm to +20 dBm (CW)
+23 dBm (200 mW)(Damage Limit)
1.12: 750 MHz to 2 GHz1.22: 2 to 12.4 GHz1.37: 12.4 to 18 GHz
Type N(m)
16937 750 MHz to18.5 GHz
-20 dBm to +20 dBm (Pulse)-40 dBm to +20 dBm (CW)
+23 dBm (200 mW)(Damage Limit)
1.12: 750 MHz to 2 GHz1.22: 2 to 12.4 GHz1.37: 12.4 to 18 GHz
APC-7(mm)
17266 750 MHz to26.5 GHz
-20 dBm to +20 dBm (Pulse)-40 dBm to +20 dBm (CW)
+23 dBm (200 mW)(Damage Limit)
1.12: 750 MHz to 2 GHz1.22: 2 to 12.4 GHz1.37: 12.4 to 18 GHz1.50: 18 to 26.5 GHz
Type K(m)
17071 750 MHz to40.0 GHz
-20 dBm to +20 dBm (Pulse)-40 dBm to +20 dBm (CW)
+23 dBm (200 mW)(Damage Limit)
1.12: 750 MHz to 2 GHz1.22: 2 to 12.4 GHz1.37: 12.4 to 18 GHz1.50: 18 to 26.5 GHz1.92: 26.5 to 40 GHz
Type K(m)
LOW SPEED — 750 ns
16934 30 MHz to18.5 GHz
-20 dBm to +20 dBm (Pulse)-40 dBm to +20 dBm (CW)
+23 dBm (200 mW)(Damage Limit)
1.12: 30 MHz to 2 GHz1.22: 2 to 12.4 GHz1.37: 12.4 to 18 GHz
Type N(m)
16935 30 MHz to18.5 GHz
-20 dBm to +20 dBm (Pulse)-40 dBm to +20 dBm (CW)
+23 dBm (200 mW)(Damage Limit)
1.12: 30 MHz to 2 GHz1.22: 2 to 12.4 GHz1.37: 12.4 to 18 GHz
APC-7(mm)
17267 30 MHz to26.5 GHz
-20 dBm to +20 dBm (Pulse)-40 dBm to +20 dBm (CW)
+23 dBm (200 mW)(Damage Limit)
1.12: 30 MHz to 2 GHz1.22: 2 to 12.4 GHz1.37: 12.4 to 18 GHz1.50: 18 to 26.5 GHz
Type K(m)
1. The dimensions and weight are identical for all detectors:Length = 133 mm (5.25 in)Diameter = 37 mm (1.44 in)Weight = 0.3 kg (0.7 lbs)
Frequency Range:
High Speed: 750 MHz to 18.5 GHz750 MHz to 26.5 GHz750 MHz to 40 GHz(High speed detectors can be used down to 500 MHz.)
Low Speed: 30 MHz to 18.5 GHz30 MHz to 26.5 GHz
Rise Time:
High Speed: <15 ns (Typical = 12 ns)
Step Response: Ringing <5% p-p settling to <2% p-p in 200 ns
Low Speed: <750 ns (Typical = 250 ns)
Power Range:
Measurement: -20 to +20 dBm (Pulse)-40 to +20 dBm (CW)
Series 8500A Peak Power Meters
D-2 Manual No. 20790, Rev C, November 1998
Superceded by Revision D, March 2009

Absolute Maximum(Peak or Avg): +23 dBm (200 mW)
(Damage Limit)
Return Loss (SWR):Type N, APC-7 Type K
Below 2 GHz 25 dB (1.12) 25 dB (1.12)
2 to 12.4 GHz 20 dB (1.22) 20 dB (1.22)
12.4 to 18 GHz 16 dB (1.37) 16 dB (1.37)
18 to 26.5 GHz 14 dB (1.50)
26.5 to 40 GHz 10 dB (1.92)
Calibration Factor Uncertainty:Frequency Sum of Uncertainties (%)
1Probable Uncertainties (%)
2
Below 10 GHz 2.6% 1.2%
10 to 18 GHz 6.4% 3.7%
18 to 26.5 GHz 10% 6.5%
26.5 to 40 GHz 20% 10%
NOTES:
1. Includes uncertainty of reference standard and transfer uncertainty. Directly traceable to NIST (formerly NBS).
2. Square root of the sum of the individual uncertainties squared (RSS).
RF Detectors
Manual No. 20790, Rev C, November 1998 D-3Superceded by Revision D, March 2009
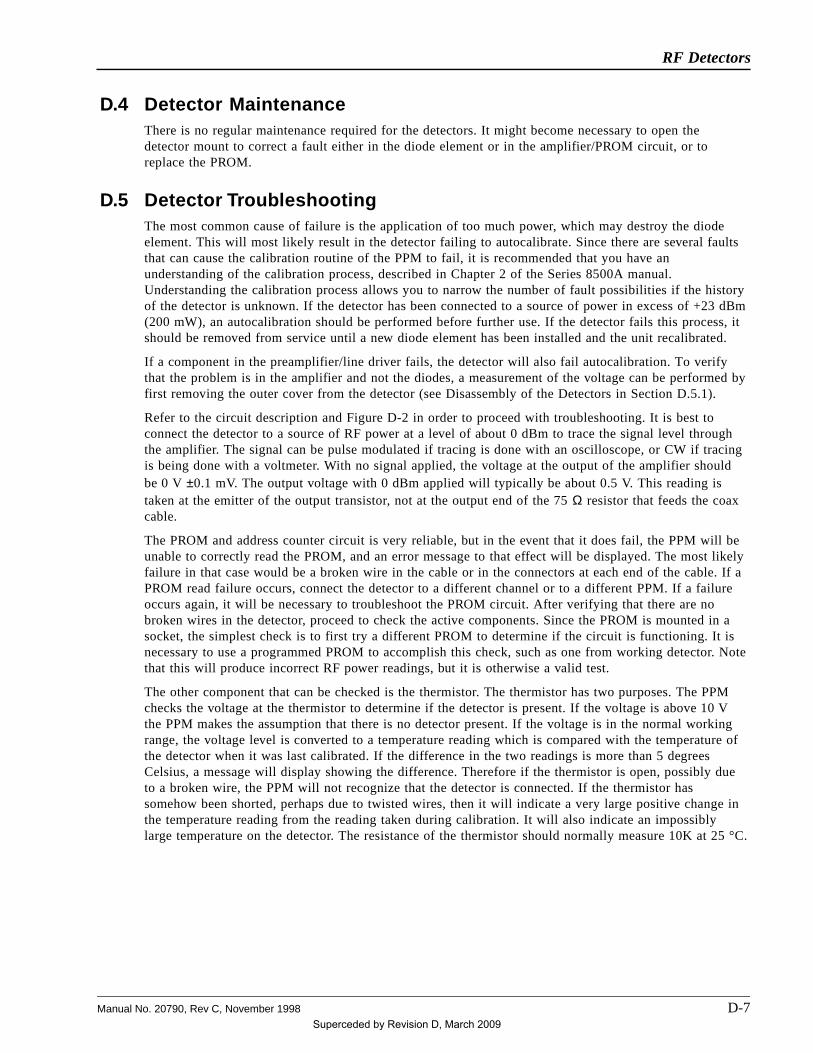
D.4 Detector MaintenanceThere is no regular maintenance required for the detectors. It might become necessary to open thedetector mount to correct a fault either in the diode element or in the amplifier/PROM circuit, or toreplace the PROM.
D.5 Detector TroubleshootingThe most common cause of failure is the application of too much power, which may destroy the diodeelement. This will most likely result in the detector failing to autocalibrate. Since there are several faultsthat can cause the calibration routine of the PPM to fail, it is recommended that you have anunderstanding of the calibration process, described in Chapter 2 of the Series 8500A manual.Understanding the calibration process allows you to narrow the number of fault possibilities if the historyof the detector is unknown. If the detector has been connected to a source of power in excess of +23 dBm(200 mW), an autocalibration should be performed before further use. If the detector fails this process, itshould be removed from service until a new diode element has been installed and the unit recalibrated.
If a component in the preamplifier/line driver fails, the detector will also fail autocalibration. To verifythat the problem is in the amplifier and not the diodes, a measurement of the voltage can be performed byfirst removing the outer cover from the detector (see Disassembly of the Detectors in Section D.5.1).
Refer to the circuit description and Figure D-2 in order to proceed with troubleshooting. It is best toconnect the detector to a source of RF power at a level of about 0 dBm to trace the signal level throughthe amplifier. The signal can be pulse modulated if tracing is done with an oscilloscope, or CW if tracingis being done with a voltmeter. With no signal applied, the voltage at the output of the amplifier shouldbe 0 V ±0.1 mV. The output voltage with 0 dBm applied will typically be about 0.5 V. This reading istaken at the emitter of the output transistor, not at the output end of the 75 Ω resistor that feeds the coaxcable.
The PROM and address counter circuit is very reliable, but in the event that it does fail, the PPM will beunable to correctly read the PROM, and an error message to that effect will be displayed. The most likelyfailure in that case would be a broken wire in the cable or in the connectors at each end of the cable. If aPROM read failure occurs, connect the detector to a different channel or to a different PPM. If a failureoccurs again, it will be necessary to troubleshoot the PROM circuit. After verifying that there are nobroken wires in the detector, proceed to check the active components. Since the PROM is mounted in asocket, the simplest check is to first try a different PROM to determine if the circuit is functioning. It isnecessary to use a programmed PROM to accomplish this check, such as one from working detector. Notethat this will produce incorrect RF power readings, but it is otherwise a valid test.
The other component that can be checked is the thermistor. The thermistor has two purposes. The PPMchecks the voltage at the thermistor to determine if the detector is present. If the voltage is above 10 Vthe PPM makes the assumption that there is no detector present. If the voltage is in the normal workingrange, the voltage level is converted to a temperature reading which is compared with the temperature ofthe detector when it was last calibrated. If the difference in the two readings is more than 5 degreesCelsius, a message will display showing the difference. Therefore if the thermistor is open, possibly dueto a broken wire, the PPM will not recognize that the detector is connected. If the thermistor hassomehow been shorted, perhaps due to twisted wires, then it will indicate a very large positive change inthe temperature reading from the reading taken during calibration. It will also indicate an impossiblylarge temperature on the detector. The resistance of the thermistor should normally measure 10K at 25 °C.
RF Detectors
Manual No. 20790, Rev C, November 1998 D-7Superceded by Revision D, March 2009

D.5.1 Disassembly of Detectors
Follow these instructions to disassemble a detector (see Figure D-4).
CAUTION
The detectors contain CMOS components and are subject to static electricitydamage. Use correct safety procedures, protective devices and clothing to preventstatic discharge before opening a detector enclosure.
1. Remove screws (1) and (2). Take off the sleeve holder plate and slide the sleeve off the capassembly.
2. Position the detector so that the Pre-Amp assembly (the board with components) is visible.Locate the detector element leads. They are on the end of the PC board nearest to the detectorhousing assembly. Remove the solder from the leads of the detector element, and remove theleads from the holes in the PC board. Straighten the leads.
3. Unscrew the detector housing assembly from the cap assembly. Use the wrench flats on thehousing assembly which are located closest to the cap assembly to remove the housing assembly.The detector element will remain attached to the housing assembly.
If the Spring Washers fall out when the detector housing assembly is removed, they should bereplaced as shown in Detail A of Figure D-4.
D.5.2 Replacement of Detector Element
These are instructions to replace the detector element (see Figure D-4). A detector element should bereplaced in the field only if a Giga-tronics Programming Accessory Kit (P/N 16976) is on hand toprogram a new PROM with the characteristics of the new element, and if the required equipment formeasuring Cal Factor is available. If either or both of the above items are not available, the entiredetector should be returned to the factory for element replacement.
The Cal Factor is the frequency response of the detector with respect to the 1 GHz response, expressed indB. If the Cal Factor at 10 GHz is -0.2 dB, it means that the detector output voltage at any applied powerlevel is 0.2 dB lower at 10 GHz than at 1 GHz.
1. Remove the old detector element from the detector housing assembly by pulling the elementstraight out from the Assembly.
CAUTION
Do not twist the element as you remove it. Doing so could damage the centerconductor of the detector housing assembly.
2. Take the new detector element out of its protective packaging and carefully straighten the leads.Do not pull sharply on the leads or they may come off.
3. Carefully insert the new detector element into the detector housing assembly. Gently push on thedetector element to press the detector element pin into the center conductor of the detectorhousing assembly. Once the element has been inserted, try gently to pull it back out of thehousing assembly. If there is resistance, the element is inserted correctly. If the element comesout easily, the element has not been correctly inserted into the center conductor. Remove the
Series 8500A Peak Power Meters
D-8 Manual No. 20790, Rev C, November 1998
Superceded by Revision D, March 2009

detector element, make sure that the center conductor is centered in the housing and then reinsertthe element.
CAUTION
Do not twist the element as you insert it. Doing so could damage the detectorelement pin or the center conductor of the detector housing assembly.
4. Remove and discard the old PROM. Use the instructions furnished with the PROM ProgrammingAccessory Kit to program the new PROM.
5. Insert the new PROM into the PROM PC board so that pin #1 is in the position marked on thePC board (see Figure D-4).
D.5.3 Reassembly of Detectors
Follow these instructions to reassemble the detector (see Figure D-4).
CAUTION
Do not twist the detector element while inserting it. This can damage the detectorelement pin or the detector housing assembly center conductor.
1. Make sure that the detector element leads are straight. Screw the detector housing assembly intothe cap assembly. Be very careful not to damage the leads of the element.
2. Insert the element leads into the proper holes in the Pre-Amp board as shown in Detail B ofFigure D-4. The lead from the center pin goes to hole 1, and the other lead goes to hole 2. Solderthe leads in place.
3. After the element has been installed, it may be necessary to readjust the pulse response of theamplifier due to a possible difference in the video resistance of the new element diodes inrelationship to the old element diodes.
To adjust the pulse response, connect the detector to a pulsed microwave source of about 0 dBm. Thepulse must be very clean as this procedure assumes a perfect input pulse. The rise time of the pulse mustbe less than 6 ns, and it should have no overshoot or ringing. If the shape of the pulse is not perfect butis accurately known, this will do.
Set the PPM in the Graph mode with the Internal Trigger at -10 dBm. Autoscale the display by pressing[GRAPH] and set the window to a width of 0.1 µs. If the pulse shape is wrong, adjust C3 on thePre-Amp board in small increments and wait for the trace on the screen to redraw. After finding anoptimum setting for C3, adjust R9 until the best shape is obtained. Do not move either control very farfrom the original setting. The end result for this procedure is to set the maximum rise time consistentwith no overshoot or ringing. If the rise time cannot be set below 15 ns, a small overshoot of less than5% is acceptable.
4. Slide the sleeve onto the cap assembly. Replace the sleeve holder plate. Insert and tighten screws(1) and (2), and return the detector to service.
RF Detectors
Manual No. 20790, Rev C, November 1998 D-9Superceded by Revision D, March 2009

E Options
E.1 IntroductionThe following options are available for Series 8500A, and are discussed under respective headings:
Option 01: Rack Mount Kit, 16657
Option 03: Rear Panel Connections
Parts lists are included with the applicable option in this appendix. Diagrams for options, whenapplicable, are in Chapter 8.
E.2 Option 01: Rack Mount KitOption 01 is a 19-inch standard equipment rack mounting kit for the Series 8500A power meter. Itincludes slides and wall mounting brackets.
16657 OPT 01 RACK MT 5 1/4 (8501/02), Rev: B
Item Part Number Qty Cage Mfr’s Part Number Description
1 12678-002 1 58900 12678-002 SLIDE-RACK SECTIONS (PAIR)2 12678-001 1 58900 12678-001 SLIDE-CHASSIS SECTION (PAIR)3 10351-001 2 58900 10351-001 ROUND NICKEL HANDLE4 20077 1 58900 20077 BRACKET,RACK MOUNT, 5.25 (L)5 20078 1 58900 20078 BRACKET,RACK MOUNT, 5.25" (R)6 10352 4 58900 10352 HANDLE FERRULE7 13854 6 58900 13854 SPACER, .172IDX.500ODX.31LG8 20074 1 58900 20074 MOUNTING BLOCK, LEFT9 20075 1 58900 20075 MOUNTING BLOCK, RIGHT10 10415 1 58900 10415 LABEL, OPTION IDENTIFICATION101 10111-005 6 58900 10111-005 8-32 X 5/8 PAN102 13603-001 2 58900 13603-001 8-32 X 1/2 FLAT 100 DEG103 HWSS-80400 6 58900 HWSS-80400 #8 X 1/4 SPLIT LOCK104 HBFP-A3206 4 58900 HBFP-A3206 10-32 X 3/8 FLAT105 HBPP-83206 4 26233 NS137CR832R6 8-32 X 3/8 PAN
Manual No. 20790, Rev C, November 1998 E-1Superceded by Revision D, March 2009

E.3 Option 03: Rear Panel ConnectionsWhen Option 03 is installed, the Calibrator and Detector connectors are relocated from the front panel tothe rear panel.
20794 MODEL 8501A OPTION 03 REV A:
Item Part Number Qty Cage Mfr’s Part Number Description
1 17051-001 1 58900 17051-001 DET. INPUT CABLE ASSY, OPT. 032 17283 1 58900 17283 BRACKET, CLAMP DET INPUT CABLE3 HTM0-00003 3 06383 ABMM-A-D CABLE TIE ANCHOR4 20508-002 1 58900 20508-002 FRONT PANEL, 8501A-OPT 035 16884 1 58900 16884 LABEL,MISC.
20795 MODEL 8502A OPTION 03, Rev: B
Item Part Number Qty Cage Mfr’s Part Number Description
1 20510-002 1 58900 20510-002 FRONT PANEL, 8502A OPT032 17051-001 2 58900 17051-001 DET. INPUT CABLE ASSY, OPT. 033 17283 1 58900 17283 BRACKET, CLAMP DET INPUT CABLE4 16884 1 58900 16884 LABEL,MISC.5 10414-001 1 2R182 864 3 LUG TERMINAL STRIP101 HTM0-00003 4 06383 ABMM-A-D CABLE TIE ANCHOR102 10384-002 2 95987 F6NY-312NA CABLE CLAMP 5/16"DIA 1/2" WIDE
Series 8500A Peak Power Meters
E-2 Manual No. 20790, Rev C, November 1998
Superceded by Revision D, March 2009
Index
!
1018B commands 3-38, 3-52
1018B Emulation 3-38
1018B Emulation Commands 3-38, 3-52
1018B features not emulated by the PPM 3-40
Analog output 3-39
direct mode 3-39
Front panel menus 3-39
Initiating the 1018B emulation mode 2-47
Mode functions B-3
Output data modes 3-38
Output format 3-38
Over and under range 3-40
Peak Power Meter Emulation 2-47
Reference delay, correction of carrier frequency, and
offset vs Remote state 3-39
Two detectors 3-39
A
A2 Test points 4-3
A3 Test points 4-7
A4 Test Points 4-11
A5 Test points 4-19
A6/A7 Test points 4-23
A8 Front panel interface board 5-12
A8 Test points 4-26
Address decoding and handshake 4-9
Analog output 3-39
Analog output accuracy test 5-7
Analog PC assembly (A6/A7) 4-20
Auto-Zero function 2-15
Automatic functions of the Graph mode 3-24
Automatic timing measurement commands 3-28
Automatic window delay selection
related commands 2-24, 3-26
Autoscaling procedure 2-19
Autoscaling procedure, external trigger 2-20
Autozero detectors commands 3-15
Auxiliary inputs/outputs 1-5
B
Backup battery circuit 4-11
C
CAGE
List of Manufacturers 7-36
Calibration
Self-Calibration Procedure 2-14
Calibration and Testing 5-1
A8 Front panel interface board 5-12
Analog output accuracy test 5-7
Calibrator output level test 5-3
Calibrator return loss test 5-3
Delay accuracy test 5-6
Detector return loss test 5-7
Equipment Required 5-2
Initialization 5-12
Instrument plus power detector linearity test 5-3
Plotter output/IEEE-488 interface 5-7
Power linearity test setup 5-4
Procedures 5-8
Voltage proportional to frequency test 5-7
Volume adjust 5-20
Calibration commands 3-15
Calibration Procedures 5-8
Calibrator output level test 5-3
Calibrator PC assembly (A12) 4-27
Calibrator return loss test 5-3
Calibrator specifications 1-5
Change between cursor, marker,
and pulse sub-modes A-5
Cleaning 1-2
Clock 4-16
Clock gate 4-16
Command string format 3-12
Commands Applicable to All Modes A-1
Commands for retrieving data from the PPM 3-23
Commands to output graphic data to a controller 3-33
Common mode functions 3-15
Autozero detectors commands 3-15
Calibration commands 3-15
Hide and Unhide frequency information
commands 3-15
Output status byte information command 3-16
Power limits 3-16
Manual No. 20790, Rev C, November 1998 Index-1Superceded by Revision D, March 2009

SRQ related commands 3-16
Store or recall setup commands 3-15
Temperature difference since last
calibration commands 3-15
Cooling 1-2
Counter 4-16
CPU interface 4-14
CPU PC assembly (A4) 4-8
A4 Test Points 4-11
Address decoding and handshake 4-9
Backup battery circuit 4-11
Data buffers 4-10
External memory 4-10
Interrupt priority decoder 4-10
Real time clock 4-10
Reset timer 4-10
The microprocessor 4-9
Unbuffered memory 4-10
Cursor control commands 3-31
Cursor delay 2-24
Cursor power 2-24
Cursor sub-mode commands A-5
Cursor sub-mode functions 2-24
Cursor delay 2-24
Cursor power 2-24
Delay window 2-24, 3-26
Reference Power 2-25
Start delay 2-24
Trigger 2-25
CW averaging 2-11
CW mode 2-11
CW averaging 2-11
Frequency 2-11
Low power level measurement 2-11
CW Mode Commands A-3
CW power measurement 2-18
CW, CW measurements 2-32
D
Data buffers 4-10
Data Formats 3-52
Default Settings 1-7
Delay accuracy test 5-6
Delay board reset latch 4-17
Delay window 2-24, 3-26
Description 1-1
Detector PROM correction:
External frequency 3-18
Detector PROM correction: User supplied frequency
3-17
Detector return loss test 5-7
Detector Specifications D-2
Detectors D-1
Disassembly D-8
Electrical Description D-4
Maintenance D-7
Preamplifier PC assembly D-4
PROM PC assembly D-6
Reassembly D-9
Replacement of detector element D-8
Specifications D-2
Troubleshooting D-7
Diagrams 8-1
Digital delay PC assembly (A5) 4-12
A5 Test points 4-19
Clock 4-16
Clock gate 4-16
Counter 4-16
CPU interface 4-14
Delay board reset latch 4-17
Internal trig comparators 4-15
Interrupt latch 4-18
Pulse shaper 4-18
Ramp control logic 4-18
Ramp generator 4-17
Sample comparator 4-17
Trig pulse stretcher 4-16
Trig select 4-15
Trig threshold 4-15
Voltage hold 4-17
Zero to 25.5 ns delay 4-18
Digital Plotting of Graphic Data 2-30
Plotters supported 2-30
Procedure for making plots 2-30
Display Formats C-1
Display setups 2-46
Dual Channel Measurements 2-32
CW, CW measurements 2-32
Peak, CW measurements 2-34
Peak, peak measurements (method 1) 2-32
Peak, peak measurements (method 2) 2-33
Power ratio measurements 2-35
Dual Channel Operation A-6
CW mode commands A-6
Other dual channel commands A-6
Peak mode commands A-6
Series 8500A Peak Power Meters
Index-2 Manual No. 20790, Rev C, November 1998
Superceded by Revision D, March 2009
E
Environmental requirements 1-2
Equipment Required 5-2
Error conditions 3-37
External frequency 2-16
External frequency and output frequency to controller
command 3-19
External memory 4-10
External triggering 2-12
F
Frequency correction, cal factor and dB offset 2-16
Frequency Display Disable/Enable 2-45
Front Panel
Description 2-7
Front panel interface PC assembly (A8) 4-24
Front panel menus 3-3
Fuse
Voltage selector and fuse holder (PCB) 2-3
G
General specifications 1-6
Get power-on setup 2-45
GPIB Command Descriptions 3-14
1018B commands 3-38, 3-52
Commands for retrieving data from the PPM 3-23
Commands to output graphic data to a controller 3-33
Common mode functions 3-15
GPIB Command Summary 3-44
Graph mode GPIB operation 3-24
Marker timing measurements 3-26
Measurement data correction 3-17
Mode selection and control 3-21
Plotting commands 3-34
Programming notes 3-35
GPIB Command Summary 3-44
GPIB/CAL control PC board (A3) 4-4
A3 Test points 4-7
Graph Mode 2-13
Selecting the Graph mode 2-13
Graph Mode Commands A-4
Change between cursor, marker,
and pulse sub-modes A-5
Cursor sub-mode commands A-5
Marker sub-mode commands A-5
Pulse sub-mode commands A-5
Graph mode GPIB operation 3-24
Automatic functions of the Graph mode 3-24
Automatic window delay selection
related commands 2-24, 3-26
Graph sub-mode selection commands 3-24
Reading and defining pulse parameters 3-25
Graph sub-mode selection commands 3-24
H
Hide and Unhide frequency information commands
3-15
High Power Measurement Procedures 2-37
High Power Measurements 2-37
High Power Measurement Procedures 2-37
High power relative measurements 2-39
max/min power 2-37
Single pulse measurement using external trigger 2-41
Single pulse measurement using internal trigger 2-40
Single pulse measurements 2-40
High power relative measurements 2-39
I
Initialization 5-12
Initializing setups 2-46
Initiating the 1018B emulation mode 2-47
Installation 2-1
Instrument plus power detector linearity test 5-3
Internal trig comparators 4-15
Internal triggering 2-12
Interrupt latch 4-18
Interrupt priority decoder 4-10
Introduction 1-1
Items furnished 1-2
Items required 1-2
L
Linear power data format 3-13
List of Manufacturers 7-36
Log (dBm) data format 3-12
M
Maintenance 6-1
Cleaning 1-2
Diagrams 8-1
List of Manufacturers 7-36
Parts Lists 7-1
Periodic 6-1
Power-On failure 6-3
Required test equipment 6-2
Index
Manual No. 20790, Rev C, November 1998 Index-3Superceded by Revision D, March 2009

Troubleshooting 6-3
Manual marker placement/timing measurement
commands 3-29
Marker sub-mode commands A-5
Marker sub-mode functions 2-28
Marker timing measurements 3-26
Automatic timing measurement commands 3-28
Manual marker placement/timing
measurement commands 3-29
Reference power related commands 3-27
Window and cursor control commands 3-31
Measurement data correction 3-17
Detector PROM correction: External frequency 3-18
Detector PROM correction: User
supplied frequency 3-17
External frequency and output frequency to
controller command 3-19
Offsetting measured data: dB offset commands 3-20
User-defined detector calibration
factor commands 3-20
Measurement Procedures 2-16
Autoscaling procedure 2-19
Autoscaling procedure, external trigger 2-20
Cursor sub-mode functions 2-24
CW power measurement 2-18
Digital Plotting of Graphic Data 2-30
Frequency correction, cal factor and dB offset 2-16
Marker sub-mode functions 2-28
Peak power measurement 2-19
Peak power measurements (Graph mode) 2-23
PROM frequency correction 2-16
Pulse parameters sub-mode functions 2-26
Pulse, cursor, and marker readouts 2-23
User-supplied cal factor 2-17
Memory features 2-45
Display setups 2-46
Get power-on setup 2-45
Initializing setups 2-46
Recall setup 2-45
Store setup 2-45
MEMory Key Displays B-4
Menu and Memory Keys B-1
MENU Key Displays B-1
1018B emulation mode functions B-3
Normal 8500A functions B-1
Mode Selection 2-11
CW mode 2-11
Graph Mode 2-13
Peak mode 2-11
Mode selection and control 3-21
Peak power commands 3-21
Related peak power commands 3-22
Select Log or Linear power measurement format
commands 3-21
Select measurement mode commands 3-21
N
Non-Volatile Memory 2-45
Memory features 2-45
Normal 8500A functions B-1
Normal PPM operation 3-43
O
Offset 2-17
Offsetting measured data: dB offset commands 3-20
Operation 2-1, 2-10
1018B emulation mode functions B-3
1018B Peak Power Meter Emulation 2-47
CW mode 2-11
Digital Plotting of Graphic Data 2-30
Display Formats C-1
Dual Channel Measurements 2-32
Frequency Display Disable/Enable 2-45
General 2-1
Graph Mode 2-13
High Power Measurements 2-37
Installation 2-1
Measurement Procedures 2-16
Memory features 2-45
MEMory Key Displays B-3
Menu and Memory Keys B-1
MENU Key Displays B-1
Mode Selection 2-11
Non-Volatile Memory 2-45
Normal 8500A functions B-1
Peak mode 2-11
Power-on self-test 2-10
RF Detectors D-1
Self-Calibration and Auto-Zeroing 2-14
Self-Testing the 8500A 2-44
Special Capabilities of the PPM 2-40
Summary of Commands A-1
Swept Peak Power Measurements 2-42
Voltage selector and fuse holder (PCB) 2-3
Voltage selector and fuse holder (VDE) 2-4
Warm Up time and temperature 2-10
Options E-1
Series 8500A Peak Power Meters
Index-4 Manual No. 20790, Rev C, November 1998
Superceded by Revision D, March 2009

Output data modes 3-38
Output format 3-38
Output modes 3-4
Plot output mode 3-8
Stand alone plot output mode 3-10
Status byte 3-10
Temperature difference output mode 3-10
Update data continuously output mode 3-7
Update trigger reset output mode 3-5
Output status byte information command 3-16
Over and under range 3-40
P
Parts Lists 7-1
Peak mode 2-11
External triggering 2-12
Internal triggering 2-12
Peak Mode Commands A-3
Peak power commands 3-21
Peak power measurement 2-19
Autoscaling procedure 2-19
Autoscaling procedure, external trigger 2-20
Peak power measurements (Graph mode) 2-23
Peak, CW measurements 2-34
Peak, peak measurements (method 1) 2-32
Peak, peak measurements (method 2) 2-33
Periodic Maintenance 6-1
Required test equipment 6-2
Plot output mode 3-8
Plotter output/IEEE-488 interface 5-7
Plotters supported 2-30
Plotting commands 3-34
Power limits 3-16
Power linearity test setup 5-4
Power measurement data output format 3-12
Linear power data format 3-13
Log (dBm) data format 3-12
Power ratio measurements 2-35
Ratio’ing Peak to CW signals 2-36
Ratio’ing two CW signals 2-35
Ratio’ing two Peak signals 2-35
Power supply PC assembly (A2) 4-3
A2 Test points 4-3
Power warning - max/min power limits 2-37
Power-On condition 3-3
Power-On failure 6-3
Self-test failure indications and possible causes 6-4
Power-on self-test 2-10
PPM IEEE bus functions 3-2
PPM stand alone plot operation 3-43
Procedure for making plots 2-30
Programming notes 3-35
PROM frequency correction 2-16
External frequency 2-16
User-supplied frequency 2-16
Pulse parameters sub-mode functions 2-26
Pulse rise time, width, and fall time 2-26
Pulse rise time, width, and fall time 2-26
Pulse shaper 4-18
Pulse sub-mode commands A-5
Pulse, cursor, and marker readouts 2-23
R
Ramp control logic 4-18
Ramp generator 4-17
range conditions
Over and under range 3-40
Ratioing Peak to CW signals 2-36
Ratioing two CW signals 2-35
Ratioing two Peak signals 2-35
Reading and defining pulse parameters 3-25
Real time clock 4-10
Rear Panel Description 2-5
Recall setup 2-45
Receiving inspection 1-2
Reference delay 2-40
Reference delay, correction of carrier frequency, and
offset vs 1018B direct mode 3-39
Reference Power 2-25
Reference power related commands 3-27
Related peak power commands 3-22
Remote and local lockout functions 3-4
Remote Operating Modes 3-2
Command string format 3-12
Front panel menus 3-3
Output modes 3-4
Power measurement data output format 3-12
Power-On condition 3-3
PPM IEEE bus functions 3-2
Remote and local lockout functions 3-4
Remote Operation 3-1
1018B Emulation 3-38
1018B Emulation Commands 3-38, 3-52
Data Formats 3-52
GPIB Command Descriptions 3-14
GPIB Command Summary 3-44
Remote Operating Modes 3-2
Service Requests 3-36
Index
Manual No. 20790, Rev C, November 1998 Index-5Superceded by Revision D, March 2009

Summary of Bus Functions 3-41
Remote Operation •% 3-41
Remote state 3-39
Required test equipment 6-2
Reset timer 4-10
Returning an Instrument 1-3
S
Safety
Voltage selector and fuse holder (PCB) 2-3
Sample comparator 4-17
Select Log or Linear power measurement format
commands 3-21
Select measurement mode commands 3-21
Selecting the Graph mode 2-13
Self-Calibration and Auto-Zeroing 2-14
Auto-Zero function 2-15
Self-Calibration failures 2-15
Self-Calibration Procedure 2-14
Self-Calibration failures 2-15
Self-Calibration Procedure 2-14
Self-test failure indications and possible causes 6-4
Self-Testing the 8500A 2-44
Serial poll 3-39
Series 8500A Peak Power Meters
Calibration and Testing 5-1
Cleaning 1-2
Cooling 1-2
Default Settings 1-7
Description 1-1
Environmental requirements 1-2
Front Panel Operation 2-1
Installation 2-1
Introduction 1-1
Items furnished 1-2
Items required 1-2
Maintenance 6-1
Measurement Procedures 2-16
Operation 2-1, 2-10
Options E-1
Parts Lists 7-1
Receiving inspection 1-2
Remote Operation 3-1
Returning an Instrument 1-3
RF Detectors D-1
Summary of Commands A-1
System Description 4-1
System Specifications 1-4
Theory of Operation 4-1
Troubleshooting 6-3
Service Requests 3-36
Error conditions 3-37
Single pulse measurement using external trigger 2-41
Single pulse measurement using internal trigger 2-40
Single pulse measurements 2-40
Special Capabilities of the PPM 2-40
Reference delay 2-40
SRQ related commands 3-16
Stand alone plot output mode 3-10
Start delay 2-24
Status byte 3-10
Status Code Decimal Values 3-41
Store or recall setup commands 3-15
Store setup 2-45
Summary of Bus Functions
Normal PPM operation 3-43
PPM stand alone plot operation 3-43
Summary of Commands A-1
Commands Applicable to All Modes A-1
CW Mode Commands A-3
Dual Channel Operation A-6
Graph Mode Commands A-4
IEEE & 1018B emulation commands A-6
Peak Mode Commands A-3
Swept Peak Power Measurements 2-42
System Description 4-1
Analog PC assembly (A6/A7) 4-20
Calibrator PC assembly (A12) 4-27
CPU PC assembly (A4) 4-8
Digital delay PC assembly (A5) 4-12
Front panel interface PC assembly (A8) 4-24
GPIB/CAL control PC board (A3) 4-4
Power supply PC assembly (A2) 4-3
System Specifications 1-4
Auxiliary inputs/outputs 1-5
Calibrator specifications 1-5
Default Settings 1-7
General 1-6
Remote operation 1-5
T
Temperature difference output mode 3-10
Temperature difference since last calibration
commands 3-15
Test points
A2 Test points 4-3
A3 Test points 4-7
A4 Test Points 4-11
Series 8500A Peak Power Meters
Index-6 Manual No. 20790, Rev C, November 1998
Superceded by Revision D, March 2009

A5 Test points 4-19
A6/A7 Test points 4-23
A8 Test points 4-26
The microprocessor 4-9
Theory of Operation 4-1
Analog PC assembly (A6/A7) 4-20
Calibrator PC assembly (A12) 4-27
CPU PC assembly (A4) 4-8
Digital delay PC assembly (A5) 4-12
Front panel interface PC assembly (A8) 4-24
GPIB/CAL control PC board (A3) 4-4
Power supply PC assembly (A2) 4-3
System Description 4-1
Tools and test equipment also Series 8500A Peak
Power Meters 1-2
Trig pulse stretcher 4-16
Trig select 4-15
Trig threshold 4-15
Trigger 2-25
Troubleshooting 6-3
Equipment required 6-3
Power-On failure 6-3
Self-test failure indications and possible causes 6-4
Two detectors 3-39
U
Unbuffered memory 4-10
Update data continuously output mode 3-7
Update trigger reset output mode 3-5
User-defined detector calibration factor
commands 3-20
User-supplied cal factor 2-17
Offset 2-17
User-supplied frequency 2-16
V
Voltage hold 4-17
Voltage proportional to frequency test 5-7
Voltage selector
Voltage selector and fuse holder (VDE) 2-4
Voltage selector and fuse holder (PCB) 2-3
Voltage selector and fuse holder (VDE) 2-4
Volume adjust 5-20
W
Warm Up time and temperature 2-10
Window and cursor control commands 3-31
Z
Zero to 25.5 ns delay 4-18
Index
Manual No. 20790, Rev C, November 1998 Index-7Superceded by Revision D, March 2009

Series 8500A Peak Power Meters
Index-8 Manual No. 20790, Rev C, November 1998
Superceded by Revision D, March 2009