series c investment presentation - genomatica · genomatica sustainable chemicals bioprocess...
TRANSCRIPT

GenomaticaSustainable ChemicalsGenomaticaSustainable Chemicals
Bioprocess design, development, and scale-up:
lessons from the industry
Jeff LievenseSenior Engineering Fellow
BSDL Advanced Course Bioprocess DesignApril 21, 2016

Outline
• Three critical lessons– Lesson A – Begin with the end in mind!
– Lesson B – It’s all about feedstock!
– Lesson C – Under-promise, over-deliver!
• 19 more lessons
• Additional reference material
These slides available to all requesters via [email protected]
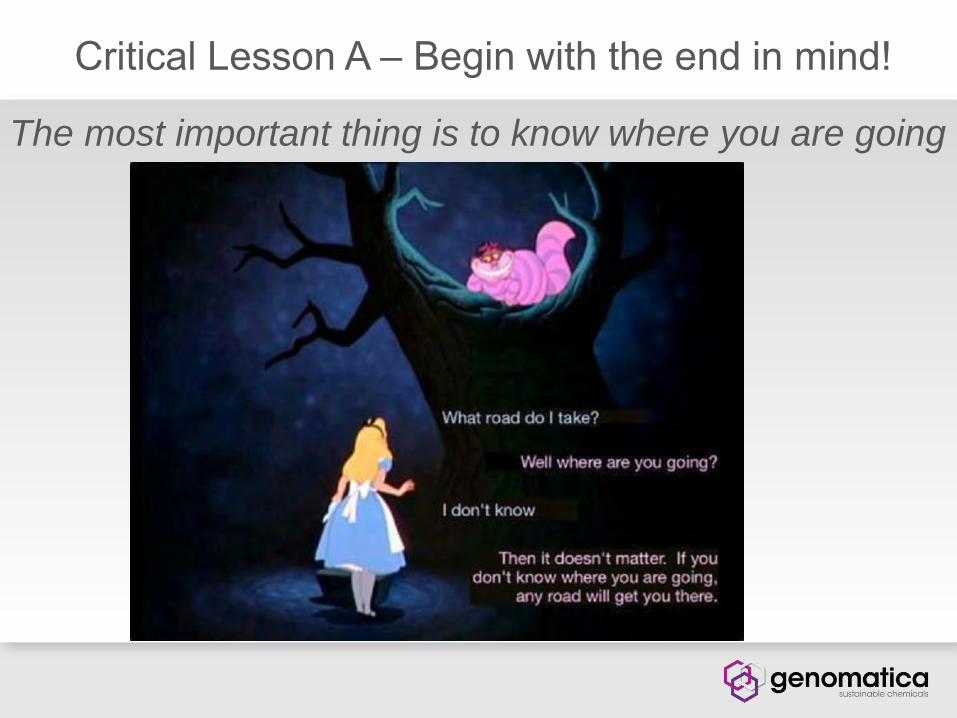
Critical Lesson A – Begin with the end in mind!
The most important thing is to know where you are going

Bioprocess design, development, and scale-UpBegin with the end in mind!
Making Designs WorkConceptual design first & iterativeReactant/product propertiesProduct specificationsMicrobe for purposeSafety considerationsRegulatory constraintsManufacturing vs lab raw materialsLarge vs small scale environmentMicrobial contaminationRecycle streamsWastes (gas, liquid, solid)FoulingCorrosionOther equipment materials (seals)

Framework for bioprocess developmentBegin with the end in mind!
Gate from Proof-of-Concept to Bioprocess Development: The following is compiled for cross-functional review, planning and approval prior to initiating process development.
1) Proof-of-concept data (process, product, environment, health, safety)2) Process flow diagram for the proposed process including recycle and/or purge3) Brief description of how the process would operate at lab, pilot and full
manufacturing scale4) Key raw materials, quality, quantity, pricing5) Material and energy balances with associated assumptions6) Estimate of production costs (capital, operating) vs target costs vs competitors7) Comparison of product composition to product specification8) Identification of any regulatory and EH&S related issues9) Initial assessment of project risks and mitigations

Roadmap for bioprocess developmentLet product cost and quality be your guide!
1. Conceptual process modela. Blueprint for development of target process and options to meet commercial objectivesb. Material and energy balances (including process wastes)c. Visualize translation to large-scale industrial unit operations, including EH&S considerationsd. Provides indicative capital and operating costs and sensitivitiese. Iteratively updated throughout the projecte. Yardstick for measuring ongoing progress (absolute and against competition)f. Key tool for guiding bioprocess development
2. Raw materialsa. Source controlled and characterized for process development and scale-upb. Test impact of variation on process performance and product qualityc. Availability, costs, quality and EH&S considerations for full-scale production verified
3. End producta. Physical and chemical propertiesb. Defined product specifications, associated assay methods, and MSDSc. Identified impurities and significance of eachd. Storage conditions, stability and EH&S considerationse. Customer validation, customer acceptance and regulatory approval requirementsf. Benchmarked against competing products (e.g., if replacement product)
4. Lab-scale processa. Defined, documented, repeatable stepsb. Data provide basis for scaling up and iterative cost modelingc. Source of small-scale product samples for early evaluation against commercial objectivesd. Scale parameters identified, sensitivities understood, and risks (gaps/uncertainties) flaggede. Environment, health and safety risks assessed, and safety reviews completedf. Serves as an ongoing resource (people, equipment, analytics) for testing/optimizing process parameters and for troubleshooting large-scale technical issues
5. Scaling upa. Process definition derived from conceptual model and lab-scale process datab. Translation of lab-scale protocol to larger-scale protocol with main scale parameters identifiedc. Train larger-scale operating team on lab-scale process firstd. Environment, health and safety risks assessed and safety reviews completede. Validate tech transfer (including raw materials) at lab-scale before proceeding to larger scalef. Run at lab-scale in parallel with larger-scale to generate valuable data for troubleshooting scale-up deviations (if any)
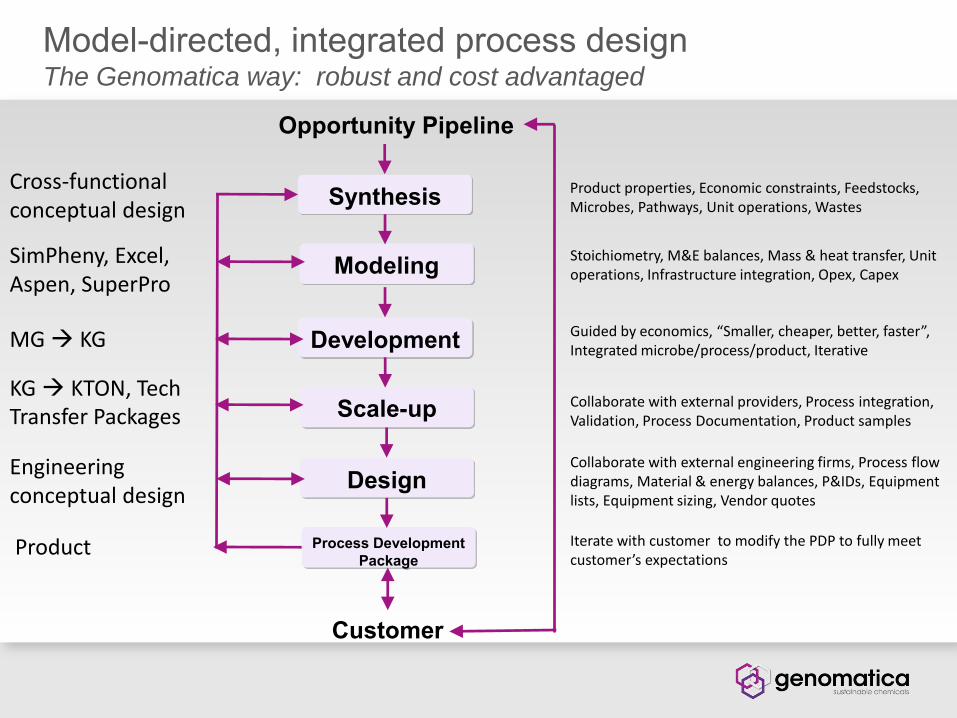
Model-directed, integrated process designThe Genomatica way: robust and cost advantaged
Synthesis
Modeling
Opportunity Pipeline
Development
Scale-up
Design
Process Development Package
Customer
Cross-functional conceptual design
SimPheny, Excel, Aspen, SuperPro
MG KG
KG KTON, Tech Transfer Packages
Engineering conceptual design
Product
Product properties, Economic constraints, Feedstocks, Microbes, Pathways, Unit operations, Wastes
Stoichiometry, M&E balances, Mass & heat transfer, Unit operations, Infrastructure integration, Opex, Capex
Guided by economics, “Smaller, cheaper, better, faster”, Integrated microbe/process/product, Iterative
Collaborate with external providers, Process integration, Validation, Process Documentation, Product samples
Collaborate with external engineering firms, Process flow diagrams, Material & energy balances, P&IDs, Equipment lists, Equipment sizing, Vendor quotes
Iterate with customer to modify the PDP to fully meet customer’s expectations
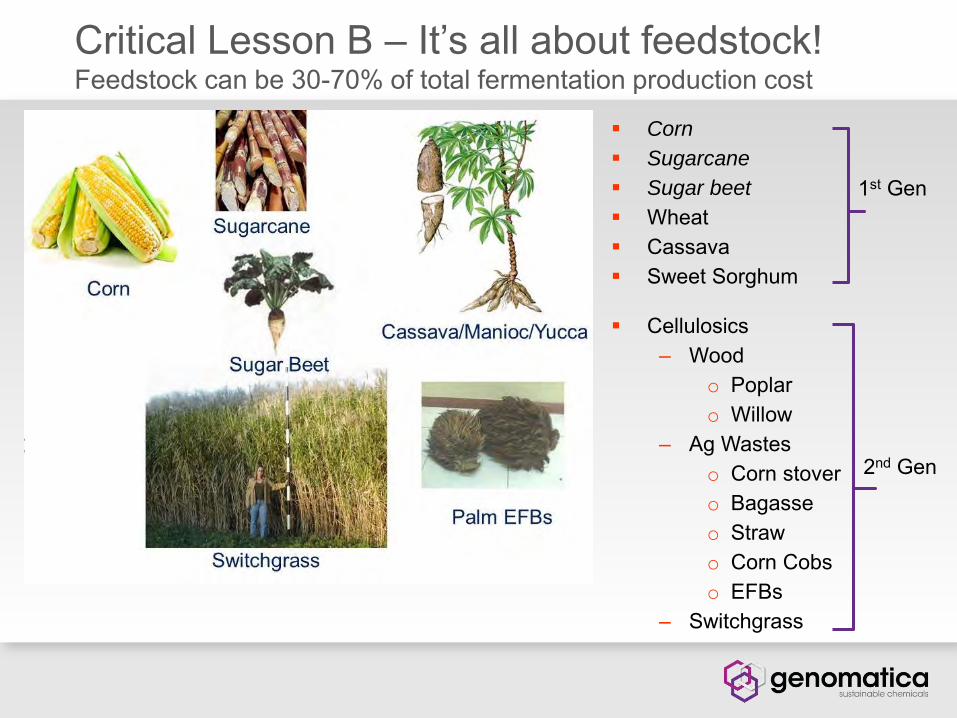
Critical Lesson B – It’s all about feedstock!Feedstock can be 30-70% of total fermentation production cost
8
Corn
Sugarcane
Sugar beet
Wheat Cassava Sweet Sorghum
Cellulosics– Wood
o Poplaro Willow
– Ag Wasteso Corn stovero Bagasseo Strawo Corn Cobso EFBs
– Switchgrass
1st Gen
2nd Gen

Critical Lesson B – It’s all about feedstock!US corn and raw sugar (NY No. 11) are international benchmarks
• Raw sugar is stored, traded internationally Main exporter is Brazil, ~US$300/ton dry basis [max US$600] 96% sucrose (few impurities) Unrefined concentrated cane juice is cheaper but carries
impurities and only available during the harvesting season
• US corn is stored, traded in US$/bushel Industrial glucose is a refined syrup 71% solids, ~97.5%
fermentable sugars Glucose cost is (corn price) – (co-product value) + (refining
fee) ~US$300/ton dry basis [max US$450] Unrefined starch slurry is cheaper but carries impurities

Critical Lesson C – Under-promise, over-deliver!Process design defines the cost side of economic success, be realistic

Over-promising puts you in the “penalty box”Gevo, Inc share price (11 Feb 2011 – 06 Apr 2015): US$20 ↓ US$0.20 per share (*)
IPO, US$373 mil valuationTarget 1.3 bil liters IBA, 2015
“Successful start-up” of Luverne plant with 4 mil liters/mo by Dec 2013
US$21 mil valuation, Luverne plant produced 0.4 mil liters in Dec 2014
IBA production put on hold, microbial contam
Patent dispute with Butamax
Infection overcome, other plant improvements needed
Share Price
(*) June 2015, $3.50/sh following reverse 15:1 split.
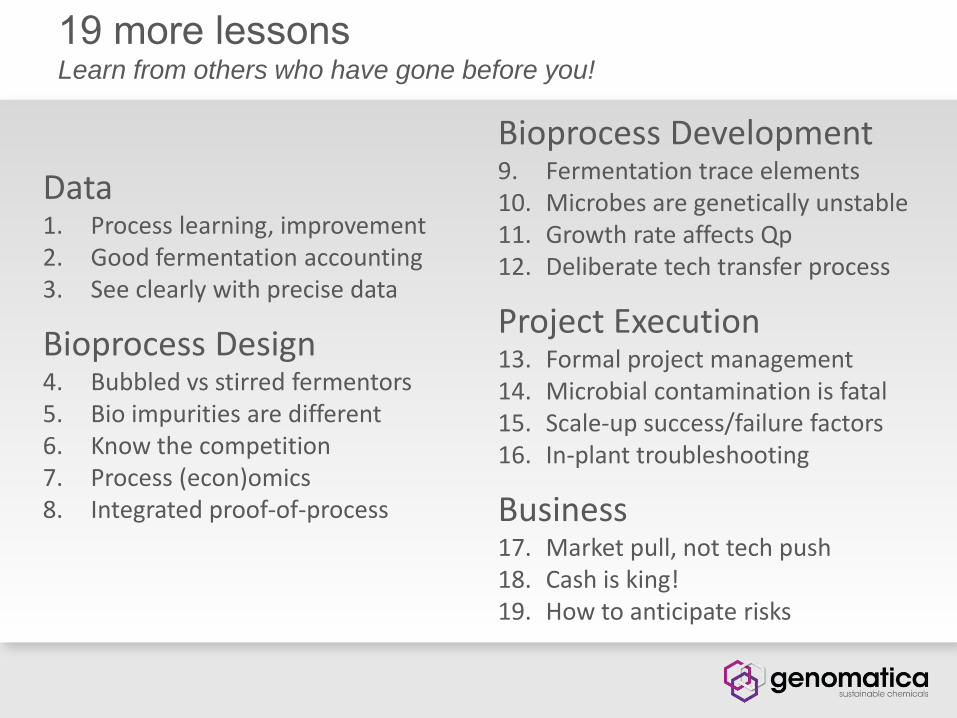
19 more lessonsLearn from others who have gone before you!
Data1. Process learning, improvement2. Good fermentation accounting3. See clearly with precise data
Bioprocess Design4. Bubbled vs stirred fermentors5. Bio impurities are different6. Know the competition7. Process (econ)omics8. Integrated proof-of-process
Bioprocess Development9. Fermentation trace elements10. Microbes are genetically unstable11. Growth rate affects Qp12. Deliberate tech transfer process
Project Execution13. Formal project management14. Microbial contamination is fatal15. Scale-up success/failure factors16. In-plant troubleshooting
Business17. Market pull, not tech push18. Cash is king!19. How to anticipate risks

Lesson 1 – Use trend charts, scatter plots for process learning and continuous improvement.Citric acid fermentation example • One manufacturing plant generates 1500 fermentation batches per year
Many parameters measured and data stored Key metrics are yield and rate with stdev ~ 3% for each
• Use trend charts to visualize data through calendar time for insights• Talk to manufacturing plant staff (engineers, operators, lab techs)

Lesson 1 – Use trend charts, scatter plots for process learning and continuous improvement.Use scatter plots to identify +/- outliersCompare and contrastTalk to manufacturing plant staff
Analysis reveals effects of:• Measurement errors• Operational errors• Process deviations
improvement

Lesson 1a – Use best practices benchmarking for process learning and continuous improvement.
10 Steps of Benchmarking1. Determine processes to be benchmarked.2. Determine organizations to be benchmarked.3. Gather data.4. Locate deficiencies.5. Determine future trends.6. Reveal results and sell the process.7. Achieve consensus on revised goals.8. Establish procedures.9. Implement procedures and monitor results.10. Recalibrate benchmarks.
Citric acid manufacturing example• 5 manufacturing plants• Citric acid production costs vary• Lots of plant-to-plant differences• Rigorous benchmarking (hard part)• Identify, implement best practices• Electricity consumption in
fermentation (kwh/ton)• Extracellular protein
Benchmarking: objectively compare processes based on measured, quantitative metrics.
Best practices: processes that yield superior performance.

Lesson 2 – Be a diligent fermentation accountant. Close material and electron balances for accurate stoichiometry.
Case C-bal N-bal E-bal Issue1 80% 100% 80% Measurement error and/or missing c-products2 100% 100% 80% Measurement error and missing c-products3 100% 80% 100% N-source measurement error and/or NH3 loss to offgas4 80% 80% 80% Measurement error and/or missing c-, n-products5 125% 100% 125% C-source measurement error6 125% 125% 125% Measurement errors!!!
What is a good (great) balance?• 95-105% (98-102%)• Consistent at each fermentation time
Why are balances important?• Verifies data quality
o At 100%, nothing is missingo At 100%, no measurement errors
• Enable rigorous, accurate stoichiometric equations• Solving poor balances yields measurement, process insights

Lesson 2 – Be a diligent fermentation accountant. Close material and electron balances for accurate stoichiometry.

Lesson 3 – High precision, low noise enables more effective (efficient, fast) experimentation.
+3ơ
+3ơ
+3ơ
+1ơ
-3ơ
-3ơ
-3ơ
-1ơ
“20/50 vision”Typical
(3ơ +/-15%)
“20/15 vision”Advantaged(3ơ +/- 3%)
“20/20 vision”Good
(3ơ +/- 6%)
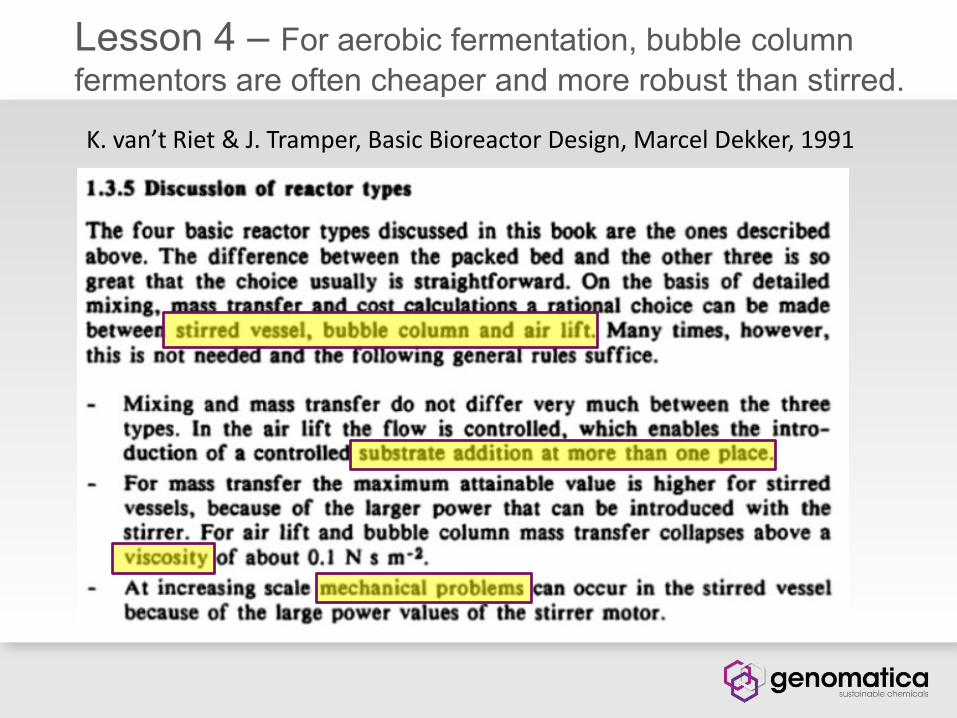
Lesson 4 – For aerobic fermentation, bubble column fermentors are often cheaper and more robust than stirred.
K. van’t Riet & J. Tramper, Basic Bioreactor Design, Marcel Dekker, 1991

Lesson 4 – For aerobic fermentation, bubble column fermentors are often cheaper and more robust than stirred.
K. van’t Riet & J. Tramper, Basic Bioreactor Design, Marcel Dekker, 1991
EVEN BIGGER!
(1000+ m3)
ONLY IF NEEDED
XANTHAN GUM
EXCEPTION
**
** No moving parts. Less structural steel. Low maintenance. Easy to clean. Energy efficient oxygen transfer @high L/D. Maximum volume is practically unlimited (> 1000 m3). Heat removal can be accomplished without internal cooling coils.
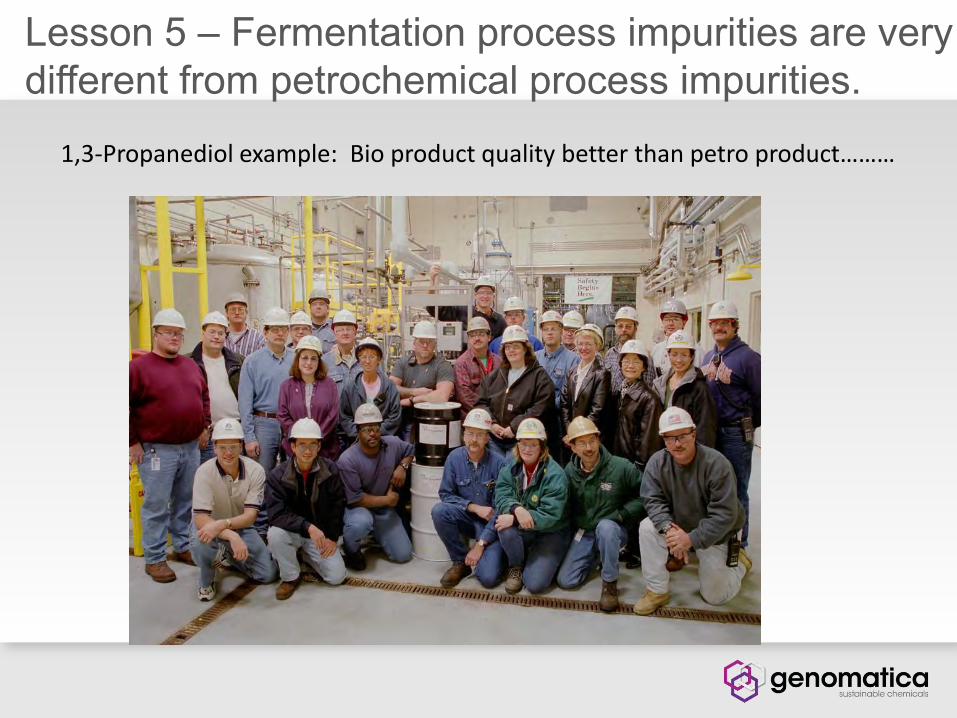
Lesson 5 – Fermentation process impurities are very different from petrochemical process impurities.
1,3-Propanediol example: Bio product quality better than petro product………

Lesson 5 – Fermentation process impurities are very different from petrochemical process impurities.
…but it took awhile to get there: hundreds of unique color-forming impurities at ppb levels that the petro polymer experts had never seen before!
PDO, area %Specification = 99.95
99.97
99.975
99.98
99.985
99.99
99.995
100
12/6
1100
12/6
2000
12/7
0300
12/7
1500
12/7 17
00
12/8
0300
2/8 050
0
12/8
1400
12/8
2300
12/9
1000
12/9
1400
12/9
2200
12/10
0400
12/10
1000
12/10
1155
12/10
2100
12/11
1000
12/11
2200
12/12
845
run time
PDO
are
a %
start MZ21208
Start MZ21210
Key Impurity MeasureSpecification = 0.08
0
0.002
0.004
0.006
0.008
0.01
0.012
0.014
0.016
12/6
1100
12/6
2000
12/7
0300
12/7
1500
12/7 17
00
12/8
0300
2/8 050
0
12/8
1400
12/8
2300
12/9
1000
12/9
1400
12/9
2200
12/10
0400
12/10
1000
12/10
1155
12/10
2100
12/11
1000
12/11
2200
12/12
845
run time
start MZ21208
Start MZ21210
SUGAR CHEMISTRY
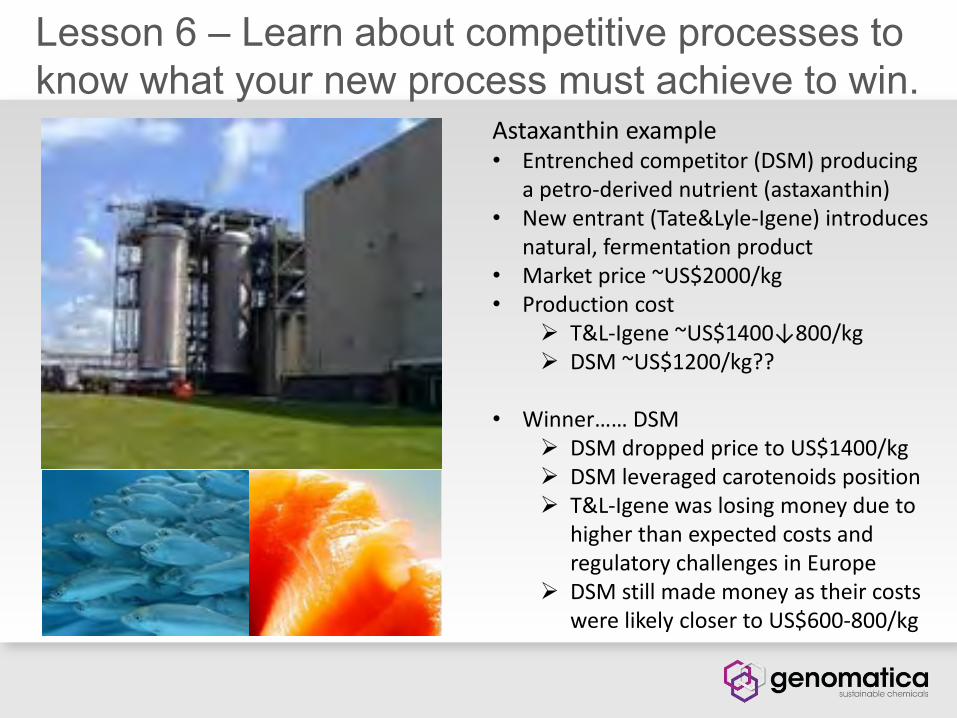
Lesson 6 – Learn about competitive processes to know what your new process must achieve to win.
Astaxanthin example• Entrenched competitor (DSM) producing
a petro-derived nutrient (astaxanthin)• New entrant (Tate&Lyle-Igene) introduces
natural, fermentation product • Market price ~US$2000/kg• Production cost
T&L-Igene ~US$1400↓800/kg DSM ~US$1200/kg??
• Winner…… DSM DSM dropped price to US$1400/kg DSM leveraged carotenoids position T&L-Igene was losing money due to
higher than expected costs and regulatory challenges in Europe
DSM still made money as their costs were likely closer to US$600-800/kg
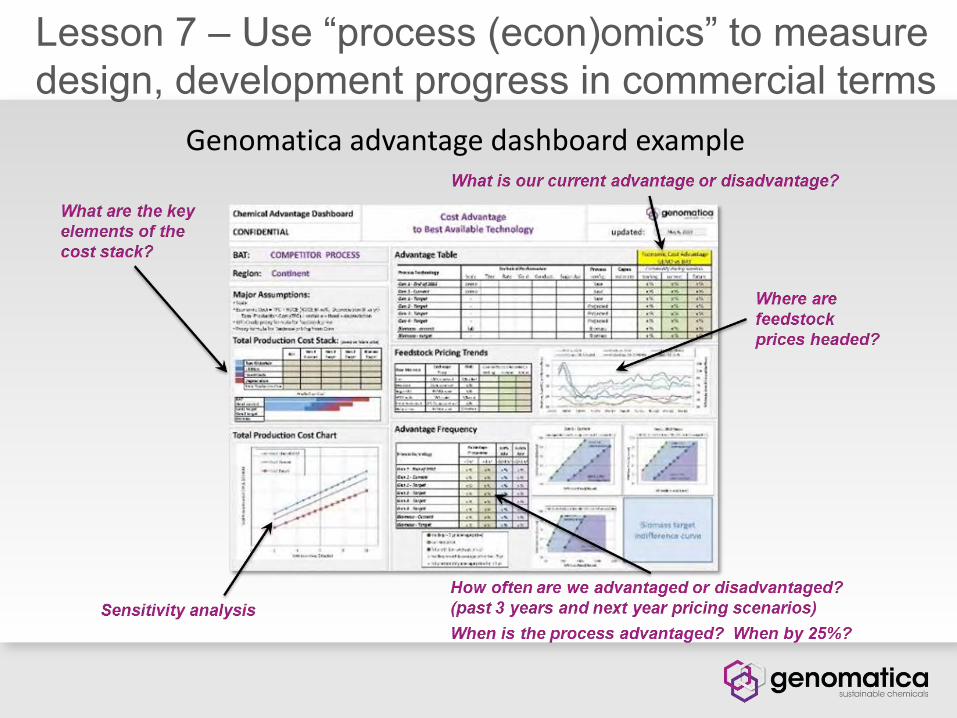
Lesson 7 – Use “process (econ)omics” to measure design, development progress in commercial terms
Genomatica advantage dashboard example

Lesson 8 – Use rigorously obtained data from integrated piloting as the basis for full-scale design.
1,3-propanediol proof-of-process example
??

Lesson 8 – Use rigorously obtained data from integrated piloting as the basis for full-scale design.
1,3-propanediol proof-of-process (POP) example
• Achieved commercial targets for process performance based on TEA
• Locked down the process conditions (fixed SOP)• Operated 10 batches as an integrated pilot-scale
process (13,000-liter fermentor)• Validated the product in end-use (fiber-grade)• Use POP data as design basis for full-scale plant

Lesson 9 – Measure and assess the effects of all fermentation nutrients, not just C, N-sources.
Creatininase fermentation example• 1st lesson in trace elements• High value diagnostic enzyme• Initially, batch with low cell density• 5X increase in enzyme production
(↑ U/L = ↑g dw/L x ↑U/g dw) in fed-batch mode under N-limitation
• But further increases in cell mass did not increase c’ase U/L at all – why?
• C’ase requires iron as a co-factor• Further 2X increase in c’ase with more
iron (total 10X ↑)creatinine + H2O → N-methylhydantoin + NH3

Lesson 10 – Efficient production microbes are almost always genetically unstable.(*)
Several examples• Colony heterogeneity – E. coli, S. cerevisiae, A. niger• Plasmid rearrangement – E. coli• Chromosomal rearrangement – E. coli
• Why? metabolic burden creates growth disadvantage Carbon/energy diversion Protein over-expression Toxic intermediates
• How to measure? Serial transfers (~100 generations) Performance in fermentors Genetic sequencing
• How to mitigate? Mother cultures Growth in low production condition Rigorous validation of starter vials
* Unless growth is strictly dependent on product formation.

Lesson 11 – Product specific rates are often dependent on specific growth rate.
Lysine example• Fermentation used soy hydrolysate to
satisfy amino acid auxotrophies (met, thr) Complex (variable) raw material Added to recovery cost
• Idea – Substitute methionine and threonine in defined amounts Consistent medium Lower recovery cost
• Cells grew slower and lysine production was reduced in synthetic medium
• Qp during production phase dependent on mu during growth phase!
Mainly growth Mainly lysine

Lesson 12 – To be successful in technology transfer (“no surprises”), follow this deliberate process.
WE THEY
OUR PLACE
“They” saw how “We” did it
“They” believe that it works
THEIR PLACE
“We” saw how “They” repeated it
“We” and “They” know it works at
their place
• Shared responsibility (hand-offs)• Detailed written protocols (verbal)• People move between sites (fortresses)• Expect problems – prepare to troubleshoot (assume success)• Seamless transfer – over-prepared; boring is good! (shortcuts, drama)
Strong Collaboration!
WE THEY
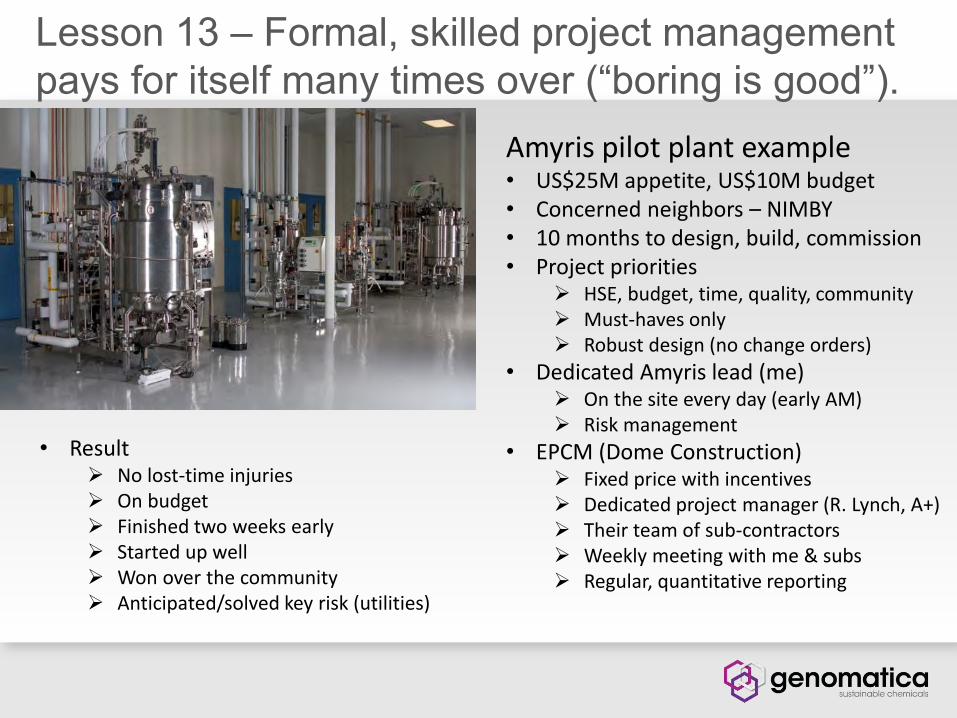
Lesson 13 – Formal, skilled project management pays for itself many times over (“boring is good”).
Amyris pilot plant example• US$25M appetite, US$10M budget• Concerned neighbors – NIMBY • 10 months to design, build, commission• Project priorities
HSE, budget, time, quality, community Must-haves only Robust design (no change orders)
• Dedicated Amyris lead (me) On the site every day (early AM) Risk management
• EPCM (Dome Construction) Fixed price with incentives Dedicated project manager (R. Lynch, A+) Their team of sub-contractors Weekly meeting with me & subs Regular, quantitative reporting
• Result No lost-time injuries On budget Finished two weeks early Started up well Won over the community Anticipated/solved key risk (utilities)

Lesson 14 – Microbial contamination cannot be tolerated in most fermentation processes. It is costly – even fatal.
Gevo (18 June 2013 press release)“While Gevo was able to overcome those infections, the company also identified a need to address equipment improvements. ‘That is done best without the plant fully running,’ Gruber said, noting that contamination in new
plants is completely normal and expected.”
Seeking Alpha: Contamination Concerns (19 February 2014)Often associated with a niche group of advanced biofuel producers and other synthetic biology companies, Solazyme has often been affected by the scaling woes of its "peers." The technology scale-up concerns that have affected Amyris (AMRS), Gevo (GEVO), and KiOR (KIOR) have often been wrongly associated with Solazyme's platform. Yet while KiOR doesn't even utilize a fermentation process, Amyris and Gevo do. However, it also remains an oversimplification to believe that the yeast used by Amyris or Gevo adequately compares to the algae used by Solazyme. The contamination issues that were to blame for the scaling failures of these two companies do not appear to be a problem for Solazyme's process.
On my last visit to Solazyme’s headquarters in January, I managed to speak with Solazyme's CTO, Peter Licari. When I asked him about the concern over contamination, he assured me that the platform has proven itself to be quite stable and consistent. He stated that contaminant growth typically remains at a very minimal level due to the low-pH
level and lack of nitrogen used throughout most of the process. Even if a run had to be stopped for whatever reason, it might still be able to produce about 70% or so of the oil otherwise expected.
NORMAL - NO!!!COSTLY – YES!!!
NOT ENOUGH!!!
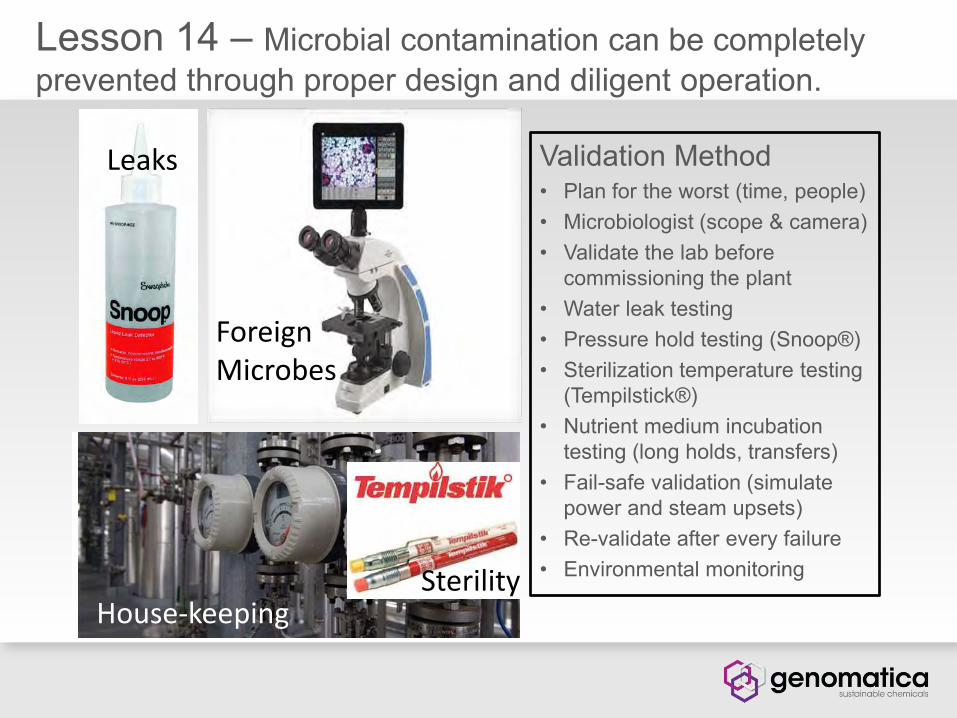
Lesson 14 – Microbial contamination can be completely prevented through proper design and diligent operation.
Validation Method• Plan for the worst (time, people)• Microbiologist (scope & camera)• Validate the lab before
commissioning the plant• Water leak testing• Pressure hold testing (Snoop®)• Sterilization temperature testing
(Tempilstick®)• Nutrient medium incubation
testing (long holds, transfers)• Fail-safe validation (simulate
power and steam upsets)• Re-validate after every failure• Environmental monitoring
Leaks
Foreign Microbes
House-keepingSterility

Lesson 15 – Successful scale-up is in the details.
Not this…….
This!! Strive for perfection by:• process development• plant design• construction• utilities• operation• maintenance
1985 Yugo GV
2014 Tesla Model S2014 Honda Fit
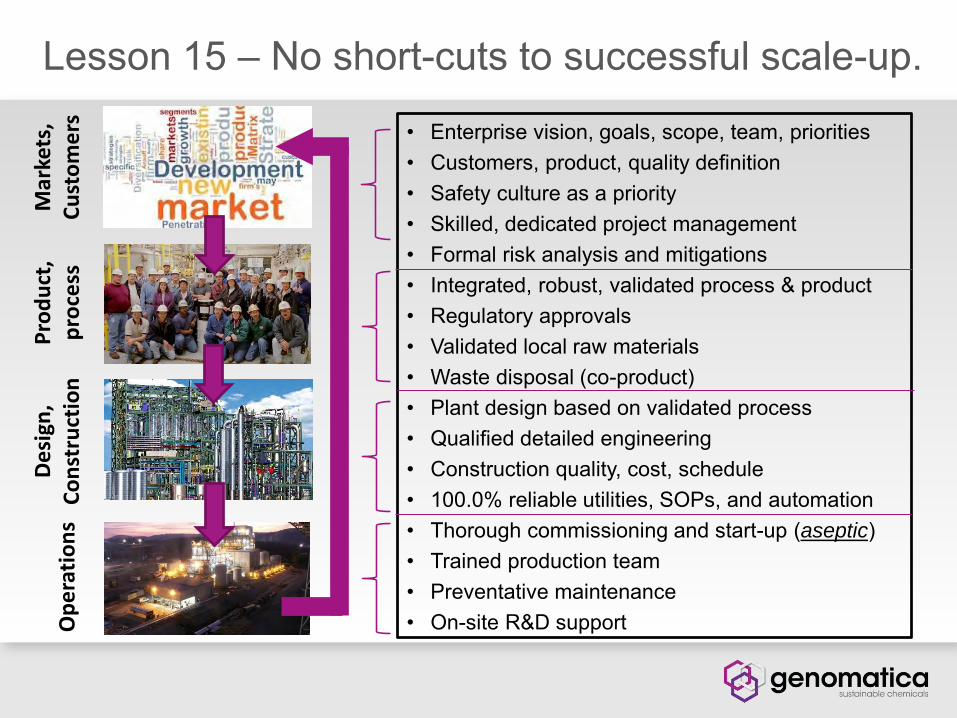
Lesson 15 – No short-cuts to successful scale-up.
• Enterprise vision, goals, scope, team, priorities• Customers, product, quality definition• Safety culture as a priority• Skilled, dedicated project management• Formal risk analysis and mitigations• Integrated, robust, validated process & product• Regulatory approvals• Validated local raw materials• Waste disposal (co-product)• Plant design based on validated process• Qualified detailed engineering• Construction quality, cost, schedule• 100.0% reliable utilities, SOPs, and automation• Thorough commissioning and start-up (aseptic)• Trained production team• Preventative maintenance• On-site R&D support
Pro
du
ct,
pro
cess
De
sign
, C
on
stru
ctio
nO
pe
rati
on
sM
arke
ts,
Cu
sto
me
rs

Lesson 15 – Where scale-up can go wrong.Recipe for Failure• Demand seriously lags production• Product quality is not robust (cost pressure)• Safety is an after-thought• Process not robust and/or representative at
small scale• Regulatory is an after-thought• Raw material surprises• Heavy process waste loads• Parallel plant design and process development• Inexperienced, disconnected design team• Poor construction project management• Unreliable utilities• Short-cuts in commissioning and start-up• Inexperienced production team• Contamination by foreign microbes• No on-site R&D support
Learning the Hard WayMinor (few months disruption)• Automation and human errors• Part-time project manager• SOPs written during start-upSerious (>6 mo, large losses)• Project manager new to ferment’n• Unreliable utilities, deficient PM• Mothballed plant, deficient SOPs• Silo mentalityFatal (> 1 yr, plant closed)• Flawed utilities, no maintenance• Inadequate aseptic design• Compressed schedule, rushed
commissioning, unreliable utilities

Lesson 16 – It is essential to have lab-scale process equipment in the plant for troubleshooting.
Astaxanthin example or “Houston, we have a problem…”Astaxanthin product was successfully produced at a Mexico toll manufacturing plant for more than two years. Fermentation time is about 8-10 days, and yeast concentration reaches 70 g dry weight/L. Most cell growth occurs in the first 3 days and most astaxanthin accumulation (inside the cells) over the remaining days. Fermentations at the Mexico plant were generally consistent except for some variability in product concentration. In preparation for transferring technology to a larger plant in the U.K., the fermentation was replicated at a U.S. lab with somewhat better results than in Mexico, although again with variability in product concentration. Subsequent results at the U.K. plant were poor. Yeast growth was similar to the other sites, but astaxanthin concentration was much lower. U.K. results were confounded by frequent contamination of fermentor batches by foreign bacteria and/or yeasts. These contaminations usually developed after the primary growth phase of the Phaffia production yeast.
SiteFermentor
ScaleAstaxanthinBroth Conc
MicrobialContamination
Mexico 50,000L 450-550 mg/L No
U.S. 10L 500-700 mg/L No
U.K. 220,000L 100-300 mg/L Yes

Lesson 16 – It is essential to have lab-scale process equipment in the plant for troubleshooting.
• What could be wrong at the U.K. plant?
• How do we diagnose and solve the U.K. problem?
Possible Problems/Explanations• Bad starter cultures in the U.K.
• Contaminating microbes steal nutrients needed for astaxanthin biosynthesis and/or produce toxins
• Fermentor mixing differences
• Bad process water in the U.K.
• > 100 possible root causes…..
Corresponding Tests/SolutionsShipped to U.S. and validated
U.K. plant succeeded in reducing extent of contamination with a small improvement in production
Recruited expert to study mixing
Switched to RO water; production actually got worse
Test them all???

Lesson 16 – It is essential to have lab-scale process equipment in the plant for troubleshooting.
Satellite lab fermentors for solving scale-up surprises

Lesson 17 – Take care in choosing products based on exciting technology (“technology push”).
Indigo example• Sexy product, denim dye, long history• Attractive selling price ~ US$10/kg• Nasty chemical process contrary to denim image• World’s 2nd synthetic (non-natural) pathway
Biosynthesis from sugars via tryptophan Metabolic engineering before it was defined
• But bio-indigo was never commercialized Reached par w/chemical Small market, fluctuated with fashion trends Technology ahead of its time
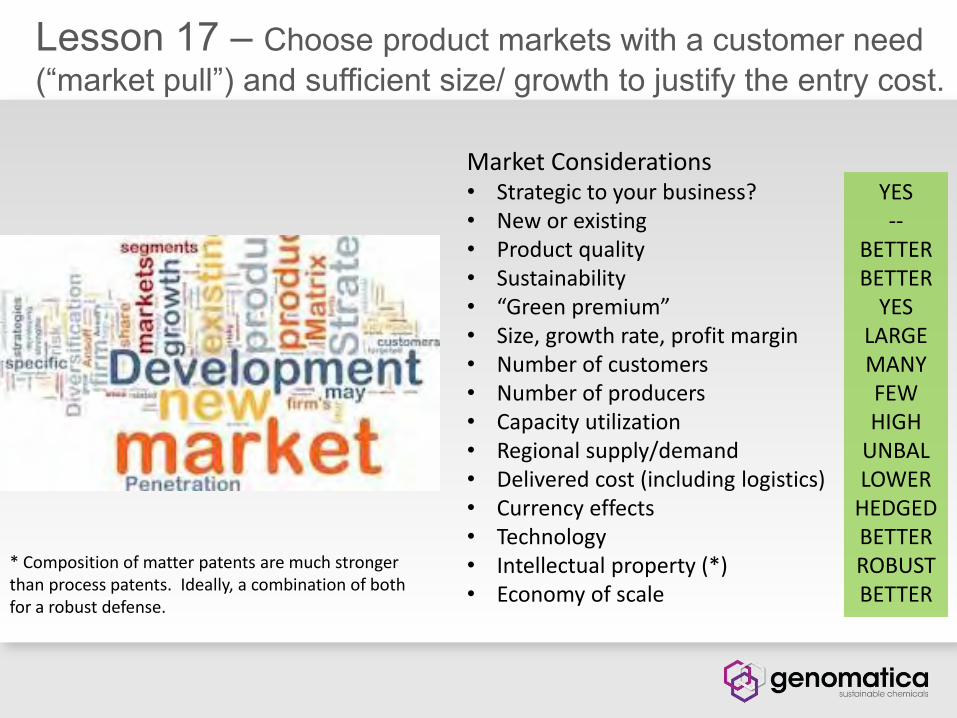
Lesson 17 – Choose product markets with a customer need (“market pull”) and sufficient size/ growth to justify the entry cost.
Market Considerations• Strategic to your business?• New or existing• Product quality• Sustainability• “Green premium”• Size, growth rate, profit margin• Number of customers• Number of producers• Capacity utilization• Regional supply/demand• Delivered cost (including logistics)• Currency effects• Technology• Intellectual property (*)• Economy of scale
YES--
BETTERBETTER
YESLARGEMANYFEWHIGH
UNBALLOWER
HEDGEDBETTERROBUSTBETTER
* Composition of matter patents are much stronger than process patents. Ideally, a combination of both for a robust defense.

Lesson 18 – Cash is King! You can lose lots of money, but you can never run out of cash.
• Operating Officer, Michigan Biotechnology Institute (1993-94)
• 100 people, US$10M/yr budget, not-for-profit• “Soft” (non-recurring) revenue (grants/contracts)• March 1993 – 3 months cash• April 1993 – “we have to let 20 people go” (10)• “Spandex budget” – every non-essential exposed • Diligent revenue forecasting - weekly updates with
rainmakers, discounted pipeline• November 1994 – 6 months cash

Lesson 19 – Formal risk management pays big dividends in identifying and mitigating business risks.
Tate & Lyle Splenda® sucralose example• High-intensity sweetener (1976)• Commercialized by J&J-T&L (1998)• High margin, high growth product• Single plant in Alabama (hurricane zone)• Second plant constructed in Singapore• Formal risk assessment – annual planning
Two-day process All key stakeholders across functions Brainstorm risks, all inputs, discuss
for understanding vs criticism Electronic (anonymous) voting Prioritize by likelihood x impact Brainstorm mitigation of top risks These become business goals with
projects assigned/defined• Risk management reduces the chances of
surprise – anticipation instead of reaction

Additional reference material
Successfully scaling up industrial fermentations of chemicals/fuels• 2014 BIO World Congress on Industrial Biotechnology (May 2014, Philadelphia)• http://www.biofuelsdigest.com/bdigest/2014/05/20/no-shortcuts-to-the-top-a-digest-
special-report-on-scale-up-in-industrial-biotechnology/• Breakout session panelists: Chuck Kraft (Amyris), Jeff Lievense (Genomatica), Marcel
Lubben (Reverdia), Mike Hess (Novozymes), John Evans (POET)
Tools for commercial bioprocess design & economic analysis• Metabolic Engineering X (June 2014, Vancouver)• Available for purchase (US$250) on line through AIChE• Workshop presenters: Sef Heijnen (TU Delft), Jeff Lievense (Genomatica), Alex Patist (Genomatica)
Technology Challenges and Opportunities in Commercializing Industrial Biotechnology• Society for Biological Engineering workshop (September 2015, San Diego)• http:/www3.aiche.org/proceedings/Conference.aspx?ConflD=CIB-2015• Workshop presenters: 35 presenters and exhibitors• Published in the June 2016 of Chemical Engineering Progress as a Special Supplement